 Kimberly Telfer-Radzat
- Department of Education, University of California, Irvine, Irvine, CA, United States
As the number of students enrolled in charter schools grows across the country, so do questions about their impact on academic outcomes (National Center for Educational Statistics). Given the importance of student test scores as evidence of success at the state, school, classroom, and teacher levels, understanding the effect of these charter schools' pedagogies on student outcomes is critical. Waldorf-inspired charter schools are one such growing alternative pedagogy. This study answers the question: Is there any significant difference between the levels of achievement for students in English Language Arts and math who are enrolled in Waldorf-inspired charter schools vs. those in either local public school classrooms or other charter classrooms that do not use the Waldorf pedagogy? Using OLS multiple linear regression this study examined the significance of the levels of achievement in English Language Arts (ELA) and math among students in 16 Waldorf-inspired charter schools and other charter and non-charter schools in California, using the California Assessment of Student Performance and Progress (CAASPP) scores. The research revealed that there are significantly higher percentages of eighth-grade students in Waldorf-inspired charter schools meeting or exceeding state standards in ELA and math as compared to their non-Waldorf charter school comparison groups, even when controlling for the size of the school, socioeconomic status, and district-level fixed effects (p < 0.01). This is despite the significantly smaller percentage of students in these schools meeting state standards in grades three through five. The results of this study suggest that Waldorf's developmental approach to education can result in strong academic outcomes despite a slower, low-stakes approach to teaching.
Introduction
The popularity of charter schools across the country has grown since their conception in 1991. Initially, they promised to improve lagging student test scores by harnessing competition to push schools to improve their teaching and learning (Fryer, 2012; Stein, 2015). Yet, even with 30 years of history behind the charter school experiment, there is no agreement among researchers regarding the success or failure of charter schools to improve academic outcomes for their students (Turner, 2015).
For example, a study from Texas used a value-added model and found that students' achievement gains in urban charters were higher in reading and mathematics than in non-charters (Grosskopf et al., 2009). In 2014, an analysis of charter schools across 14 states found that, on average, there were negative but not significant impacts on achievement in math and reading, and students' race or gender was not found to be a factor in outcomes (Clark et al., 2014). They did find that disadvantaged students tended to have either positive or insignificant outcomes, while advantaged students were significantly negatively affected, across all groups. A large study through the Center for Research on Educational Outcomes (CREDO) found small but significant positive effects on reading scores. However, they stated, “With a very large sample size, nearly any effect will be statistically significant, but in practical terms, these effects are so small as to be regarded, without hyperbole, as trivial” (McClelland and Maul, 2013, p.1). In a more recent 2021 report titled Charter Schools' Effectiveness, Mechanisms, and Competitive Influence the authors, using evidence from the CREDO study, stated that across the United States, charter school students tend to perform, on average, at about the same level as their district counterparts and that charters located in urban areas consistently have students whose test scores are boosted by charter enrollment, particularly for Black, Latinx, and low-income students (Cohodes and Parham, 2021). However, despite a lack of consensus, the number of students enrolled in charter schools has continued to grow (National Center for Educational Statistics, 2019a), Table 1 shows the increasing enrollment of students in public charter schools in California for the 5 years covered in this study.
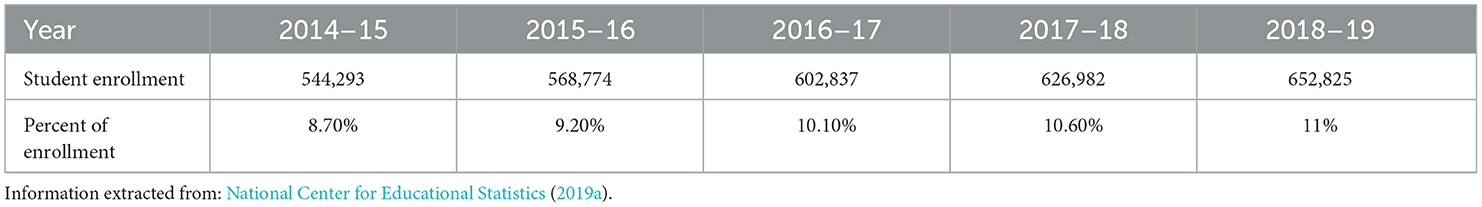
Table 1. Charter school enrollment growth in California.
Given the importance placed on student test scores as evidence of success at the state, school, classroom, student, and teacher levels, along with the increasing number of schools using alternative curriculums, identifying ways these alternative pedagogies impact student outcomes is critical. This study addresses this goal by reviewing archival data on student achievement at a classroom level for a unique educational system. Using scores from classrooms in grades three through eight for five years, between the years 2015 and 2019, this study answers the question: Is there any significant difference between the levels of achievement for students in ELA and math who are enrolled in Waldorf-inspired charter schools vs. those in either local public-school classrooms or other charter classrooms that do not use the Waldorf pedagogy?
Philosophical framework
Waldorf public education
Waldorf education is a 100-year-old pedagogy developed in Europe just after World War I (1919) for the children of the workers at the Waldorf Astoria Cigarette Company. According to Friedlaender et al. (2015), the pedagogy is “unique in its comprehensive nature, with its explicit theory of child development, curriculum, pedagogical approach and philosophy about the role of the teacher,” (p. 99). After being shuttered by Hitler during World War II, the movement rebounded as an international, independent network of schools with a well-defined pedagogy and oversight guided by either the Association of Waldorf Schools of North America (AWSNA) or Alliance for Public Waldorf Education (Alliance) (Barnes, 1995; Oppenheimer, 1999). Both oversight agencies require extensive and ongoing work by applying schools, including self-studies and site visits to ensure that the Core Principals of Waldorf Education have been applicably integrated throughout the school and community. Until such permissions have been given, institutions are not allowed to use the Waldorf service mark in any of their school materials (Alliance for Public Waldorf Education, 2023; Association of Waldorf Schools of North America, 2024). The first school in the United States, The Rudolf Steiner School in New York (private), dates to 1928, and Waldorf schools have become one of the largest independent school movements in the world (Zdrazil, 2020). Additionally, Waldorf schools in the public realm, Waldorf-inspired schools, have been growing.
The Waldorf curriculum was created by Austrian philosopher Rudolf Steiner in response to the limited educational opportunities available to children from poor and working-class families in the early 20th century. Steiner's was one of several international movements that aimed to advance more organic educational opportunities than were offered by the widely implemented factory model of education. When the first school was being formed in Germany, Steiner described the goals of the educational model as, “a school for all classes” which hoped to more deeply understand and account for “what is universally human.” He continued, “In the Waldorf school what is considered is the educational principles, and no difference is made in their application between a child of the proletariat and a child of the ex-Kaiser” (Steiner, 1922/1947, Lecture 4). Rudolf Steiner advocated eschewing a narrow focus on the intellect and implementing a child-centered model of education, emphasizing hands-on learning that included arts, crafts, and practical skills (Barnes, 1995).
Prior to the 1950s, Waldorf first-grade classrooms would have looked more similar to traditional public school first-grade classrooms because the cultural mindset about the purpose of kindergarten was still rooted in the idea that this was a time for developmental, as opposed to academic growth (Dombkowski, 2001). Both public and private schools considered first grade the beginning of formal academic instruction. As the mindset around the role of kindergarten has shifted, Waldorf schools remain steadfast in their belief that play is essential for a child's development in kindergarten. They have kept kindergarten classrooms in the developmental realm, saving the first-grade classroom for the beginning of academic instruction.
However, this delay in academic instruction is only the first of many differences in their pedagogical beliefs. Another practice, known as looping, wherein the students in each grade often remain with the same teacher as they progress from first through eighth grade, is routinely practiced in Waldorf schools, if not always in a full first through eighth-grade cycle, then in shorter first through fourth and fifth through eighth-grade increments. Research has shown that looping can provide an academic advantage equal to two to three months of extra instruction per year looped (Burke, 1997; Tucker, 2006).
The students in these schools are taught academics through story and art, movement, and music. Also, rather than teaching the students every subject every day or week, the curriculum is organized in three to four-week blocks referred to as the Main Lesson (ML). Language arts, math, history, and science are all taught this way. Daily, in private Waldorf schools in grades one through four, classes may spend nearly half of the ML engaged in movement and games, which appear to target foundational skills such as executive function (Telfer-Radzat, 2024). Additional weekly subjects that occur outside of ML may include a foreign language (or two), handwork, games (a form of physical education), violin, painting, modeling, recorder, and woodwork. As reported in Telfer-Radzat and Brouillette (2021), the approach is designed to expose students to a wide range of topics and then focus deeply on how they connect (p. 7–8). Finally, the education is centered on a teacher's relationship to their students. Rather than relying on textbooks and worksheets, the teachers, while adhering to a particular content theme, are free to present the Waldorf curriculum in ways that best meet their group of students, as long as they stick to the developmental and academic guidelines provided by Rudolf Steiner and complied in Rudolf Steiner's Curriculum for Steiner-Waldorf Schools (Stockmeyer, 1969). While all second graders hear fables of animals who are clever and naughty and funny and lazy, those stories may be centered in various cultures that are most directly connected to each unique group of students. The students then create portfolios, providing evidence of their growth over a year. In private Waldorf classrooms, students in grades one through five, at a minimum, forgo any significant testing and are not given grades. As private schools, there is little oversight from a state perspective and, really, only the consumer (parents) to please.
Before 1991, all Waldorf schools in the U.S. had been private. The Milwaukee Urban Waldorf School, a public school, was founded in 1991 and the Yuba River Charter School in California was given its charter in 1994 and became the first Waldorf-inspired charter school in the state. Since that time, because all California public schools, including charters, are required to comply with certain accountability measures, these Waldorf-inspired schools, along with all other public schools, take state assessments every spring that measure English Language Arts (ELA) and math.
Literature review
Despite its large, world-wide presence, quantitative studies of Waldorf school practices by external researchers have lagged. Several factors, including a pedagogy that is complex and difficult to untangle, beliefs that external proof was unnecessary to validate their methods, along with their private school status, meant that Waldorf schools remained largely unknown to mainstream researchers. The growing presence of public charter schools that have adopted the pedagogy has increased interest in their practices. The number of Waldorf-inspired charter schools has grown to 57 nationwide, according to the website of the Alliance for Public Waldorf Education (2023). In California, there are 26 schools in various stages of membership, from new initiatives to full member schools, and two high schools. These charter schools, along with a smaller number of Waldorf-inspired magnet schools and Waldorf-inspired district schools, implement Waldorf instructional methods with the oversight of both their public-school agency and a national public Waldorf school organization (Alliance for Public Waldorf Education, 2023).
How academically effective is Waldorf education?
Comparing academic achievement in private Waldorf schools has been difficult given that, unlike traditional public schools, the implementation of the curriculum of Waldorf schools does not directly align with the public school timeline, and they are not required to administer state-mandated standardized testing. Yet, some comparable student populations are available.
The first Waldorf public school, Milwaukee Urban Waldorf Elementary School, had great success when, within 3 years, they had increased the number of students meeting grade level in reading from 26% to 63% (McDermott et al., 1996). A study from 2001 compared the achievement test scores (2 years) of fourth-grade economically disadvantaged, minority students in a large, midwestern city in the United States (Schieffer and Busse, 2001). One group attended a Waldorf-inspired charter school, and the other group was drawn from a school matched for the same neighborhood and economic make-up. Researchers found that the public Waldorf-inspired school provided minority, low SES fourth graders greater success across all academic areas and reported a moderate correlation between the type of education and the student's test scores.
In 2007, Ida Oberman conducted a study comparing test scores from the California Standards Test (CST) in four urban Waldorf-inspired charter schools, based on similar geography, district size, and other demographics, by grade level. She found that although the students were significantly underperforming at the second-grade level, by eighth grade, the treatment school students either matched or exceeded the top ten of peer-comparable sites in both math and English Language Arts. According to the teachers and administrators of these schools, the reason given for the differences lay in a pedagogy that focused on preparation in the lower grades for higher grades, year by year, e.g., building a strong foundation, rather than moving curricula down and teaching it earlier, a trend occurring in U.S. schools that was documented for kindergartens in a study in 2016 (Bassok et al., 2016). The faculty also believed that aspects of the pedagogy, such as looping and the spiraling nature of the curriculum, allowed the teachers to connect one academic subject to another, such as art to math, math to history, or history to science (Oberman, 2007).
In 2012, researchers Larrison et al. (2012) first compared the test scores of students in Waldorf-inspired charter schools in California with their district averages and then with a specific school matched on economic status and percentage of minorities enrolled. They found that students attending Waldorf-inspired charter schools showed significantly lower test scores in reading in grade two, but that by grades six, seven, and eight, these students significantly outperformed the district averages. In math, there were significantly negative differences in grade three, with Waldorf students earning lower than average scores, but the significance disappeared for all other grades. When the schools were compared individually with other non-Waldorf schools having similar demographics (as determined by t-tests), no significant differences were found for reading or math. Finally, the researchers examined the impact of Waldorf education on one cohort of students over seven years (grades two–seven). Waldorf students scored lower in grades two and three in reading and showed significantly (and approaching significantly) more students at above basic or advanced levels in grades seven and eight. In math, a greater number of students remained significantly lower than their cohorts in grades two to five and later showed significantly higher numbers of students achieving advanced competence by seventh grade (Larrison et al., 2012).
Finally, an intensive case study was conducted at a U.S. public Waldorf magnet school in 2015. The Center for Opportunity Policy in Education at Stanford University carried out a longitudinal study at the K-8 Alice Birney Public Waldorf School in the Sacramento City Unified School District in California (Friedlaender et al., 2015). This study found teachers with beliefs similar to those held by the teachers interviewed in the Oberman (2007) study and concluded that the instructional approaches used at Birney led to strong student outcomes. Quantitative analysis of student record data revealed that, compared to similar students in other district schools, Birney students had low transiency and suspension rates, as well as positive student achievement outcomes on standardized assessments. Further, while outcomes were strong for all students, outcomes were noticeably strong for Birney's large population of African American, Latino, and socio-economically disadvantaged students. African American and Latino students at Birney had a suspension rate one-tenth the rate of similar students across the district. For African American, Latino, and socio-economically disadvantaged students, the effect of attending Birney for 5 years was correlated with an increase of 8 percentiles (i.e. from 50th percentile to 58th percentile) in English Language Arts achievement. This was despite Birney's adherence to the Waldorf tradition of delaying formal reading instruction until first grade, a lack of formal testing in classrooms (except for that mandated by the state), and reliance on student-made “main lesson books” (portfolios)—as opposed to state-sanctioned textbooks—for instruction. These results strengthen the possibility that Waldorf pedagogy may have special benefits for traditionally marginalized students. As Pappano (2011) noted in the Harvard Education Letter:
It sounds counterintuitive for struggling students to spend class time on, say, knitting and drawing. Yet, a small but growing number of public schools are embracing Waldorf methods in hopes of engaging students in ways advocates say traditional approaches do not—and raising test scores along the way.
So, while there is not yet consensus among researchers regarding the success or failure of charter schools, generally, to improve academic outcomes for their students (Turner, 2015), it seems that perhaps there is a need to investigate more specifically the types of pedagogies being implemented in these schools. One thing that the growing California charter school movement has provided is a means for researchers to compare alternative educational models using a common assessment tool, in this case, the CAASPP. Greene et al. (2006) found that the best way to compare charter schools to traditional public schools is to narrow the scope of the type of charter school and use controls for demographic profiles of the students served by those schools. This study followed that suggestion and isolated the comparison schools to charter and non-charter and controlled for family income and enrollment size of the school.
Method
This study uses secondary data analysis, which is research into previously collected archival data. It is useful because it takes advantage of the significant amount of data that has already been collected, the volume of which has grown larger as our technical understanding has grown (Johnston, 2017). It is also free to use, making it accessible to many more researchers.
Data
In addition to the CAASPP test results file data (California Assessment of Student Performance and Progress, n.d.), data from California's Free and Reduced Priced Meal (FRPM) eligibility files were taken from the California Department of Education (CDE) website (California Department of Education, n.d.). The CAASPP data provides information on the percentage of students who “met or exceeded” the state standards in the areas of ELA and math at each grade level, each year (California Department of Education, n.d.). The FRPM files provide information on enrollment size, zip code, and income variations among schools. Both sets of tables for each of the 5 years were downloaded and imported into STATA and merged by each school's unique County-District-School (CDS) code.
Sample
The nature of the CAASPP data allows us to determine the percentage of students who met or exceeded state standards for ELA or math at a particular grade. A school with three classrooms of third graders will report only the percentage based on the whole cohort, not individual classrooms. Sixteen Waldorf-inspired charter schools had students in grades three through eight, which comprised the treatment group. These treatment schools were compared to two different control groups: (1) all non-Waldorf charter schools and (2) all public schools, including non-Waldorf charters. Descriptive statistics, including the number of students, percentage of white students, percentage of students who qualify as English language learners, percentage of students who qualify for special education services, and percentage of student population who qualify for FRPM for each of the 5 years can be found for the treatment group in Table 2. Because of the relatively small number of Waldorf-inspired charter schools, it was not possible in this study to include demographic information related to race, special education, or English language proficiency. The CAASPP hides public results for any group showing fewer than 11 observations.
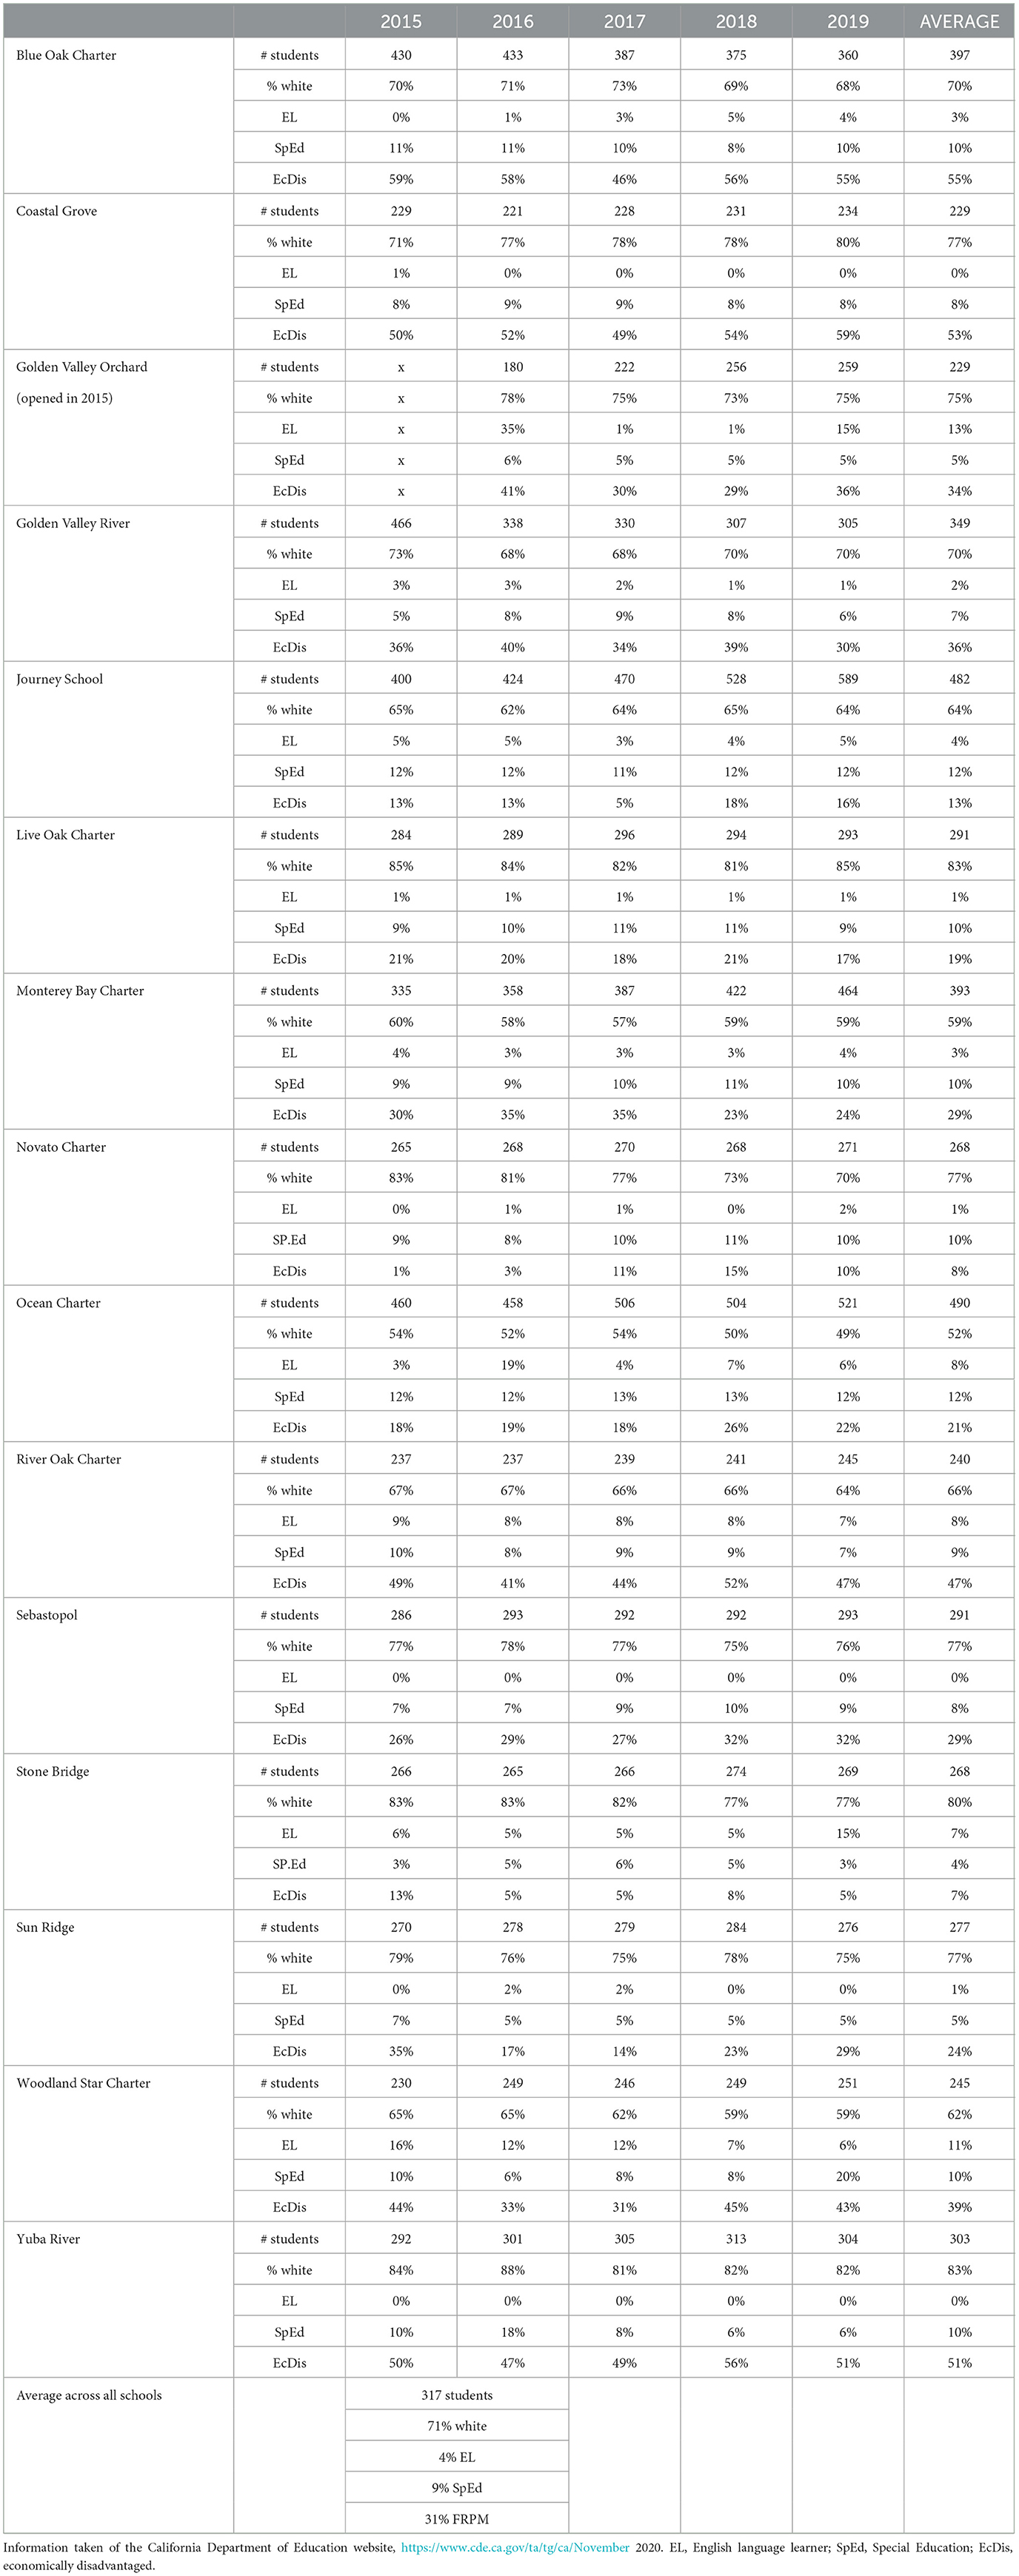
Table 2. Summary statistics for schools in the treatment group over 5 years.
Measures
Demographics
Demographic information is reported by parents or guardians to public schools when a child enters a school district. Additional information is collected yearly by individual school districts and used to indicate FRPM status, English language (EL) proficiency status, and special education status. It is stored in the California Longitudinal Pupil Achievement Data System (CALPADS).
Standardized assessments
California's statewide assessments are designed by the Smarter Balanced Assessment Consortium (SBAC) and include a comprehensive portfolio of standards-aligned assessments and tools for use by educational agencies, districts, schools, and teachers to support instruction and improve learning (Smarter Balanced, 2022). The CAASPP is the test SBAC has designed for use by California for its statewide assessment. It has been used in the state of California since 2014 when it replaced the Standardized Testing and Reporting system (STAR) that had been used since 1999.
Each year the CAASPP is administered to all public school students in California in grades 3, 4, 5, 6, 7, 8, and 11. It includes both a computer-adaptive test and a basic skill test for each of the English Language Arts and math assessments. A computer-adaptive test (CAT) is one that “adapts” in response to a student's correct or incorrect answers. A student who correctly answers a question will continue to be given increasingly advanced questions, while one who answers incorrectly will not advance but be given a different question until it is deemed that they have progressed as far as they are able. Educational assessments in California before 2014 did not have this capacity, and it is now believed to be a more accurate way to measure student learning (Reckase, 2011). The choice to switch to this test type was based on item response theory, as CAT tests are believed to be more accurate, fairer, and shorter (Knell et al., 2015).
Students' proficiency in ELA and mathematics is measured in the spring of grades three through eight for elementary school and grade eleven for high school. Data for grades three through eight, and from 2015–2019, are used in the current study. These computer-based tests have been aligned with the Common Core State Standards and are used to determine students' knowledge and skills in the tested subject area. California requires that schools meet a 95% student compliance threshold, and all but the most impacted students are expected to take the tests.
The results from the two assessments (ELA and math) are divided into 4 levels of mastery and can be found on the California School Dashboard for any public school in California. Four categories are represented by the following designations: Standard Not Met (red, level 1), Standard Nearly Met (yellow, level 2), Standard Met (green, level 3), and Standard Exceeded (blue, level 4) for both ELA and math. See Figure 1 below for an example of the state dashboard for California.
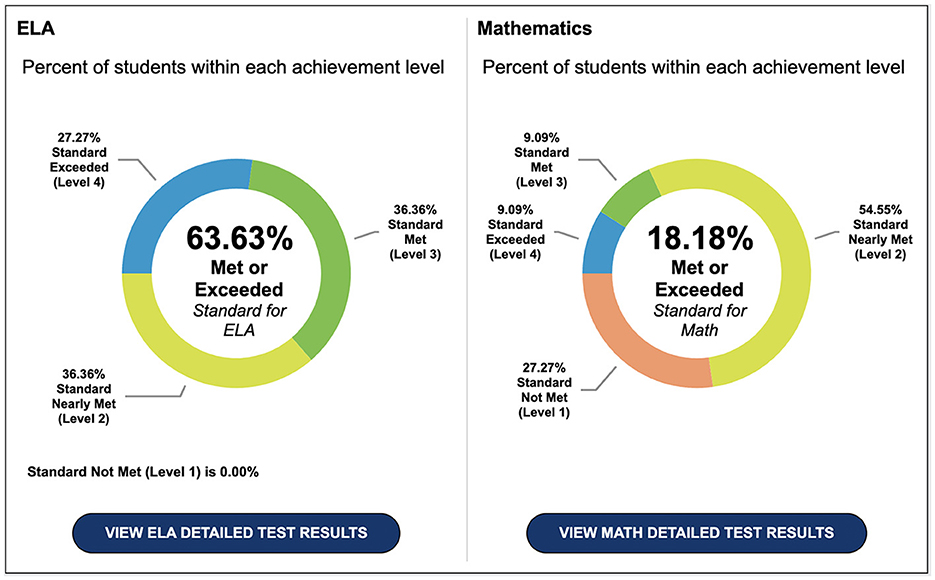
Figure 1. California state dashboard. Source: California Department of Education, Dashboard (https://www.caschooldashboard.org/).
The variable, percent of students who met or exceeded state standards (PSMESS), is used for this study, which collapses levels three and four into one group (met or exceeded state standards) and levels one and two into the other group (standard not met or standard nearly met).
Free or reduced-price meal (student poverty)
The state of California identifies a student as low-income if they qualify for free and/or reduced lunch or if both parents have no more than a high school education. Students qualify for free or reduced-price meal status under two categories. The first is based on Federal Poverty Guidelines and each child's family income status and household size (California Department of Education, 2019). Students who qualify as foster youth, migrants or unhoused are automatically enrolled. Because a child's family finances are related to academic outcomes, this study uses FRPM to control for income-related differences in achievement.
Analysis
Data analysis
This section describes the procedures used to conduct the data analysis for this quantitative study. Merging demographic and income data from the California Department of Education (CDE) with the CAASPP data, I used a quantitative, causal-comparative method to examine differences in achievement between classrooms of students in Waldorf-inspired charter schools, non-Waldorf charter schools, and traditional public schools. The unit of analysis for this study is grade level.
The CAASPP data files from the spring of 2015, 2016, 2017, 2018, and 2019 were first downloaded from the CDE website as two separate files: the statewide .csv delimited files for each school year and the corresponding delimited .csv entity files. The two files for each year must be merged to ensure that all scores are correctly connected to the appropriate county, district, and school codes.
Using STATA SE15.1, each year's CAASPP data was imported by year and a new cdscode was created that combined the county code, district code, and school code into one unique seven-digit-long number. Next, only data for each grade in the year I was importing for either ELA or math was kept. After dropping school codes equaling “0000000” and checking for duplicates, I kept only the new CDS code, percentage standard met and above, district code, and county code. This was done for each grade, each year, and both ELA and math scores. Empty cells, created when the data was merged into its wide file format and not missing data, were coded as missing, as were cells marked with an asterisk, denoting classrooms containing 10 or fewer observations.
Next, the FRPM files were merged to combine both enrollment and test score data over all 5 years (2015–2019); for example, all third-grade scores and school enrollment numbers across the 5 years were consolidated, all fourth-grade scores and enrollment numbers over 5 years, etc. The entire data file was then reshaped as a long file.
This resulted in a file with 26 variables and 62,440 observations across all schools for classrooms in grades three through eight between the spring of 2015 and 2019. One dummy variable (Wcharter) was created to represent the 16 Waldorf charter schools, and another, (school type), identified the 3 different types of schools I was investigating: Waldorf charters = 1; non-Waldorf charters = 2; local public schools =3.
Statistical analysis
I began the analysis by investigating the overall relationship between the three groups of California schools: local public schools (N = 10,968), non-Waldorf charters (N = 1,501), and Waldorf charters (N = 16). A one-way analysis of variance (ANOVA) was conducted to explore differences in ELA and math scores across the three school types. The treatment group was compared with control groups one and two, separately measuring the percentage of students meeting or exceeding the state standard (PSMESS) in both ELA and math. As a robustness check, the Bonferroni correction was conducted to check for the bias of repeated testing effects and inflated Type I errors.
Next, a series of ordinary least squares (OLS) multiple linear regression models were conducted to estimate the association of enrollment in a Waldorf-inspired charter school with class-level ELA and math achievement for the 5 years of data. Model one examined the differences in the PSMESS on the ELA and math assessments between the Waldorf-inspired charter schools and all other public schools (non-Waldorf charter and local public combined) with controls for school enrollment size and FRPM. Model two examined ELA and math PSMESS differences between the Waldorf-inspired charter schools and only non-charter local public schools with controls for enrollment and FRPM. Model three compared Waldorf-inspired charter schools to non-Waldorf-inspired charter schools. Finally, the areg Stata code was used to create a type of fixed effects model. This was necessary because one is limited to a wide file type for traditional fixed effects modeling. The school's district code was “fixed” using the code absorb to eliminate differences that would apply to all students across each district. The choice of district code over county code is supported by the fact that school districts have, until recently, derived approximately 80% of their local revenue from local property taxes (National Center for Educational Statistics, 2019b). This has had the effect of funneling more money to schools in high income neighborhoods because they have more income to tax. As well, a single school district can include several zip codes and even counties within it (National Center for Educational Statistics, 2019c). Therefore, it is more likely that policies are consistent across districts, regardless of county. Fixed effects models can result in smaller estimates because of bias from measurement error (Hedges, 1994).
The following equation is estimated for each model:
Where Gg is the percent of students who met or exceeded the state standard (PSMESS) outcome for a grade levelg for 5 years. Treat is a binary indicator representing enrollment in a Waldorf-inspired charter school in California. I controlled for school enrollment size (M = 624 students) and FRPM. Descriptive statistics for the groups: all schools, Waldorf schools, non-Waldorf charter schools, and local public schools are shown in Table 3.
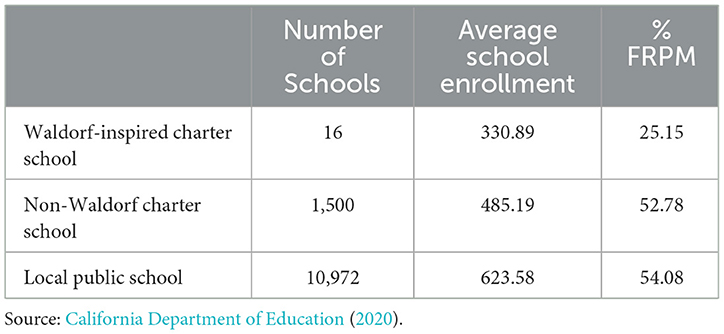
Table 3. Descriptive statistics: number of schools, average enrollment and %FRPM over 5 years by school type.
The coefficient μi was added for model four and represents district-level fixed effects. Fixed effects are used as a robustness check in the final model. It is included to account for district-wide variation within California. This method is recommended for nested data and allows one to control for effects of observable and unobservable unique traits such as school climate or teacher behaviors (Murnane and Willett, 2010). These indicators allow each district (N = 1,054) to have its own intercept and removes variable bias by measuring changes within groups across time. Adding the robust command helps correct for heteroskedasticity.
Each OLS multiple regression—other than the fixed-effects model—was computed path analyses using Stata SE 15.1. The fixed-effects model was computed using the “areg” command and missing data were handled using the list wise deletion.
The εI is an independently distributed error term. Robust standard errors are computed. These error terms assume that observations are independent and account for minor problems about the normal distribution or heteroskedasticity or errors. For the fixed-effects model, standard errors are clustered at the school level.
Results
Table 4 through Table 9 display results from the OLS linear regression models (e.g., unstandardized coefficients, standard errors, and sample sizes) for the overall PSMESS for ELA and math for a pooled 5-year period. Results for model four showing the fixed effect of adding district to the equation can be found in Tables 10 and 11.

Table 4. Model one.
Waldorf-inspired charter school enrollment vs. other charter and public school options (model one)
OLS multiple linear regression
Model one
This model simply compares the PSMESS in Waldorf-inspired charter schools vs. the PSMESS in all other types of public schools (both charter and local public) for ELA and math when controlling for the number of students enrolled in the school and the percent of students in any one school who are eligible for FRPM. Tables 4, 5 show the overall results, including the number of observations, standard errors, and R-squared.
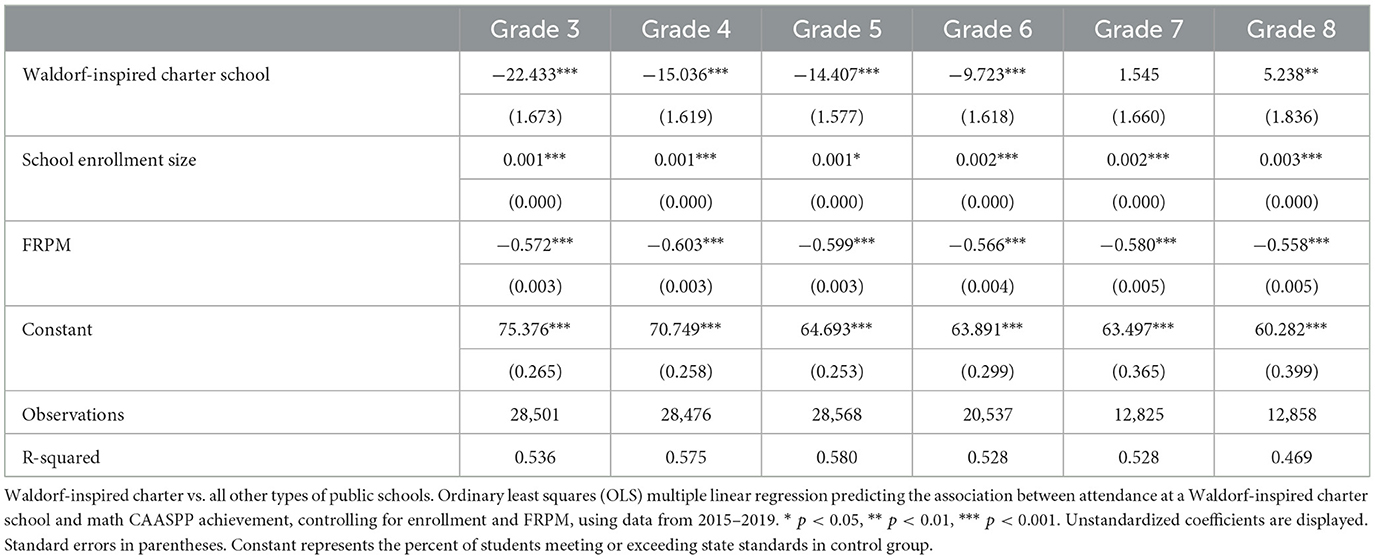
Table 5. Model one.
ELA
In grades three through six, Waldorf-inspired charter schools, on average, show significantly fewer students meeting or exceeding the state standards for ELA, on average, than the control group, which is comprised of all other public schools in California (p < 0.001 for 3rd and 4th, p < 0.05 for 5th). For sixth and seventh grades, significant differences have disappeared. When tested at the end of eighth grade, Waldorf-inspired charter school classes had significantly more students meeting the state standards across all years (p < 0.01). Students eligible for FRPM show a small but significant negative effect, which decreases slightly by eighth grade.
If one looks at the general treatment effect between third and eighth grade, although students are significantly underperforming in third grade, on average, the Waldorf-inspired charter schools have a higher PSMESS by the time they test in the spring of eighth grade. As shown in Figure 2, on average, nearly 17% more students in the Waldorf-inspired charter schools were meeting or exceeding state ELA standards by eighth grade vs. 0.18% more students in the control group. The R-squared was 0.51.
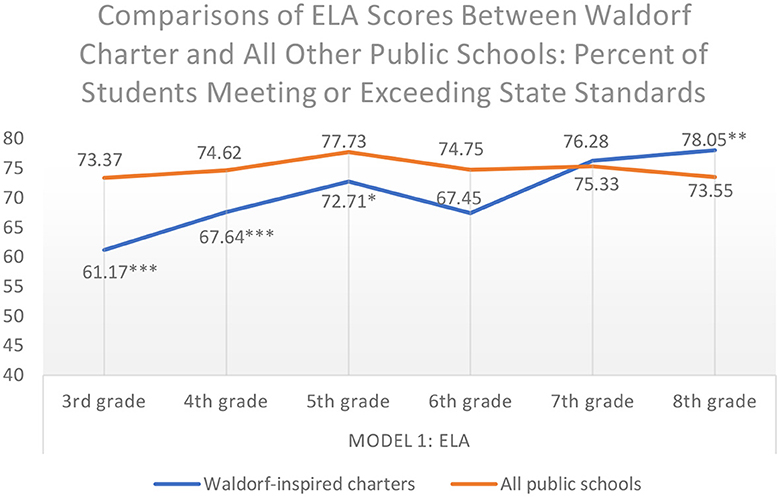
Figure 2. Model one: PSMESS for ELA in grades 3 through 8 for Waldorf-inspired charter schools vs. all other public schools. *p < 0.05; **p < 0.01; ***p < 0.001.
Math
In grades three through six, Waldorf-inspired charter schools show a significantly smaller percentage of students, on average, meeting, or exceeding state standards. By grade seven, the significance disappears. In the eighth-grade year Waldorf-inspired charter school classes have a significantly higher PSMESS in math (p < 0.01). Students eligible for FRPM show a similar significant negative trend as in ELA.
Figure 3 shows that, on average, the Waldorf-inspired charter school classes were meeting or exceeding state math standards by eighth grade at a rate 13.6% more than the comparison (51.19% of the third graders vs. 64.83% of the eighth graders). In the control group, the percentage change was 15% less (75.45% of the third graders vs. 60.28%of the eighth graders). The R-squared was 0.47.
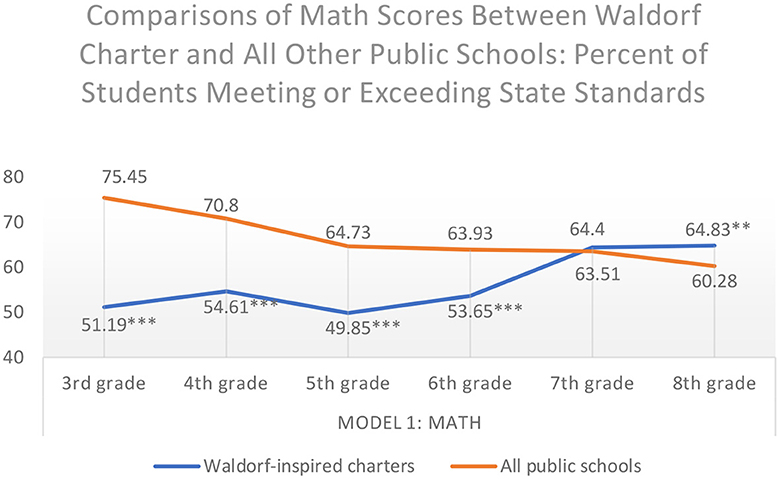
Figure 3. Model one: overall PSMESS for Math in grades 3 through 8. **p < 0.01; ***p < 0.001.
Waldorf-inspired charter school enrollment vs. non-Waldorf charter schools (model two)
OLS multiple linear regression
Model two
This model compares the treatment schools (Waldorf-inspired charter) to local public schools, excluding charters when controlling for the number of students enrolled in the school and the percent of students eligible per school for FRPM. This model removes schools that might be using an alternative model as part of their charter. Results, including the number of observations, standard errors, and R-squared can be found in Tables 6, 7.
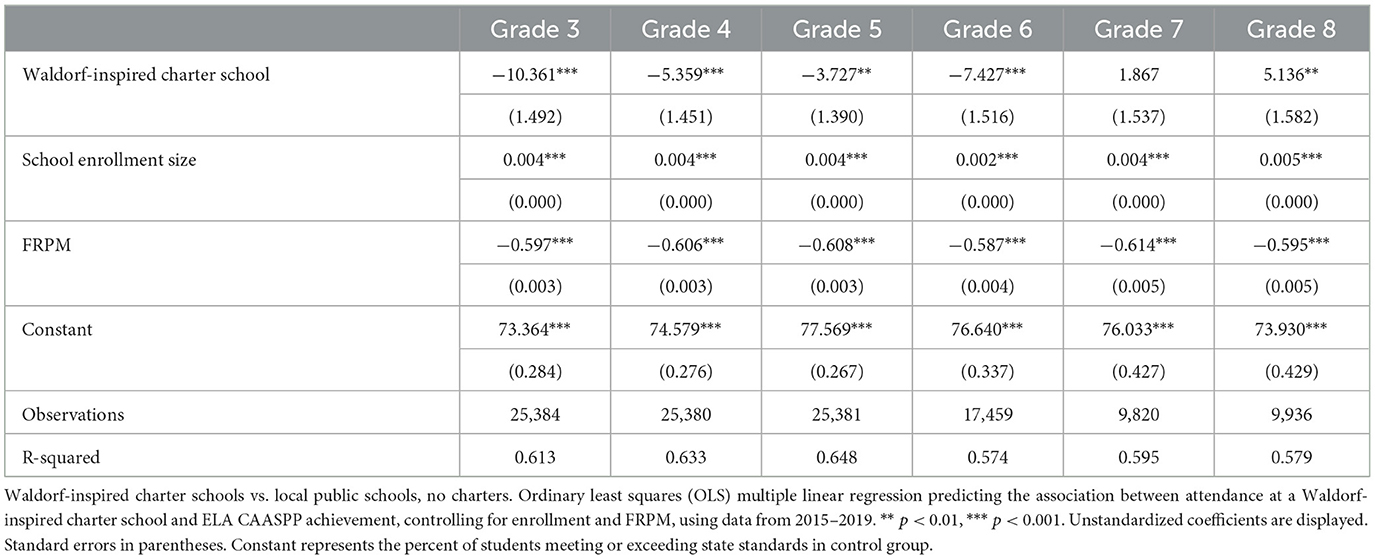
Table 6. Model two.
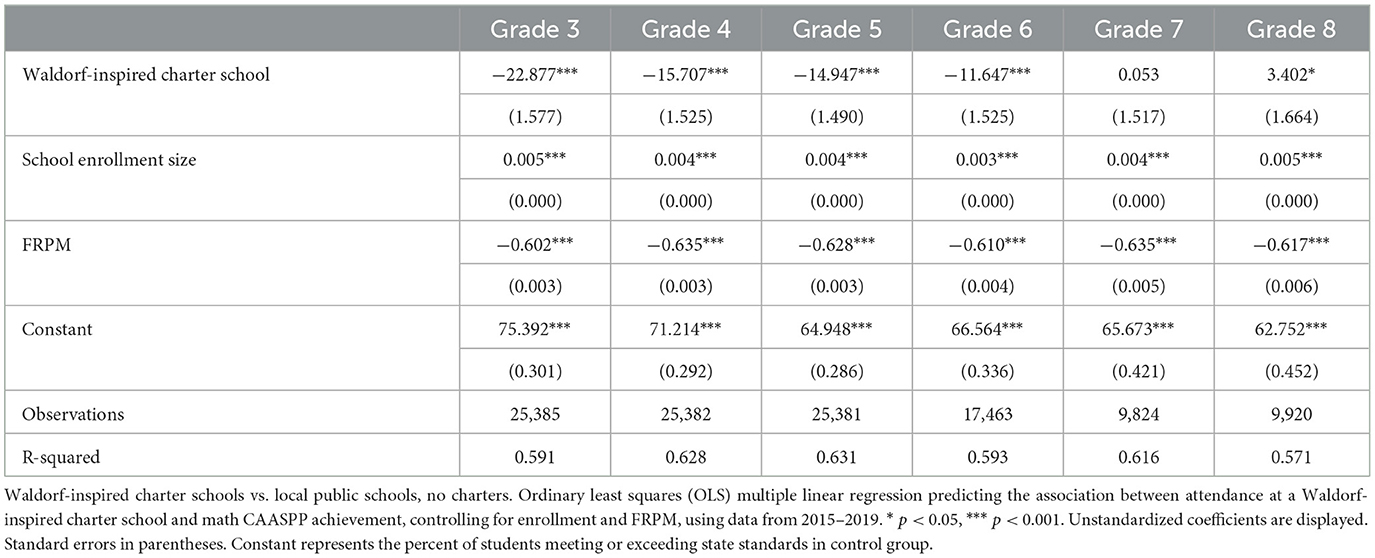
Table 7. Model two.
ELA
In grades three through six, there were, on average, significant differences in PSMESS for ELA, with the Waldorf-inspired charter school classes having fewer students meeting ELA standards (p < 0.01 and p < 0.001). There were no significant differences in grade seven. By eighth grade the PSMESS in the Waldorf-inspired charter school classes was significantly higher across all years tested (p < 0.01). There was a consistently small negative effect for students eligible for FRPM.
Figure 4 shows that, on average, by eighth grade, Waldorf-inspired classes increased the percentage of students meeting or exceeding state standards by just over 16% in ELA. Local public schools increased the percentage of students meeting or exceeding state standards by 0.6%. The R-squared was 0.58.

Figure 4. Model two: overall PSMESS for ELA in grades 3 through 8. **p < 0.01; ***p < 0.001.
Math
When students enrolled in public schools are compared to those enrolled in Waldorf-inspired charter schools as a PSMESS in math, there are, on average, significant negative differences in grades three through six for the Waldorf-inspired schools. In seventh grade, any significance disappears, and by eighth grade, there is a positive significant effect for these schools (p < 0.05). Eligible FRPM students show a small but negative effect across all years.
Figure 5 shows that, on average, in math at the third-grade level, a higher percent of non-Waldorf, local public-school students (75.39%) are meeting or exceeding the state math standards in third grade vs. only 52.51% of those attending Waldorf-inspired-charter schools. However, by eighth grade, the outcomes have flipped. The percentage of students meeting or exceeding state standards in math has increased by 13.6% in the Waldorf-inspired schools, while in the public schools, the percentage has fallen by over 12%. The R-squared was 0.57.
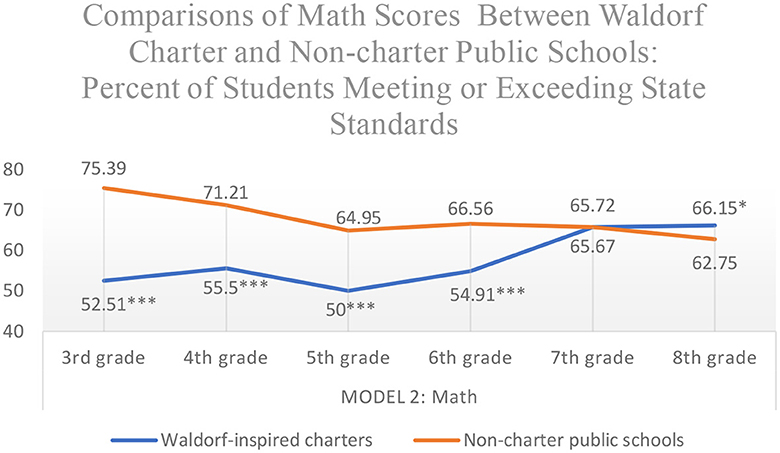
Figure 5. Model two: overall PSMESS for Math in grades 3 through 8. *p < 0.05; ***p < 0.001.
Waldorf-inspired charter school enrollment vs. non-Waldorf charters, with controls (model three)
OLS multiple linear regression
Model three
This model compares Waldorf-inspired charter schools only to other charter schools using the previous two controls of the enrollment size of the school and the percentage of students in a school who are eligible for FRPM. By restricting the type of school being compared, we are looking at schools with student populations that could be considered more similar. Tables, including the number of observations, standard errors, and R-squared can be found in Tables 8, 9.
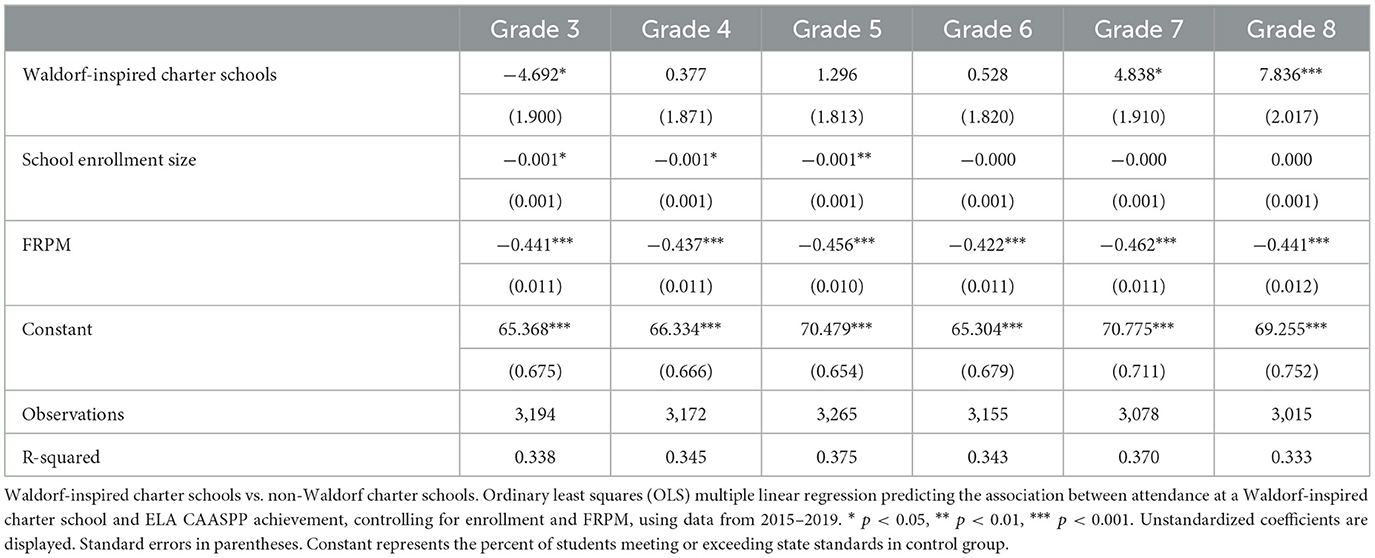
Table 8. Model three.
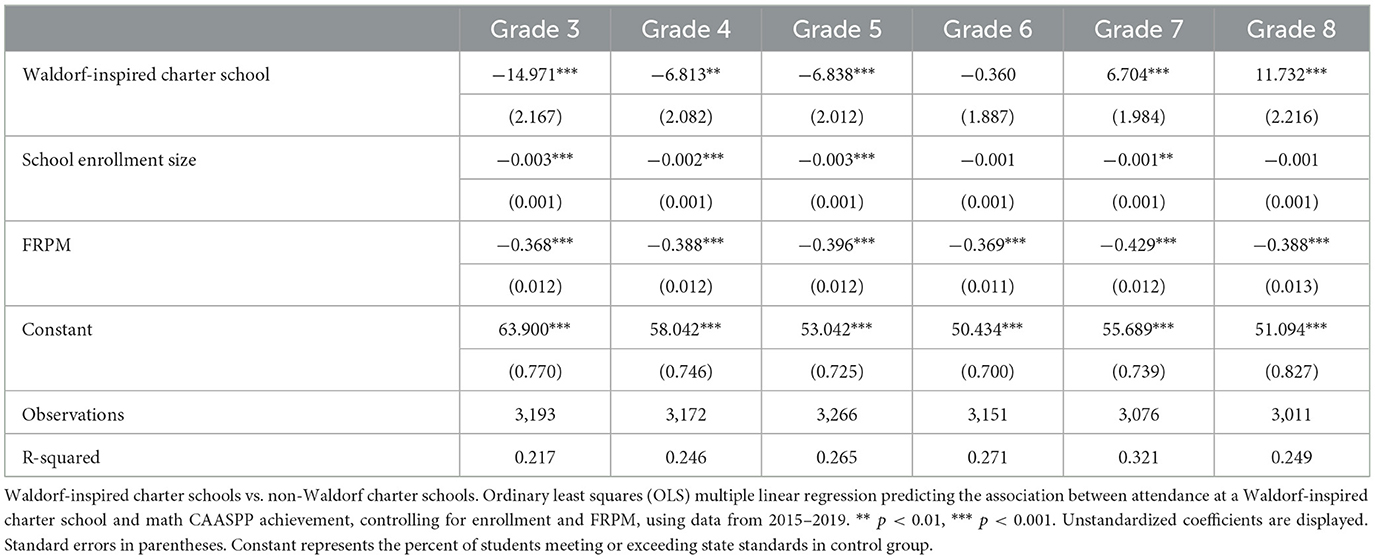
Table 9. Model three.
ELA
Overall and on average, comparing only charter to charter, significant negative differences were only found in the PSMESS in third grade. In this year, the PSMESS in Waldorf-inspired charter schools was significantly lower by nearly 7 percentage points with a p-value of < 0.05. By eighth grade, the Waldorf-inspired charter school classes had increased, on average, PSMESS for ELA, 7.8% more than the control (p < 0.001). Eligible FRPM students show a small but negative effect across all years. The R-squared for this model was 0.33.
Figure 6 shows the PSMESS differences by grade for ELA. In third grade, non-Waldorf-inspired charters have, on average, a significantly higher percentage of students (65%) meeting or exceeding state standards, as compared to 59% for the Waldorf-inspired charters. Between fourth and sixth grade the scores for both types of schools show no statistical differences. By eighth grade, the Waldorf-inspired charter school classes have a significantly higher percentage of students meeting or exceeding state standards than the control group (p < 0.001). The percentage of students in Waldorf-inspired charter schools meeting and/or exceeding state standards increased, on average, over 18%, while the non-Waldorf charter classes gained just over 3%.
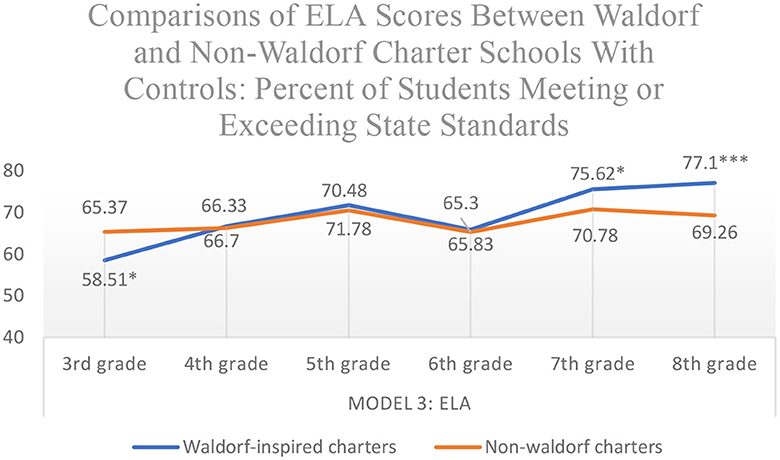
Figure 6. Model three: overall PSMESS for ELA in grades 3 through, controlling for FRPM and enrollment size. Controlling for enrollment and FRPM. *p < 0.05; ***p < 0.001.
Math
In third through fifth grade, the PSMESS for Waldorf-inspired charter school classes is, on average, significantly lower than the PSMESS for the control group, with a p-value < 0.001. Grade six shows no significant differences between the groups. In seventh grade, Waldorf-inspired schools show a significantly higher PSMESS (p < 0.001) and the trend continues for eighth grade (p < 0.001). Eligible FRPM students show a small but negative effect across all years. The R-squared for this model was 0.25, lower than either model one or two.
As shown in Figure 7, the Waldorf-inspired school group has, on average, a significantly lower percentage of students meeting or exceeding the state standards in third grade (63.9% vs. 48.93%). In sixth grade, the differences converge and are not significant. By eighth grade Waldorf-inspired charter schools show 62.82% of their students at or above standard, vs. 51.09% in the control group. In fact, by eighth grade, the non-Waldorf charter schools have nearly 13% fewer students meeting state standards than they did in third grade.
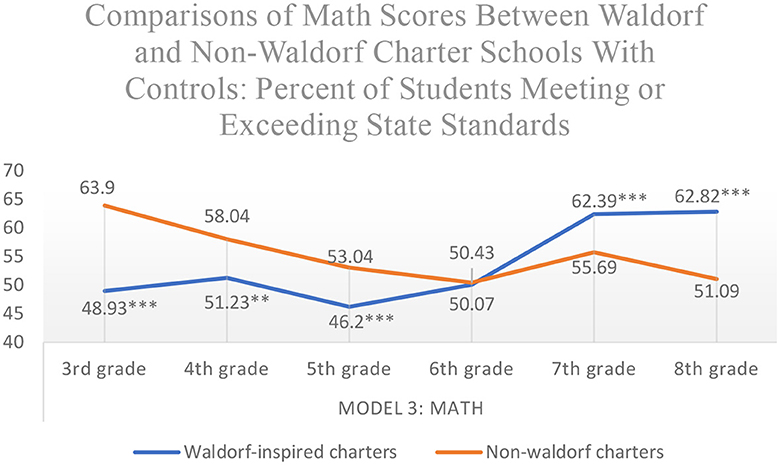
Figure 7. Model three: overall PSMESS for Math in grades 3 through 8. Controlling for enrollment, FRPM, and school district. **p < 0.01; ***p < 0.001.
Model four: fixed effects
This final model uses fixed effects-type regression to restrict the sample to charter schools, by absorbing district. It assumes that any differences across a district are constant for those students. Controls for enrollment and FRPM continue to be used. Tables, including the number of observations, standard errors, and R-squared can be found in Tables 10, 11.
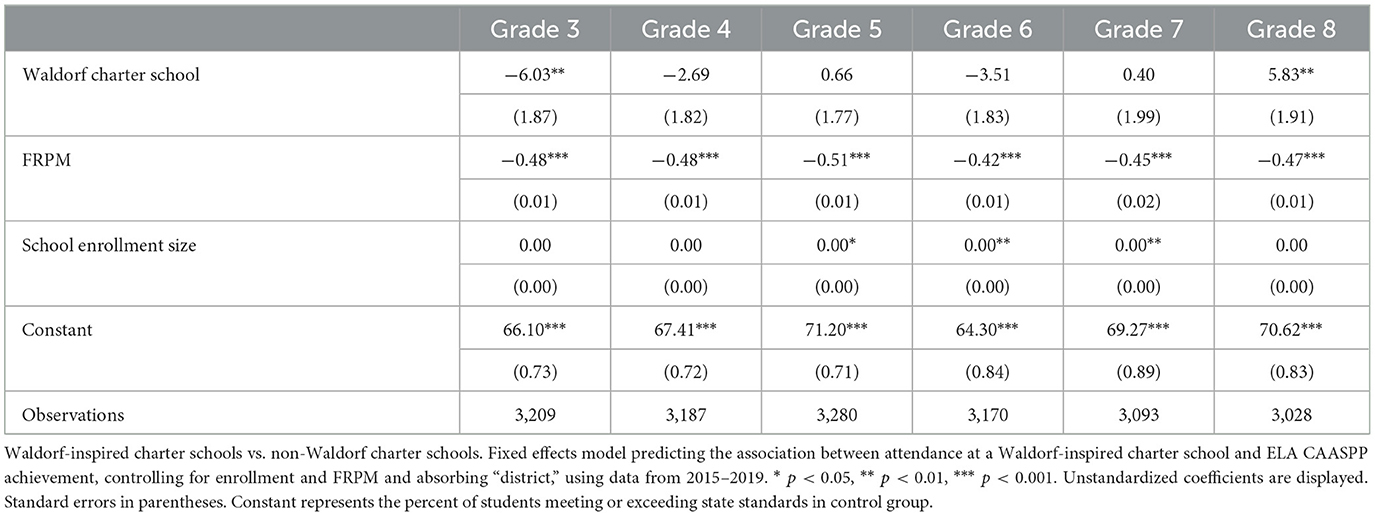
Table 10. Model four.
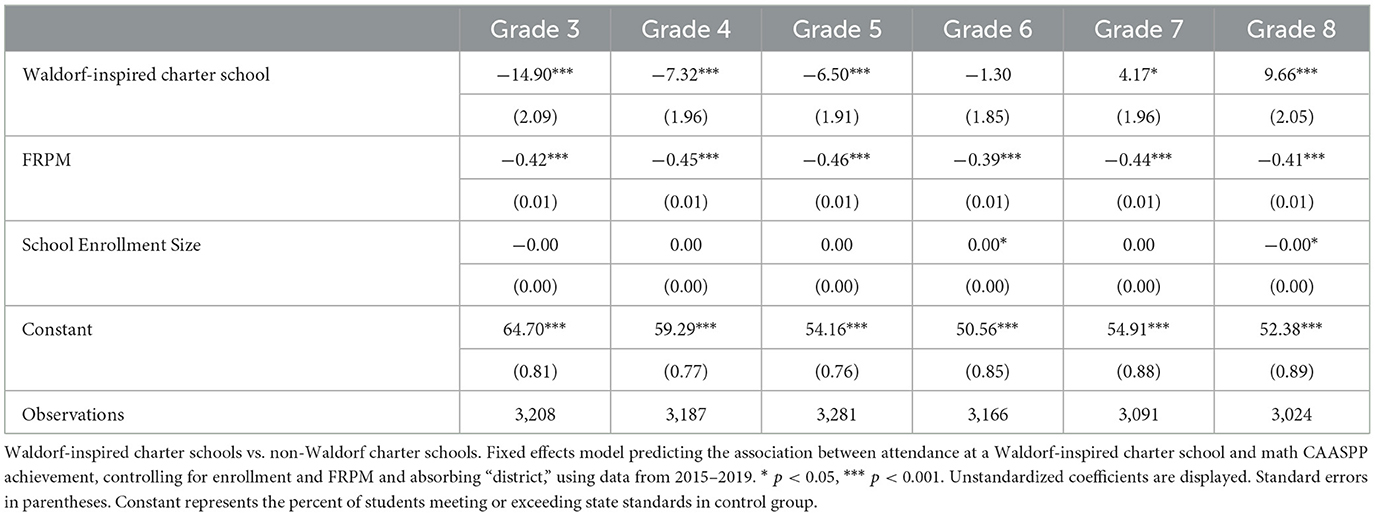
Table 11. Model four.
ELA
Accounting for the nesting effect of district resulted in removing any significant PSMESS differences in ELA across charter schools in all grades except third and eighth. On average, a significantly higher percentage of third graders in Waldorf-inspired charter school classes meet or exceed state standards, as compared to those in non-Waldorf schools, a trend similar to all other models. By eighth grade the Waldorf-inspired treatment group has, on average, a significantly higher PSMESS in ELA (p < 0.01). Eligible FRPM students show a small but significant negative effect across all years, however, that number is smaller for ELA than for math. The adjusted R-squared is 0.38.
While the two groups start at significantly different levels in third grade (66.1% control vs. 60.03% treatment PSMESS), they follow a similar trajectory in grades four through seven. Both groups have a drop in PSMESS between fifth and sixth grade. Then, the Waldorf-inspired charter schools begin to show significantly higher percentages of students meeting and/or exceeding state standards than the control group, finishing with nearly 7% more students meeting or exceeding state standards than their comparative counterparts. See Figure 8 below.
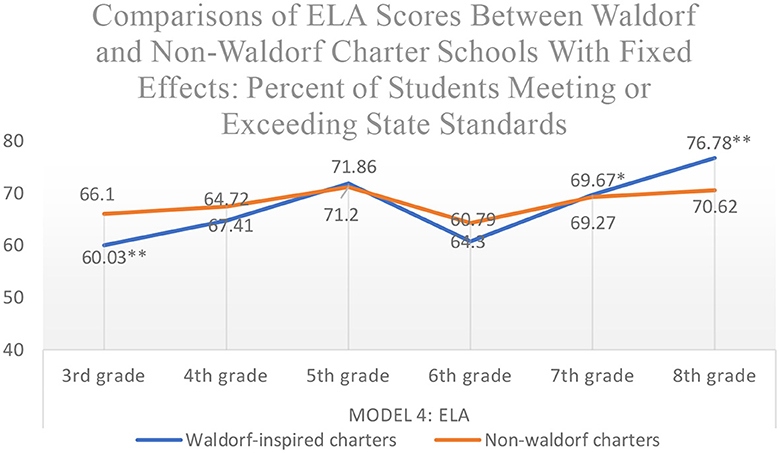
Figure 8. Fixed effects: average PSMESS with fixed effects for ELA in grades 3 through 8. Controlling for enrollment, FRPM, and fixing school district. *p < 0.05, **p < 0.01.
Math
For math, the negative association of PSMESS for attending a Waldorf-inspired charter school remained significant, on average, in grades three through five (p < 0.001). By seventh grade the differences were significantly positive and in eighth grade the treatment group showed, on average, a significantly higher PSMESS than the control classrooms (p < 0.001). Eligible FRPM students show a small but negative effect across all years. The adjusted R-squared is 0.31.
Growth is seen for the Waldorf-inspired charter school classes in fourth grade and then a decrease in fifth before trending upwards again. The control group shows a steady decline up to sixth grade when they begin trending up again. By eighth grade, on average, nearly 10% more students in Waldorf-inspired charter schools are meeting or exceeding state standards in math, as shown in Figure 9. The PSMESS for the control group has dropped by just over 12% by eighth grade, while the Waldorf-inspired charter schools have increased their percentage by over 12%.
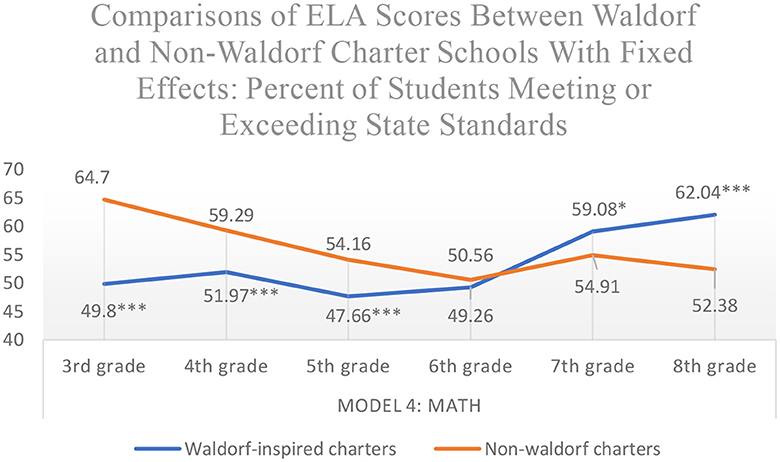
Figure 9. Fixed effects for PSMESS in math in grades 3 through 8. Controlling for enrollment, FRPM, and fixing school district. *p < 0.05, ***p < 0.001.
Summary of results
In models one and two, at a school and grade level, controlling for school size (enrollment) and the percent of students qualifying for FRPM (an indicator of neighborhood income levels), the differences between the Waldorf-inspired schools and the two control groups (all public schools including non-Waldorf charters and only non-charter schools) follow a similar pattern for both ELA and math. In years three through six, generally, students attending Waldorf-inspired charter schools meet the state standards at significantly lower percentages. Between fifth and sixth grade the two groups converge and then begin to trend in opposite directions. In eighth grade, there is a significantly higher PSMESS for both subjects. The effect size is large.
When comparing only Waldorf charter schools to other charter schools using the same controls (model three), the percentage of students in Waldorf charter schools remains significantly lower in third grade for both subjects. In ELA, there are no significant differences until eighth grade and both groups follow a very similar trajectory, including a dip in sixth grade. In eighth grade, in both ELA and math, there are significantly (p < 0.001) more students meeting state standards in Waldorf-inspired charter schools. In math, the percentage of students meeting or exceeding state standards in the non-Waldorf-charter schools has dropped below the third-grade level.
When using a fixed-effects model (four), absorbing district code while continuing to control for enrollment size and FRPM, the overall pattern remains the same. Students in Waldorf-inspired charter schools meet state standards at a significantly lower percentage rate in grades three for ELA and three through five for math. However, in seventh and eighth grade for both ELA and math, the percentage of students meeting or exceeding state standards at Waldorf-inspired charter schools is significantly higher. There is a medium effect size.
Discussion
In this study, I pooled 5 years of archival CAASPP test data (2014–15 to 2018–19) from the CDE website, along with FRPM and enrollment numbers from the CALPADS website to examine school CAASPP scores based on their school type status. Using these data, I employed descriptive statistics and OLS multiple linear regression to investigate the association between enrollment in a Waldorf-inspired charter school and PSMESS on the CAASPP standardized assessments. Group one, the treatment group, included students in Waldorf-inspired charter schools. Group two included students enrolled in either local, public schools or non-Waldorf charter schools. The estimates included applicable covariates to account for school enrollment size and socioeconomic status (FRPM). In addition, I employed district-level fixed effects and reported significant results that withheld the Bonferroni correction to correct for type-one errors.
At the school/grade level, I found that at baseline (when students are first tested in 3rd grade) students in the Waldorf-inspired charter schools, across all models, have a significantly lower PSMESS for both ELA and math. However, in sixth grade, the students in the Waldorf-inspired charter schools no longer show any significant difference from the control groups. In eighth grade, in both ELA and math and across all models, a significantly larger percentage of students in Waldorf-inspired charter schools were meeting the state standards. This result is consistent with previous research investigating Waldorf academic outcomes. Without constant testing (other than that required by the state), early academics, or state-mandated textbooks, a greater percentage of students in treatment schools are achieving proficiency by 8th grade than their peers in both ELA and math.
Using the fixed effects model, I also found that the percentage of students meeting standards in eighth grade for the Waldorf-inspired group was greater than any of the control groups in both ELA and math. In ELA, the students in Waldorf-inspired charter schools showed approximately 6% more students meeting the state standards in eighth than the control group, which showed a < 1% increase. In math, the differences were more pronounced, particularly if you look at the increasing percentage of students which are meeting state standards. There were over 12% more students at standard for the treatment group in eighth- grade than at third-grade level. The control group had nearly 13% fewer students at standard in math than at the third-grade level. The overall effect of this schooling was moderate (R-squared ELA = 0.39; R-squared math = 0.33).
Given what we know about cognitive development, these results should not be surprising. We know that learning doesn't happen on a fixed schedule and in yearly increments. Yet, we continue to measure it that way. Students in our public and private schools are expected to be at a certain point by a certain time each year or they and their teachers are considered sub-par. This study provides evidence that one alternative educational model has been able to educate its students successfully, without the stress of constant testing, a state-mandated curriculum, or traditional grading systems. Despite the strong push to provide traditional academics to students at younger and younger ages in the U.S., these schools have resisted that drive and continue to approach education from a developmental perspective, one recommended by renowned cognitive scientists such as Dewey, Piaget, and Vygotsky. The Waldorf model may find success because it focuses on developing strong foundations in the early years, developing skills often associated with executive functioning, and better preparing students entering middle school to dive into the more complex concepts of algebra and writing.
However, it is also possible that other factors are driving the outcomes. All who study Waldorf education realize it is unlike any other system. Several practices may, on their own or tied together, be supporting these students. One of these, looping, is shown to improve scores by several months every 2 years with the same teacher (McCown and Sherman, 2002; Baker, 2006; Tucker, 2006). Since, traditionally, Waldorf teachers may loop up to 8 years with the same class, this could impact outcomes. Another practice that may influence outcomes is the curriculum's widespread use of imagination through story. The Waldorf curriculum depends on story across all grades and exposure to storytelling is linked to the development of cognitive flexibility (Veraksa et al., 2022). Or, perhaps, it is the lack of high-stakes testing? There are many practices employed in Waldorf schools that are supported by current educational research. A recent literature review by Mavrelos and Daradoumis (2020) investigated the relationship between pedagogy, intelligence, and the neuroscience of learning. They found an overlap between Waldorf teaching strategies and Multiple Intelligence Theory (MI) and concluded that although Waldorf and Waldorf-inspired schools are not MI schools, Waldorf schools do employ MI-consistent teaching strategies.
Limitations and future research
This study is the first of its kind to compare the performance of students at Waldorf-inspired charter schools to students in both other charters and traditional public schools using standardized CAASPP test results. It is strong, but some limitations exist. In the case of schools with class enrollment under 11, information related to the class scores, English language learner status, special education status, and race is only available as restricted data. Because parents often worry that their students will not be prepared for a rigorous academic experience in high school and the lack of hard evidence demonstrating its viability, Waldorf-inspired classrooms sometimes have smaller classes in the seventh and eighth grades. This makes that data unavailable publicly and reduces the number of grades that can participate. Having access to these classes would add to the picture by providing a bigger sample, and it would be beneficial to know whether the results differ at all for certain demographic groups.
As well, some may be interested in how different genders respond to this pedagogy. I chose not to include gender in my study as it is not, as is becoming more and more known, a binary indicator. Some may disagree. However, I am currently teaching in a seventh/eighth-grade classroom with at least 10% of the students who do not identify as male or female. Gender is determined through a parent survey when a child enters school, often as young as four and a half. I wonder about the accuracy of using a label that was not chosen by the students themselves. How do we know it is accurate?
Finally, although I controlled for a rigorous set of covariates related to school differences, there were many factors that I could not control for. These include the practices of looping, art integration, and whole-to-part teaching. Additionally, different states have different laws constraining charter school practices and these differences could have an effect that makes California an outlier. Future research may consider using a Propensity Score Matching model to better control for population differences, or, perhaps, following the students through high school using their service set identifier (SSID) numbers to see how they fare in traditional high schools after spending time in a Waldorf-inspired school. Adding the California Science Test scores to the model might also provide some interesting results, as one RTC study in 2019 found strong correlations between the integration of the arts and the retention of science content (Hardiman et al., 2019). I hope that future research will expand on these findings as we strive to improve the education of all children for a brighter future.
Data availability statement
Publicly available datasets were analyzed in this study. This data can be found here: https://www.cde.ca.gov/ds/ad/downloadabledata.asp.
Author contributions
KT-R: Conceptualization, Investigation, Writing – original draft, Writing – review & editing.
Funding
The author(s) declare that no financial support was received for the research, authorship, and/or publication of this article.
Conflict of interest
The author declares that the research was conducted in the absence of any commercial or financial relationships that could be construed as a potential conflict of interest.
Publisher's note
All claims expressed in this article are solely those of the authors and do not necessarily represent those of their affiliated organizations, or those of the publisher, the editors and the reviewers. Any product that may be evaluated in this article, or claim that may be made by its manufacturer, is not guaranteed or endorsed by the publisher.
References
Alliance for Public Waldorf Education (2023). Find a School. Available online at: http://www.allianceforpublicwaldorfeducation.org/ (accessed April 20, 2023).
Association of Waldorf Schools of North America (2024). Member Services. Available online at: https://www.publicwaldorf.org/member-services (accessed April 20, 2024).
Baker, J. A. (2006). Contributions of teacher–child relationships to positive school adjustment during elementary school. J. Sch. Psychol. 44, 211–229. doi: 10.1016/j.jsp.2006.02.002
Barnes, H. (1995). The origins of the waldorf movement and its current challenges. Re Vis. 1, 12–33.
Bassok, D., Latham, S., and Rorem, A. (2016). Is kindergarten the new first grade? AERA Open 2:2332858415616358. doi: 10.1177/2332858415616358
Burke, D. L. (1997). Looping: Adding Time, Strengthening Relationships. Washington, DC: ERIC Digest.
California Department of Education (2019). Income Eligibility Scales. Available online at: https://www.cde.ca.gov/ls/nu/sn/eligmaterials.asp (accessed April 8, 2019).
California Department of Education (n.d.). California Longitudinal Pupil Achievement Data System (CALPADS). Available online at: https://www.cde.ca.gov/ds/sp/cl/ (accessed April 6 2020)..
California Department of Education (n.d.). Smarter Balanced Assessment System. Available online at: https://www.cde.ca.gov/ta/tg/sa/index.asp (accessed April 6 2020)..
California Department of Education (2020). Free or Reduced-Price Meal (Student Poverty) Data. Available online at: https://www.cde.ca.gov/ds/ad/filessp.asp (accessed April 4, 2020).
Clark, M. A., Gleason, P. M., Tuttle, C. C., and Silverberg, M. K. (2014). Do charter schools improve student achievement? Educ. Evaluat. Policy Anal. 37, 419–436. doi: 10.3102/0162373714558292
Cohodes, S. R., and Parham, K. S. (2021). Charter schools' effectiveness, mechanisms, and competitive influence. Working paper. doi: 10.3386/w28477
Dombkowski, K. (2001). Will the real kindergarten please stand up?: Defining and redefining the twentieth-century US kindergarten. Hist. Educ. 30, 534–536. doi: 10.1080/00467600110064762
Friedlaender, D., Beckham, K., Zheng, X., and Darling-Hammond, L. (2015). Practices of Waldorf-Inspired Schools. Research Brief. Stanford Center for Opportunity Policy in Education.
Fryer, R. G. Jr. (2012). Learning from the successes and failures of charter schools. The Hamilton Project. Available online at: https://www.brookings.edu/wpcontent/uploads/2016/06/THP_Fryer_Charters_DiscPaper.pdf (accessed July 8, 2022).
Greene, J. P., Forster, G., and Winters, M. A. (2006). Apples to apples: An evaluation of charter schools serving general student populations. Education Working Paper Archive.
Grosskopf, S., Hayes, K. J., and Taylor, L. L. (2009). The relative efficiency of charter schools. Ann. Public Cooper. Econ. 80, 67–87. doi: 10.1111/j.1467-8292.2008.00381.x
Hardiman, M. M., JohnBull, R. M., Carran, D. T., and Shelton, A. (2019). The effects of arts- integrated instruction on memory for science content. Trends Neurosci. Educ. 14, 25–32. doi: 10.1016/j.tine.2019.02.002
Johnston, M. P. (2017). Secondary data analysis: a method of which the time has come. Qualit. Quantit. Methods Librar. 3, 619–626. doi: 10.1177/1094428112457829
Knell, J. L., Wilhoite, A. P., Fugate, J. Z., and González-Espada, W. J. (2015). Using item response theory to improve locally-constructed multiple choice tests: measuring knowledge gains and curricular effectiveness. Electr. J. Sci. Educ. 19:n7. doi: 10.4324/9781410604729-15
Larrison, A. L., Daly, A. J., and VanVooren, C. (2012). Twenty years and counting: a look at waldorf in the public sector using online sources. Curr. Issues Educ. 15:803. doi: 10.4324/9780203181461-16
Mavrelos, M., and Daradoumis, T. (2020). Exploring multiple intelligence theory prospects as a vehicle for discovering the relationship of neuroeducation with imaginative/waldorf pedagogy: a systematic literature review. Educ. Sci. 10:334. doi: 10.3390/educsci10110334
McClelland, A., and Maul, A. (2013). NEPC Review: National Charter School Study 2013. Available online at: https://scholar.colorado.edu/concern/defaults/5425kb55x (accessed August 2, 2022).
McCown, C., and Sherman, S. (2002). Looping for better performance in the middle grades. Middle School J. 33, 17–21. doi: 10.1080/00940771.2002.11494679
McDermott, R., Henry, M. E., Dillard, C., Byers, P., Easton, F. Oberman, I., et al. (1996). Waldorf education in an inner-city public school. Urban Rev. 28, 119–140. doi: 10.1007/BF02354381
Murnane, R. J., and Willett, J. B. (2010). Methods Matter: Improving Causal Inference in Educational and Social Science Research. Oxford: Oxford University Press.
National Center for Educational Statistics (2019a). Public Charter School Enrollment. Available online at: https://nces.ed.gov/programs/coe/indicator/cgb/public-charter-enrollment (accessed April 8, 2019).
National Center for Educational Statistics (2019b). Public School Revenue Source. Available online at: https://nces.ed.gov/programs/coe/indicator/cma/public-school-revenue (accessed April 8, 2019).
National Center for Educational Statistics (2019c). School District Geographic Relationship Files. Available online at: https://nces.ed.gov/programs/edge/Geographic/RelationshipFiles (accessed April 8, 2019).
Oberman, I. (2007). Learning From Rudolf Steiner: The Relevance of Waldorf Education for Urban Public School Reform. Online Submission.
Oppenheimer, T. (1999). Schooling the Imagination: Waldorf schools, which combine a multisensory approach to learning with a strong emphasis on ethics, may be the world's “best-kept education secret.” Atlant. Boston 284, 71–91.
Reckase, M. D. (2011). “Computerized adaptive assessment (CAA): the way forward,” in The Road Ahead For State Assessments, 2.
Schieffer, J., and Busse, R. T. (2001). Low SES minority fourth-graders' achievement from an urban public Waldorf and comparison school. Res. Bull. Res. Instit. Waldorf Educ. 6, 18–24.
Smarter Balanced (2022). Available online at: https://smarterbalanced.org/our-vision/our-history/
Stein, M. L. (2015). Public school choice and racial sorting: an examination of charter schools in Indianapolis. Am. J. Educ. 121, 597–627. doi: 10.1086/681920
Steiner, R. (1922/1947). Spiritual Ground of Education. Nine lectures given at Manchester college: Oxford (England). London: The Anthroposophical Publishing Company. Available online at: http://wn.rsarchive.org/Education/SpGrEd_index.html
Stockmeyer, E. A. (1969). Rudolf Steiner's Curriculum for Steiner-Waldorf Schools: An Attempt to Summarize His Indications. Edinburgh [United Kingdom]: Floris Books.
Telfer-Radzat, K. (2024). “Hidden in plain sight: might play influence executive function development,” in AERA Annual Meeting: Dismantling Racial Injustice and Constructing Educational Possibilities: A Call to Action (Philadelphia, PA).
Telfer-Radzat, K., and Brouillette, L. (2021). Arts-embedded education: experiential learning in a waldorf first-grade classroom. J. Learn. Through Arts 17, 1–12. doi: 10.21977/D917157963
Tucker, S. C. (2006). The impact of looping on student achievement on the Colorado student assessment program. Theses. Available online at: epublications.regis.edu/theses/451
Turner, E. O. (2015). Districts' responses to demographic change. Am. Educ. Res. J. 52, 4–39. doi: 10.3102/0002831214561469
Veraksa, N., Gavrilova, M., and Veraksa, A. (2022). “Complete the drawing!”: the relationship between imagination and executive functions in children. Educ. Sci. 12:103. doi: 10.3390/educsci12020103
Keywords: Waldorf education, CAASPP, charter schools, testing outcomes, holistic education
Citation: Telfer-Radzat K (2024) Exploring alternative education: a comparison on 3 levels—Waldorf charters, non-Waldorf charters, and local public schools, as measured by the California Assessment of Student Performance and Progress. Front. Educ. 9:1323535. doi: 10.3389/feduc.2024.1323535
Received: 18 October 2023; Accepted: 03 June 2024;
Published: 28 June 2024.
Edited by:
Elizabeth Beaven, Alliance for Public Waldorf Education, United StatesReviewed by:
Teresa M. Woods, Mountain Song Community School, United StatesAllegra Alessandri, California Department of Education, United States
Copyright © 2024 Telfer-Radzat. This is an open-access article distributed under the terms of the Creative Commons Attribution License (CC BY). The use, distribution or reproduction in other forums is permitted, provided the original author(s) and the copyright owner(s) are credited and that the original publication in this journal is cited, in accordance with accepted academic practice. No use, distribution or reproduction is permitted which does not comply with these terms.
*Correspondence: Kimberly Telfer-Radzat, a3RlbGZlcnJAdWNpLmVkdQ==