 Cristina Frade-Martínez
 Joe O’Hara
 Adriana Gamazo
 Susana Olmos-Migueláñez
 Martin Brown
95% of researchers rate our articles as excellent or good
Learn more about the work of our research integrity team to safeguard the quality of each article we publish.
Find out more
ORIGINAL RESEARCH article
Front. Educ. , 21 February 2024
Sec. Assessment, Testing and Applied Measurement
Volume 9 - 2024 | https://doi.org/10.3389/feduc.2024.1306197
The Program for International Assessment (PISA) is a methodology for making comparative judgments about the quality of education systems. Celebrated by proponents as a transparent process that allows policy makers produce data informed judgments about relative quality of their national education system PISA – and through it the OECD – has become a key vehicle for informing and explaining educational policy development. This paper explores the Irish and Spanish outcomes of the 2018 round of PISA. It examines the contextual factors that are associated with performance at student and school level while at the same time developing a multi-level statistical model to explain divergent school performance profiles It finds that issues associated with the socio-economic level of the students, the repetition rate, and student age are common across all domains in both countries. It suggests that the socio-economic status of Spanish students at school level is not significant, that the shortage of teachers in Ireland affects student performance, and that immigrant status does not disadvantage Spanish student performance. It concludes by suggesting that studies involving a wider application of the model be undertaken to assess possible social, economic, and cultural causes that may explain the differences in variable significance in each country.
The Program for International Assessment, or PISA, as it is more widely known, is an internationally significant methodology for making comparative judgments about the quality of education systems at a global level (OECD, 2022). Administered by the Organization for Economic Cooperation and Development (OECD) on a tri-annual basis, the PISA process uses a stratified sample of 15-year-olds tested under three domains of learning (Mathematics, Reading and Science). The results of these tests are then calibrated and published in the form of league tables, which receive widespread publicity nationally and transnationally and often result in substantial policy and structural changes in educational provision on a national and regional scale (Breakspear, 2012; Brown et al., 2016; Zhao, 2020).
Celebrated by many education systems such as Ireland as a transparent, equitable and insightful process that allows policymakers to produce data-informed judgments as to the relative quality of their national education systems, PISA and through it, the OECD has become a key vehicle for informing and explaining educational policy developments in recent decades (Schleicher, 2019; Berliner, 2020; Seitzer et al., 2021). By providing robust data in key knowledge domains, society in general and policymakers are able, whether perceived or true, to make informed judgments as to the relative strengths and weaknesses of educational provision and to make changes to this provision that is data-informed and success oriented. However, given its systemic influence, it is perhaps unsurprising that there has been a longstanding critique of PISA in terms of both its procedures and its underlying assumptions (Grek, 2009; Ozga, 2012; Loveless, 2013; Hopfenbeck et al., 2018). Among the most consistent criticisms has been the linking of the PISA process to a fundamental reorientation of educational provision that sees it not as a public good in and of itself but rather as an arm of economic policy that seeks to maximize return on investment through the prioritization of certain forms of knowledge (Crossley and Watson, 2009; Lingard et al., 2015; Sjøberg, 2015; Zhao, 2018). Often linked to the political philosophy of ‘neo-liberalism’, this critique argues that the comparative function of PISA has resulted not in an improvement of educational provision but rather a narrowing of how we assess the value of education and an increased ‘datafication’ of our understanding of what we understand educational quality to be (Grek, 2009, 2021; Brown et al., 2016; Jarke and Breiter, 2019; Bandola-Gill et al., 2021).
Notwithstanding the importance of the debate that has raged around PISA in scholarly circles, the fact remains that it has unrivaled influence as a source of comparative judgment about educational quality internationally. Policymakers, educators, journalists and the public regularly use the results of PISA and, more specifically, the tabular presentation of those results to compare education systems (Feniger and Lefstein, 2014). While there might be an argument as to the robustness of these comparative judgments, and indeed the OECD would argue strongly against this use of ‘snapshot’ judgments preferring a more nuanced exploration of trends in the data produced, the fact remains that this is a common and highly influential outcome of the PISA process (Sjøberg and Jenkins, 2022). However, these comparisons often miss a critical and in-depth exploration of the data sets underpinning the “league tables.” Moreover, even when some aspects of this data are examined and discussed, common comparative analysis rarely explores the key underpinning concepts that dominate the discourse. Thus, important concepts such as the meaning of educational quality (Brown et al., 2016), the nature and validity of educational measurement (Moss, 1992) and the understanding of how both quality and measurement influence and are influenced by understandings of effectiveness across all stages of educational provision are rarely examined in single country let alone cross-country studies. This paper seeks to address this lacuna by exploring the data that emerged from the most recent round of PISA testing in 2018 regarding educational provision in Ireland and Spain. More specifically, it seeks to explore the contextual factors that are associated with student performance at the student and school level while at the same time using a multi-level statistical model that seeks to explain school performance profiles in PISA 2018 that appear to differ from the norm.
The concept of educational quality has been at the center of many theoretical debates. Indeed, Drew and Healy (2006) are of the view that “quality has always been a particularly difficult concept to define, and many academics have struggled to provide the all-encompassing definition” (2006, p. 361). Despite this Kumar attempts to provide a working definition arguing that quality can have two meanings; the first is “the essential attribute with which something may be identified” (2010, p. 8; e.g., an institutional or systemic ethos) and second is the “rank of, or superiority of one thing over another” (e.g., league tables).
The definition of quality espoused by the PISA process is, in practice and general usage at least, located firmly within the second understanding as defined by Kumar insofar as it ranks education systems in comparison to each other across a set of predefined criteria. While clearly a methodological and conceptually coherent approach this does leave the process open to legitimate questions regarding both the narrowness of its definition and the manner in which it seeks to operationalize this definition. Even if we choose to ignore the issue of ethos suggested by Kumar (2010), definitions of quality used for comparison purposes that are shorn of ideas of context and culture, to take just one set of factors, have led to a widespread debate as to the value of comparative studies such as PISA. In this regard, secondary analyses of PISA data performed by independent educational researchers are of great value to shine a light on the great relevance of contextual factors on academic achievements. Some of these studies are the ones developed by different authors from different countries (Gamazo et al., 2017; Costa and Araújo, 2018; Bokhove et al., 2019; Gamazo and Martínez-Abad, 2020; Wu et al., 2020).
This link between context and comparison is at the heart of this paper and is explored in the next section. Drawing on the complete 2018 PISA data set for Ireland and Spain the authors will seek to provide a comparative overview of the performance of Irish and Spanish students across each of the PISA domains while at the same time using a statistical model to explain this performance in a contextual manner offering a judgment of school quality that relies not on raw data alone but on a nuanced engagement with the nature, characteristics and embedded nature of the school systems being compared. First however, a description of the methodology that was used in the study is provided.
The main objective of this study is to determine which contextual factors at the student and school level are associated with the educational performance of Irish and Spanish students in each of the three skills of mathematics, science and reading literacy.
The instruments from which we have obtained the data that serve as the basis for the comparison presented here about the variables associated with the academic performance of 15 and 16-year-old students in Spain and Ireland are the PISA 2018 questionnaires. Differentiating between the context questionnaires and the competency assessment booklets, i.e., the actual assessment tests that were administered to students is important in this context. In most countries, these tests were administered in a computerized manner. Moreover, the total duration was approximately 2 h and 35 min (2 h for the assessment tests and 35 min for the context questionnaire; Ministerio de Educación y Formación Profesional, Gobierno de España, 2019b).
The context questionnaire “provides information about students, their attitudes, dispositions and perceptions; their homes and their experience of school and learning” (Ministerio de Educación y Formación Profesional, Gobierno de España, 2019b, p. 4).
In addition to the context questionnaire completed by students, data was also incorporated from school principals reporting on aspects of school management and the learning environment in their schools.
In the case of Spain, all these data were also complemented with other contextual data from teachers’ answers to a specific questionnaire on their personal characteristics, as well as a series of data provided by the students’ parents.
As we know, in each cycle of PISA emphasis is placed on a specific competence; in the 2018 edition, the main competence was Reading comprehension, with mathematics and science as secondary areas, and incorporating global competence as an innovator and financial competence as an international option (Ministerio de Educación y Formación Profesional, Gobierno de España, 2019a).
Regarding the construction of the assessment booklets, open questions and multiple-choice questions are included. Depending on the competence, different combinations of these two types of questions were presented.
The total population participating in PISA 2018 consisted of students aged between 15 years 3 months and 16 years 2 months from 79 participating countries. This results in the testing of around 600,000 students representing a total of 32 million students. With a focus on the target population for our analysis, the students and schools in Ireland and Spain that participated in the 2018 edition of PISA, consisted of 1,246 schools and 41,520 students.
Our sample consisted of schools with a minimum of 20 students and its students in line with previous research (Joaristi et al., 2014; Gamazo et al., 2017; Martínez Abad et al., 2017). In the case of Ireland, we refer to 155 schools and 5,551 students. In the case of Spain, we find 976 schools and 34,411 students that match this sampling strategy.
The variables that are included in the analysis are those that correspond to contextual factors (mainly socio-economic and demographic), and not to process issues (non-cognitive outcomes and student attitudes or issues related to the organization or pedagogical practices of schools). These variables are shown in Table 1 of which the coding given to each variable is shown in brackets.
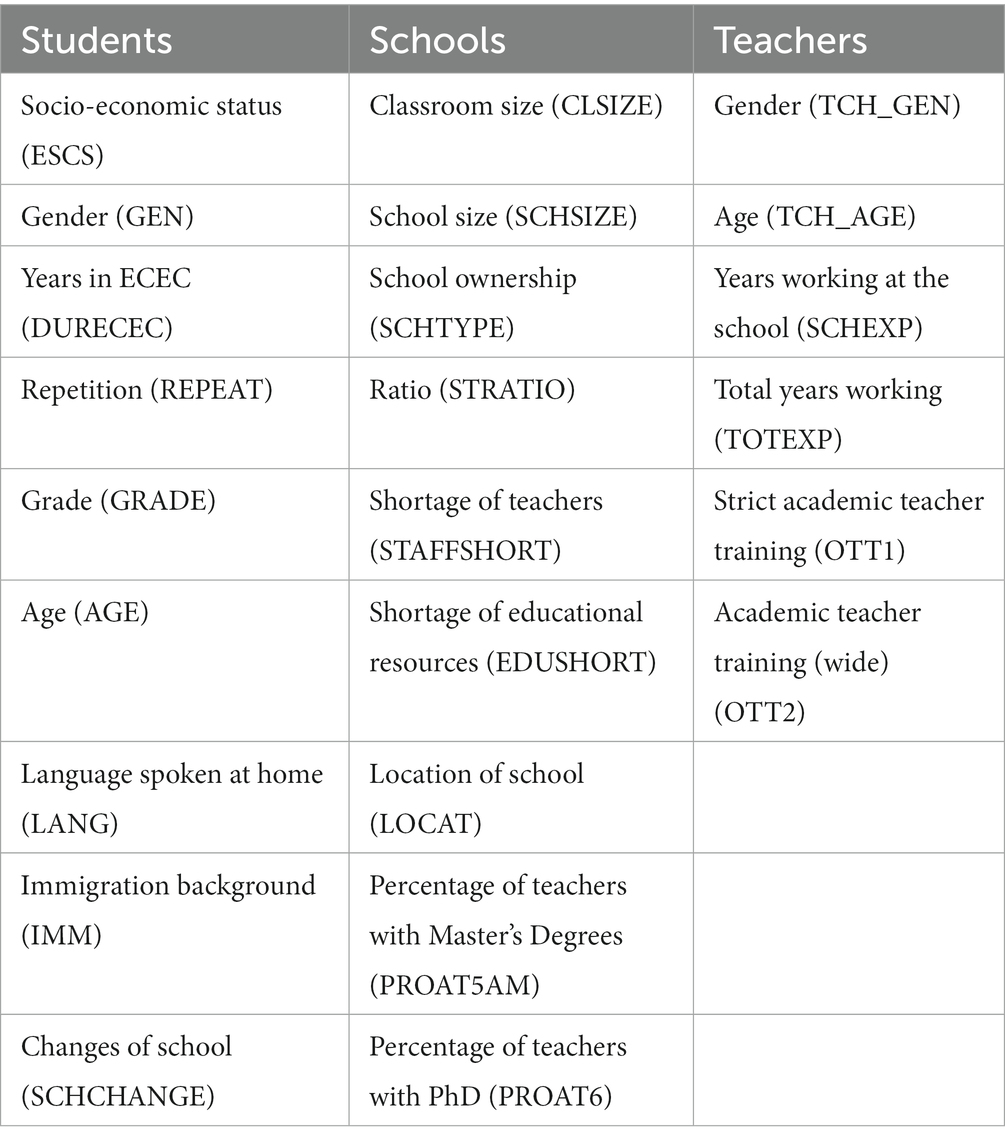
Table 1. Variables for the study of factors associated with academic performance based on the results of PISA 2018.
To avoid the inclusion of variables with a high percentage of missing values, a prior analysis of missing values was carried out using the same criterion as Gamazo and Martínez-Abad (2020), p. 5 who state that “All variables with high levels of missing values (more than 80%) were removed”. In other words, variables with missing values above 20% were not included in the analysis.
After performing this analysis, it was found that in the Spanish school database there is one variable with missing values above 20% (PROAT6) that was subsequently excluded from the multi-level modeling in Spain. For the remaining variables, with missing values below 20%, we estimated these values by applying the linear trend imputation model at the point. In the case of Ireland, the variable SCHTYPE, as no data is provided in the database. In the elaboration of the multi-level statistical models, we therefore included the variables indicated in Table 1, except for PROAT6 in the case of Spain and SCHTYPE in the case of Ireland.
To carry out this research we relied on a multi-level analysis methodology, continuing with the line of previous research in educational research (Aitkin and Longford, 1986; Raudenbush and Bryk, 1986; Goldstein, 1987; Gamazo García, 2019; Mang et al., 2021). As Gamazo indicates, “multi-level analysis is a statistical regression technique especially indicated for data sets in which there are observations nested in others of higher order” (2019, 114), in our case: students and schools. This methodology allows us to test both the influence of the different levels of analysis and the relationships between variables at these levels (Murillo, 2008), which is what is pursued in this research.
In conducting the multi-level study, we used HLM 7 software, which allowed us to include plausible values for each competency in the analyses, as well as sample weights for each level of study (students and schools). This allowed us to obtain less biased results in terms of variance and error estimation (Cai, 2013). In the case of the PISA tests, the sampling weights are indicated in the database itself.
Plausible values represent, in the words of Wu and Adams, “a representation of the range of abilities that can reasonably be assumed for a student” (Wu and Adams, 2002, p. 18). Sampling weights refer to the values that a student represents in relation to the total population. In PISA there are also sampling weights for schools, so that the sampling weight of a school will refer to the number of schools represented by that school based on its characteristics.
As cited in the PISA Technical Report itself, sampling weights are necessary for the analysis of the data provided by this large-scale test in order to make valid estimates and unbiased population inferences (OECD, 2018). According to this report, “sampling weights must be incorporated to ensure that each participating student represents the correct number of students in the total PISA population” (OECD, 2018, p. 1). This, together with the use of plausible values as output of students’ educational outcomes (Aparicio et al., 2021) constitutes the recommended statistical safeguards for the use of large-scale assessment databases.
In this case, there were two levels of analysis. On the one hand, the student level, whose data we collected from the student database provided by the OECD on PISA test scores in its 2018 iteration. On the other hand, the second level of our analysis concerned schools, whose data we obtained from the school database provided by the OECD also based on the 2018 PISA results and available in open access. Moreover, in the case of Spain, as we also had data referring to the personal and contextual characteristics of teachers, we included these data in the analyses, not as a third level, but as aggregated values according to the school to which the teachers belonged.
The modeling presents a mixed design of fixed slopes and random intercept (Gamazo et al., 2017; Ertem, 2021). The random intercept allows the dependent variable to have different values for each school. The fact that the values of the slopes are fixed implies that the effects of the different covariates included in the model remain fixed regardless of the school.
The next stage of the study involved the use of HLM 7.0 software in the following sequence:
1. Calculation of the null model and its corresponding Interclass Correlation Coefficient (ICC).
2. Construction of the models with the significant variables (p = 0.05).
3. Calculation of the goodness of fit of the models.
In any multi-level analysis it is necessary to check whether the data are nested by levels to assess the suitability of the methodology. This analysis of prior assumptions is done by calculating the ICC of the null model (a model composed only of the intercept, without any covariate), which reports the percentage of variance in the performance of the participating students that can be explained at the second level (schools). As a general rule, this percentage should be higher than 10% to be considered suitable for a multi-level analysis (Lee, 2000), and this is true for all skills in both countries (Table 2).
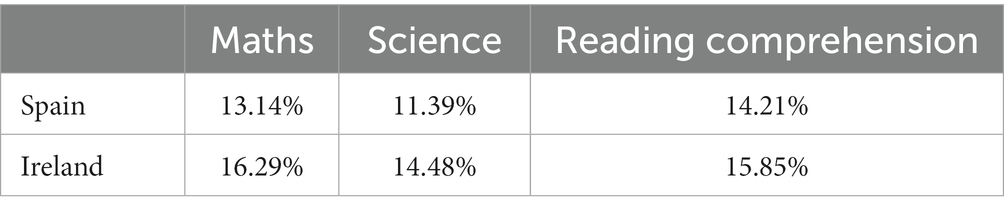
Table 2. Intraclass correlation coefficient of the null model.
After checking this prior assumption, and applying the steps mentioned in the method section of this paper, in each of the three competences in both countries, we obtained six statistical models, the results of which are presented in Tables 3–5.
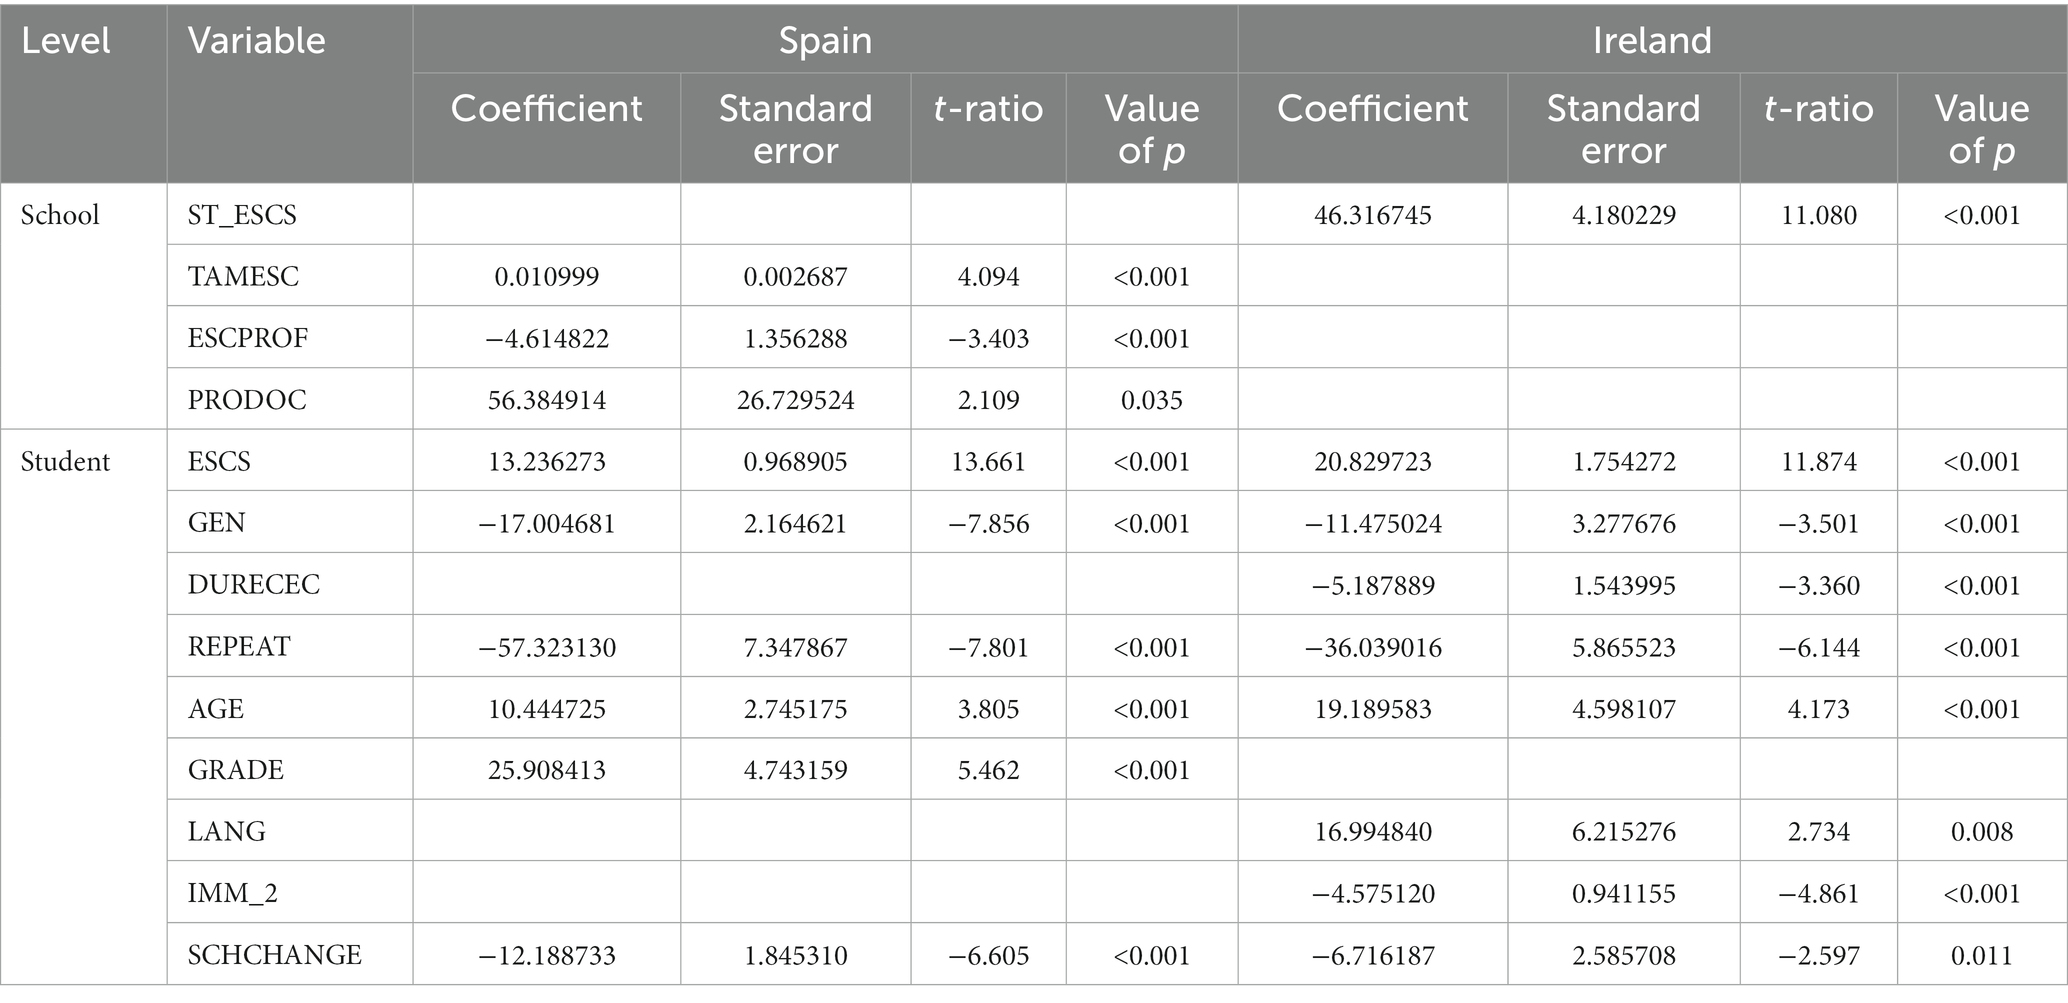
Table 3. Statistical multi-level final models of mathematical competence.
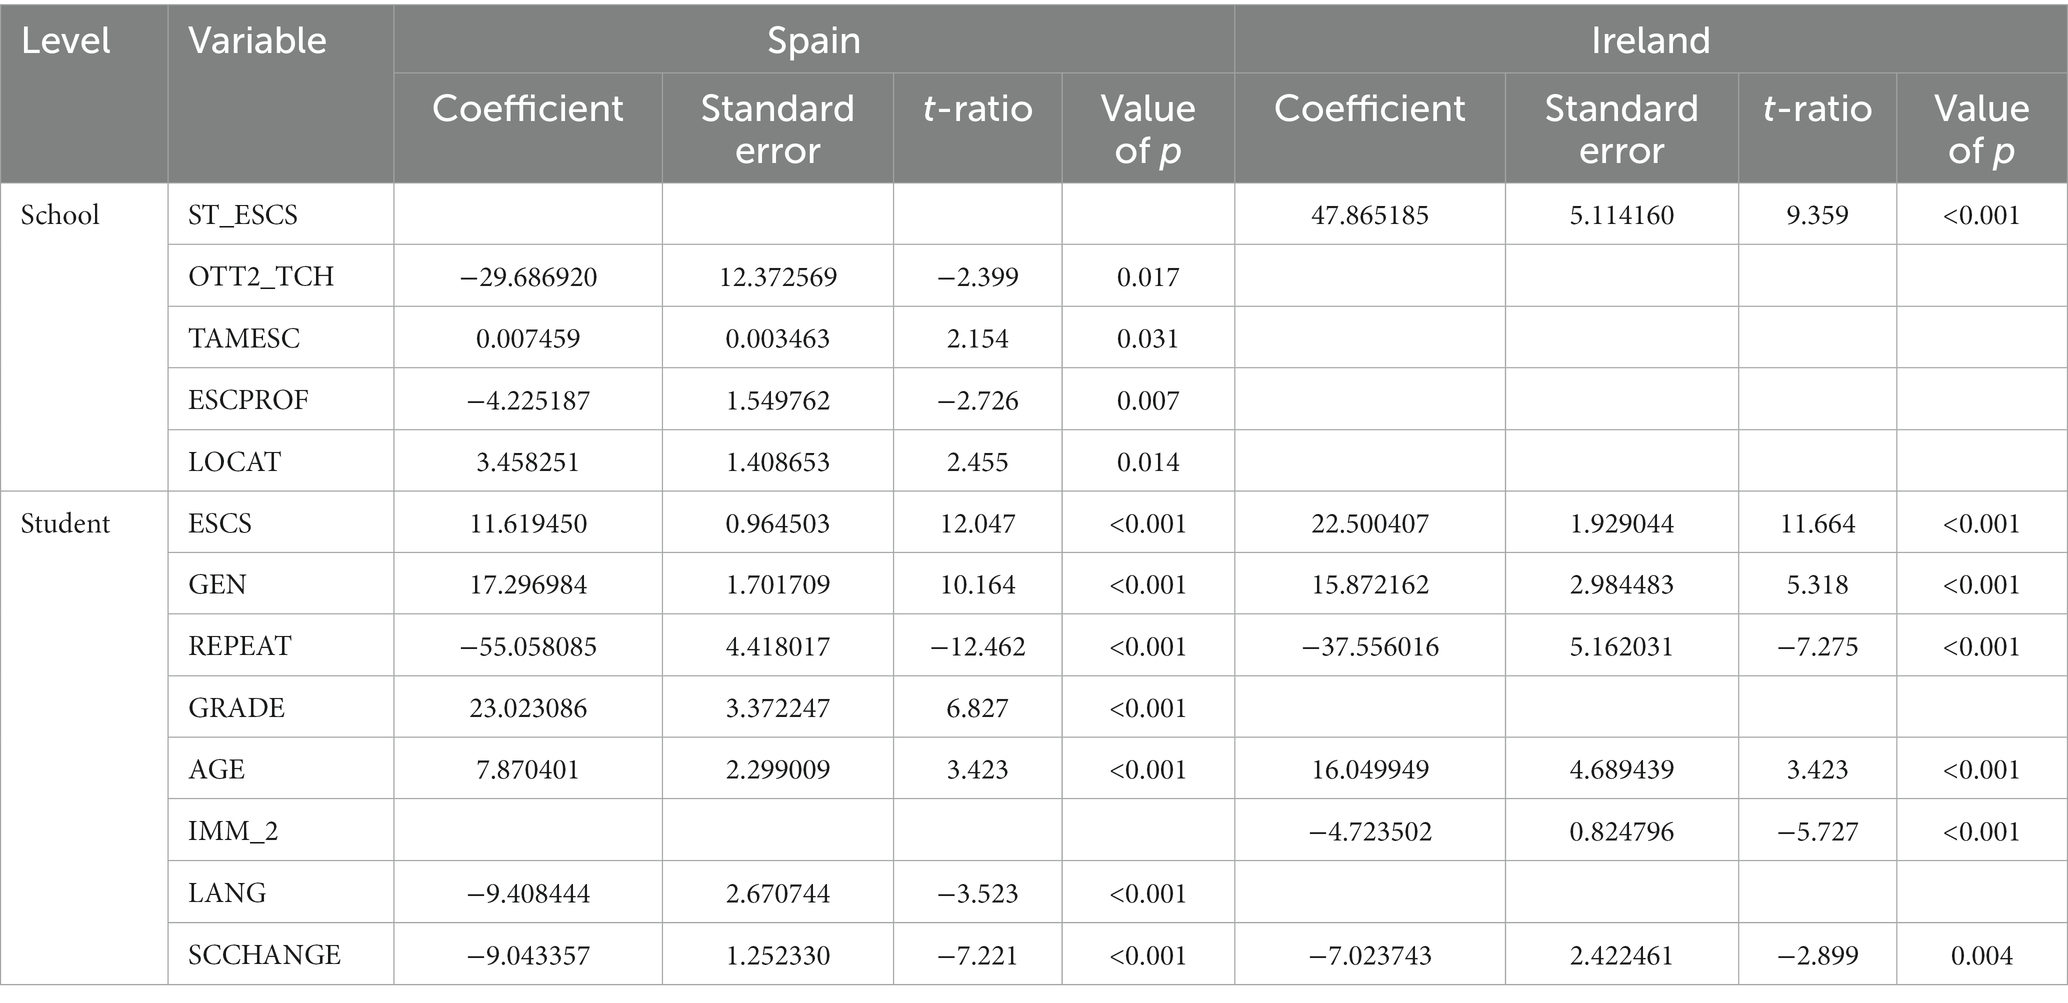
Table 4. Statistical multi-level final models of reading competence.
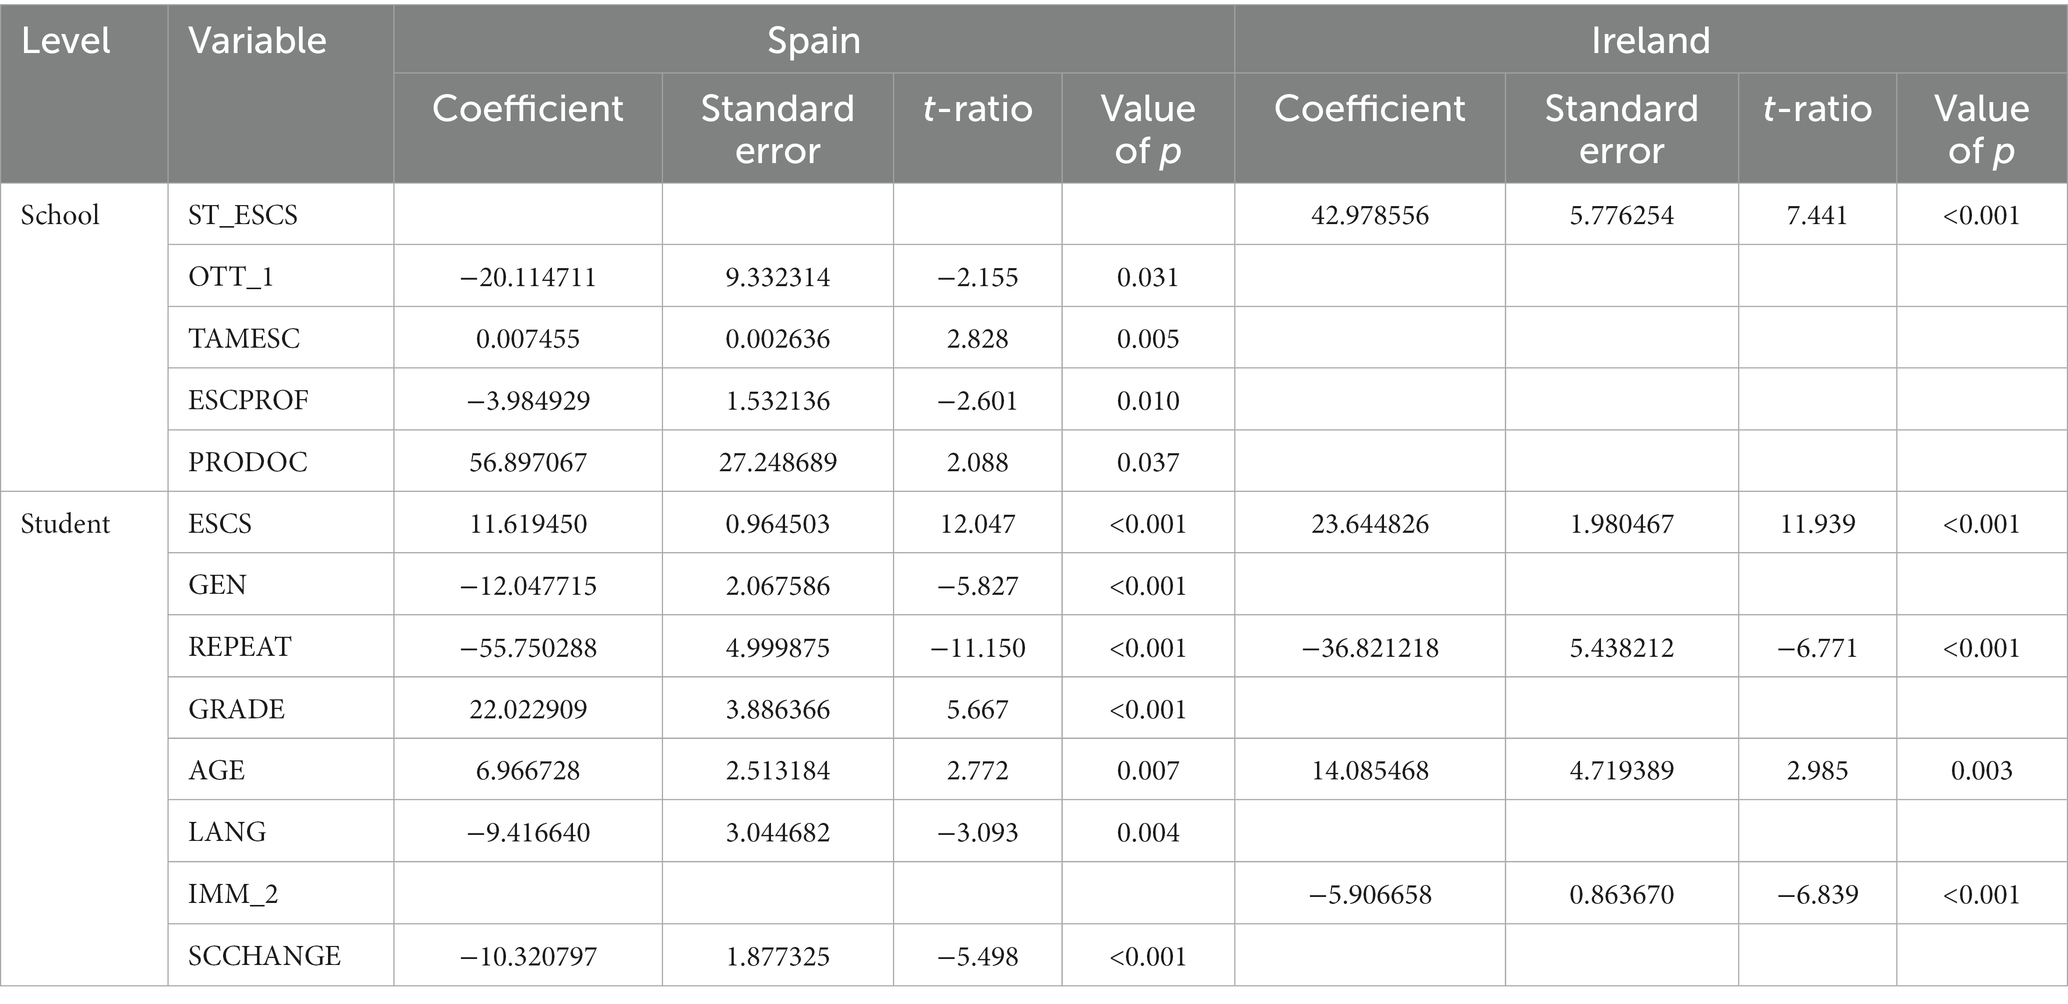
Table 5. Statistical multi-level final models of science competence.
The variables that made up the final model of mathematical competence are those included in Table 3. Regarding the weight of each of these variables in the statistical models, it was found that with no surprise, in both models the variable with the greatest positive influence on differences in student performance by school is socio-economic status. That is, the higher the socio-economic status of students, the higher their probability of obtaining better results in the PISA tests in this skill. Within the Spanish model, this variable has more relative relevance, as can be seen from its higher value in the t-ratio. However, if we compare the coefficients, we can see how in Ireland the impact of 1 point of difference in the ESCS variable is greater with the difference in performance being around 20 points, while in Spain the difference in performance is approximately 13 points.
On the other hand, if we focus on the variables that have a negative influence on students’ performance in mathematics, we find some differences here, as in the case of Spain this variable relates to the gender of the students, closely followed by grade repetition. In Ireland, it is this second variable, grade repetition, that has the strongest negative influence on performance in mathematical competence.
In the case of reading comprehension competence, the variables that make up this multi-level statistical model are those shown in Table 4. Within this, reading literacy proficiency shows similarities between the two countries studied in five student-level variables. These variables are socio-economic level, gender, repetition rate, age, and the number of school changes of students.
In the case of Spain, the final model for this competence is made up of four school-level variables and seven student-level variables, while in Ireland the model is made up of a total of seven variables, one of them at the school level and the other ones at the student level.
If we refer to the variables with the greatest positive and negative influence in each of the models, we find that, in both cases, the variable with the greatest negative influence on student performance is repetition. In Spain, there is an average difference of 55 points in performance between repeaters and non-repeaters; in the case of Ireland, this difference is smaller, around 37 points. The variable with the greatest positive influence is, in both cases, the socio-economic level of the students. This means that the higher the grade repetition, the lower the students expected performance in the PISA tests and the higher the socio-economic status, the higher the probability of high student performance in the proficiency under study. Analyzing the variables that make up the statistical models of science proficiency for both countries, we find only three common variables with all of these referring to student-level characteristics. Within this, the Spanish model consists of 11 variables with 4 of them at school-level. In contrast, the Irish model is made up of 5 variables, only one of which belongs to the school-level.
Table 5 presents the variables that make up the final model of science proficiency for both countries.
If we analyze those variables with the greatest positive and negative influence in each model; in Spain the greatest positive influence on student performance in science is on the socio-economic level of the students, while the negative influence on performance in science is concentrated on student repetition. In Ireland, the variable with the strongest positive influence is also student socio-economic status. In contrast, the variable with the strongest negative influence is the fact that the student is a second-generation immigrant, but this is closely followed by student repetition.
In order to check the fit of each of the models and in accordance with Raudenbush and Bryk (2002), we proceeded to calculate the Pseudo statistic, which is used to find out how much of the variance is explained at each level. To calculate this statistic for each of the levels, the variance components of the six models calculated (null and conditional for each competence) are used by applying the following equations (Equations 1, 2) expressed according to Hayes (2006). The results are reported as part of the Supplementary material.
Where:
is the variability among level 1 units and.
is the variability among level 2 units.
Table 6 presents the values of the indicated statistic for each competence and at each of the two levels studied.
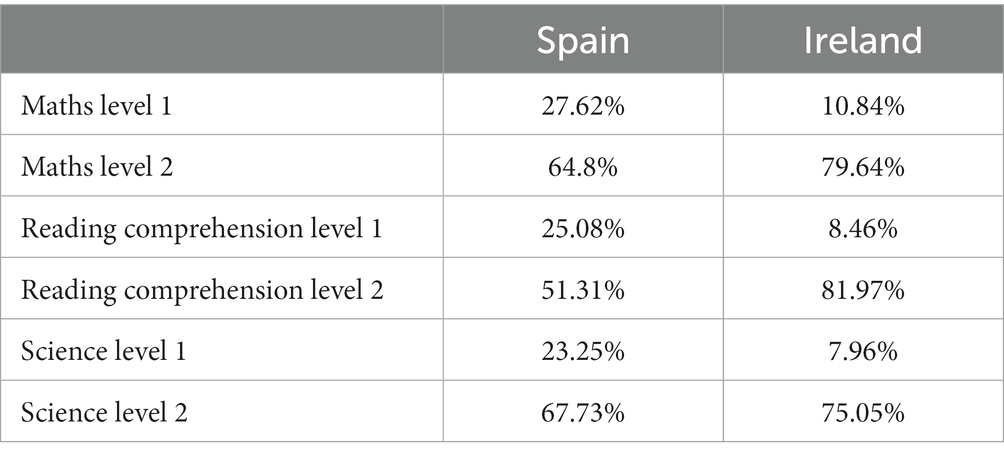
Table 6. Variance explained at each level.
These Pseudo values for the first level of analysis studied for the three skills in both countries ranged from 7.96% for science proficiency in Ireland to 27.62% for mathematics proficiency in Spain. Analyzing the values of this statistic at the second level of analysis, results ranged from 64.8% for mathematics in Spain to 81.97% for reading literacy in Spain and Ireland. The values of the above statistic follow a certain trend, with similarities such as always obtaining a higher value at the second level than at the first level in all competences in both countries. Furthermore, comparing the results for Spain and Ireland, Ireland presents higher values of Pseudo at the second level, while Spain does so at the first level, obtaining much higher percentages of explained variance than the Irish.
The aim of this research was to determine the contextual factors associated with the school performance of Spanish and Irish students in the three main competencies studied by the PISA tests to make a comparison between them. Applying multi-level modeling and starting from a series of variables based on the previous literature review, we obtained the final statistical models with the variables with a significant effect on each skill in each country, which allowed us to establish the similarities and differences between the different models, which have been presented previously in the results section of this study.
As has been shown, there are similarities in the patterns of the three competences both between Spain and Ireland and between the different competences in the same country. In fact, there are three variables that are repeated in all of them: the socio-economic level of the students, the repetition rate, and the age of the students. In line with previous studies where these are some factors that tend to appear more frequently with significant effects on students’ academic performance (Lenkeit, 2012; Huang and Sebastian, 2015; Julià Cano, 2016; Sortkær and Reimer, 2018), we observe that the three variables that are repeated in all the models have similar influences in each of the countries. Grade repetition has a negative influence on the performance of Spanish and Irish students in both mathematical competence, scientific competence and reading literacy, although with higher values in the case of Spain. In contrast, socio-economic status and the age of students have a positive influence on student performance in all three skills, with very similar values between the two countries (Tables 3–5).
Furthermore, there are similarities between the factors that make up the statistical models of the different competences of the same country. In the case of Spain, the variables that coincide in the three models developed are follows:
• At the school level, the shortage of teachers in the educational center and the size of the school, with the former variable having a positive influence on performance in the three competences, and the shortage of teachers having a negative influence.
• At the student level, socio-economic status, grade, age, gender, grade repetition rate and number of school changes. In this case, for the first three variables there is a positive influence on performance in the three subjects studied. On the other hand, repetition and the number of school changes have a negative influence on students’ performance in all three competences. The case of students’ gender is striking, since according to our statistical models and in line with previous literature, Spanish female students perform better in reading, while in STEM subjects, boys perform better. In this case we can infer that in the case of Spanish students there are differences in academic performance based on gender. The results obtained are in line with previous research in the field that supports, above all, the influence of gender on mathematics performance in favor of boys (Ruiz de Miguel and Castro Morera, 2006; Ruiz de Miguel, 2009; Burger and Walk, 2016; Sortkær and Reimer, 2018), as well as other studies that support our finding that girls perform better in reading comprehension (Shera, 2014; Julià Cano, 2016; Tan and Liu, 2018; Van Hek et al., 2018; Ertem, 2021).
In Ireland, the variables that coincide across the three models are:
• At the school level, the average socio-economic status of students in the school, with values associated with higher performance in all three competencies the higher this index is.
• At the student level, socio-economic status, student age, repetition rate and second-generation immigrant status are the variables with significant influence on the three competences. In this case, the first two of them lead to an increase in performance when the values are higher, while the last two are variables with a negative influence on the performance of Irish students.
These results are in line with previous research that studied variables related to students’ academic performance using PISA test data from different countries, including Ireland, such as the study by Rodríguez-Santero and Gil Flores (2018), in which socio-economic status is highlighted as a variable with an influence on academic performance. These authors also indicate that “lower performance has been found in immigrant students than in native students” (2018, 17), in line with other studies (Meunier, 2011; Martin et al., 2012).
Having described the main similarities and differences between the two countries’ models, it would be useful to analyze what might be the causes at the social and education system level that can help to explain them. Fundamentally, there are three striking issues that emerge: in Spain, the socio-economic status of students at school level is not significant, in Ireland it does not seem that the shortage of teachers affects student performance, and in Spain immigrant status is not a disadvantage for student performance.
Starting with the first point, the difference in significance of the average socio-economic level of the student body, it is worth analyzing whether there are differences between countries in terms of the social composition of the schools, i.e., to what extent the schools are homogeneous or heterogeneous with respect to the socio-economic level of their student body. To this end, we calculated the initial ICC for the variable ESCS in both countries. The results showed that in Spain, the school level is accountable for 24.5% of the variance of ESCS, while in Ireland it is 19.3%. While the data are somewhat dissimilar, it is not clear that the difference is enough to warrant the difference in the multi-level models. In this regard, for future research studies it would be worth investigating in greater depth why school-level ESCS level is significant in Spain but not in Ireland.
Furthermore, it is also worth analyzing issues related to the data provided by the ICCs of the countries. Firstly, the initial ICC value of each model in each country gives us valuable information about the level of equity of the education systems in terms of differences between schools. The ICC tells us to what extent there are differences in student performance that are attributable to the second level of analysis, i.e., the school. Thus, the higher this value, the more differences there are between schools in a country, or, in other words, the more the performance of a particular pupil varies according to the school where he or she is enrolled. For this reason, it is understood that the lower the ICC, the more equitable the system can be, since the differences between schools are smaller. In the present case, and as can be seen in Table 2, it can be observed that, although the figures for the Spanish models are slightly lower, both countries show a similar level of variability in performance attributable to the influence of the school.
To compare the variance explained by the variables at each of the levels of analysis, we use the Pseudo statistic, as indicated above. From these values we can determine that, as a rule and even though a greater number of significant variables referring to student characteristics appear in the final models, these variables explain smaller proportions of variance than those explained by the second level variables. While the explained variance percentage is acceptable in most cases (Ozili, 2022), the differences between the countries point to a need to search for more student-level predictors in the case of Ireland, and more school-level predictors in the case of Spain, since their respective figures are lower than the other countries.
In conclusion, and notwithstanding the results obtained, this study has acknowledged limitations that should be considered when assessing its results. Firstly, it is worth highlighting those limitations that are inherent to the database from which the analysis was taken. Although the PISA database is very broad and allows a large number of analyses to be carried out both within each country and comparatively, as in the case of the present study, there is a need to bear in mind that some of its intrinsic characteristics, such as its cross-sectional nature and the lack of data at the classroom level, are a limitation in terms of the scope of the results and the inferences that can be drawn from them. Furthermore, the present study is limited to the comparative analysis of two countries that are relatively close in terms of geographical location and cultural characteristics, so this may also be a limitation when considering aspects of the cultural, social, and economic macro-system that may have an impact on the results of the analysis. In this regard, with a view to future research, there are some issues that would be interesting to examine in greater depth to be able to interpret the results in a more meaningful and useful way that will help to improve the quality of education systems. Firstly, there is a need to study the possible social, economic, and cultural causes that may explain the differences in terms of which variables are significant in each country, to assess what possible measures may be appropriate to reduce their impact on student performance. Finally, it would also be of value to carry out an interaction analysis to check whether the variables that are significant in each of the models have any interaction relationship between them. This would help us to better understand the complex system of interconnection that exists between all the variables and to be able to establish measures aimed at mitigating their effects in a more informed and effective way.
Publicly available datasets were analyzed in this study. This data can be found at: https://www.oecd.org/pisa/data/2018database/ OECD PISA 2018 DATABASE.
CF-M: Conceptualization, Data curation, Formal analysis, Methodology, Visualization, Writing – original draft. JO’H: Conceptualization, Supervision, Writing – original draft. AG: Conceptualization, Methodology, Writing – review & editing. SO-M: Conceptualization, Supervision, Writing – review & editing. MB: Conceptualization, Validation, Writing – original draft.
The author(s) declare financial support was received for the research, authorship, and/or publication of this article. This work was supported by the Ministerio de Ciencia e Innovación from the Spanish Government [PID2021-125775NB-I00] (funded by MCIN/AEI/10.13039/501100011033/ and by FEDER A Way of Making Europe), and through a pre-doctoral grant [PRE2019-087412] associated with the project “Effective Schools for System Improvement (EFI-SEIS)” [PGC2018-099174-B-I00] funded by the same Ministry.
We would like to acknowledge the funding that has made this research possible. This paper has been funded by the Spanish Ministerio de Ciencia e Innovación through Grant PID2021-125775NB-I00 (funded by MCIN/AEI/10.13039/501100011033/ and by ERDF A Way of Making Europe), and though a pre-doctoral grant PRE2019-087412.
The authors declare that the research was conducted in the absence of any commercial or financial relationships that could be construed as a potential conflict of interest.
All claims expressed in this article are solely those of the authors and do not necessarily represent those of their affiliated organizations, or those of the publisher, the editors and the reviewers. Any product that may be evaluated in this article, or claim that may be made by its manufacturer, is not guaranteed or endorsed by the publisher.
The Supplementary material for this article can be found online at: https://www.frontiersin.org/articles/10.3389/feduc.2024.1306197/full#supplementary-material
Aitkin, M., and Longford, N. (1986). Statistical modelling issues in school effectiveness studies. J. R. Soc. Ser. A 149, 1–43. doi: 10.2307/2981882
Aparicio, J., Cordero, J. M., and Ortiz, L. (2021). Efficiency analysis with educational data: how to Deal with plausible values from international large-scale assessments. Mathematics 9:1579. doi: 10.3390/math9131579
Bandola-Gill, J., Grek, S., and Ronzani, M. (2021). “Beyond winners and losers: ranking visualizations as alignment devices in global public policy*” in Worlds of rankings research in the sociology of organizations. eds. L. Ringel, W. Espeland, M. Sauder, and T. Werron (Bingley, UK: Emerald Publishing Limited), 27–52.
Berliner, D. C. (2020). “The implications of understanding that PISA is simply another standardized achievement test” in Handbook of education policy studies: School/university, curriculum, and assessment. eds. G. Fan and T. S. Popkewitz, vol. 2 (Singapore: Springer), 239–258.
Bokhove, C., Miyazaki, M., Komatsu, K., Chino, K., Leung, A., and Mok, I. A. C. (2019). The role of opportunity to learn in the geometry curriculum: a multilevel comparison of six countries. Front. Educ. 4:63. doi: 10.3389/feduc.2019.00063
Breakspear, S. (2012). The policy impact of PISA: An exploration of the normative effects of international benchmarking in school system performance. Paris: OECD.
Brown, M., McNamara, G., and O’Hara, J. (2016). Quality and the rise of value-added in education: the case of Ireland. Policy Futur. Educ. 14, 810–829. doi: 10.1177/1478210316656506
Burger, K., and Walk, M. (2016). Can children break the cycle of disadvantage? Structure and agency in the transmission of education across generations. Soc. Psychol. Educ. 19, 695–713. doi: 10.1007/s11218-016-9361-y
Cai, T. (2013). Investigation of ways to handle sampling weights for multilevel model analyses. Sociol. Methodol. 43, 178–219. doi: 10.1177/0081175012460221
Costa, P., and Araújo, L. (2018). Skilled students and effective schools: Reading achievement in Denmark, Sweden, and France. Scand. J. Educ. Res. 62, 850–864. doi: 10.1080/00313831.2017.1307274
Crossley, M., and Watson, K. (2009). Comparative and international education: policy transfer, context sensitivity and professional development. Oxf. Rev. Educ. 35, 633–649. doi: 10.1080/03054980903216341
Drew, E., and Healy, C. (2006). Quality management approaches in Irish organisations. TQM Mag. 18, 358–371. doi: 10.1108/09544780610671039
Ertem, H. Y. (2021). Examination of Turkey’s PISA 2018 reading literacy scores within student- level and school-level variables. Particip. Educ. Res. 8, 248–264. doi: 10.17275/per.21.14.8.1
Feniger, Y., and Lefstein, A. (2014). How not to reason with PISA data: an ironic investigation. J. Educ. Policy. 29, 845–855. doi: 10.1080/02680939.2014.892156
Gamazo García, A. (2019). Factores asociados al rendimiento y a la eficacia escolar: un estudio basado en métodos mixtos a partir de pisa 2015. Available at: https://dialnet.unirioja.es/servlet/tesis?codigo=263239 (Accessed September 30, 2021).
Gamazo, A., Martínez Abad, F., Olmos Migueláñez, S., and Rodríguez Conde, M. J. (2017). Assessment of factors related to school effectiveness in PISA 2015. A multilevel analysis. Rev. Educ. 2017, 56–78. doi: 10.4438/1988-592X-RE-2017-379-369
Gamazo, A., and Martínez-Abad, F. (2020). An exploration of factors linked to academic performance in PISA 2018 through data mining techniques. Front. Psychol. 11, 1–17. doi: 10.3389/fpsyg.2020.575167
Grek, S. (2009). Governing by numbers: the PISA ‘effect’ in Europe. J. Educ. Policy 24, 23–37. doi: 10.1080/02680930802412669
Grek, S. (2021). Fabricating non-knowledge: international organizations and the numerical construction of an evaluative world. A research agenda for evaluation. Cheltenham: Edward Elgar, pp. 63–80. Available at: https://www.research.ed.ac.uk/en/publications/fabricating-non-knowledge-international-organizations-and-the-num (Accessed September 16, 2022).
Hayes, A. F. (2006). A Primer on Multilevel Modeling. Hum. Commun. Res. 32, 385–410. doi: 10.1111/j.1468-2958.2006.00281.x
Hopfenbeck, T. N., Lenkeit, J., El Masri, Y., Cantrell, K., Ryan, J., and Baird, J.-A. (2018). Lessons learned from PISA: a systematic review of peer-reviewed articles on the Programme for international student assessment. Scand. J. Educ. Res. 62, 333–353. doi: 10.1080/00313831.2016.1258726
Huang, H., and Sebastian, J. (2015). The role of schools in bridging within-school achievement gaps based on socioeconomic status: a cross-national comparative study. Compare 45, 501–525. doi: 10.1080/03057925.2014.905103
Jarke, J., and Breiter, A. (2019). Editorial: the datafication of education. Learn. Media Technol. 44, 1–6. doi: 10.1080/17439884.2019.1573833
Joaristi, L., Lizasoain, L., and Azpillaga, V. (2014). Detección y caracterización de los centros escolares de alta eficacia de la Comunidad Autónoma del País Vasco mediante Modelos Transversales Contextualizados y Modelos Jerárquicos Lineales. Estud. Educ. 27, 37–61. doi: 10.15581/004.27.37-61
Julià Cano, A. (2016). Contexto escolar y desigualdad de género en el rendimiento de comprensión lectora. REIS: Revista Española de Investigaciones Sociológicas, pp. 41–58.
Kumar, K. (2010). Quality in education: competing concepts. Contemp. Educ. Dialogue 7, 7–18. doi: 10.1177/0973184913411197
Lee, V. E. (2000). Using hierarchical linear modeling to study social contexts: the case of school effects. Educ. Psychol. 35, 125–141. doi: 10.1207/S15326985EP3502_6
Lenkeit, J. (2012). How effective are educational systems? A value-added approach to study trends in PIRLS. J. Educ. Res. Online 4:26.
Lingard, B., Martino, W., Rezai-Rashti, G., and Sellar, S. (2015). Globalizing educational accountabilities. New York: Routledge.
Loveless, T. (2013). Attention OECD-PISA: your silence on China is wrong. Brookings Institute. Available at: https://www.brookings.edu/research/attention-oecd-pisa-your-silence-on-china-is-wrong/ (Accessed September 15, 2022).
Mang, J., Küchenhoff, H., Meinck, S., and Prenzel, M. (2021). Sampling weights in multilevel modelling: an investigation using PISA sampling structures. Large Scale Assess. Educ. 9:6. doi: 10.1186/s40536-021-00099-0
Martin, A. J., Liem, G. A. D., Mok, M. M. C., and Xu, J. (2012). Problem solving and immigrant student mathematics and science achievement: multination findings from the Programme for international student assessment (PISA). J. Educ. Psychol. 104, 1054–1073. doi: 10.1037/a0029152
Martínez Abad, F., Lizasoain Hernández, L., Castro Morera, M., and Joaristi Olariaga, L. M. (2017). Selección de escuelas de alta y baja eficacia en Baja California (México). Rev. Electrón. Investig. Educ. 19, 38–53. doi: 10.24320/redie.2017.19.2.960
Meunier, M. (2011). Immigration and student achievement: evidence from Switzerland. Econ. Educ. Rev. 30, 16–38. doi: 10.1016/j.econedurev.2010.06.017
Ministerio de Educación y Formación Profesional, Gobierno de España . (2019a). PISA 2018. Programa para la Evaluación Internacional de los Estudiantes. Informe español (Volumen I).
Ministerio de Educación y Formación Profesional, Gobierno de España . (2019b). Preguntas Frecuentes sobre PISA.
Moss, P. A. (1992). Shifting conceptions of validity in educational measurement: Implications for performance assessment. Rev. Educ. Res. 62, 229–258. doi: 10.3102/00346543062003229
Murillo, F. J. (2008). Los modelos multinivel como herramienta para la investigación educativa. Magis 1, 45–62.
OECD . (2018). PISA 2018 technical report. Chapter 8: survey weighting and the calculation of sampling variance. Available at: https://www.oecd.org/pisa/data/pisa2018technicalreport/PISA2018%20TecReport-Ch-08-Survey-Weights.pdf.
OECD . (2022). PISA 2022 assessment and analytical framework. PISA - Programme for international student assessment. Available at: https://www.oecd.org/pisa/publications/pisa-2021-assessment-and-analytical-framework.htm (Accessed September 16, 2022).
Ozili, P. (2022). The acceptable R-square in empirical modelling for social science research. SSRN Electron. J. doi: 10.2139/ssrn.4128165
Raudenbush, S., and Bryk, A. S. (1986). A hierarchical model for studying school effects. Sociol. Educ. 59, 1–17. doi: 10.2307/2112482
Raudenbush, S. W., and Bryk, A. S. (2002). Hierarchical linear models: Applications and data analysis methods. Thousand Oaks, CA: Sage.
Rodríguez-Santero, J., and Gil Flores, J. (2018). Variables contextuales asociadas a las diferencias de rendimiento educativo entre los países de la Unión Europea. Contextual variables associated with differences in educational performance between European Union countries. Available at: https://idus.us.es/handle/11441/87851 (Accessed July 27, 2022).
Ruiz de Miguel, C. (2009). Las escuelas eficaces: un estudio multinivel de factores explicativos del rendimiento escolar en el área de matemáticas. Rev. Educ. 2009, 355–376.
Ruiz de Miguel, C., and Castro Morera, M. (2006). Un Estudio Multinivel Basado en PISA 2003: Factores de Eficacia Escolar en el área de Matemáticas. Educ. Policy Anal. Arch. 14, 1–26.
Seitzer, H., Niemann, D., and Martens, K. (2021). Placing PISA in perspective: the OECD’s multi-centric view on education. Glob. Soc. Educ. 19, 198–212. doi: 10.1080/14767724.2021.1878017
Shera, P. (2014). School effects, gender and socioeconomic differences in Reading performance: a multilevel analysis. Int. Educ. Stud. 7:p28. doi: 10.5539/ies.v7n11p28
Sjøberg, S. (2015). “OECD, PISA, and globalization: the influence of the international assessment regime” in Education policy perils. Tackling the tough issues. eds. C. H. Tienken and C. A. Mullen (Abingdon: Routledge), 114–145.
Sjøberg, S., and Jenkins, E. (2022). PISA: a political project and a research agenda. Stud. Sci. Educ. 58, 1–14. doi: 10.1080/03057267.2020.1824473
Sortkær, B., and Reimer, D. (2018). Classroom disciplinary climate of schools and gender – evidence from the Nordic countries. Sch. Eff. Sch. Improv. 29, 511–528. doi: 10.1080/09243453.2018.1460382
Tan, C. Y., and Liu, D. (2018). What is the influence of cultural capital on student reading achievement in Confucian as compared to non-Confucian heritage societies? Compare 48, 896–914. doi: 10.1080/03057925.2017.1369392
Van Hek, M., Kraaykamp, G., and Pelzer, B. (2018). Do schools affect girls’ and boys’ reading performance differently? A multilevel study on the gendered effects of school resources and school practices. Sch. Eff. Sch. Improv. 29, 1–21. doi: 10.1080/09243453.2017.1382540
Wu, H., Gao, X., and Shen, J. (2020). Principal leadership effects on student achievement: a multilevel analysis using Programme for international student assessment 2015 data. Educ. Stud. 46, 316–336. doi: 10.1080/03055698.2019.1584853
Keywords: performance, quality, outcomes, adolescents, PISA
Citation: Frade-Martínez C, O’Hara J, Gamazo A, Olmos-Migueláñez S and Brown M (2024) A multilevel investigation of factors related to achievement in Ireland and Spain using PISA data. Front. Educ. 9:1306197. doi: 10.3389/feduc.2024.1306197
Edited by:
Aldo Bazán-Ramírez, Universidad Nacional José María Arguedas, PeruReviewed by:
Eduardo Hernández-Padilla, Autonomous University of the State of Morelos, MexicoCopyright © 2024 Frade-Martínez, O’Hara, Gamazo, Olmos-Migueláñez and Brown. This is an open-access article distributed under the terms of the Creative Commons Attribution License (CC BY). The use, distribution or reproduction in other forums is permitted, provided the original author(s) and the copyright owner(s) are credited and that the original publication in this journal is cited, in accordance with accepted academic practice. No use, distribution or reproduction is permitted which does not comply with these terms.
*Correspondence: Cristina Frade-Martínez, Y3Jpc3RpbmEuZnJhZGVAdXNhbC5lcw==
Disclaimer: All claims expressed in this article are solely those of the authors and do not necessarily represent those of their affiliated organizations, or those of the publisher, the editors and the reviewers. Any product that may be evaluated in this article or claim that may be made by its manufacturer is not guaranteed or endorsed by the publisher.
Research integrity at Frontiers
Learn more about the work of our research integrity team to safeguard the quality of each article we publish.