 Lientje Maas
 Matthew J. Madison
 Matthieu J. S. Brinkhuis
- 1Department of Methodology and Statistics, Utrecht University, Utrecht, Netherlands
- 2Department of Educational Psychology, University of Georgia, Athens, GA, United States
- 3Department of Information and Computing Sciences, Utrecht University, Utrecht, Netherlands
Diagnostic classification models (DCMs) are psychometric models that yield probabilistic classifications of respondents according to a set of discrete latent variables. The current study examines the recently introduced one-parameter log-linear cognitive diagnosis model (1-PLCDM), which has increased interpretability compared with general DCMs due to useful measurement properties like sum score sufficiency and invariance properties. We demonstrate its equivalence with the Latent Class/Rasch Model and discuss interpretational consequences. The model is further examined in a DCM framework. We demonstrate the sum score sufficiency property and we derive an expression for the cut score for mastery classification. It is shown by means of a simulation study that the 1-PLCDM is fairly robust to model constraint violations in terms of classification accuracy and reliability. This robustness in combination with useful measurement properties and ease of interpretation can make the model attractive for stakeholders to apply in various assessment settings.
1 Introduction
Diagnostic classification models (DCMs; Rupp et al., 2010) are psychometric models that yield probabilistic classifications of respondents according to a set of discrete latent variables, which are referred to as attributes. In educational measurement, these attributes generally represent skills, abilities, and cognitive processes required to solve certain items. Classifying respondents in terms of mastery of these attributes results in attribute profiles that indicate which attributes are mastered and which are not. If assessments provide valid and reliable measurements of attributes, this diagnostic information enables the provision of fine-grained, actionable feedback to teachers and students (see e.g., Gierl et al., 2010; Maas et al., 2022a). To this end, DCMs need to be implemented in practical settings, which generally involves multiple stakeholders, including psychometricians, educational organizations, teachers, and students. From a psychometric perspective, the objective is to obtain an acceptable measurement of students' proficiency given the data. In a DCM framework, this may require the estimation of possibly complex DCMs to obtain accurate classifications of students based on their item responses. Yet the interpretation of resulting model parameter estimates is not always straightforward, even for experienced psychometricians (Bradshaw and Levy, 2019). From an educational perspective, it is desirable that model results can be easily interpreted and that one can explain how classifications are established. Simpler DCMs generally have more straightforward interpretations, which advocate their use in practical applications, provided that the classifications are sufficiently accurate and reliable. In the current study, we examine a simple DCM with properties that make the model attractive for educational practice: the one-parameter log-linear cognitive diagnosis model (1-PLCDM; Madison et al., 2023). We aim to contribute to the foundational development of this recently introduced model to allow implementation in practice.
Although historically many different DCMs have been developed separately, there exist general diagnostic modeling frameworks like the log-linear cognitive diagnosis model (LCDM; Rupp et al., 2010), the general diagnostic model (GDM; von Davier, 2008) and the generalized deterministic inputs, noisy “and” gate model (G-DINA; de la Torre, 2011). These frameworks subsume more specific DCMs that can be obtained by placing statistical constraints on model parameters. These varying DCMs make different assumptions about the mechanisms underlying item response behavior (e.g., whether or not non-mastery of an attribute can be compensated by mastery of another), which are reflected in the item response functions. The selection of a specific model can stem from a variety of considerations, including substantive reasons, explainability, estimation complexity, and model fit (Ma et al., 2016). Although complex DCMs can fit the data better, the reduction in fit when using simpler DCMs may be worth the sacrifice if it results in desirable assessment interpretations, i.e., there is a trade-off between model interpretability and accuracy. For example, despite being a simple and extremely constrained model, the deterministic inputs, noisy “and” gate model (DINA; de la Torre, 2009) is the most applied DCM in empirical studies (Sessoms and Henson, 2018). This shows that model simplicity is highly valued by researchers and practitioners. This is similar to modeling choices for assessment systems that are based on item response theory (IRT), for which it is not uncommon to use the Rasch or 1-parameter logistic (1-PL) model due to their useful measurement properties like sum score sufficiency and invariant measurement, even though more complex IRT models are likely to fit the data better (Zwitser and Maris, 2015; Barney and Fisher, 2016; Stemler and Naples, 2021).
Simple DCMs are still being developed to adhere to this preference for simplicity. Recently, a new and simple DCM has been proposed that favors interpretability over complexity, and therefore potentially the accuracy of the model. This model has been called the one-parameter log-linear cognitive diagnosis model (1-PLCDM; Madison et al., 2023) and can be obtained by imposing item parameter constraints on the LCDM. The 1-PLCDM estimates an intercept for each item and a single main effect across all items measuring the same attribute, as will be described in more detail further below. In this way, the model is somewhat similar to the Rasch model and the 1-PL IRT model, which include a difficulty parameter for each item and a single discrimination parameter across all items (DeMars, 2010). Madison et al. (2023) introduced the 1-PLCDM and demonstrated desirable measurement properties of the model in a single-attribute setting based on an empirical dataset, namely sum score sufficiency and invariant measurement. The purpose of the current study is to describe the mathematical foundations of the model and to examine its robustness to constraint violations under varying conditions by means of a simulation study.
Although the 1-PLCDM can be defined for a multidimensional setting, the current study is focused on the unidimensional case to provide initial insight in the properties and performance of the model. Most DCMs in the literature are multidimensional, yet this unidimensional 1-PLCDM is worthy of examination. There exist several examples of the use of unidimensional DCMs, both in research and practice (e.g., Templin and Bradshaw, 2013; Madison, 2019; Dynamic Learning Maps Consortium, 2021). While varying psychometric models can be used in a unidimensional setting, if the goal is to classify students rather than locating them on a latent scale, a unidimensional DCM is appropriate from a validity and reliability perspective (Templin and Bradshaw, 2013) and the 1-PLCDM has properties that give the model added value beyond the benefits of existing DCMs. Moreover, future work can build upon our initial insights and extend the results to multidimensional settings. We start by discussing the model properties and their benefits in more detail. Subsequently, we describe how we extend the empirical demonstration of sum score sufficiency with analytic derivations and how we perform a simulation study to examine to what extent the 1-PLCDM sacrifices model performance in order to obtain the properties.
1.1 Sum scores for mastery classification
In general, for DCM-based classification, it not only matters how many items are answered correctly but also which items. Consequently, two respondents with the same number-correct scores but different patterns of items correct may have different attribute profiles. Although it can be viewed as a benefit that DCMs can handle such data, it also entails some challenges. If stakeholders compare their scores, it can be difficult for them to understand how the same number-correct scores result in different outcomes. Moreover, the analysis of item responses with DCMs generally requires statistical software to compute attribute mastery probabilities. If, by contrast, predetermined sum score cut points can define attribute mastery vs. non-mastery, this is no longer a requirement and intuitively appealing sum scores can be used. This is especially useful for small scale applications in classroom assessment, for which psychometric analysis of item response data is uncommon and can be difficult due to limited resources.
To achieve this, Henson et al. (2007) proposed a simulation-based method for estimating sum score cutpoints as an approximation to full model-based estimation of attribute mastery in a DCM framework. Results showed that these methods can provide reasonably accurate classifications, yet they do not provide an indication of the certainty of the classifications and, moreover, very little is known about the robustness of these approaches. The 1-PLCDM may partly overcome these challenges. Madison et al. (2023) showed for an empirical dataset that sum scores were sufficient statistics to estimate attribute mastery probabilities with the 1-PLCDM. More specifically, there was a one-to-one relationship such that each sum score mapped to exactly one posterior mastery probability. The current study will show that this property holds in general for the 1-PLCDM. As a result, the same number-correct scores result in the same classification and sum scores can be used for mastery classification.
1.2 Invariant measurement
In addition to sum score sufficiency, Madison et al. (2023) showed that the 1-PLCDM can yield invariant measurement. Invariant measurement allows to make inferences that generalize beyond the particular item set that is answered and beyond the particular group of respondents used to calibrate the items (Engelhard, 2013). Several properties contribute to invariant measurement. First, there is the invariant person ordering property, stating that correct response probabilities increase with increasing proficiency. Analogously, the invariant item ordering property states that if an item has a higher correct response probability than another item for a person, it must have a higher correct response probability for all persons. Both properties were demonstrated by Madison et al. (2023) for the 1-PLCDM. Further, person-invariant item calibration and item-invariant person measurement were empirically demonstrated. This means that item parameter estimates are independent of the sample used for calibration (“sample-free” measurement) and that mastery classifications are independent of the item set that is administered (“item-free” measurement), respectively. This is relevant for DCMs, because it facilitates the practical use of assessments for new samples after calibration. An initial calibration sample can be used to estimate item parameters and then those parameters can be used to score new students (as in the Rasch model; Rasch, 1960; Lord, 1980). Note that illustration of these properties is not novel for DCMs; earlier simulation studies have shown sample- and item-free measurement for both specific and general DCMs. These are theoretical properties that only hold with perfect model-data fit. In practice, samples will always contain some variability from the population and perfect invariance will not be observed.
1.3 Current study
Since simple, reduced DCMs can be valuable in practical applications in order to afford useful measurement properties, it is important that the mathematical underpinnings as well as the impact of violations on model performance are well-understood. In the first part of the current study, we show that the 1-PLCDM is, in fact, a special case of the Latent Class/Rasch Model (LC/RM; Formann, 1995) and we discuss what this means. By demonstrating this equivalence, we bridge two modeling frameworks that are often separated, namely DCM and IRT/Rasch. Similar to the LC/RM, sum scores are sufficient statistics to estimate mastery probabilities with the 1-PLCDM, which we demonstrate based on the likelihood of the model. In addition, an expression for the cut score for mastery classification is derived.
In the second part of the study, we perform a simulation study to evaluate model performance. We examine the robustness of the 1-PLCDM to violations of the imposed constraints in terms of classification accuracy, reliability, and model fit. Model results are compared with the results from the LCDM to evaluate to what extent model performance is reduced by imposing the constraints. Providing insight into the degree of reduction in model performance of the 1-PLCDM enables one to make informed modeling choices. In addition, we evaluated how accurate the 1-PLCDM can estimate the cut score and how this impacts classification accuracy when the cut score is used to classify new respondents. Based on the results of the simulation study, it can be decided whether the aforementioned measurement properties are worth the sacrifice in performance.
The current study provides unique contributions to the development of the 1-PLCDM (beyond the results from Madison et al., 2023), namely (1) insight in the mathematical foundations by demonstrating equivalent models, (2) an analytic expression for the cut score for mastery classification, (3) evaluation of robustness to constraint violations, and (4) evaluation of cut score recovery and how this impacts classification accuracy when classifying new respondents.
2 Part 1: model properties
2.1 Introducing the 1-PLCDM
Diagnostic classification models are restricted latent class models that are used to classify respondents in a restricted number of latent classes, i.e., attribute profiles. In a single-attribute setting, there are two latent classes denoted by αc (c = 1, 2), namely α1 = 0, which means the attribute is not mastered, and α2 = 1, which means it is mastered. Let xri be the dichotomously scored response to item i (i = 1, .., I) by respondent r (r = 1, .., R), which equals 0 or 1 for an incorrect or correct response, respectively, and let πci denote the probability that a respondent in latent class αc responds correctly to item i. Further, let xr = [xr1, …, xrI] be the response pattern of respondent r. The conditional probability of response pattern xr given attribute profile αc equals:
The product term is a consequence of the assumption of local independence, i.e., item responses are independent conditional on the latent class of the respondent. The unconditional probability of response pattern xr is obtained by weighting Equation (1) with the proportional latent class sizes νc and summing up both classes. This results in the expression in Equation (2):
Since there are two latent classes, the proportional latent class sizes ν1 and ν2 add up to 1. The item response probabilities πci can be subjected to several types of constraints, reflecting different mechanisms underlying item response behavior. The 1-PLCDM estimates an intercept for each item and a single main effect across all items (in contrast to general DCMs that estimate a main effect for each item). The 1-PLCDM models the conditional probability πci as follows:
For each item i, the exponent includes an intercept term (λi, 0) that represents the logit of a correct response for non-masters. Further, there is one main effect (λ1; note the absence of a subscript i) that indicates the difference in the logit of a correct response between non-masters and masters.1 The main effect is subject to monotonicity constraints to ensure that the probability of a correct response increases monotonically for masters compared to non-masters (i.e., λ1>0).
2.2 Equivalent models
The 1-PLCDM has solely been viewed in a DCM framework by Madison et al. (2023). However, one can recognize the item response function in Equation (3) as a specific case of the item characteristic curve of the Latent Class/Rasch Model (LC/RM) that was introduced by Formann (1995). This is a linear logistic latent class model that assumes that both items and classes are ordered. The position of each item i on the underlying latent continuum is described by a single location parameter βi and of each class c by θc, combined in the item characteristic curves as follows:
Equation (4) corresponds to Equation (13.10) from Formann (1995). The parameter θc is similar to the ability parameter in the well-known Rasch model. Yet rather than estimating an ability parameter for each respondent, the LC/RM estimates one ability parameter for each latent class. We can directly see that the 1-PLCDM is equivalent to a constrained LC/RM, namely an LC/RM with two latent classes (c = 1, 2) where θ1 = 0 and θ2>0. A critical issue with equivalent models is that they can provide different explanations of the same data. Equivalent models cannot be distinguished in terms of goodness of fit, i.e., the data cannot distinguish the different interpretations (MacCallum et al., 1993). For an example of equivalent psychometric models, see Maris and Bechger (2004), who demonstrate the equivalence between the Linear Logistic Test Model (LLTM; Fischer, 1995) and the model with internal restrictions on item difficulty (MIRID; Butter et al., 1998).
The 1-PLCDM and the LC/RM both separate two latent classes, but the 1-PLCDM defines ability by latent class membership (non-master vs. master) whereas the LC/RM positions the classes on a latent ability continuum. The parameter θ2 of the LC/RM is viewed as a person parameter that represents the ability of latent class c = 2 (on a latent scale). This parameter is equivalent to the parameter λ1 of the 1-PLCDM, which is, by contrast, viewed as an item parameter that represents the increase in the logit of a correct response for any item given mastery of the measured attribute. Despite these different interpretations, it is not possible to distinguish between these competing interpretations, because both models explain the data equally well. Although the interpretations are slightly different, one could think of λ1 as a person parameter, since it represents the increased expected performance of masters compared to non-masters. Model equivalence is an issue if interpretations differ greatly, yet we believe the interpretation of the parameters of the 1-PLCDM and the constrained LC/RM are compatible. We continue to examine the model in a DCM framework.
2.3 Sum scores for mastery classification
In this section, we demonstrate that sum scores are sufficient statistics for mastery classifications and we derive an expression for the cut score. The likelihood of the 1-PLCDM can be expressed as2:
The likelihood in Equation (5) is a function of the summed scores across items (person number-correct scores: ) and across persons (item number-correct scores: ), and of the unknown model parameters. When the 1-PLCDM is fit to data from a diagnostic assessment and the model parameters are estimated, attribute classifications can be obtained. This is done in a Bayesian framework based on posterior probabilities of attribute mastery, which are derived from the response pattern via the likelihood and the prior probabilities of latent class membership. The posterior probabilities thus reflect accumulated evidence across a priori evidence about latent class membership in the population of interest and evidence from the observed item response data. Based on the posterior probabilities, respondents are classified as master or non-master. This is a model-based classification, which differs from more traditional approaches in which cut scores for mastery classification are generally determined via standard-setting procedures that rely on expert judgment (Kane and Wilson, 1984).
The posterior probability of belonging to latent class αc is given by:
In this expression, νc indicates the prior probability for αc (i.e., a priori evidence about latent class membership in the population of interest). If the posterior probability of being in latent class α2 is higher than a certain threshold τ, the respondent is classified as a master. Typically, τ is set to 0.5, such that posterior probabilities of mastery higher than 0.5 lead to classification as master. This assigns each respondent to their most likely class and yields the most accurate total classifications. Choosing τ = 0.5 is thus statistically the most optimal cutoff. Yet if misclassification in one direction outweighs that in the other direction, one may use a value greater or lower than 0.5 (Bradshaw and Levy, 2019). For example, in a formative assessment context, incorrectly classifying a non-master as a master may be more costly, since they may not receive the instructional support needed to achieve mastery. In that case, a value of τ higher than 0.5 can be chosen. This trade-off has to be evaluated before setting the threshold.
The expression in Equation (6) does not depend on the individual item responses, but only on the person number-correct score sr. This shows that the sum score is a sufficient statistic for the posterior probabilities of latent class membership. Therefore, all respondents with the same number-correct score will have the same estimated mastery probability and we can determine a cut score for mastery classification. If a respondent scores above this score, they are classified as a master of the attribute and otherwise as a non-master.
The posterior mastery probability can be expressed as in Equation (7):
To determine the cut score for mastery classification, we solve the inequality P(α2|xr) > τ for sr:
It can be seen that the cut score for classification as master depends not only on the threshold parameter (τ) and the item parameters (λi, 0 and λ1), but also on the ratio of the population base rate proportions of non-mastery and mastery (i.e., the prior probabilities of latent class membership ν1 and ν2). In DCM applications, these base rates are generally estimated from the available data, that is, they are empirically determined. Equation (8) shows that the cut score decreases if the mastery base rate increases. Henceforth, we use the term “base rate” to refer to the proportion of respondents who master the attribute (i.e., ν2). Recall that DCM item parameters are theoretically sample-free, meaning that item parameter estimates are independent of the sample used for calibration (Bradshaw and Madison, 2016). However, since the cut score also depends on the base rates, it is not expected that cut score estimates are sample-free. To give the reader a more meaningful impression of the influence of the base rates on cut scores, we simulated a set of item parameters (λi, 0~N(−1, 0.5) and λ1 = 2) and computed the cut scores at τ = 0.5 for different base rates and test lengths.3 The results can be found in Table 1, which shows that the cut scores vary by two points across base rates for each test length.
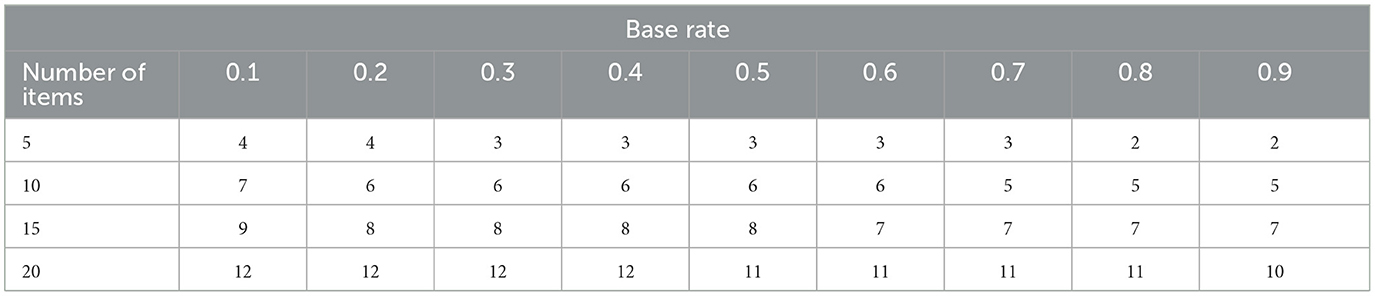
Table 1. Cut scores for mastery classification (at τ = 0.5) for different attribute mastery base rates and test lengths.
The influence of the base rate on respondent classifications will be stronger for shorter assessments, because less data (relative to the prior evidence) are available, i.e., there is less empirical evidence from the data in the likelihood to “counterbalance” the information provided by the data from the prior distribution. This is especially relevant for respondents who score close to the cut score, i.e., with a mastery probability close to the threshold τ. If the variance in cut scores across base rates is small relative to the test length, one could specify an indifference region for the cut score range, which means that respondents who score within this range are not classified. If this is not feasible, accurate estimates of the population base rates are needed to obtain accurate classifications of borderline respondents, which requires a representative sample for model estimation.
3 Part 2: model performance
3.1 Methods
The 1-PLCDM makes a strong assumption that main effects are equal across all items. We performed a simulation study to examine how violations to this assumption impact classification accuracy, reliability and model fit of the 1-PLCDM. In addition, we evaluated the accuracy of cut score estimation and we examined classification accuracy when scoring new respondents based on this estimated cut score.
3.1.1 Study design
In the simulation study, we generated data using the LCDM and estimated both the LCDM and the 1-PLCDM using the CDM package in R (George et al., 2016). The models were estimated using marginalized maximum likelihood estimation (MMLE), as described in de la Torre (2011), with a uniform prior distribution of the two attribute profiles. We did a brief simulation (results not included) to examine the impact of different prior attribute profile distributions (0.25, 0.50, 0.75) on model accuracy and reliability. Results indicated that the impact was negligible. Therefore, we chose the CDM package's default prior values of 0.50.
In generating item parameters, item difficulty and discrimination varied across items, but we fixed the overall test difficulty and quality. For each item, the intercept λi, 0 was sampled from a normal distribution with mean −1 and standard deviation 0.3 and the main effect λi, 1 was sampled from a truncated normal distribution on the interval [0.5, ∞) with a mean of 1.7 and varying standard deviations. This results in average correct response probabilities of 0.27 and 0.67 for non-masters and masters, respectively, and thus an average item discrimination of 0.40. Further, we manipulated four fully-crossed factors: main effects variance (4 levels), number of items (3 levels), sample size (3 levels), and base rate (3 levels), as is described next. The resulting 108 conditions were replicated 500 times.
Main effects variance
This factor was of main interest in the simulation, since the objective was to examine how violating the constraint of equal main effects impacts 1-PLCDM results. Four levels were used: zero, low, medium and high variance. This was achieved by setting the standard deviation of the truncated normal distribution from which the main effects λi, 1 were sampled to 0, 0.2, 0.6, and 1, respectively. These values reflect variances in main effects found in empirical data (see e.g., Bradshaw et al., 2014). The zero-variance condition corresponds to a correctly specified 1-PLCDM and the remaining conditions correspond to varying levels of 1-PLCDM misspecification.
Number of items
Since we are evaluating a single-attribute situation, as little as five items can produce accurate results for the LCDM (Madison and Bradshaw, 2015). We used three levels for the number of items to examine how test length influences results of the 1-PLCDM, namely 5, 10, and 15 items.
Sample size
We used three sample sizes to reflect a variety of samples in educational context, namely 200, 500, and 1,000 respondents.
Base rate
The base rate is the proportion of respondents who master the attribute. We included multiple levels for this factor to reflect multiple scenarios, namely low (0.3), medium (0.5), and high (0.7) base rates.
3.1.2 Outcome measures
To assess the impact of 1-PLCDM assumption violations (i.e., varying main effects), we evaluated classification accuracy and reliability. For classification accuracy, we calculated the proportion of estimated attribute classifications (using a threshold of 0.5) that matched the generated attribute classifications. For reliability, we used a metric recommended by Johnson and Sinharay (2020), namely the squared point biserial correlation between the true skill and the posterior mean of the skill. This measure can be interpreted as the proportion reduction in prediction error, more specifically as the mean proportional reduction in variance after observing the posterior mean. This metric was estimated with the following estimator:
Here, E[αc∣xr] indicates the posterior mastery probability for respondent r and νc indicates the estimated proportional latent class sizes.
Further, global absolute model fit was tested with the maximum χ2 statistic of item pairs and with the maximum absolute value of the deviations of Fisher transformed correlations as in Chen et al. (2013), and we evaluated the standardized root mean squared residual (SRMSR; Maydeu-Olivares and Joe, 2014). To compare the 1-PLCDM and LCDM in each replication, we evaluated the AIC and BIC and we performed a likelihood ratio test (LRT).
Finally, for the conditions without varying main effects (i.e., when the 1-PLCDM was the true generating model), we evaluated the accuracy of the estimated cut score by comparing it with the true cut score (computed using Equation (8) with the generating model parameters) and we examined the classification accuracy when the estimated cut score was used to classify new respondents.
3.2 Results
3.2.1 Classification accuracy
Figure 1 shows the average classification accuracy across replications (with 90% error bars) for the 1-PLCDM and LCDM across different levels of main effects variance and number of items. The presented results are aggregated for the different sample sizes and base rate levels, because these variables did not substantially impact the results. The results of the 1-PLCDM and LCDM were almost indistinguishable in all conditions. This means that there was virtually no loss in classification accuracy by imposing the equality constraints on the main effects, even when the true variance in the main effects was high. For all conditions with five items, the accuracy was around 0.80, for 10 items around 0.90 and for 15 items around 0.95. The average classification agreement between the two models was high in all 108 simulated conditions: it varied between 0.87 and 0.99.
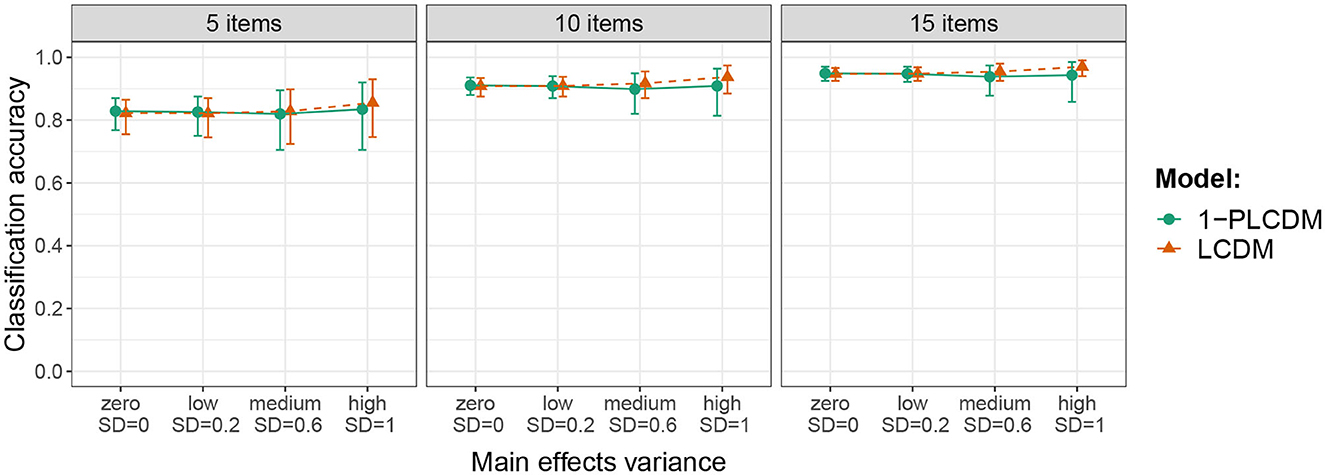
Figure 1. Average classification accuracy across replications (with 90% error bars) in the conditions resulting from crossing main effects variance and number of items. Results are aggregated for the different sample sizes and base rate levels.
3.2.2 Reliability
For reliability, we evaluated the squared point biserial correlation between the true skill and the posterior mean of the skill, which we estimated using Equation (9) (Johnson and Sinharay, 2020). Figure 2 shows the average reliability across replications (with 90% error bars) in the conditions resulting from crossing sample size, number of items, and main effects variance. The presented results are aggregated for the different base rate levels, since highly similar results were found for this manipulated variable. It can be seen that in the conditions with short tests and small sample sizes (I = 5, R = 200), the LCDM produced slightly more reliable results on average than the 1-PLCDM, yet there was substantial variance across replications. This discrepancy between the two models diminished with longer tests and larger samples, although with high main effects variance the LCDM tends to be somewhat more reliable on average.

Figure 2. Average reliability across replications (with 90% error bars) in the conditions resulting from crossing sample size, number of items, and main effects variance. Results are aggregated for the different base rate levels.
Further, Figure 2 shows that reliability is not highly influenced by sample size, but more by the number of items. Johnson and Sinharay (2020) suggest a lower bound of 0.75 for the squared point biserial correlation to indicate fair reliability. On average, this was not achieved with either of the two models in the conditions with I = 5, suggesting that more items are needed. For I = 10, average reliability ranged from 0.70 to 0.83 and for I = 15 from 0.81 to 0.91. These results indicate that generally 10 to 15 items are needed to attain the lower bound suggested by Johnson and Sinharay for both the 1-PLCDM and the LCDM given the simulated item quality.
3.2.3 Absolute model fit
To evaluate the performance of absolute model fit tests, the rejection rates of the maximum χ2 statistic of item pairs and the maximum absolute value of the deviations of Fisher transformed correlations were computed (at α = 0.05). To control for multiple comparisons, p-value adjustments according to the Holm-Bonferroni method were conducted (Holm, 1979). For the LCDM, rejection rates of both test statistics were close to zero in all conditions. This aligns with results from Chen et al. (2013), who found that, under the correction for multiple comparisons, the Fisher transformed correlation test is too conservative with type I error rates much lower than the nominal level. For the 1-PLCDM, rejection rates of the maximum χ2 test were substantial even in the zero-variance conditions, making it unsuitable to evaluate the equality constraint violations (see Appendix B for details). The Fisher transformed correlation test, by contrast, seems useful and has adequate power to detect misfit under certain conditions, as can be seen from the rejection rates in Table 2. In the zero-variance columns, rejection rates indicate type I errors and in the remaining columns they indicate power. Rejection rates increased with increasing variance of the main effects, i.e., with stronger violation of the equality constraints. The power to reject the 1-PLCDM in conditions with non-zero main effects variance expectedly increased with increasing test length and sample size. Adequate power (0.80, indicated in boldface) to detect medium constraint violations (i.e., medium main effects variance) was achieved with at least 10 items and 500 respondents.
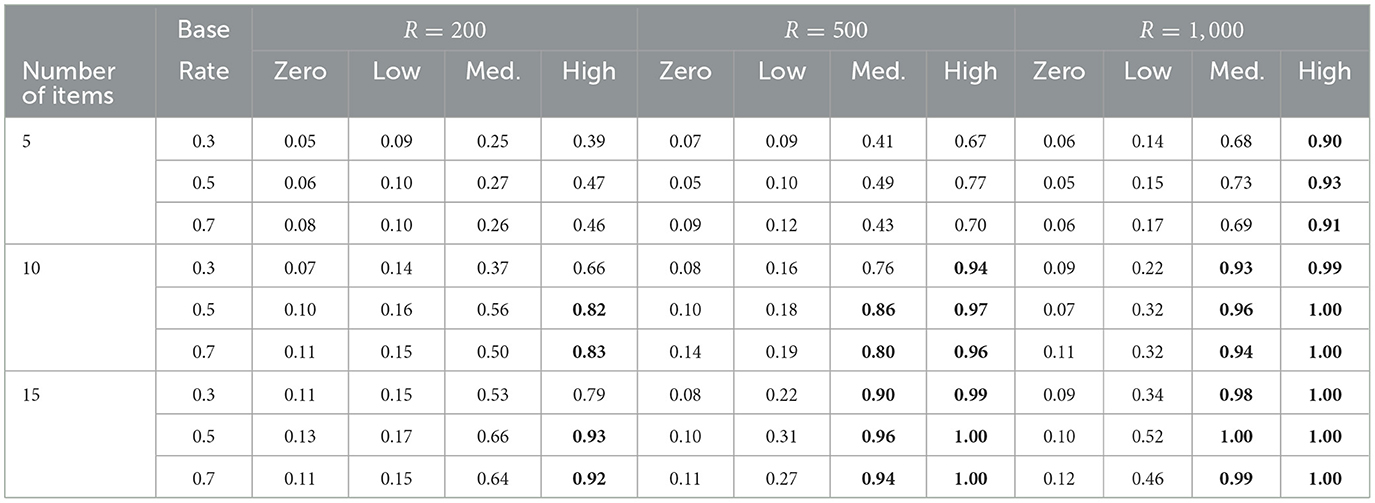
Table 2. Rejection rates of the maximum Fisher transformed correlation tests for the 1-PLCDM per condition. Values ≥ 0.80 are displayed in boldface to indicate adequate power.
Finally, we evaluated the SRMSR, for which a value below 0.05 is generally considered as an acceptable approximation to the data (Maydeu-Olivares and Joe, 2014). For the LCDM, the average SRMSR was around or below 0.05 in all conditions with little variance across replications. For the 1-PLCDM, Figure 3 shows the average SRMSR across replications (with 90% error bars). Results are aggregated for the different base rate levels, because highly similar results were found for varying base rates. It can be seen that the SRMSR tended to be smaller as sample size increased, aligning with findings from Ma (2020). Further, the SRMSR increased with increasing main effects variance, justly indicating stronger model misfit, with average values above 0.05 in the conditions with medium and high main effects variance. In the conditions with zero and low main effects variance, the average SRMSR was above 0.05 for R = 200 (indicating misfit) and below 0.05 for R = 500, 1, 000 (not indicating misfit). Thus, the SRMSR indicated model misfit even when the 1-PLCDM was the true generating model for the small sample size, but not for the larger sample sizes.
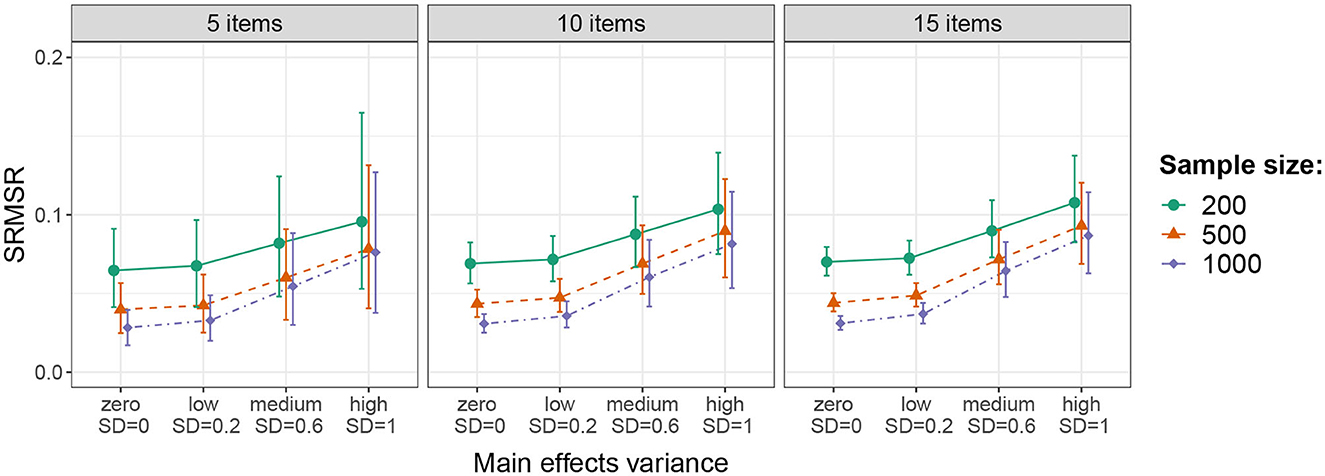
Figure 3. Average SRMSR across replications (with 90% error bars) for the 1-PLCDM in the conditions resulting from crossing sample size, number of items, and main effects variance. Results are aggregated for the different base rate levels.
3.2.4 Relative fit
We evaluated the proportion of replications in which the AIC and BIC were lower for the LCDM than for the 1-PLCDM, i.e., preferred the LCDM over the 1-PLCDM, and we evaluated the proportion of replications in which the LRT selected the LCDM over the 1-PLCDM. The AIC and LRT tended to prefer the (more complex) LCDM even in conditions with zero or low main effects variance, aligning with results from Lei and Li (2016) and from Maas et al. (2022b) showing that the AIC tends to erroneously favor more complex DCMs (see Appendix B for details). The BIC, by contrast, generally selected the 1-PLCDM in the conditions where the main effects variance was zero or low. With medium and high main effects variance, the BIC increasingly showed preference for the LCDM, especially with longer tests and larger samples (see Figure B.1 in Appendix B). These results indicate adequate performance of the BIC in model selection.
3.2.5 Cut score recovery
For the conditions in which the 1-PLCDM was the true generating model, we evaluated whether the cut score was accurately estimated. We computed the true cut score using Equation (8) with the generating model parameters and compared it with the model estimated cut score. Recall that cut score estimates are not expected to be sample-free. Here, we only evaluated cut score recovery with samples that were representative in terms of proficiency, i.e., the generating base rate parameters that were used to generate sample data are also used to compute the true cut score. Table 3 shows the proportion of replications in which the cut score was correctly estimated, overestimated, or underestimated. Over- and underestimation was nearly always a 1 point difference between the true and estimated cut score; only in 0.33% of all replications across all conditions the difference was 2 points, in 0.01% it was 3 points and never more than that. The results in the table are aggregated for the different sample size levels, because similar trends were found across varying sample sizes. It can be seen the cut score recovery is fairly accurate. However, with short tests (I = 5) in combination with unbalanced base rates (0.3 or 0.7), the cut score was overestimated in a substantial proportion of replications. This shows that even with representative samples, one may obtain biased estimates of the cut score with extreme base rates if tests are short. This might stem from the rounding of the true cut scores, which are rounded up to the nearest integer.

Table 3. Proportion of replications in which the cut score was correctly estimated, overestimated, or underestimated.
Since the difference between true and estimated cut scores was generally not more than 1 point, the bias in the estimates only impacted classifications if respondents score close to the cut score. To evaluate what happens when a test is calibrated with an initial sample using the 1-PLCDM and the estimated cut score is used to classify respondents from a new sample (i.e., a scoring sample), we generated new item responses with the true 1-PLCDM item parameters that represent scoring samples and classified respondents based on the estimated cut score from the calibration sample. The scoring samples consisted of 1,000 respondents and had varying base rates (0.3, 0.5, 0.7). Table 4 shows the average classification accuracy in the scoring samples. The results are aggregated for sample sizes of the calibration sample since similar results were found for varying sample sizes. The classification accuracy in the scoring samples was slightly reduced in the conditions with short tests (I = 5) in combination with unbalanced base rates (0.3 or 0.7), which are the conditions in which the cut score tended to be overestimated. Nevertheless, the bias in the cut score estimates with short tests only impacted the classification accuracy if the base rates in the scoring sample did not correspond to the base rates in the calibration sample. In practice, this means that it is not a big issue if the calibration and scoring samples differ in base rate for longer tests, yet one needs to proceed with caution for shorter tests if the calibration base rates are unbalanced, since this can impact the accuracy if the scoring base rates are different from calibration base rates.

Table 4. Classification accuracy in scoring samples based on calibrations with varying test lengths and base rates.
3.3 Summary of simulation results
This simulation study examined how violations of the equality constraints of the 1-PLCDM impact its classification accuracy, reliability and model fit. The 1-PLCDM showed virtually no loss in classification accuracy compared with the LCDM in any of the simulated conditions. In addition, reliability was highly similar for both models, although with high variance in main effects the LCDM produced slightly more reliable results. Overall, the 1-PLCDM seems fairly robust to constraint violations in terms of classification accuracy and reliability, even when the model fit indices showed reduced model fit. Finally, we found that with short tests, the cut score for mastery classification is best recovered when the proportions of masters and non-masters are balanced. With more extreme base rates, the cut score tended to be overestimated for short tests, which slightly reduced classification accuracy in scoring samples when base rates deviated from the calibration sample base rates. This issue did not occur for longer tests.
4 Discussion
The current study examined the recently introduced one-parameter log-linear cognitive diagnosis model (1-PLCDM; Madison et al., 2023), which imposes equality constraints on the main effects of the LCDM in order to obtain a model with increased ease of interpretation. We showed that the unidimensional 1-PLCDM is equivalent to a constrained Latent Class/Rasch Model (Formann, 1995), and thereby we bridged two (often separated) modeling frameworks, namely DCM and IRT/Rasch. We further examined the model in a DCM framework. We derived the likelihood of the model and we demonstrated that the sum score sufficiency property holds in general for the 1-PLCDM, which allowed for the derivation of a cut score for mastery classification. Further, simulations showed that the model is fairly robust to violations of the main effect equality constraints in terms of classification accuracy and reliability. We also examined the performance of the 1-PLCDM in practical situations when items are first calibrated and subsequently new respondents are scored. We found that for short tests, when the calibration base rate did not match the scoring sample base rate, the estimated cut score produced slightly less accurate classifications for the scoring sample, yet not for longer tests.
4.1 Implications for practice
The current study provided insight in the trade-off between model interpretability and accuracy to support modeling choices. The choice for a model to obtain mastery classifications stems from a variety of considerations. The advantage of using a DCM framework rather than a naive sum score approach or IRT models is that classifications are model based, which removes the need for a potentially error-prone cut score setting process (Kane and Wilson, 1984). However, recall that the cut score also depends on a threshold parameter for mastery classification. Although there exists a statistically optimal value for this parameter, one can choose to deviate from this value if the costs of misclassification in one direction outweigh the costs in the other direction. In that sense, determining the cut score is not fully model based, but requires considerations about the cost of misclassifications for each specific assessment context.
Further, Templin and Bradshaw (2013) showed that DCMs can provide more precise measurement than analogous IRT models. Within a DCM framework, one is faced with the choice between models of different complexity. The LCDM is often used because of its generality and model refinement capabilities, yet simpler models like the 1-PLCDM are easier to interpret. The useful measurement properties of the 1-PLCDM, like sum score sufficiency, can be attractive for assessment practice. If assessments have precalibrated cut scores that define mastery vs. non-mastery, they can easily be used in classrooms to assess students' skills without the need for complex statistical software. With the 1-PLCDM, this can be achieved while maintaining accurate classifications and adequate reliability.
The 1-PLCDM separates two ordered groups that differ with respect to the extent to which they show evidence of attribute mastery through correct item responses, and the model provides a cut score for mastery classification. Since the cut score is model based, it can be difficult to interpret the meaning of mastery. As acknowledged by Bradshaw and Levy (2019), this is an important and nontrivial step for DCMs. The cut score, and thus mastery classification, depends on the base rates, item parameters, and threshold for classification based on posterior probabilities. Assessment developers need to establish a shared interpretation of the resulting attribute classifications that is supported by the model and test design. The equivalence of the 1-PLCDM to a constrained LC/RM can potentially support the interpretation of mastery. The item main effect in the 1-PLCDM is similar to the difference in ability level between the latent classes in the LC/RM, and therefore its magnitude can provide information about how mastery vs. non-mastery is defined.
4.2 Limitations and future work
The simulation results showed that sample base rates impacted the accuracy of cut score estimation. For short tests, cut score estimation was less accurate with unbalanced proportions of masters and non-masters. Although extreme base rates could lead to overestimation of the cut score for short tests, this only slightly impacted classification accuracy for scoring samples in the simulated conditions and only for short tests. In this study, we only examined calibration samples that were representative in terms of proficiency. Earlier simulations have shown that for the LCDM, respondent classifications based on precalibrated assessments did not substantially vary when calibrations were based on samples with different base rates (Bradshaw and Madison, 2016), yet it is unclear to what extent these results hold for the 1-PLCDM and how test length impacts these results. More research is needed to shed light on classification accuracy of the 1-PLCDM with non-representative samples, especially for shorter assessments where bias in cut score estimates is expected to have a stronger influence on classifications. For this end, it would be useful to examine the estimated cut scores in more detail, for example by evaluating the bias and root-mean-square error (RMSE).
Further, the one-to-one mapping from sum scores to posterior mastery probabilities is based on the assumption that response patterns contain no missing values. It is up to the practitioner to decide whether responses are forced or missing values are allowed, and if these are allowed, whether they are treated as incorrect or as missing. Response patterns with missing values would have a different cut score, computed from the items that were completed. This can be a limitation for educational practice, which is interesting to explore in future work.
We examined the 1-PLCDM in a single-attribute setting. Although unidimensional DCMs are used in research and practice (e.g., Templin and Bradshaw, 2013; Madison, 2019; Dynamic Learning Maps Consortium, 2021) and model-based classifications can be advantageous in a unidimensional setting, one of the major benefits of DCMs is the potential for multidimensional measurement with complex item loading structures. Based on preliminary explorations, we found that in a multi-attribute setting, sum scores are sufficient statistics for the posterior mastery probabilities only if attributes are assumed independent. In educational applications, this assumption is rarely met. Future work could examine the impact of violation of this assumption on model performance. In addition, other applications of the 1-PLCDM are worthwhile to examine, including application to longitudinal measurement (Madison and Bradshaw, 2018), attribute hierarchies (Templin and Bradshaw, 2014), and polytomous attributes (Bao, 2019). These ideas for model extensions demonstrate that, although the 1-PLCDM is not novel in a statistical sense (since it is equivalent to a constrained LC/RM), examining it in a DCM framework provides a different starting point to extend the model.
As a final suggestion for future work, we propose to examine how classifications from the 1-PLCDM would compare to classifications based on a non-model based cut score setting procedure. Empirical research in this context can provide more insight in the practical value of the model.
4.3 Concluding remarks
Although more research is needed to fully illuminate the properties of the 1-PLCDM, the model shows promising opportunities for educational practice. The adequate model performance in combination with useful measurement properties can make the model attractive for stakeholders to apply in various assessment settings. We hope that our results support practitioners' modeling choices when seeking a balance between model interpretability and accuracy.
Data availability statement
The original contributions presented in the study are included in the article/Supplementary material, further inquiries can be directed to the corresponding author.
Author contributions
LM: Conceptualization, Formal analysis, Methodology, Project administration, Visualization, Writing – original draft. MM: Conceptualization, Formal analysis, Methodology, Supervision, Writing – review & editing. MB: Conceptualization, Methodology, Writing – review & editing.
Funding
The author(s) declare financial support was received for the research, authorship, and/or publication of this article. This work was supported by the Dr. Catharine van Tussenbroek Fonds under Grant A-2022-05.
Conflict of interest
The authors declare that the research was conducted in the absence of any commercial or financial relationships that could be construed as a potential conflict of interest.
Publisher's note
All claims expressed in this article are solely those of the authors and do not necessarily represent those of their affiliated organizations, or those of the publisher, the editors and the reviewers. Any product that may be evaluated in this article, or claim that may be made by its manufacturer, is not guaranteed or endorsed by the publisher.
Supplementary material
The Supplementary Material for this article can be found online at: https://www.frontiersin.org/articles/10.3389/feduc.2024.1287279/full#supplementary-material
Footnotes
1. ^In a multi-attribute setting, a single main effect is estimated across all items measuring the same attribute (i.e., λ1α). The multidimensional 1-PLCDM is defined for assessments comprised of unidimensional items.
2. ^The derivation of the likelihood and some properties can be found in Appendix A.
3. ^We provided one example to give an impression of the impact of base rates on cut scores; no replications were performed.
References
Bao, Y. (2019). A Diagnostic Classification Model for Polytomous Attributes (Doctoral dissertation). Athens, GA: University of Georgia.
Barney, M., and Fisher, W. P. (2016). Adaptive measurement and assessment. Ann. Rev. Org. Psychol. Org. Behav. 3, 469–490. doi: 10.1146/annurev-orgpsych-041015-062329
Bradshaw, L., Izsak, A., Templin, J., and Jacobson, E. (2014). Diagnosing teacher' understandings of rational numbers: building a multidimensional test within the diagnostic classification framework. Educ. Meas. Issues Pract. 33, 2–14. doi: 10.1111/emip.12020
Bradshaw, L., and Levy, R. (2019). Interpreting probabilistic classifications from diagnostic psychometric models. Educ. Meas. 38, 79–88. doi: 10.1111/emip.12247
Bradshaw, L., and Madison, M. J. (2016). Invariance properties for general diagnostic classification models. Int. J. Test. 16, 99–118. doi: 10.1080/15305058.2015.1107076
Butter, R., De Boeck, P., and Verhelst, N. (1998). An item response model with internal restrictions on item difficulty. Psychometrika 63, 47–63. doi: 10.1007/BF02295436
Chen, J., de la Torre, J., and Zhang, Z. (2013). Relative and absolute fit evaluation in cognitive diagnosis modeling. J. Educ. Meas. 50, 123–140. doi: 10.1111/j.1745-3984.2012.00185.x
de la Torre, J. (2009). DINA model and parameter estimation: a didactic. J. Educ. Behav. Stat. 34, 115–130. doi: 10.3102/1076998607309474
de la Torre, J. (2011). The generalized DINA model framework. Psychometrika 76, 179–199. doi: 10.1007/s11336-011-9207-7
Dynamic Learning Maps Consortium (2021). Technical Manual Update: Year-End Model. Lawrence, KS: Technical report, University of Kansas, Accessible Teaching, Learning, and Assessment Systems.
Engelhard, G. Jr. (2013). Invariant Measurement: Using Rasch Models in the Social, Behavioral, and Health Sciences. New York, NY: Routledge.
Fischer, G. H. (1995). “The linear logistic test model,” in Rasch Models: Foundations, Recent Developments, and Applications, eds G. H. Fischer, and I. W. Molenaar (New York, NY Springer), 131–155.
Formann, A. K. (1995). “Linear logistic latent class analysis and the Rasch model,” in Rasch Models: Foundations, Recent Developments, and Applications, eds G. H. Fischer, and I. W. Molenaar (New York, NY Springer), 239–256.
George, A. C., Robitzsch, A., Kiefer, T., Groß, J., and Ünlü, A. (2016). The R package CDM for cognitive diagnosis models. J. Stat. Softw. 74, 1–24. doi: 10.18637/jss.v074.i02
Gierl, M. J., Alves, C., and Majeau, R. T. (2010). Using the attribute hierarchy method to make diagnostic inferences about examinees knowledge and skills in mathematics: an operational implementation of cognitive diagnostic assessment. Int. J. Test. 10, 318–341. doi: 10.1080/15305058.2010.509554
Henson, R. A., Templin, J., and Douglas, J. (2007). Using efficient model based sum-scores for conducting skills diagnoses. J. Educ. Meas. 44, 361–376. doi: 10.1111/j.1745-3984.2007.00044.x
Johnson, M. S., and Sinharay, S. (2020). The reliability of the posterior probability of skill attainment in diagnostic classification models. J. Educ. Behav. Stat. 45, 5–31. doi: 10.3102/1076998619864550
Kane, M. T., and Wilson, J. (1984). Errors of measurement and standard setting in mastery testing. Appl. Psychol. Meas. 8, 107–115. doi: 10.1177/014662168400800111
Lei, P.-W., and Li, H. (2016). Performance of fit indices in choosing correct cognitive diagnostic models and Q-matrices. Appl. Psychol. Meas. 40, 405–417. doi: 10.1177/0146621616647954
Lord, F. M. (1980). Applications of Item Response Theory to Practical Testing Problems. New York, NY: Routledge.
Ma, W. (2020). Evaluating the fit of sequential G-DINA model using limited-information measures. Appl. Psychol. Meas. 44, 167–181. doi: 10.1177/0146621619843829
Ma, W., Iaconangelo, C., and de la Torre, J. (2016). Model similarity, model selection, and attribute classification. Appl. Psychol. Meas. 40, 200–217. doi: 10.1177/0146621615621717
Maas, L., Brinkhuis, M. J. S., Kester, L., and Wijngaards-de Meij, L. (2022a). Cognitive diagnostic assessment in university statistics education: valid and reliable skill measurement for actionable feedback using learning dashboards. Appl. Sci. 12, 4809. doi: 10.3390/app12104809
Maas, L., Brinkhuis, M. J. S., Kester, L., and Wijngaards-de Meij, L. (2022b). Diagnostic classification models for actionable feedback in education: Effects of sample size and assessment length. Front. Educ. 7, 802828. doi: 10.3389/feduc.2022.802828
MacCallum, R. C., Wegener, D. T., Uchino, B. N., and Fabrigar, L. R. (1993). The problem of equivalent models in applications of covariance structure analysis. Psychol. Bull. 114, 185–199. doi: 10.1037/0033-2909.114.1.185
Madison, M. J. (2019). Reliably assessing growth with longitudinal diagnostic classification models. Educ. Meas. 38, 68–78. doi: 10.1111/emip.12243
Madison, M. J., and Bradshaw, L. (2015). The effects of Q-matrix design on classification accuracy in the log-linear cognitive diagnosis model. Educ. Psychol. Meas. 75, 491–511. doi: 10.1177/0013164414539162
Madison, M. J., and Bradshaw, L. (2018). Assessing growth in a diagnostic classification model framework. Psychometrika 83, 963–990. doi: 10.1007/s11336-018-9638-5
Madison, M. J., Wind, S. A., Maas, L., Yamaguchi, K., and Haab, S. (2023). A One-Parameter Diagnostic Classification Model With Familiar Measurement Properties. doi: 10.48550/arXiv.2307.16744
Maris, G., and Bechger, T. M. (2004). Equivalent MIRID models. Psychometrika 69, 627–639. doi: 10.1007/BF02289859
Maydeu-Olivares, A., and Joe, H. (2014). Assessing approximate fit in categorical data analysis. Multivar. Behav. Res. 49, 305–328. doi: 10.1080/00273171.2014.911075
Rasch, G. (1960). Probabilistic Models for Some Intelligence and Attainment Tests. Chicago, IL: MESA Press.
Rupp, A. A., Templin, J., and Henson, R. A. (2010). Diagnostic Measurement: Theory, Methods, and Applications. New York, NY: The Guilford Press.
Sessoms, J., and Henson, R. A. (2018). Applications of diagnostic classification models: a literature review and critical commentary. Measurement 16, 1–17. doi: 10.1080/15366367.2018.1435104
Stemler, S. E., and Naples, A. (2021). Rasch measurement v. item response theory: knowing when to cross the line. Pract. Assess. Res. Eval. 26, 11. doi: 10.7275/v2gd-4441
Templin, J., and Bradshaw, L. (2013). Measuring the reliability of diagnostic classification model examinee estimates. J. Classif. 30, 251–275. doi: 10.1007/s00357-013-9129-4
Templin, J., and Bradshaw, L. (2014). Hierarchical diagnostic classification models: a family of models for estimating and testing attribute hierarchies. Psychometrika 79, 317–339. doi: 10.1007/s11336-013-9362-0
von Davier, M. (2008). A general diagnostic model applied to language testing data. Br. J. Math. Stat. Psychol. 61, 287–307. doi: 10.1348/000711007X193957
Keywords: diagnostic classification models, cut scores, sum score sufficiency, score interpretation, cognitive diagnostic assessment
Citation: Maas L, Madison MJ and Brinkhuis MJS (2024) Properties and performance of the one-parameter log-linear cognitive diagnosis model. Front. Educ. 9:1287279. doi: 10.3389/feduc.2024.1287279
Received: 01 September 2023; Accepted: 05 January 2024;
Published: 23 January 2024.
Edited by:
Janet Clinton, The University of Melbourne, AustraliaReviewed by:
Hariharan Swaminathan, Storrs, Connecticut, United StatesZhonghua Zhang, The University of Melbourne, Australia
Copyright © 2024 Maas, Madison and Brinkhuis. This is an open-access article distributed under the terms of the Creative Commons Attribution License (CC BY). The use, distribution or reproduction in other forums is permitted, provided the original author(s) and the copyright owner(s) are credited and that the original publication in this journal is cited, in accordance with accepted academic practice. No use, distribution or reproduction is permitted which does not comply with these terms.
*Correspondence: Lientje Maas, Si5BLk0uTWFhc0B1dS5ubA==