 Llewellyn Ellardus van Zyl1,2,3,4*
 Jeff Klibert5Rebecca Shankland6Jacqueline Stavros7Matthew Cole7Nicolas B. Verger8Sebastiaan Rothmann2Vincent Cho9Katherine Feng9Eric W. K. See-To10Lara C. Roll2,11Anindita Ghosh12Diane Arijs13Aldona Glinska-Neweś14
- 1University of Eindhoven, Human Performance Management, Eindhoven, Netherlands
- 2Optentia Research Unit, North-West University, Potchefstroom, South Africa
- 3Department of Human Resource Management, University of Twente, Enschede, Netherlands
- 4Department of Social Psychology, Goethe University, Frankfurt am Main, Germany
- 5Department of Psychology, Georgia Southern University, Statesboro, GA, United States
- 6Laboratoire DIPHE, Université Lumière Lyon 2, Lyon, France
- 7College of Business and Information Technology, Lawrence Technological University, Detroit, MI, United States
- 8Department of Psychology and Allied Health Sciences, Glasgow Caledonian University, Glasgow, United Kingdom
- 9Department of Management and Marketing, Hong Kong Polytechnic University, Kowloon, Hong Kong SAR, China
- 10Department of Computing and Decision Sciences, Lingnan University, Tuen Mun, Hong Kong SAR, China
- 11Work, Organisational, and Personnel Psychology, KU Leuven, Leuven, Belgium
- 12Department of Liberal Arts, Indian Institute of Technology Bhilai, Bhilai, India
- 13Department of Work and Organisation Studies, KU Leuven, Leuven, Belgium
- 14Department of Industrial and Organisational Psychology, Nelson Mandela University, Gqeberha, South Africa
Academic task performance (TP) refers to the proficiency with which students perform in academic tasks through making the right choices and completing core tasks central to their academic studies, on time and to specification. We adapted Koopmans et al.’s task performance scale (TPS) for use within tertiary education and investigated its psychometric properties, internal consistency and measurement invariance across age, gender and national groups in university students (n = 3,265). The results showed that a hierarchical ESEM model with one higher-order task performance factor consisting of time management and task efficiency fitted the data best. The TPS exhibited full measurement invariance across gender and age groups, implying that the latent mean scores can be used to determine differences. However, invariance could only partially be established for national cohorts, implying that cross-national comparisons may not be possible. These findings offer preliminary support for the TPS as a valid instrument for gauging students’ academic task performance.
Introduction
Academic success depends on students’ ability to perform core study-related tasks and responsibilities (York et al., 2015). Research has shifted towards understanding the predictors of academic success, focusing on the importance of students’ efficacy in engaging with and performing these academic tasks (York et al., 2015). Academic task performance (TP) has recently emerged as an important antecedent of academic success (van Zyl et al., 2022a). It refers to students’ proficiency to perform well in academic-related tasks through making optimal choices in their study process and taking the initiative to perform the most important or core tasks of their academic programmes on time and to specification (van Zyl et al., 2022a). TP is strongly associated with academic throughput, objective measures of performance such as grade point average or test scores and even future career success (Locke and Latham, 2013). Therefore, understanding university students’ TP can provide key insights into the mechanisms to structure academic programmes, and can inform interventions to enhance academic achievement. Valid and reliable measures of TP are needed.
Very few empirically validated instruments exist to measure TP within the higher educational environment (MacCann et al., 2009; Cole et al., 2022). Commonly used indicators of academic success like grade point average, academic throughput or test scores, although important, do not directly represent students’ proficiency in carrying out fundamental study-related tasks or activities (York et al., 2015). This leaves a substantial measurement gap in understanding the academic task-related drivers of important educational outcomes. With validated scales, university administrators could create more nuanced profiles of students’ task execution, capabilities which could help identify at-risk learners requiring more academic support (Casillas et al., 2012).
In the absence of validated task performance scales, we draw upon the management and organisational psychology literature for direction. While generic job performance measures have limitations in their transferability to educational environments, some workplace measures show promise for assessing aspects of academic proficiency (Lounsbury et al., 2003). In particular, scales assessing task performance seem well-suited for adaptation to university contexts. Like employees, students engage in parallel kinds of fundamental “tasks” in their study programs like managing study time effectively, planning assignments, prioritising competing tasks, and avoiding distractions. Generic task performance scales may therefore have some applicable to general academic contexts (Lounsbury et al., 2003). Koopmans’s (2014) Individual Work Performance Questionnaire, which includes a robustly validated task performance subscale offers a foundation for a parallel measure for academic settings. From this perspective, task performance is seen as a function of effectively managing one’s time and the efficiency through which one executes work-related tasks (Koopmans, 2014). These generic factors also apply to students and study contexts (Kirillov et al., 2015). If validated, this instrument can provide a reliable tool for evaluating task performance in academic environments.
New and adapted psychometric scales should first show to be factorially valid (Morin, 2023). Van Zyl and Ten Klooster (2022) argue that to explore the factorial validity of instruments, both classical confirmatory factor analytic (CFA) models and more contemporary exploratory structural equation modelling (ESEM) techniques should be applied and models compared. While CFA only allows items to load onto pre-specified factors, ESEM incorporates cross-loadings to reflect the interrelationships between factors which is more in line with real-world behavioural phenomena (Van Zyl and Ten Klooster, 2022). This flexible modelling approach better mirrors the complexity of student task performance as compared to more restrictive independent cluster CFAs.
Further, for measurement instruments to make valid inferences and fair comparisons, they must also exhibit measurement invariance across different types of student subgroups (Putnick and Bornstein, 2016). The scale should work similarly regardless of student’s ages, genders or in which nation they study. However, differences in developmental trajectories, socialisation, and roles can shape perceptions and capabilities in task performance between genders and age groups (Locke and Latham, 2013; Kirillov et al., 2015). Younger students might see task performance differently than older students who have been distanced from structured education systems for a longer period (Locke and Latham, 2013). Gendered social conditioning affects how students perceive effective study methods (Locke and Latham, 2013). Further, cross-national differences in educational systems may influence how task performance is viewed and what function it plays within the design of academic programmes (van Zyl et al., 2022b). Testing measurement invariance is, therefore, vital to ensure that the scale reliably captures the same underlying construct across demographic segments and national cohorts (Morin, 2023). Without measurement invariance, observed mean score differences might reflect item interpretation variations and not actual performance discrepancies, risking bias and false conclusions on task performance levels (Morin, 2023).
The current study
As such, this paper aims to investigate the psychometric properties and measurement invariance of the Task Performance sub-scale (TPS) of Koopmans et al.’s (2012) Individual Work Performance Scale across genders and age groups within higher educational environments. Specifically, it explores the factorial validity of the scale by comparing traditional independent cluster modelling confirmatory factor analysis (ICM-CFA) with more modern exploratory structural equation modelling (ESEM) approaches. Additionally, it examines the measurement invariance of the scale between genders, different age groups and national cohorts. Furthermore, the study investigates the instrument’s measurement quality and internal consistency. This study’s findings support the TPS as a valid and reliable tool for measuring academic TP in university contexts.
Methodology
Research design
A multi-national, cross-sectional survey-based research design was employed to explore the psychometric properties and measurement invariance of the academic TPS. Secondary data from several cross-cultural student well-being projects was used for this study.
Participants
The data used for this study were drawn from a large-scale cross-national student well-being study. The original data were gathered by using a convenience sampling strategy, where invitations to participate were sent to university students from to university students by email from the collaborating universities based in the six following countries: the Netherlands, France, Belgium, the United States, Hong Kong, and India (c.f. Table 1). Participants were informed about the aims of the study, as well as their rights and responsibilities. Participation was voluntary. The survey was distributed through Qualtrics.1 Data management procedures were in line with the requirements of the General Data Protection Regulation (GDPR). The majority of the 3,265 participants were 21 to 30-year-old (72.2%) female students (53.9%), originating from a European country (51.7%).
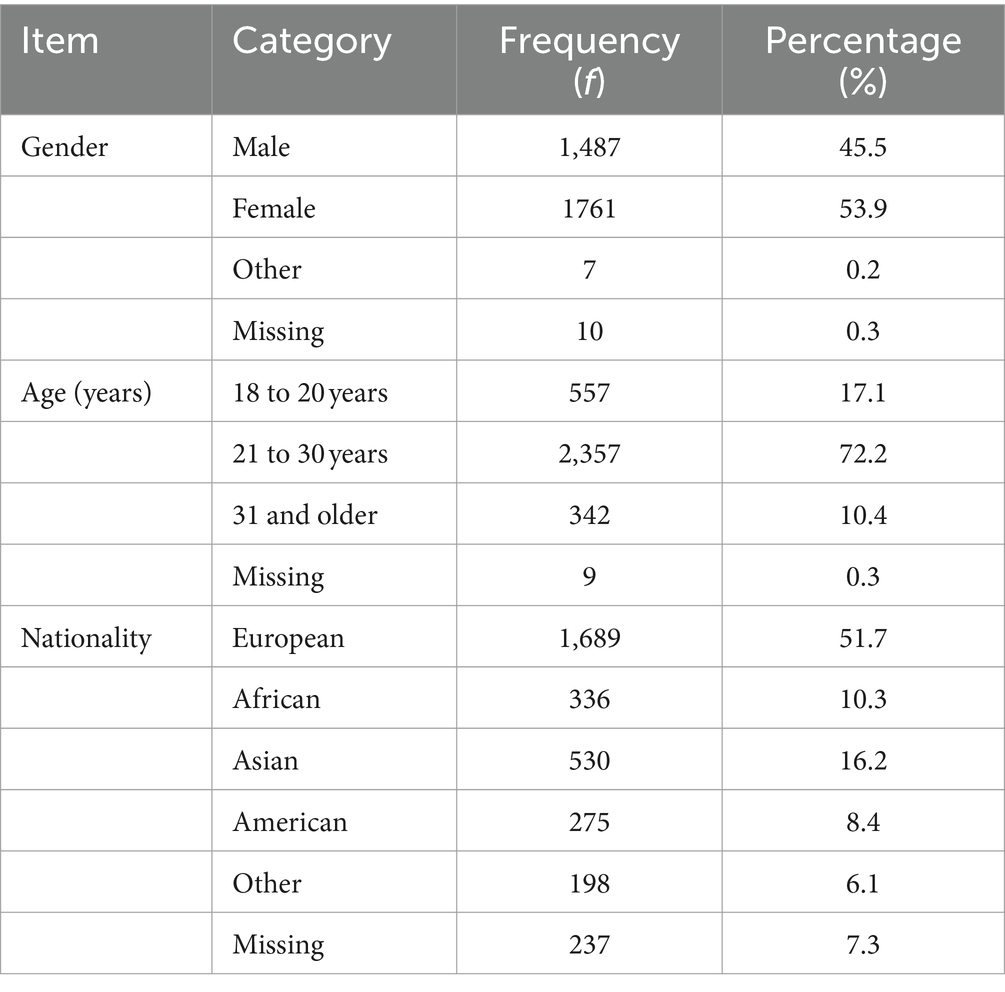
Table 1. Demographic characteristics of participants (N = 3,265).
Measuring instruments
The Task Performance sub-scale of Koopmans et al.’s (2012) Individual Work Performance Scale was adapted for use within the academic context to measure overall academic task performance. Academic task performance was measured by seven items rated on a six-point Likert scale ranging from 1 (“Never”) to 6 (“Always”), with 2 (“Seldom”), 3 (“Sometimes”), 4 (“Frequently”) and 5 (“Often”) in between. The scale measures two components: Time Management with four items (e.g., “I managed to plan my studies so that it was done on time”) and Task Efficiency with three items (e.g., “I was able to perform my academic work well with minimal time and effort”). Scale instructions were altered to focus on the study context. The scale produced acceptable levels of internal consistency in other studies with McDonald’s Omega ranging between 0.84 and 0.86 (van Zyl et al., 2022b).
Statistical analysis
Data were treated as interval data (c.f. Wu and Leung, 2017) and processed with JASP v. 0.15 (JASP, 2021) and Mplus v 8.6 (Muthén and Muthén, 2021) through Structural Equation Modelling (SEM) with the robust maximum likelihood (MLR) estimator. We used the MLR estimator to address any slight or moderate assumptions in normality of the Likert rating scale data (Li, 2016). The full maximum likelihood estimation method (FIML) was used to manage missing data. FIML uses all available information to estimate model parameters. Descriptive statistics and Pearson correlations were computed to test assumptions, and the results are presented in Appendix A.
First, a series of competing confirmatory factor analytical-(CFA) and modern exploratory structural equation models (ESEM) were estimated and subsequently compared through conventional standards. The modelling for ESEM adhered to the protocols established by Van Zyl and Ten Klooster (2022). Briefly, factors were delineated according to their predetermined theoretical constructs, and while some degree of cross-loading among items and unintended factors was allowed, efforts were made to minimize this. Target rotation techniques were utilized to this end. In the case of the bifactor ESEM model, we defined a primary G-Factor to encapsulate overall task performance, in addition to two subsidiary S-Factors (Time Management and Task Efficiency). These S-Factors also had some cross-loadings, which were again minimized. The Mplus code was generated using the De Beer and Van Zyl (2019) ESEM code generator. We identified the most appropriate measurement model for our data by comparing different models, considering both the fit indices established by Hu and Bentler (1999) and the overall quality of measurement.
Models needed to show excellent (a) data-model fit (c.f. Table 2), and (b) measurement quality (Factor loadings >0.40; p < 0.01; item uniqueness >0.10 but <0.90) to be retained for further analysis (Wang and Wang, 2020). ESEM models were estimated and compared in line with Van Zyl and Ten Klooster’s (2022) best practice guidelines and the code generated via De Beer and Van Zyl’s (2019) Mplus code generator. ESEM models allow for cross-loadings between items and non-target factors (but are constrained to be as close to zero as possible; Morin, 2023). Bifactor CFA and ESEM models were also estimated using the target rotation method, with orthogonal factors. The G-Factor represented general task performance, while the S-Factors reflected time management and efficiency factors. Target rotation was employed for the ESEM models (Van Zyl and Ten Klooster, 2022).
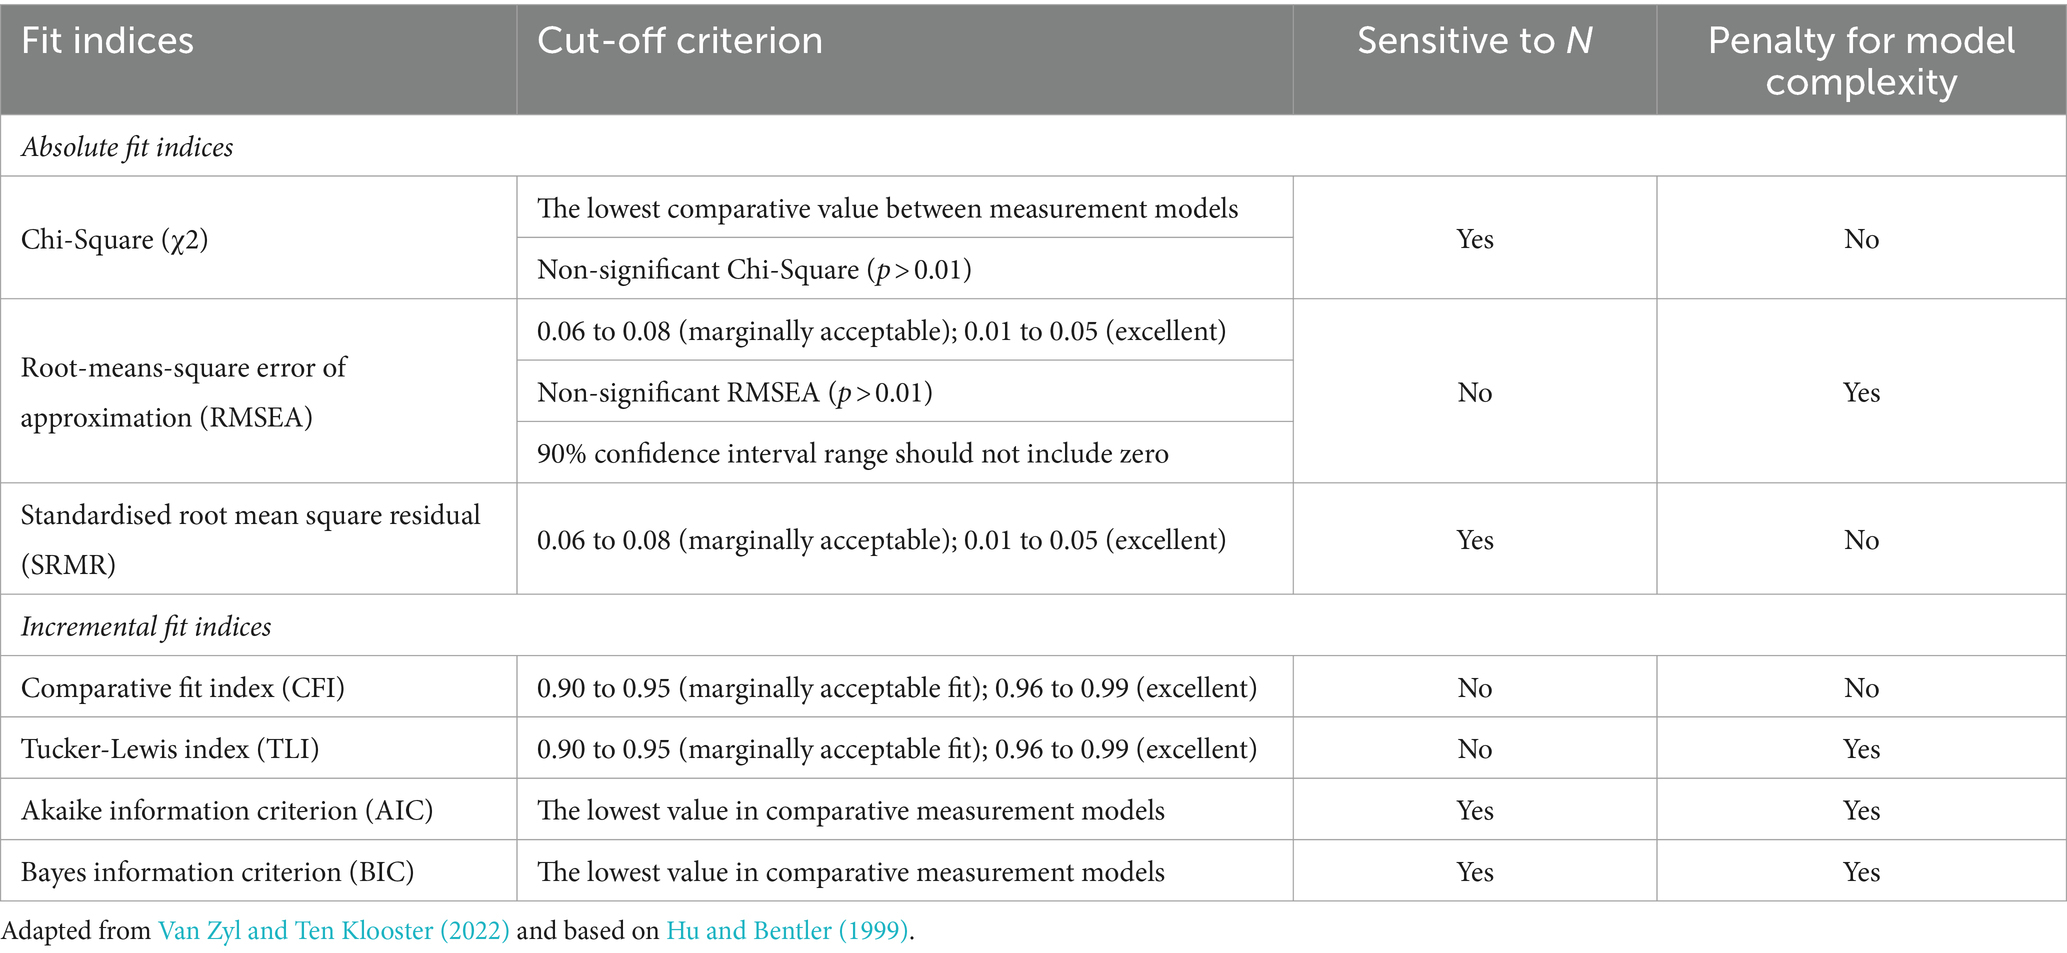
Table 2. Model fit statistics.
Second, the factorial equivalence or “measurement invariance” of the scale across genders (males vs. females), age groups (18 to 20 years; 21 to 30 years; 30 years and older), and national cohorts (European, African, Asian, American) was estimated. Age-groups were determined according to potential differences in academic experiences regarding task performance between undergraduate students (usually aged 18 to 20 in the contexts of this study), post-graduate students (21 to 30), and above 30 years old as these students may have specific profiles, returning to academic settings after having worked or cared for children.
A series of increasingly restrictive models were estimated and compared to establish configural- (similar factor structure), metric- (similar factor loadings), scalar- (similar intercepts), strict- (similar residual variances), latent variance–covariances-(similar covariances), and latent means invariance (latent mean estimation). Invariance was established by comparing these models based on the following criteria: changes in RMSEA (Δ < 0.015), SRMR (Δ < 0.02), and CFI (Δ < 0.01; Morin, 2023). Differences in χ2 and TLI were not considered (but reported for transparency) and TLI due to its sensitivity to sample size and model complexity (Morin et al., 2020; Van Zyl and Ten Klooster, 2022).
Finally, the standardised factor loadings and internal consistency of the best-fitting measurement model, which demonstrated invariance across groups, were reported. Internal consistency was assessed using McDonald’s Omega (ω > 0.70; Hayes and Coutts, 2020).
Results
Confirmatory factor analysis: competing measurement models
The factorial validity of the TPS was explored by estimating and comparing eight competing CFA and ESEM measurement models (c.f. Table 3; Appendices B,C). Measured items were treated as observed indicators, no items were removed, and error terms were freely estimated (but two items were permitted to correlate in Model 1). Results found the Bifactor models (Model 4 and 7) fitted the data best, however, both did not meet the measurement quality criteria as items did not load significantly onto both the General and Specific factors according to the expected pattern of loadings. These models were therefore rejected. In contrast, the ESEM (Model 5) and its hierarchical ESEM model equivalent (Model 6) had the next best met model fit criteria (χ2(3265) = 127.89 p > 0.001; df = 8; CFI = 0.98; TLI = 0.95; RMSEA = 0.07 [0.058, 0.078]; SRMR = 0.02; AIC = 64544.95; BIC = 64709.407), and showed acceptable levels of measurement quality (Factor loadings >0.40; p < 0.01; item uniqueness >0.10 but <0.90). While Models 5 and 6 have equivalent model fit criteria, Model 6, the Hierarchal ESEM Model, was retained for further analysis as it is based on more contemporary statistical analyses and best fitted the original theoretical underpinnings of the Task Performance measure as a higher order construct comprised of two factors (Time Management and Task Efficiency; c.f. Figure 1).
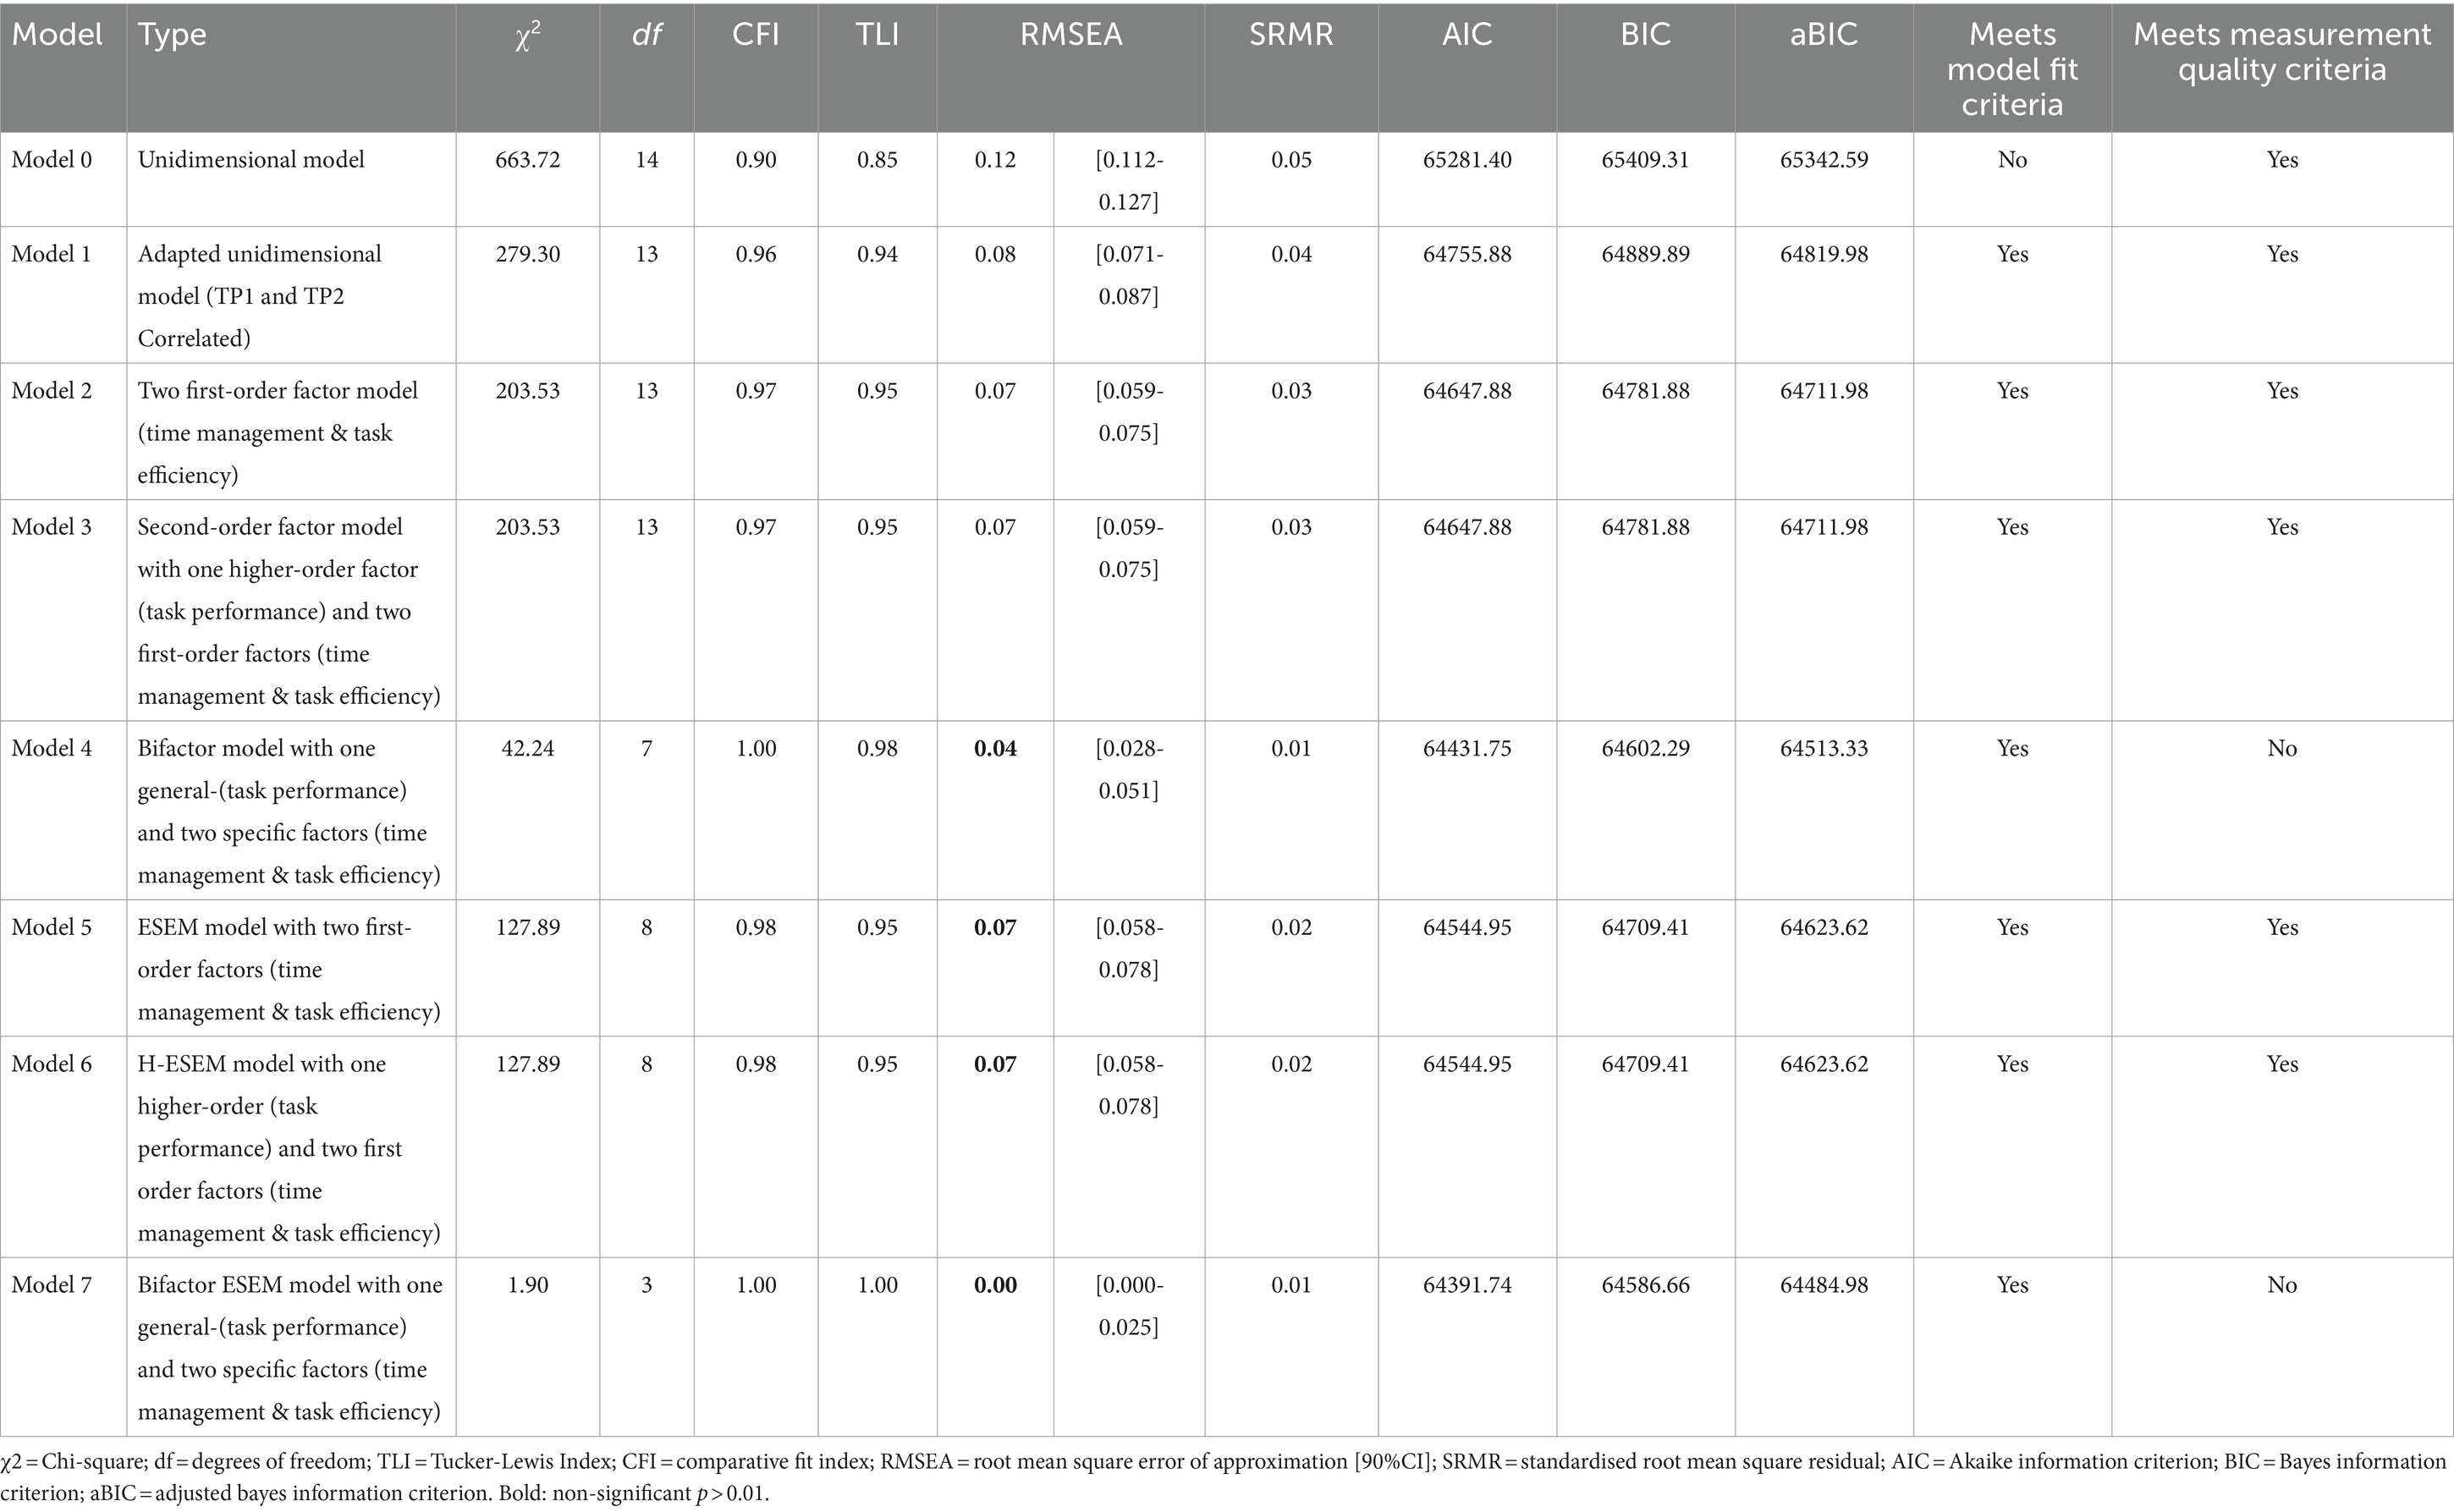
Table 3. Competing measurement models.
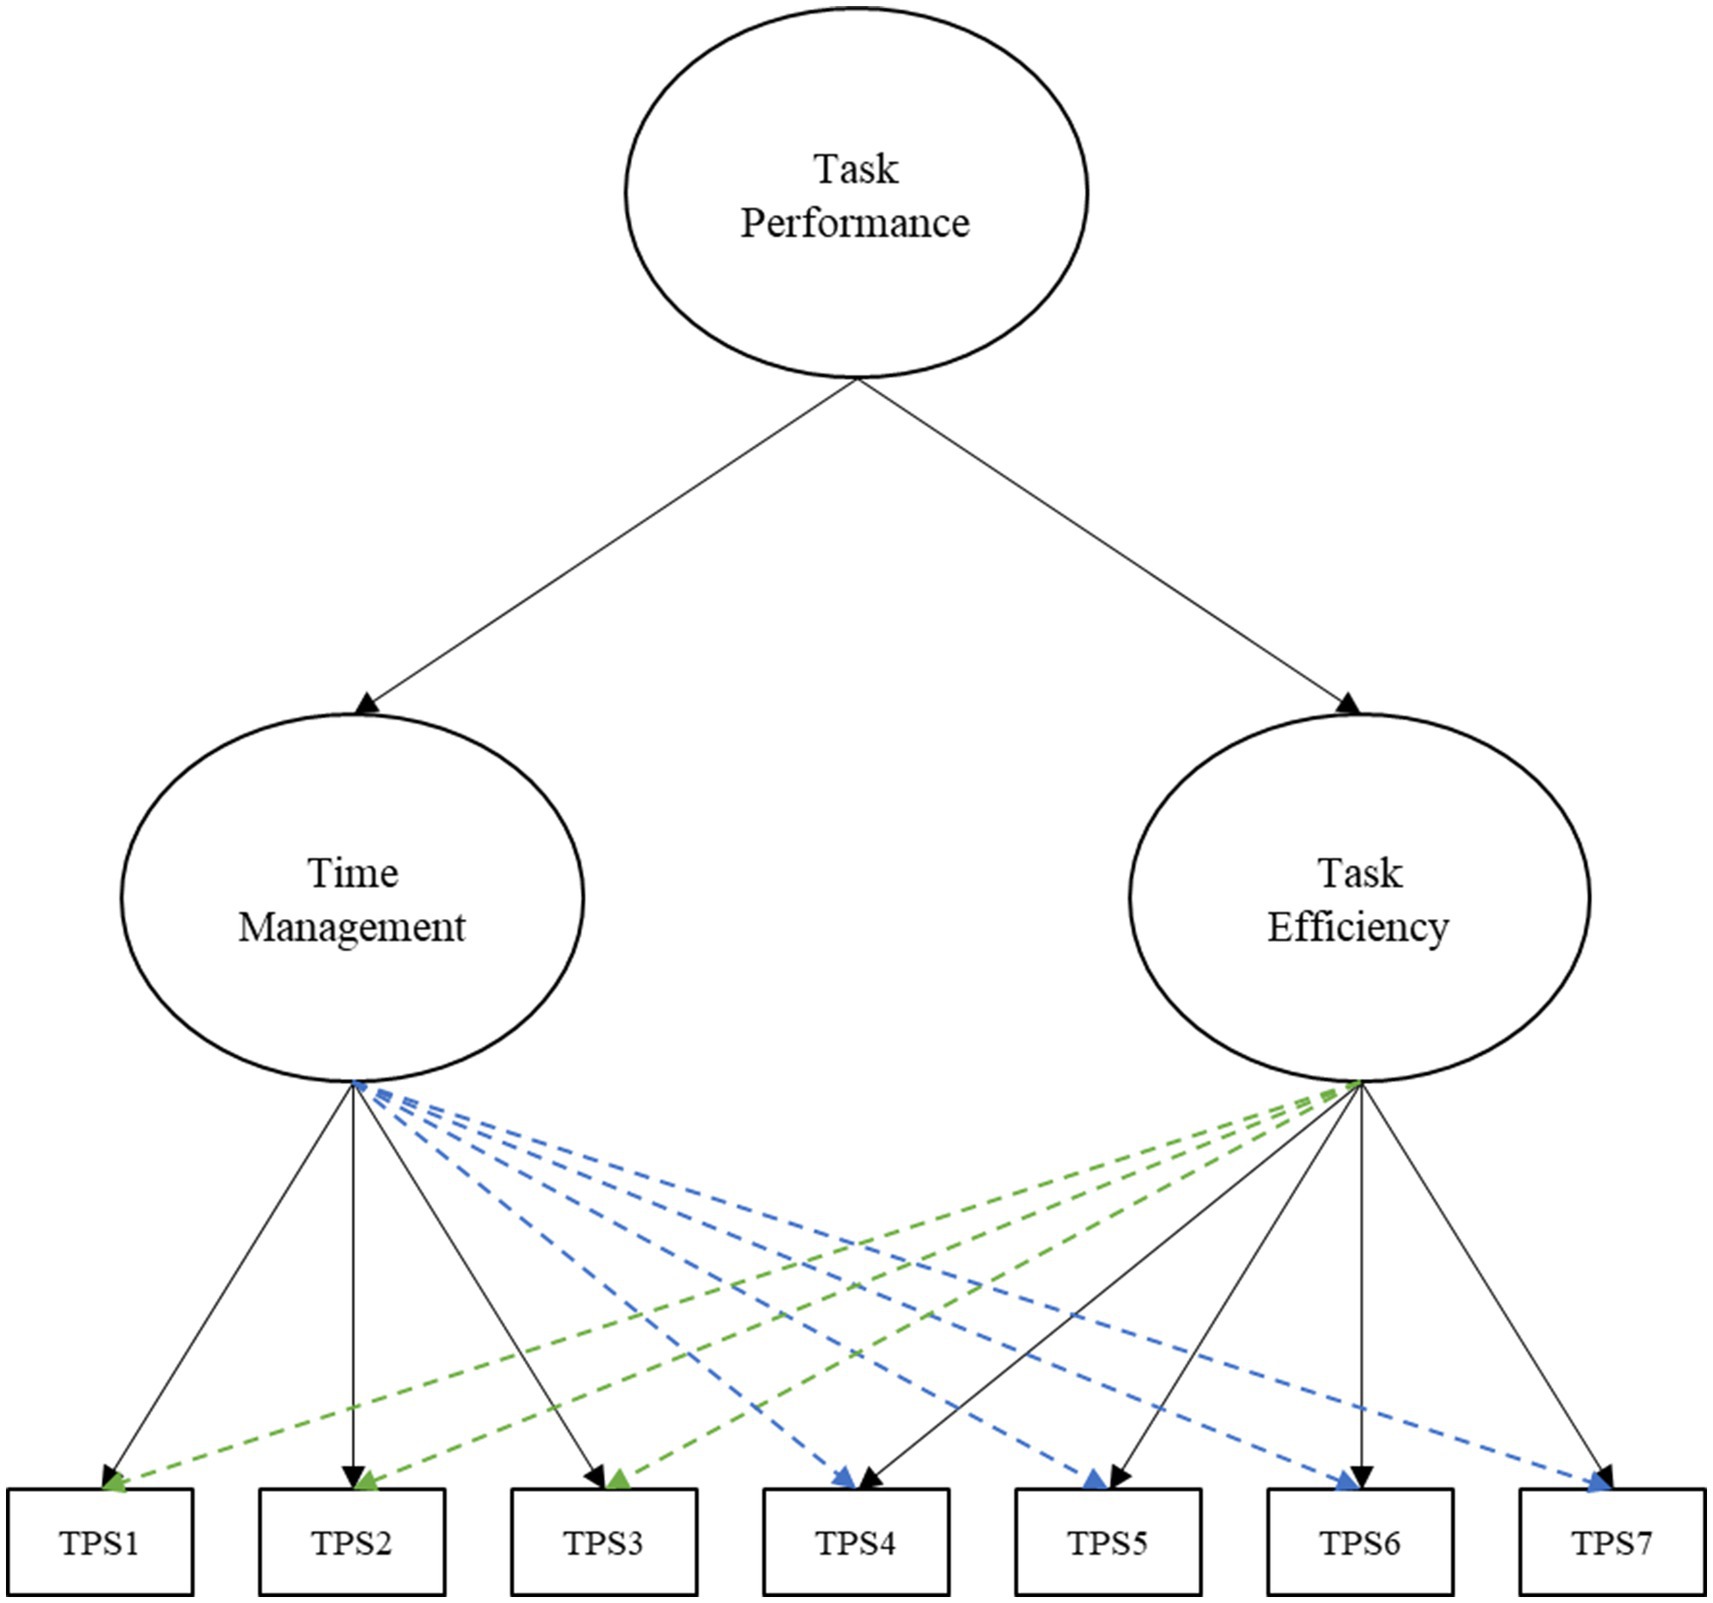
Figure 1. Hierarchical ESEM model.
Measurement invariance
The factorial equivalence of the scale across genders, age groups and national cohorts was estimated. The results summarised in Table 4 showed that configural-, metric (λ)-, scalar- (λ, ν), strict- (λ, ν, δ), latent variance–covariance- (λ, ν, δ, ξ/φ) and latent mean (λ, ν, δ, ξ/φ, η) invariance could be established for genders and age groups and only partially for national cohorts. No significant differences in RMSEA (Δ < 0.015), SRMR (Δ < 0.02), and CFI (Δ < 0.01) between the different models for ages and genders were found (Morin, 2023). However, differences between metric and scalar models were present for national cohorts, and thus invariance could only partially be established. This implies the TPS measures task performance consistently between genders/age groups and meaningful latent mean comparisons can be made. However, caution should be applied when attempting to make cross-national comparisons as there are differences in how items are interpreted.
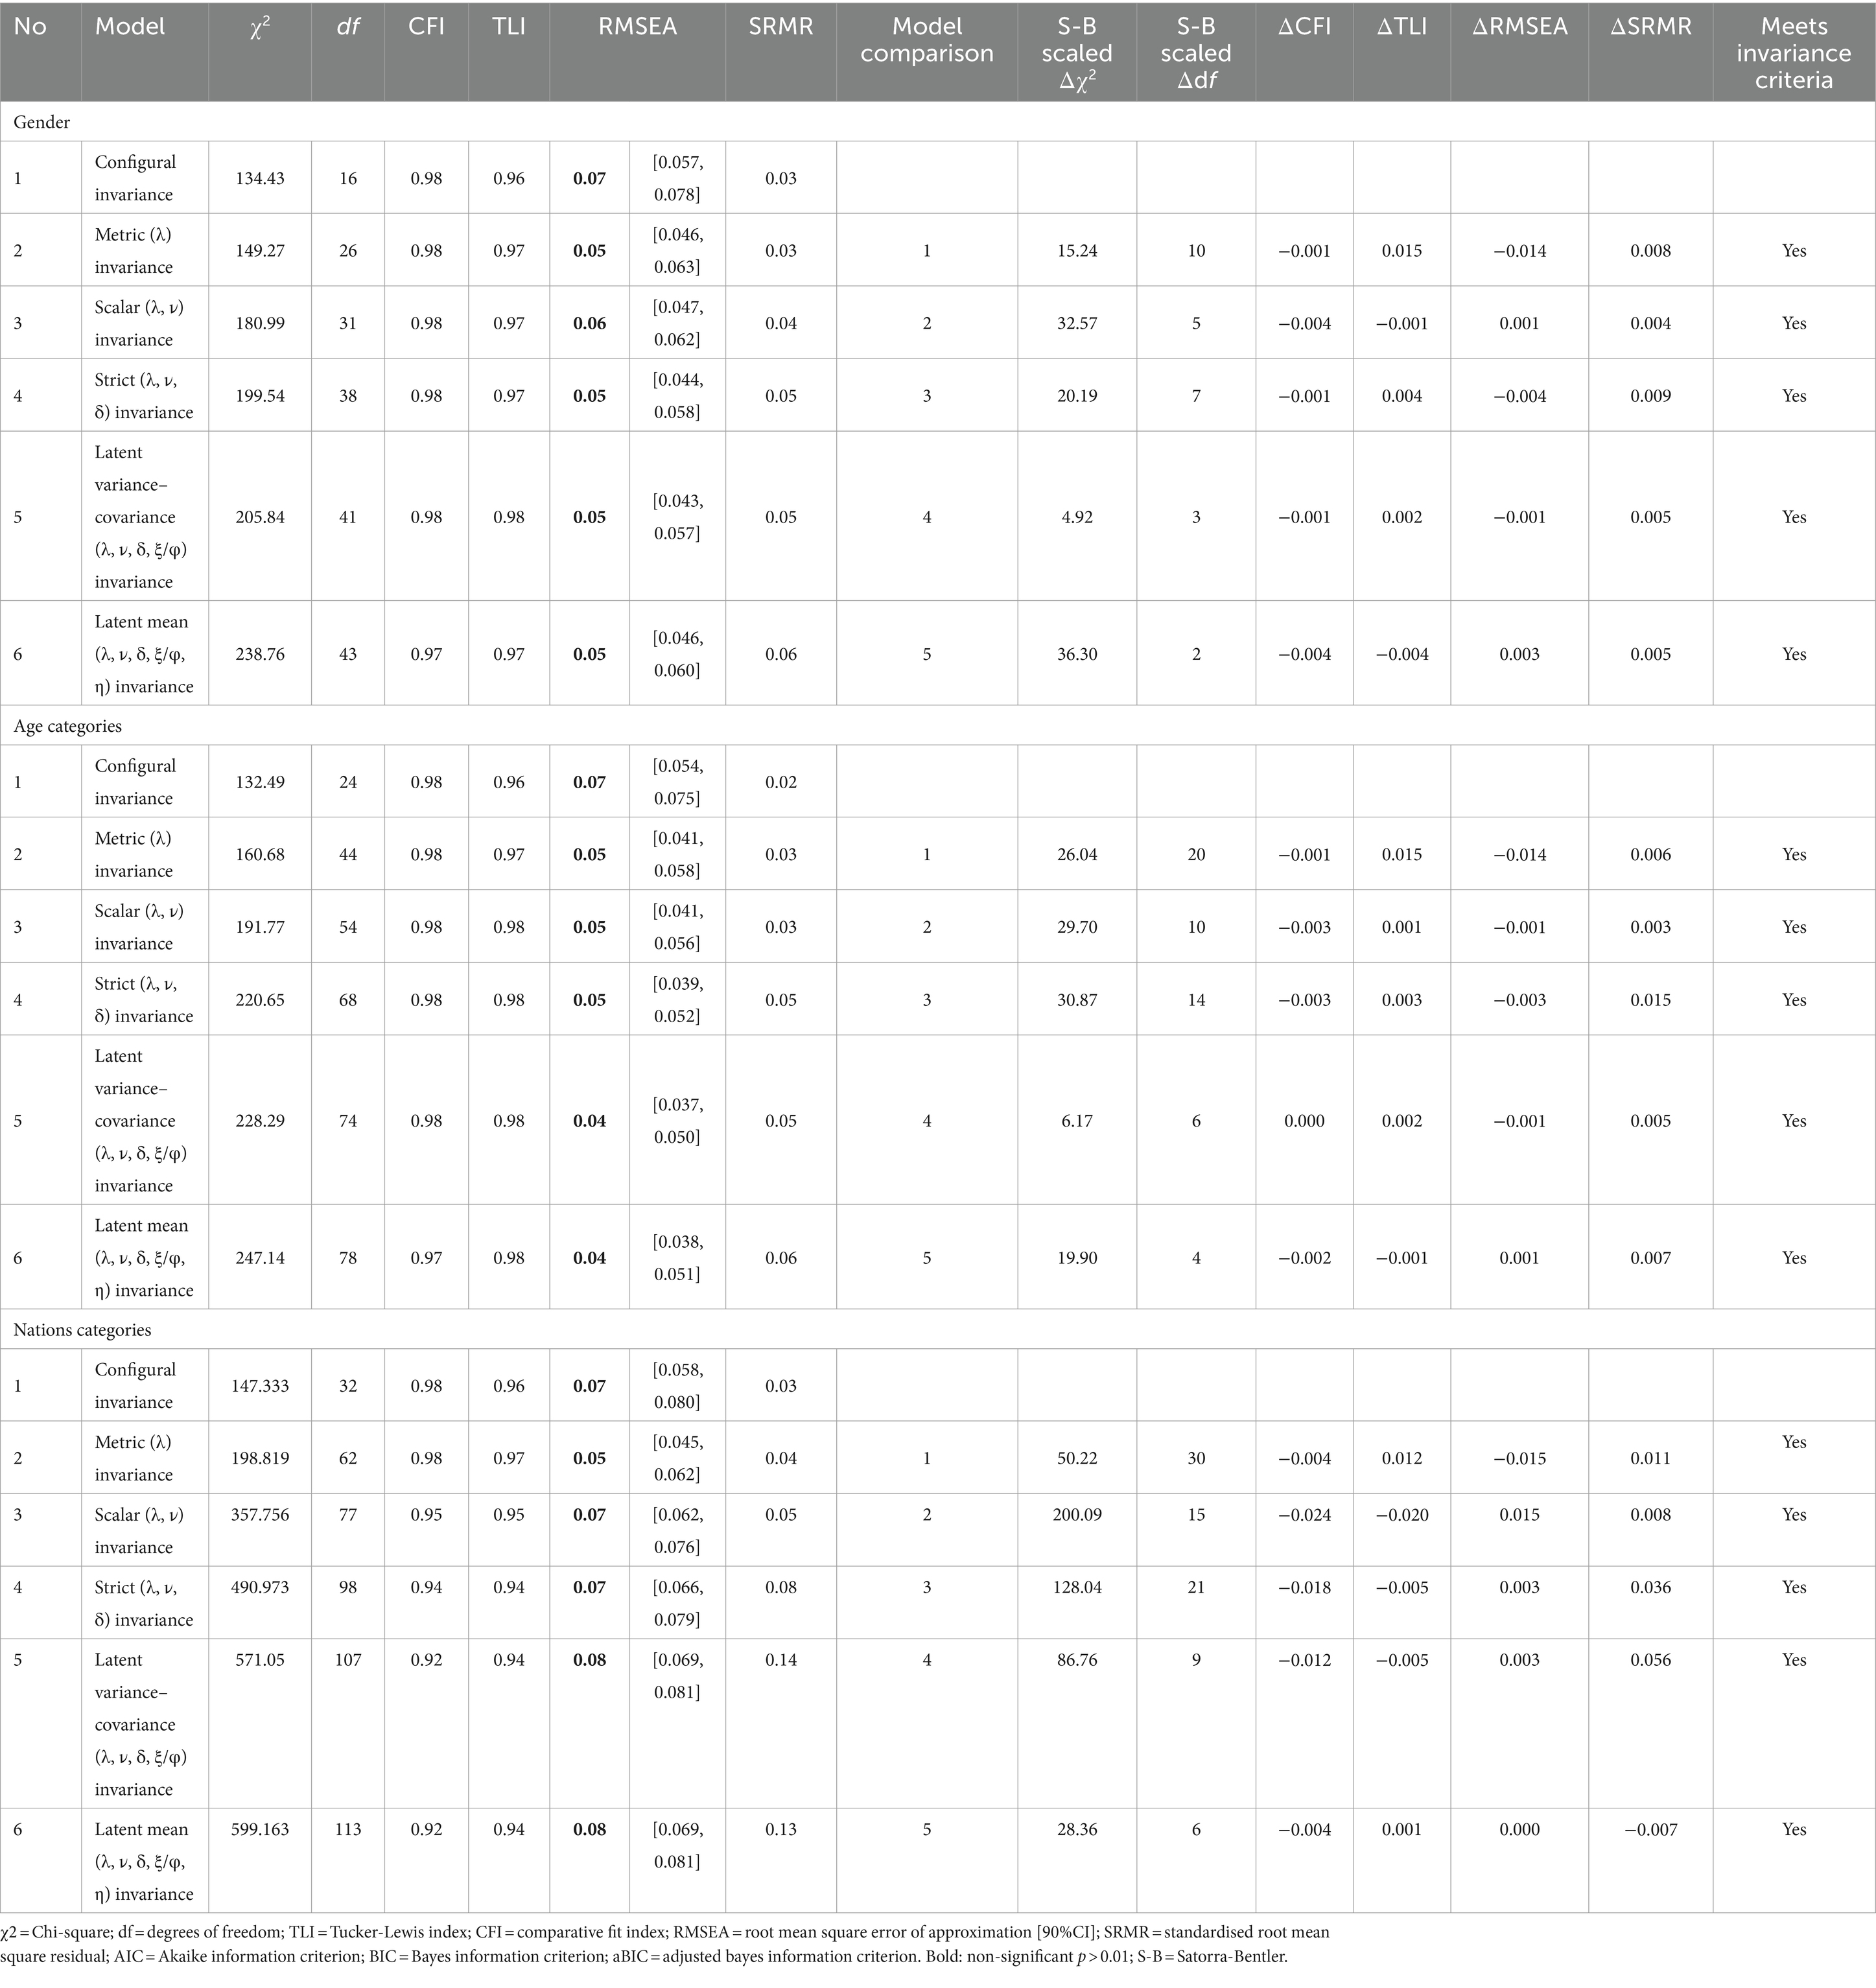
Table 4. Measurement invariance of the H-ESEM model.
Item level parameter estimates and internal consistency
The item level parameter estimates and internal consistency of the H-ESEM Model of the TPS is summarised in Table 5. The results showed that all items loaded statistically significantly onto their a priori factorial model with standardised factor loadings ranging from 0.42 to 0.96. Results supported the reliability of the instrument with McDonald’s Omega ranging from 0.77 to 0.84.
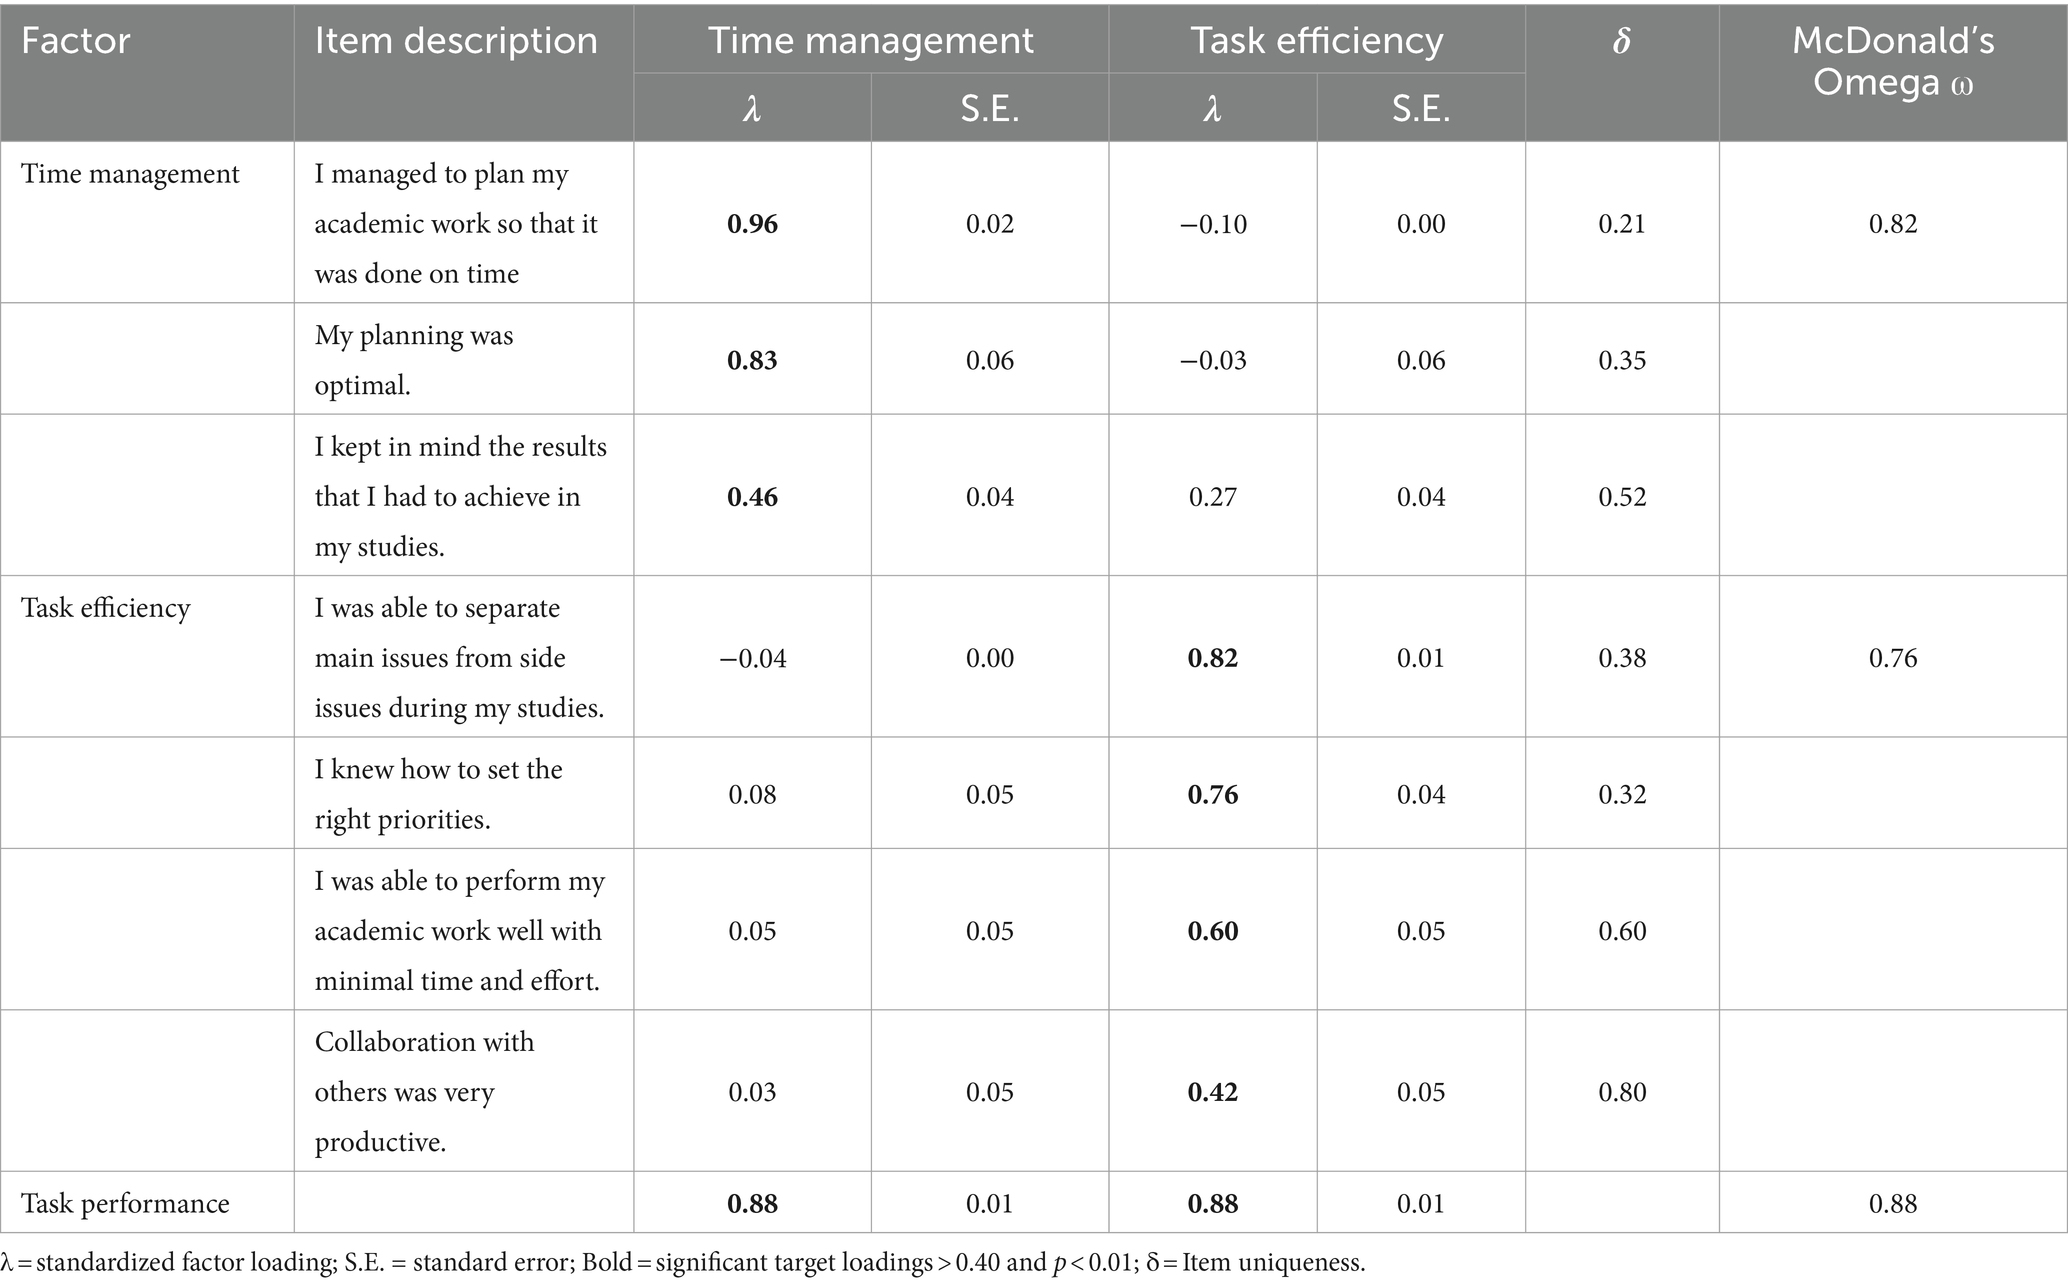
Table 5. Factor loadings and internal consistency of model 6: H-ESEM model with one higher-order (task performance) and two first order factors (time management & task efficiency).
Discussion
This study provides preliminary evidence supporting the reliability and factorial validity of the TPS for assessing students’ academic task performance. The results showed that a hierarchical ESEM model with one overall task performance factor comprised of a dynamic interaction between time management and task efficiency, fitted the data best. This model is in line with Koopmans’s (2014) original work, as task performance is both a function of, but also sperate from, Time Management and Task Efficiency. There is an overall factor associated with Task Performance which captures performance, and two factors (time management and task efficiency) which contribute to, but are also sperate from Task performance. Therefore, in the present study we found support for the original idea indicating a second order factor model.
The TPS exhibited full measurement invariance across gender and age groups, which implies that the latent mean sores can be used to determine differences between groups. However, invariance could only partially be established for national cohorts implying that there are differences in how students from different nations interpret items. Taken together, these results showed that the TPS is a valid and reliable tool to measure academic task performance.
The first objective of the study was to investigate the factorial validity and internal consistency of the TPS. A hierarchical ESEM solution emerged as the optimal factor structure, showing both excellent data-model fit and measurement quality. This suggests students’ task performance is a function of a dynamic interaction between their time management skills and the efficiency through which they complete academic tasks. It also indicates that facets of academic task performance are interrelated, challenging the rigid assumptions of orthogonal factors inherent in traditional CFA views on performance (van der Vaart, 2021). This aligns with prior research underscoring the benefits of ESEM for modelling multidimensional human behaviours compared to strict CFA techniques (Marsh et al., 2014). The TPS also exhibited good internal consistency, making it a reliable tool for evaluating students’ time management, task efficiency, and overall task performance. Overall, the TPS demonstrated sound psychometric properties, aligning with Koopmans et al.’s (2014) workplace measure.
The second objective was determining the TPS’s factorial equivalence across genders, age groups and national cohorts. The results showed that full measurement invariance could be established for genders/ages, suggesting that males and females, as well as younger and older students, interpret the TPS’s items similarly. This implies that the TPS can be used to compare scores on task performance across these demographic segments. Latent mean scores and group comparisons can be used as these reflect actual performance variations in task performance rather than differences in how items are understood (Putnick and Bornstein, 2016). However, only partial invariance could be established across different national cohorts as there are differences in how items are interpreted. This is not surprising as different educational systems exists in different nations and thus the value of time management and task efficiency may differ (van Zyl et al., 2022b).
These results carry research and practical implications. The validated TPS provides researchers with a valuable tool to explore factors driving academic success. It enables nuanced performance profiling to identify at-risk students requiring greater support. Educators can use it to assess task competencies vital for student success in specific programs and curricula (Burrus et al., 2013). However, further validation is needed to enhance its practical application. Criterion-related evidence using objective performance indicators like GPA or test scores could help establish relationships with academic achievement. Test–retest reliability assessments could also provide insights into the scale’s internal consistency over time. Evaluating the TPS’s sensitivity to instructional interventions represents another valuable direction.
While this study offers valuable insights into the psychometric properties of the TPS in academic contexts, it’s important to recognize its limitations. The research relied on a purposive sampling strategy from six international universities, potentially limiting the broader generalizability of the findings. The cross-sectional design restricts causal inferences and the tracking of task performance changes over time. The use of secondary data from several cross-cultural student well-being projects might introduce biases or inconsistencies, and the study’s sole reliance on self-reported TPS data could be influenced by social desirability or inaccurate self-assessments. Furthermore, drawing from workplace measures might not fully encapsulate the unique nuances of academic environments in the adapted TPS.
Data availability statement
The raw data supporting the conclusions of this article will be made available by the authors, without undue reservation.
Ethics statement
Ethical approval was not required for the studies involving humans because secondary data was used for this study and institutional ethical clearance was thus not required. The studies were conducted in accordance with the local legislation and institutional requirements. The participants provided their written informed consent to participate in this study.
Author contributions
LZ: Conceptualization, Conceptualization, Formal analysis, Investigation, Methodology, Project administration, Resources, Software, Validation, Visualization, Writing – original draft, Writing – review & editing. JK: Data curation, Writing – original draft. RS: Data curation, Writing – original draft. JS: Data curation, Writing – original draft. MC: Data curation, Writing – original draft. NV: Data curation, Writing – review & editing. SR: Data curation, Supervision, Writing – review & editing. VC: Data curation, Writing – review & editing. KF: Data curation, Writing – review & editing. ES-T: Data curation, Writing – review & editing. LR: Writing – review & editing. AG: Data curation, Writing – review & editing. DA: Data curation, Writing – review & editing. AG-N: Data curation, Writing – review & editing.
Funding
The author(s) declare that no financial support was received for the research, authorship, and/or publication of this article.
Conflict of interest
The authors declare that the research was conducted in the absence of any commercial or financial relationships that could be construed as a potential conflict of interest.
Publisher’s note
All claims expressed in this article are solely those of the authors and do not necessarily represent those of their affiliated organizations, or those of the publisher, the editors and the reviewers. Any product that may be evaluated in this article, or claim that may be made by its manufacturer, is not guaranteed or endorsed by the publisher.
Supplementary material
The Supplementary material for this article can be found online at: https://www.frontiersin.org/articles/10.3389/feduc.2024.1281859/full#supplementary-material
Footnotes
References
Burrus, J., Elliott, D., Brenneman, M., Markle, R., Carney, L., Moore, G., et al. (2013). Putting and keeping students on track: Toward a comprehensive model of college persistence and goal attainment. ETS Res. Rep. Ser. 2013, 1–61.
Casillas, A., Robbins, S., Allen, J., Kuo, Y. L., Hanson, M. A., and Schmeiser, C. (2012). Predicting early academic failure in high school from prior academic achievement, psychosocial characteristics, and behavior. J. Educ. Psychol. 104, 407–420. doi: 10.1037/a0027180
Cole, M., Shankland, R., Nel, M., Knoop, H. H., Chen, S., and van Zyl, L. E. (2022). Positive educational approaches to teaching effectiveness and student well-being: contemporary approaches and guidelines. Front. Psychol. 13:1015064. doi: 10.3389/fpsyg.2022.1015064
De Beer, L. T., and Van Zyl, L. E. (2019). ESEM code generator for Mplus. Available at: http://www.surveyhost.co.za/esem/
Hayes, A. F., and Coutts, J. J. (2020). Use omega rather than Cronbach’s alpha for estimating reliability. But…. Commun. Methods Meas. 14, 1–24. doi: 10.1080/19312458.2020.1718629
Hu, L. T., and Bentler, P. M. (1999). Cutoff criteria for fit indexes in covariance structure analysis: conventional criteria versus new alternatives. Struct. Equ. Model. Multidiscip. J. 6, 1–55. doi: 10.1080/10705519909540118
JASP . (2021). Jeffery’s Amazing Stats Program (v.0.15). [Statistical Software]. Accessed via the World Wide Web: https://jasp-stats.org
Kirillov, A. V., Tanatova, D. K., Vinichenko, M. V., and Makushkin, S. A. (2015). Theory and practice of time-management in education. Asian Soc. Sci. 11, 193–204.
Koopmans, L. (2014). Measuring individual work performance. PhD dissertation. University of Amsterdam, The Netherlands.
Koopmans, L., Bernaards, C. M., Hildebrandt, V. H., Van Buuren, S., Van der Beek, A. J., and De Vet, H. C. W. (2012). Development of an individual work performance questionnaire. Int. J. Product. Perform. Manag. 62, 6–28. doi: 10.1108/17410401311285273
Li, C.-H. (2016). Confirmatory factor analysis with ordinal data: comparing robust maximum likelihood and diagonally weighted least squares. Behav. Res. Methods 48, 936–949. doi: 10.3758/s13428-015-0619-7
Locke, E. A., and Latham, G. P. (Eds.) (2013). New developments in goal setting and task performance. New York, NY: Routledge.
Lounsbury, J. W., Sundstrom, E., Loveland, J. L., and Gibson, L. W. (2003). Broad versus narrow personality traits in predicting academic performance of adolescents. Learn. Individ. Differ. 14, 65–75. doi: 10.1016/j.lindif.2003.08.001
MacCann, C., Duckworth, A. L., and Roberts, R. D. (2009). Empirical identification of the major facets of conscientiousness. Learn. Individ. Differ. 19, 451–458. doi: 10.1016/j.lindif.2009.03.007
Marsh, H. W., Morin, A. J., Parker, P. D., and Kaur, G. (2014). Exploratory structural equation modeling: An integration of the best features of exploratory and confirmatory factor analysis. Annu. Rev. Clin. Psychol. 10, 85–110.
Morin, A. J. S. (2023). “Exploratory structural equation modeling” in Handbook of structural equation modeling. ed. R. H. Hoyle . 2nd ed (New York, NY: Guilford), 503–524.
Morin, A. J. S., Myers, N. D., and Lee, S. (2020). “Modern factor analytic techniques: bifactor models, exploratory exploratory structural equation Modeling 19 structural equation modeling and bifactor-ESEM” in Handbook of sport psychology. eds. G. Tenenbaum and R. C. Eklund, vol. 2. 4th ed (New York, NY: Wiley Publishers), 1044–1073.
Putnick, D. L., and Bornstein, M. H. (2016). Measurement invariance conventions and reporting: the state of the art and future directions for psychological research. Dev. Rev. 41, 71–90. doi: 10.1016/j.dr.2016.06.004
van der Vaart, L. (2021). The performance measurement conundrum: construct validity of the individual work performance questionnaire in South Africa. S. Afr. J. Econ. Manag. Sci. 24:3581. doi: 10.4102/sajems.v24i1.3581
van Zyl, L. E., Heijenk, B., Klibert, J., Shankland, R., Verger, N. B., Rothmann, S., et al. (2022b). Grit across nations: the cross-National Equivalence of the grit-O scale. J. Happiness Stud. 23, 3179–3213.
van Zyl, L. E., Klibert, J., Shankland, R., See-To, E. W. K., and Rothmann, S. (2022a). The general academic self-efficacy scale: Psychometric properties, longitudinal invariance and criterion validity. J. Psychoeduc. Assess. doi: 10.1177/07342829221097174
Van Zyl, L. E., and Ten Klooster, P. M. (2022). Exploratory structural equation modelling: practical guidelines and tutorial with a convenient online tool for Mplus. Front. Psych. 12:795672. doi: 10.3389/fpsyt.2021.795672
Wang, J., and Wang, X. (2020). Structural equation modelling: Applications using Mplus (2nd ed.). Chichester, UK: Wiley & Sons.
Wu, H., and Leung, S.-O. (2017). Can Likert scales be treated as interval scales?—a simulation study. J. Soc. Serv. Res. 43, 527–532. doi: 10.1080/01488376.2017.1329775
Keywords: academic success, task performance, measurement invariance, exploratory structural equation modelling, confirmatory factor analysis, university students
Citation: van Zyl LE, Klibert J, Shankland R, Stavros J, Cole M, Verger NB, Rothmann S, Cho V, Feng K, See-To EWK, Roll LC, Ghosh A, Arijs D and Glinska-Neweś A (2024) The academic task performance scale: psychometric properties, and measurement invariance across ages, genders and nations. Front. Educ. 9:1281859. doi: 10.3389/feduc.2024.1281859
Edited by:
Begoña Espejo, University of Valencia, SpainReviewed by:
Christophe Dierendonck, University of Luxembourg, LuxembourgJose Manuel Tomas, University of Valencia, Spain
Copyright © 2024 van Zyl, Klibert, Shankland, Stavros, Cole, Verger, Rothmann, Cho, Feng, See-To, Roll, Ghosh, Arijs and Glinska-Neweś. This is an open-access article distributed under the terms of the Creative Commons Attribution License (CC BY). The use, distribution or reproduction in other forums is permitted, provided the original author(s) and the copyright owner(s) are credited and that the original publication in this journal is cited, in accordance with accepted academic practice. No use, distribution or reproduction is permitted which does not comply with these terms.
*Correspondence: Llewellyn Ellardus van Zyl, bGxld2VsbHluMTAxQGdtYWlsLmNvbQ==