 Ian Kingsbury
- Educational Freedom Institute, Phoenix, AZ, United States
The COVID-19 pandemic imposed unprecedented disruptions on American education and contributed to profound learning loss. The stakes attached to learning loss are especially high for charter schools, whose survival and potential expansion or replication is heavily tied to test score performance. Using nationwide school-level proficiency data, this study examines achievement patterns in the charter sector between 2018–19 and 2020–21. Overall, it emerges that school proficiency rates in 2018–19 remained strongly predictive of proficiency rates in 2020–21. Still, certain notable patterns emerge from the data. Charters that serve more Black, Hispanic, and economically disadvantaged students lost more ground. Moreover, charters affiliated with education management organizations experienced less learning loss than other types of charter schools.
Introduction
The COVID-19 pandemic forced school closures in all 50 states in the Spring of 2020. States took different approaches during the 2020–21 school year, as some governors ordered schools to fully reopen, some entrusted the decision entirely to districts, and others imposed capacity restrictions on in-person learning (Education Week, 2020). Schools that were closed for longer periods of time on average experienced greater levels of learning loss (Halloran et al., 2021). However, the overall pattern obfuscates great variation, as some districts that were closed for short periods of time experienced dramatic learning loss and other districts that closed for long periods of time experienced comparatively modest learning loss (Thompson, 2022). That scores appear to have declined in the overwhelming majority of districts-regardless of learning modality-signals that the pandemic was disruptive to learning in ways that transcended school closures (Fahle et al., 2023). In addition to length of school closure, researchers have observed that learning loss was particularly pronounced in schools that serve a greater share of low-income, Black, or Hispanic students (Goldhaber et al., 2022; Kuhfeld et al., 2022). This pattern threatens to exacerbate adult disparities in employment and earnings (Donnelly and Patrinos, 2022).
Researchers and education observers have noted that school responses to COVID varied according to school sector and posited that these differences reflect variation in the composition of students served, teacher union influence, and incentives. Private schools generally reopened faster than public schools. In the Fall of 2020, a nationally representative panel found that fewer than one quarter of parents of public school students reported that their school had fully resumed in-person learning compared to 60% of private school parents (Henderson et al., 2020). After decades of decline, enrollment in private schools surged in 2020–21 largely owing to demand for in-person instruction (Peterson, 2022). Public schools were sometimes restricted in their decision making by state mandates. In settings where districts were afforded discretion, teacher union strength was predictive of lengthier school closures (DeAngelis and Makridis, 2021; Marianno et al., 2022). Overall, public school enrollment (charter schools exclusive) shrank by 1.4 million students between Fall 2019 and Fall 2020 (Dee, 2022). Enrollment declines were steeper in districts that exclusively offered remote instruction during the 2020–2021 school year (Dee et al., 2021).
Enrollment and reopening patterns in charters were markedly different than what occurred in other sectors. Urban charters-which comprise most of the charter sector-stayed closed for a longer duration than urban traditional public schools (Cohodes and Pitts, 2022). Nevertheless, enrollment in charters swelled in the first months of the pandemic before leveling off in 2021–22 (Jacobs and Veney, 2022). Petrilli (2022) notes that concerns about COVID were comparatively greater in urban settings and speculates that their lengthier closure might better align with parental aspirations than closures in traditional public schools, which serve a population that is comparatively whiter and less urban.
Within the charter sector, anecdotal evidence suggests that charter performance varied according to charter organizational type.1 Anecdotal evidence indicates that schools affiliated with charter management organizations (CMOs) or education management organizations (EMOs) benefited from economies of scale and professionalization of services that put them in an advantaged position relative to standalone charter operators. Pondiscio (2020), for example, chronicles how one New York City-based CMO benefited from adept central leadership and support to expeditiously adapt practices to suit an online learning environment. Profit motives perhaps rendered EMOs uniquely responsive to enrolled families and sensitive to the opportunities to expand enrollment due to frustration in how other schools managed the shift to emergency remote online learning (McShane, 2021).
Compared to traditional public schools, proficiency outcomes on state tests in charter schools carry significant promise for reward in the form of charter renewal or replication (Hassel, 2013; National Association of Charter School Authorizers, 2014; Cohodes et al., 2021). Test performance also carries heightened risk of sanction in the form of charter revocation (Vergari, 2002; Bross et al., 2016; Paino et al., 2017; Kingsbury et al., 2020, 2023). Consequently, changes in the performance of charter schools through the COVID-19 pandemic are a matter of significant policy interest.
In this paper I conduct a systematic examination of changes in performance in the charter sector between 2018–19 (i.e., pre-pandemic) and 2020–21, the first meaningful dispensation of state results after the pandemic. Changes in achievement are assessed according to school demographics (i.e., race and free or reduced lunch eligibility) and organization type (i.e., standalone, EMO or CMO).
Materials and methods
Data was provided by request from the National Alliance for Public Charter Schools, a charter school advocacy organization. Data contains information for all charter schools regarding enrollment, the number of students who participated in math and English state tests, and the percentage of students who were deemed proficient or better on state tests. Data was provided for the 2018–19 and 2020–21 school year.
While the data clarify school enrollment and the number of students who participated in state tests, it does not clarify which of those students were in grades that participate in state tests. Therefore, it is not possible to determine school-level testing participation rates.
Observations are omitted if less than 30 students participated in the state test. As a rule of thumb, 30 observations are typically considered necessary for sampling to approximate a standard normal distribution. Overall, 13.8% of schools had fewer than 30 students participate in state math tests in 2018–19 and 13.5% had fewer than 30 students participate in English tests in 2018–19. Those proportions became 31.0 and 30.8%, respectively, in the 2020–2021 school year.
Research questions
This paper seeks to answer several questions. First, to what extent do 2020–21 results amount to a reshuffling of school performance? Second, how did changes in pre-and post-pandemic achievement vary according to management type? Finally, how did changes in pre-and post-pandemic proficiency vary according to school demographics?
Results
To what extent was the performance deck reshuffled?
Results from the NAEP exam revealed radical changes in state performance compared to recent historical norms. In other words, the states with the highest performance were not necessarily those with the highest performance in recent years, whereas the states with the lowest performance were not necessarily those with the lowest performance in recent years. Whether schools also experienced a dramatic reordering in terms of comparative testing performance remains unclear. To answer this question, charter proficiency rates are standardized by state and year2 (i.e., proficiency rates are standardized by proficiency rates among all charters in a given state in a given year). Then, correlational analysis reveals how strongly 2018–19 standardized scores correlate with 2020–21 standardized scores.
Correlational analysis reveals that standardized ELA proficiency in 2018–19 was correlated with proficiency two years later (i.e., 2020–21) at r = 0.862, whereas math proficiency was correlated at r = 0.818. In other words, prior school performance remained highly predictive of contemporary performance after the pandemic.
How did changes in pre-and post-pandemic achievement vary according to management type?
In 2018–19, standalone charter schools had a mean standardized proficiency score of 0.028 standard deviations in ELA and 0.007 standard deviations in math, as seen in Table 1. Meanwhile, charters affiliated with education management organizations had a − 0.079 standard deviation mean proficiency score in ELA and a − 0.080 mean proficiency score in math. Charters affiliated with charter management organizations had a mean proficiency score of −0.039 in ELA and 0.15 in math.

Table 1. Standardized comparative performance of charter schools by management type.
Two-sided difference of means test indicate that the comparatively lower proficiency rates in schools affiliated with education management organizations (compared to all other charters) was statistically significant at the 95% confidence level. Moreover, the comparatively higher proficiency levels of standalone charters in ELA was significant at the 99% confidence level while the comparatively lower proficiency rates at schools affiliated with charter management organizations was significant at the 90% confidence level.
Comparative performance by charter management type shifted notably from 2018–19 to 2020–21. Specifically, the positive gap between standalone charters and others widened. On the other hand, the deficit previously observed in schools affiliated with education management organizations shrank in both subjects such that their proficiency rates were not significantly different from charters not affiliated with EMOs. Schools affiliated with charter management organizations experienced comparatively large declines in both math and ELA proficiency.
For the sake of perspective, consider that an oft-cited charter school study produced by the Center for Research on Education Outcomes estimates that 0.01 standard deviations is equivalent to approximately 5.78 days of additional learning (Raymond et al., 2023). According to that metric, CMO schools lost a staggering 51 days worth of instructional time in math compared to other charter types, whereas EMOs gained 29 days in reading and 31 days in math, as seen in Figures 1, 2.
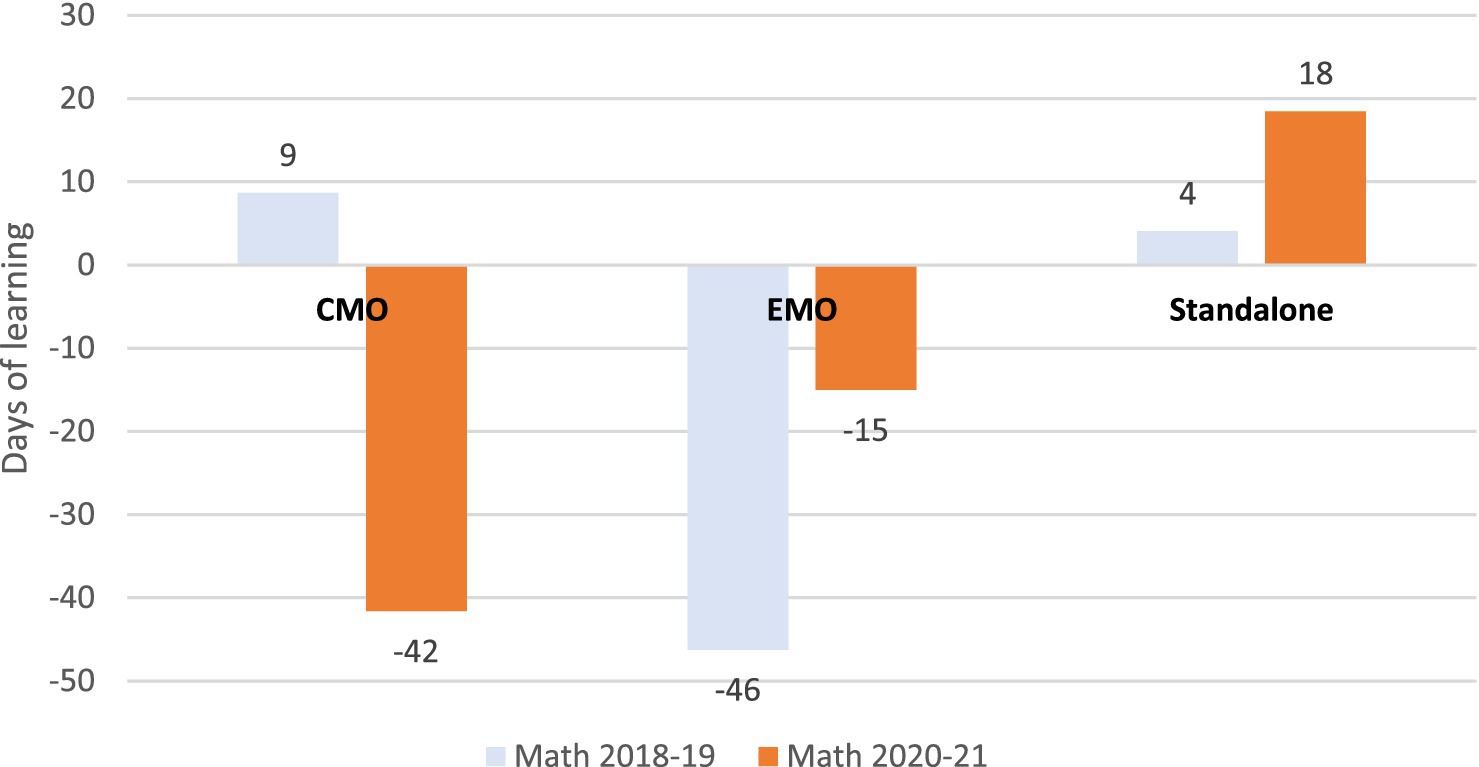
Figure 1. Changes in math achievement.
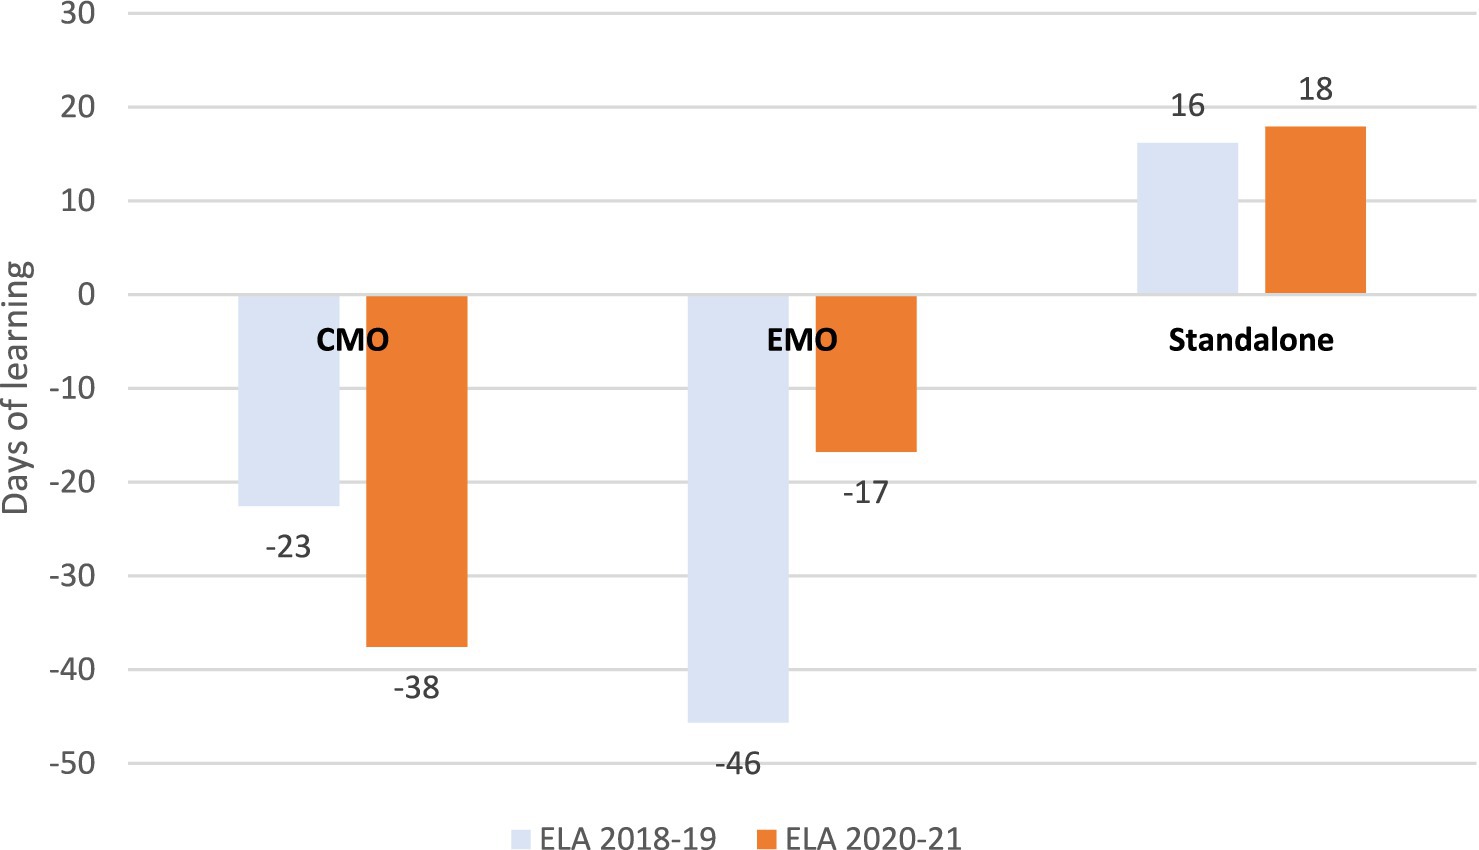
Figure 2. Changes in ELA achievement.
Advocates of charters meanwhile cite the estimated 6 additional days in math and 16 in reading as evidence of their performance advantage over traditional public schools (Wall Street Journal Editorial Board, n.d.). In other words, the changes in charter sector performance are both statistically and practically significant.
Notably, there are significant differences across charter management type in terms of the characteristics of students served. For example, charters affiliated with education management organizations serve the highest proportion of economically disadvantaged students (Dills et al., 2021) while charters affiliated with charter management organizations serve the highest proportion of Black and Hispanic students (David, 2019). To the degree that school demographics vary across charter type and to the degree that demographics might independently predict COVID learning loss, multiple regression analysis can help disentangle performance effects.
Overall, after controlling for achievement at baseline (i.e., 2018–19 proficiency) it emerges that schools affiliated with charter management organizations experienced comparatively steep performance declines in reading (Table 2) and math (Table 3). However, these differences appear to be at least somewhat explained by differences in student demographics: Both coefficients become insignificant if the model features school demographic data (i.e., the percent of students in 2018–19 who were Asian, Black, Hispanic, white, or eligible for free or reduced lunch). Changes in proficiency were comparatively static in schools affiliated with education management organizations. However, additional controls indicate that these schools overperformed expectations when adjusting for school demographics. For example, EMO status was associated with a 0.10 standard deviation improvement over CMOs or standalone charters in math proficiency after controlling for baseline performance, school demographics, and state of operation. Standalone charters overperformed others when controlling for baseline performance, but this appears to be largely attributable to enrollment that is comparatively whiter and more economically advantaged compared to other charters. Indeed, results shift from positive to null-negative after controlling for school demographics.
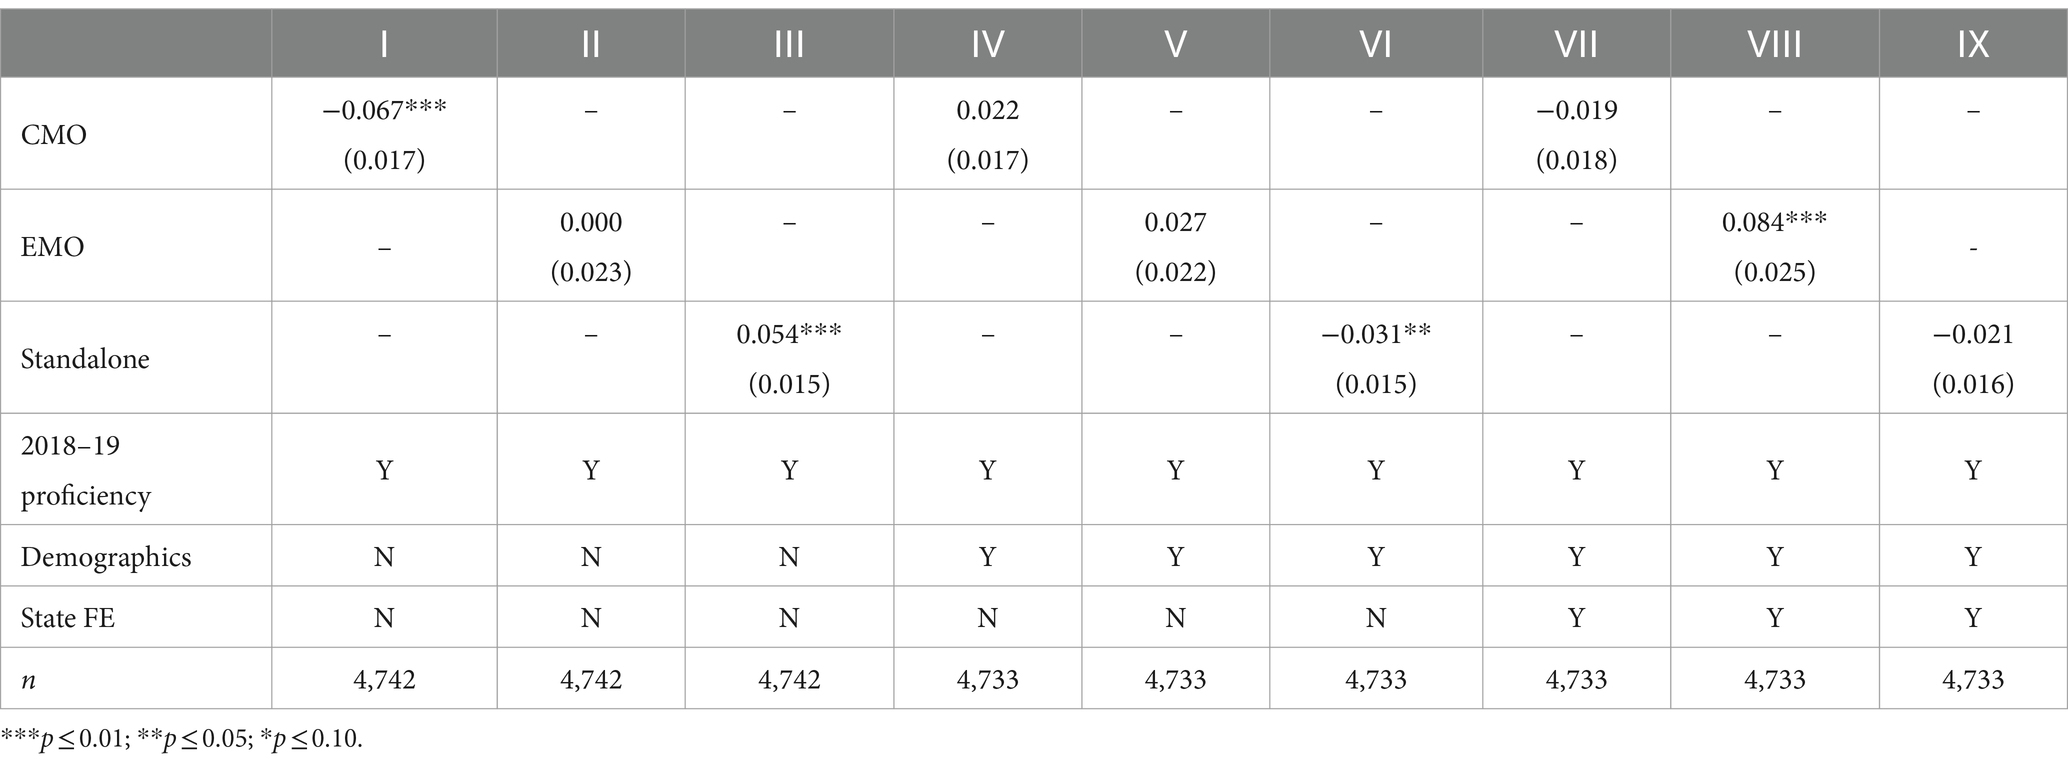
Table 2. Sector changes in ELA proficiency.
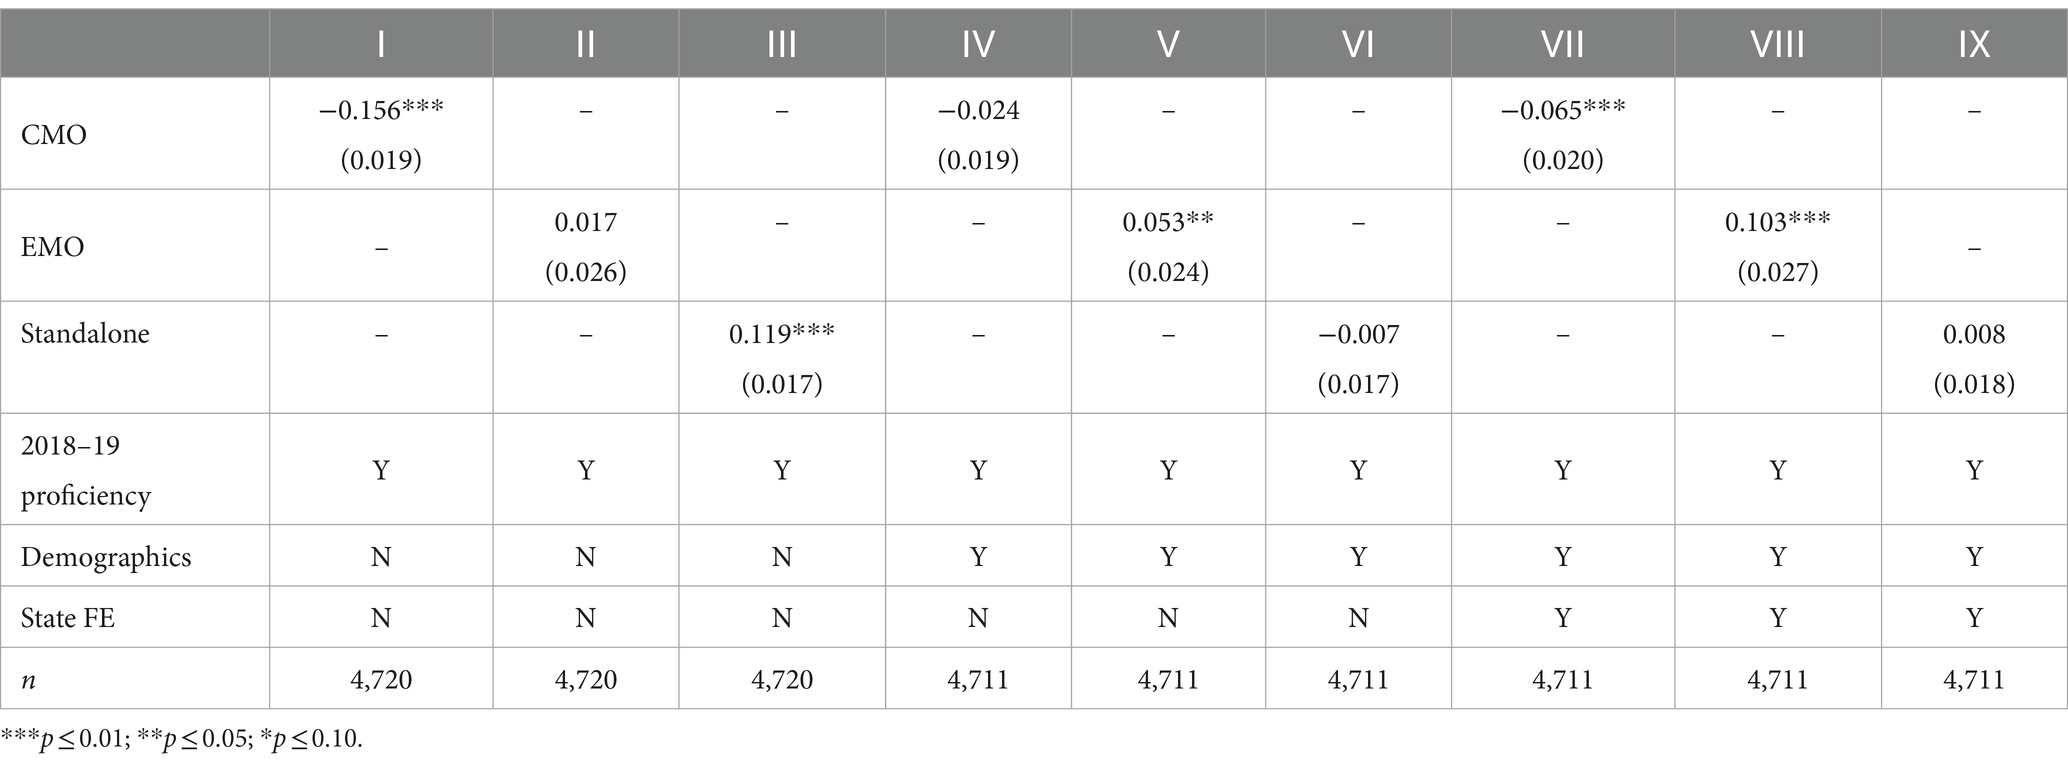
Table 3. Sector changes in math proficiency.
How did changes in pre-and post-pandemic achievement vary according to school demographics?
As previously noted, a robust literature indicates that Black, Hispanic, and economically disadvantaged students experienced more profound COVID-related learning loss. To quantify this phenomenon within the charter sector, multiple regression analysis is utilized to observe how school demographics predict 2020–21 proficiency after controlling for proficiency at baseline (i.e., 2018–19). Overall, the composition of Black, Hispanic, or economically disadvantaged students (as proxied by eligibility for free or reduced price lunch) was associated with lower proficiency. Specifically, after controlling for proficiency at baseline (i.e., 2018–19) a one percentage point increase in the composition of Black or Hispanic students was associated with a − 0.004 decrease in 2020–21 reading proficiency, as seen in Table 4. A one percentage point increase in the percentage of students eligible for free or reduced lunch was also associated with a − 0.004 standard deviation decrease. The associations are statistically significant at the 99% confidence level.

Table 4. Demographic predictors of ELA proficiency.
The story is much the same in math. A one percentage point increase in the composition of Black or Hispanic students is associated with 0.006 standard deviation decrease in proficiency after controlling for proficiency at baseline, as seen in Table 5. Meanwhile, a one percentage point increase in the composition of students eligible for free or reduced price lunch is associated with a 0.005 standard deviation decrease.
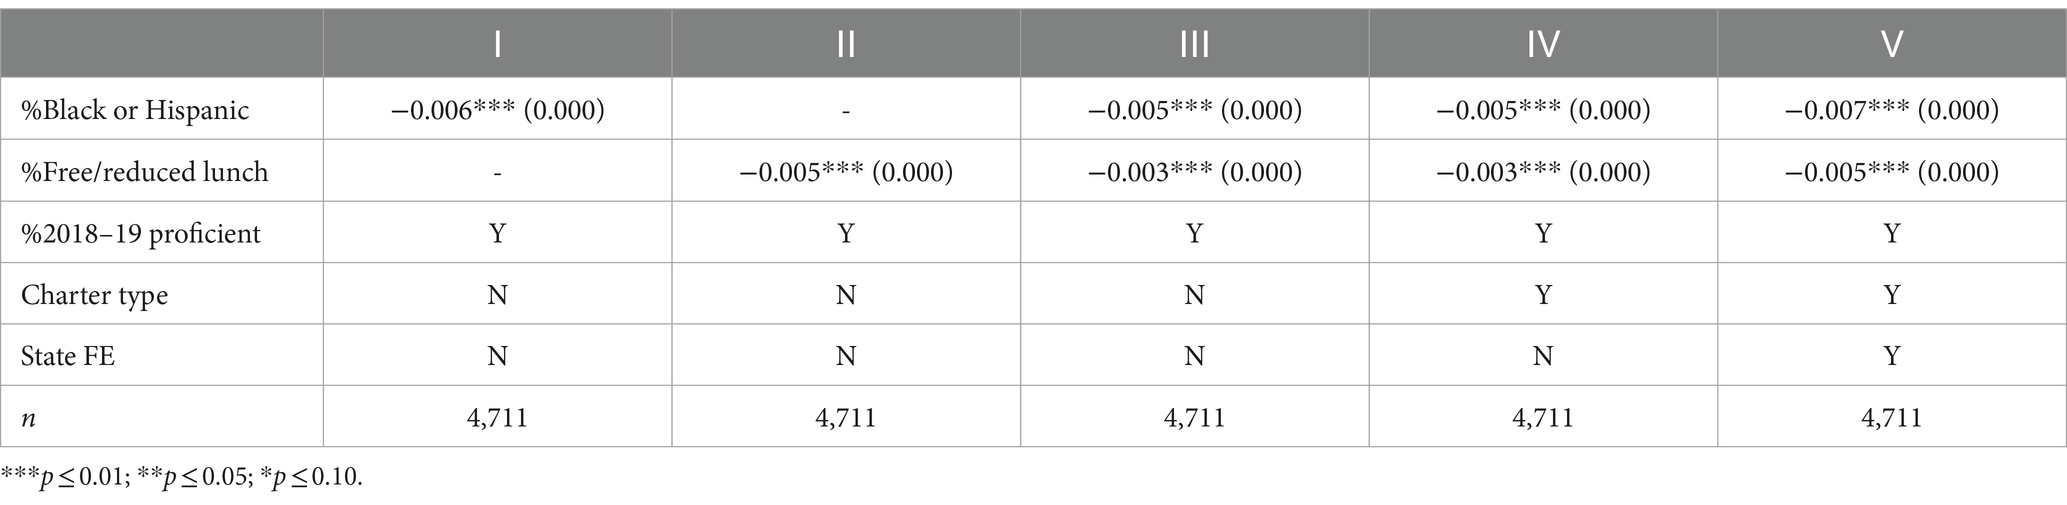
Table 5. Demographic predictors of math proficiency.
Black and Hispanic students are more likely to be economically disadvantaged. Further analysis expresses 2020–21 proficiency as a function of baseline proficiency, the proportion of Black or Hispanic students, and an indicator variable for free or reduced lunch. Such analysis helps disentangle whether poverty and race are independently predictive of changes in proficiency. Overall, the magnitude of the coefficients shrinks modestly but race and economic disadvantage remain significantly associated with proficiency declines in models that include both predictors. The findings are also robust to the inclusion of charter type and state fixed effects as predictor variables. In other words, it appears that economic disadvantage and the composition of Black or Hispanic students were independently associated with steeper levels of COVID learning loss within charter schools.
Discussion
By and large it appears that charters that were comparatively high-performing before the pandemic remained high-performing in the first meaningful dispensation of state tests after the pandemic. Similarly, low-performing charters remained comparatively low-performing. Still, notable patterns emerge. First, there were significant differences in how different types of charters fared through the pandemic. Most notably, there is strong evidence that charters affiliated with education management organizations overperformed expectations after accounting for their demographic profile. Second, learning loss in charters, like other public schools, was correlated with school demographics. Specifically, schools with higher concentrations of Black, Hispanic, or economically disadvantaged students lost more ground.
The trends observed by organizational status have notable policy implications. Education management organizations have recently drawn political ire. In July 2022 the Biden Administration finalized new regulations that established that charters that contract with for-profit entities would no longer be able to receive funds through the federal Charter Schools Program, which “provides financial assistance for the planning, program design, and initial implementation of charter schools and the replication of high quality charter schools” (National Alliance for Public Charter Schools, n.d.). The observation that EMO-affiliated charters overperformed other charters vis-à-vis COVID learning loss adds to concerns that the regulations were brought forth due to political rather than performance considerations (Northern and Petrilli, 2022). While the mechanisms for the comparatively stronger performance of charters affiliated with EMOs is unclear, that the same pattern was not observed among CMO schools hints at the possibility that profit motives created stronger incentives for successfully navigating COVID disruptions. Another explanation—not mutually exclusive of the first— is that stronger results are explained at least in part by virtual charter schools, where students learn remotely with a combination of synchronous and asynchronous instruction. EMO-affiliated charters enroll less than 20% of charter school students overall but more than half of virtual charter students (Lopez and Zarate, 2023). To the degree that virtual schools faced less disruption from the pandemic, these institutions might have buoyed the overall results of EMO affiliated schools (Kingsbury, 2021).3
On the other hand, CMO-affiliated charters experienced comparatively steep COVID learning loss compared to EMO charters or standalone charters. Though this larger decline appears to be at least partially explained by their demographic profile, accountability systems do not provide such contextualization in their interpretation of proficiency rates. As far as state regulators and agencies are concerned, it will appear that these schools experienced authentically larger declines. Whether that dents their perception as a safer bet for academic success and replication bears observation (Farrell et al., 2012).
One leading charter organization has articulated a need for caution in interpreting test scores in the wake of the pandemic and a broader, permanent sector shift toward more holistic appraisals of charter performance (Rausch, 2020). If this comes to pass then shifts in test performance could be largely inconsequential. However, whether and to what extent authorizers will heed this call remains to be seen, and indeed several charter schools have faced closure or threat of closure in 2023 and 2024 due to test score performance (Anderson, 2023; Morrison, 2023; Testino, 2023; Asmar, 2024.
Charters that serve more Black and Hispanic students are more likely to close (Paino et al., 2017), partially as a result of test-based regulatory pressures (Kingsbury et al., 2023). The comparatively steeper performance decline among charters that serve more Black and Hispanic students threatens to exacerbate this phenomenon. Some charters slated for closure due to test score performance have asked for leniency due to COVID disruptions (Bernhard, 2023; Schmidt and Pepitone, 2023), but to date no state has issued guidance that authorizers should accommodate such requests. Activists in Pennsylvania have recently agitated for reformed charter oversight owing to concerns that the state has disproportionately shuttered charters that serve higher proportions of Black and Hispanic students (Calhoun, 2021). Whether the potential exacerbation of charter closure disproportionalities reignites fresh interest in this matter in Pennsylvania or elsewhere also bears watching.
Limitations
The dataset used to conduct this analysis provided data from the universe of charter schools in the United States. However, it did not provide data from other public schools. Therefore, the results in this analysis are comparative within the charter sector and do not inform broader trends across public schools. So, for example, it’s possible that standalone charters outperformed public schools generally in terms of COVID learning loss, even if learning loss was high compared to EMO charters.
Post-COVID data comes from the 2020–21 school year. It is possible that the trends observed in that year have changed amidst a stubbornly slow and ongoing recovery. Moreover, some states relaxed testing requirements in 2020–21 due to the pandemic. While participation rates in most states exceeded 80%, certain states featured participation rates in the single digits, so there is a possibility that nonrandom patterns of uptake could skew school-or state-level results (Modan, 2021). It is not obvious, however, that potential nonrandom patterns of participation would correlate with both charter type or demographics and achievement patterns.
Finally, the early months of the COVID pandemic featured historically high rates of student mobility, including large numbers of students transferring from the traditional public school system into charter schools. Between 2019–20 and 2020–21, charter school enrollment increased by nearly 240,000 students, or 7% (Shen-Berro, 2022). Most of the growth occurred in virtual charter schools (Strauss, 2022). Because data in this analysis is at the school rather than student level, it is not possible to discern the extent to which observed achievement patterns might reflect changes in student populations rather than changes in student performance.
Conclusion
The COVID-19 pandemic was disruptive to all types of American public schools. However, the stakes of that disruption are especially high for charter schools, whose survival or potential replication is heavily tied to proficiency rates. This analysis suggests that the charters that were comparatively high-performing before the pandemic remained comparatively high-performing after and low-performing charters remained low-performing. This larger trend however obfuscates some important patterns, including steeper learning loss in charters that serve more Black and Hispanic students but more modest losses in schools affiliated with education management organizations. The potential consequences of these patterns are yet to be determined.
Data availability statement
The raw data supporting the conclusions of this article will be made available by the authors, without undue reservation.
Author contributions
IK: Data curation, Formal analysis, Methodology, Writing – original draft.
Funding
The author(s) declare that no financial support was received for the research, authorship, and/or publication of this article.
Conflict of interest
The author declares that the research was conducted in the absence of any commercial or financial relationships that could be construed as a potential conflict of interest.
Publisher’s note
All claims expressed in this article are solely those of the authors and do not necessarily represent those of their affiliated organizations, or those of the publisher, the editors and the reviewers. Any product that may be evaluated in this article, or claim that may be made by its manufacturer, is not guaranteed or endorsed by the publisher.
Footnotes
1. ^About 65% of charters are standalone institutions that manage their own operations. About 26% are affiliated with charter management organizations (CMOs), business entities separate from the schools themselves that manage at least three schools. Another 9% are education management organizations, which are organized in the same way as EMOs but the business entity operates with a for-profit tax status (White and Xu, 2022).
2. ^Ideally scores would also be standardized by grade level. However, the dataset provides a single schoolwide proficiency rate for ELA and math, so grade-level standardization is not possible.
3. ^The dataset provided by NAPCS did not identify full-time virtual schools, so the role of virtual charters in buoying EMO results is not testable for the purposes of this paper.
References
Anderson, D. (2023). Buffalo collegiate charter school to close in June; 300 students affected. Buffalo News. Available at: https://buffalonews.com/news/local/education/buffalo-collegiate-charter-school-to-close-in-june-300-students-affected/article_a0050414-b6fb-11ed-a9f5-239331492705.html
Asmar, M. (2024). Denver school board vote on academy 360 charter turns into debate on how to measure academic success. Chalkbeat. Available at: https://www.chalkbeat.org/colorado/2024/01/12/denver-academy-360-charter-renewal-test-score-accountability-debate/
Bernhard, B. (2023). La Salle charter School in North St. Louis to close for academic failures. St. Louis-Dispatch. Available at: https://www.stltoday.com/news/local/education/la-salle-charter-school-in-north-st-louis-to-close-for-academic-failures/article_8f389a96-4435-5848-bf07-1e58aa1709ea.html
Bross, W., Harris, D., and Liu, L. (2016). The effects of performance-based charter school closure and charter takeover on student performance : Education Research Alliance for New Orleans.
Calhoun, J. (2021). Racial allegations thrown over provision given to one Philadelphia black-led charter high school. Chalkbeat Philadelphia. Available at: https://philadelphia.chalkbeat.org/2021/6/4/22519740/racial-allegations-thrown-over-provision-given-to-one-philadelphia-black-led-charter-high-school
Cohodes, S., and Pitts, C. (2022). Center for Reinventing Public Education. Available at: https://crpe.org/wp-content/uploads/final-COVID-school-data-hub-blog.pdf
Cohodes, S., Setren, E., and Walters, C. (2021). Can successful schools replicate? Scaling up Boston’s charter school sector. Am Econ J Econ Policy 13, 138–167. doi: 10.1257/pol.20190259
David, R. (2019). National charter school management overview : National Alliance for Public Charter Schools Available at: https://www.publiccharters.org/sites/default/files/documents/2019-06/napcs_management_report_web_06172019.pdf.
DeAngelis, C., and Makridis, C. (2021). Are school reopening decisions related to union influence? Soc. Sci. Q. 102, 2266–2284. doi: 10.1111/ssqu.12955
Dee, T. (2022). Public school enrollment is down by more than a million. Why? Education Week. Available at: https://www.edweek.org/leadership/opinion-public-school-enrollment-is-down-by-more-than-a-million-why/2022/11
Dee, T., Huffaker, E., Philips, C., and Sagara, E. (2021). The revealed preferences for school reopening: Evidence from public school disenrollment : Stanford Center for Education Policy Analysis Working Paper No. 21-07.
Dills, A., Wolf, P., DeAngelis, C., May, J., Maloney, L., and Syftestad, C. (2021). Charter school funding: Dispelling myths about EMOs, expenditure patterns & nonpublic dollars : University of Arkansas Department of Education Reform Available at: https://files.eric.ed.gov/fulltext/ED619348.pdf.
Donnelly, R., and Patrinos, H. (2022). Learning loss during Covid-19: an early systematic review. Prospects (Paris) 51, 601–609. doi: 10.1007/s11125-021-09582-6
Education Week. (2020). Map: Where were schools required to be open for the 2020–2021 school year? Available at: https://www.edweek.org/leadership/map-where-are-schools-closed/2020/07
Fahle, E., Kane, T., Patterson, T., Reardon, S., Staiger, D., and Stuart, E. (2023). School district and community factors associated with learning loss during the COVID-19 pandemic. Cambridge, MA: Harvard University Center for Education Policy Research.
Farrell, C., Wohlstetter, P., and Smith, J. (2012). Charter management organizations: an emerging approach to scaling up what works. Educ. Policy 26, 499–532. doi: 10.1177/0895904811417587
Goldhaber, D., Kane, T. J., McEachin, A., Morton, E., Patterson, T., and Staiger, D. O. (2022). The consequences of remote and hybrid instruction during the pandemic (working paper No. 30010). Cambridge, MA: National Bureau of Economic Research.
Halloran, C., Jack, R., Okun, J., and Oster, E. (2021). Pandemic schooling mode and student test scores: evidence from US states. Cambridge, MA: National Bureau of Economic Research Working Paper No. 29497.
Hassel, B. (2013). Authorizers: See what replacing failing charter schools, replicating great ones can do. Education Next. Available at: https://www.educationnext.org/authorizers-see-what-replacing-failing-charter-schools-replicating-great-ones-can-do/
Henderson, M., Peterson, P., and West, M. (2020). Pandemic parent survey finds perverse pattern: students are more likely to be attending school in person where COVID is spreading more rapidly. Educ. Next 21, 34–49.
Jacobs, D., and Veney, D. (2022). Changing course: public school enrollment shifts during the pandemic. Washington DC: National Alliance for Public Charter Schools.
Kingsbury, I. (2021). Online learning: how do brick and mortar schools stack up to virtual schools? Educ. Inf. Technol. 26, 6567–6588. doi: 10.1007/s10639-021-10450-1
Kingsbury, I., Maranto, R., and Bradley-Dorsey, M. (2023). Charter school closing inequities: do automatic closure laws target black charter entrepreneurs and black students? Race Ethn. Educ. 26, 226–239. doi: 10.1080/13613324.2022.2088721
Kingsbury, I., Maranto, R., and Karns, N. (2020). Charter school regulation as a disproportionate barrier to entry. Urban Educ. 58, 2031–2057. doi: 10.1177/0042085920923
Kuhfeld, M., Soland, J., and Lewis, K. (2022). Test score patterns across three COVID-19-impacted school years. Educ. Res. 51, 500–506. doi: 10.3102/0013189X221109178
Lopez, N. C., and Zarate, M. (2023). How are charter schools managed? National Alliance for public charter schools. Available at: https://data.publiccharters.org/digest/charter-school-data-digest/who-manages-charter-schools/
Marianno, B. D., Hemphill, A., Loures-Elias, A. P., Garcia, L., Cooper, D., and Coombes, E. (2022). Power in a pandemic: teachers’ unions and their responses to school reopening. AERA Open 8:233285842210743. doi: 10.1177/23328584221074337
Modan, N. (2021). 2021 testing participation varies widely—What will data mean for districts? K-12 dive. Available at: https://www.k12dive.com/news/2021-testing-participation-varies-widely-what-will-data-mean-for-district/608939/
Morrison, S. (2023). Charlotte charter school facing state shutdown due to low performance scores. WCNC Charlotte. Available at: https://www.wcnc.com/article/news/local/east-charlotte-charter-school-facing-state-shutdown-north-carolina-education-schools-charter-system/275-5ecab491-8fa4-4518-8390-86c4ecb301af
National Alliance for Public Charter Schools. (n.d.). Charter schools program. Available at: https://www.publiccharters.org/our-work/federal-policy/charter-schools-program
National Association of Charter School Authorizers. (2014). Replicating quality. Available at: http://qualitycharters.org/wp-content/uploads/2016/01/ReplicatingQuality_ExecutiveSummary.2014.01.pdf
Northern, A., and Petrilli, M. (2022). Judge “for-profit” charter schools on their results, not the tax status of their main vendor. Fordham Institute. Available at: https://fordhaminstitute.org/national/commentary/judge-profit-charter-schools-their-results-not-tax-status-their-main-vendor
Paino, M., Boylan, R., and Renzulli, L. (2017). The closing door. Sociol. Perspect. 60, 747–767. doi: 10.1177/0731121416674948
Peterson, P. (2022). Private schools are rebounding-but can it last? The Hill. Available at: https://thehill.com/opinion/education/3633013-private-schools-are-rebounding-but-can-it-last/
Petrilli, M. (2022). Charter schools complicate the narrative on COVID shutdowns and learning loss. Fordham Institute. Available at: https://fordhaminstitute.org/national/commentary/charter-schools-complicate-narrative-covid-shutdowns-and-learning-loss
Pondiscio, R. (2020). Getting distance learning right. City Journal. Available at: https://www.city-journal.org/article/getting-distance-learning-right
Rausch, K. (2020). Rausch: to support COVID generation, our definition of school quality must evolve. New toolkit focuses on student success & wellness. The 74. Available at: https://www.the74million.org/article/rausch-to-support-covid-generation-our-definition-of-school-quality-must-evolve-new-toolkit-focuses-on-student-success-wellness-2/
Raymond, M., Woodworth, J., Lee, W., and Bachofer, S. (2023). As a matter of fact: the national charter school study III 2023. Center for Research on Education Outcomes. Available at: https://ncss3.stanford.edu/wp-content/uploads/2023/06/Credo-NCSS3-Report.pdf
Schmidt, H., and Pepitone, J. (2023). Kansas City’s genesis school in danger of losing charter to operate. Fox 4. Available at: https://fox4kc.com/news/education/kansas-citys-genesis-school-in-danger-of-losing-charter-to-operate/
Shen-Berro, J. (2022). National charter school enrollment flat after early pandemic gains, according to report. Chalkbeat. Available at: https://www.chalkbeat.org/2022/11/23/23475500/national-charter-school-enrollment-flat-pandemic-report/
Strauss, V. (2022). Virtual charter schools see enrollments rise. The Washington Post. Available at: https://www.washingtonpost.com/education/2022/09/08/virtual-charter-schools-enrollments-rise/
Testino, L. (2023). More Memphis charter schools could face closure after state’s failed turnaround effort. Chalkbeat. Available at: https://www.chalkbeat.org/tennessee/2023/7/17/23797481/memphis-shelby-county-schools-tennessee-achievement-school-district-new-charters-turnaround/
Thompson, D. (2022). School closures were a failed policy. The Atlantic. Available at: https://www.theatlantic.com/newsletters/archive/2022/10/pandemic-school-closures-americas-learning-loss/671868/
Vergari, S. (2002). Charter school authorizers: public agents for holding charter schools accountable. Educ. Urban Soc. 33, 129–140. doi: 10.1177/0013124501332003
Wall Street Journal Editorial Board. Charter schools: New evidence of student success. Wall street journal. Available at: https://www.wsj.com/articles/stanford-credo-charter-schools-study-student-performance-traditional-schools-education-math-reading-1d416fe5
White, J., and Xu, Y. C. (2022). How are charter schools managed? National Alliance for Public Charter Schools. Available at: https://data.publiccharters.org/digest/charter-school-data-digest/who-manages-charter-schools/.
Keywords: charter school, school choice, education management organizations, charter management organizations, charter school accountability
Citation: Kingsbury I (2024) Weathering the storm: a descriptive examination of COVID era proficiency changes in charter schools. Front. Educ. 9:1277484. doi: 10.3389/feduc.2024.1277484
Edited by:
Raman Grover, Consultant, Vancouver, BC, CanadaReviewed by:
Sayeed Asif Akramy, Takhar University, AfghanistanTimothy Weekes, San Francisco State University, United States
Copyright © 2024 Kingsbury. This is an open-access article distributed under the terms of the Creative Commons Attribution License (CC BY). The use, distribution or reproduction in other forums is permitted, provided the original author(s) and the copyright owner(s) are credited and that the original publication in this journal is cited, in accordance with accepted academic practice. No use, distribution or reproduction is permitted which does not comply with these terms.
*Correspondence: Ian Kingsbury, aWFuc2V0aGtpbmdzYnVyeUBnbWFpbC5jb20=