 Caiwei Zhu
 Remke Klapwijk
 Miroslava Silva-Ordaz2
 Marc J. de Vries
94% of researchers rate our articles as excellent or good
Learn more about the work of our research integrity team to safeguard the quality of each article we publish.
Find out more
ORIGINAL RESEARCH article
Front. Educ., 21 December 2023
Sec. STEM Education
Volume 8 - 2023 | https://doi.org/10.3389/feduc.2023.1308117
This article is part of the Research TopicSpatial ability in STEM learningView all 9 articles
Understanding and effectively using visual representations is important to learning science, technology, engineering, and mathematics (STEM). Various techniques to visualize information, such as two- and three-dimensional graphs, diagrams, and models, not only expand our capacity to work with different types of information but also actively recruit our visual–spatial thinking. Data physicalization is emerging as a beginner-friendly approach to construct information visualization. Mapping intangible data onto tangible artifacts that possess visual, spatial, and physical properties demands an interplay of spatial thinking and hands-on manipulation. Much existing literature has explored using formatted infographics to aid learning and spatial thinking development. However, there is limited insight into how children may leverage their spatial thinking to create information visualizations, particularly tangible ones. This case study documented the data physicalization activities organized in two design classrooms of an international school in Netherlands, with 37 children aged 11–12. Seven themes relevant to spatial thinking were identified from multimodal evidence gathered from the data physicalization artifacts, classroom videos and recordings of children’s making process, and semi-structured interviews with children. Our findings suggested that these children generated various ideas to create visual–spatial forms for data with the materials at hand, such as mapping quantities to tangible materials of different sizes, using spatial ordinal arrangement, and unitizing materials to set visual parameters. Meanwhile, they evaluated and adjusted the visual–spatial properties of these materials according to the numerical data they had, crafting feasibility, and others’ spatial perspectives. What was particularly interesting in our findings was children’s iteration on their visual–spatial understandings of the intangible numerical values and the tangible materials throughout the embodied making processes. Overall, this study illustrated the different types of spatial thinking children applied to create their data physicalizations and offered insights into how embodied experiences accompanying the open-ended visualization challenge allowed children to explore and construct spatial understandings.
Growing up in a world where information is ubiquitous, children navigate through diverse visual representations of data in their daily encounters, whether it is checking nutrition labels on cereal boxes, deciphering scavenger hunt maps, or managing inventories in video games. The need to comprehend and effectively communicate information, such as data, is not only relevant but also important to children’s educational and social development (Ben-Zvi and Garfield, 2004; Dasgupta and Hill, 2017). A common resort is to use visual or tangible representations, which allow us to externalize products of thinking, aid our understanding of knowledge (Tversky, 2001; Ainsworth, 2006), and pave the way for subsequent inspection and manipulation (Fish and Scrivener, 1990; Kirsh, 2009).
Graphs, diagrams, and models are some of the common means of visualization that permeate STEM disciplines. Importantly, the learning of these visualization techniques often requires spatial thinking (Tversky, 2001; Kim and Maher, 2008; Hegarty, 2010; Höffler, 2010; Newcombe, 2010, 2017; Stieff et al., 2010; Frick and Newcombe, 2015; Baykal et al., 2018). Spatial thinking can be defined as “the mental process of representing, analyzing, and drawing inferences from spatial relations between objects or within objects” (Uttal et al., 2013a, p. 367) and is widely considered important to the learning of science, technology, engineering, arts, and mathematics (Sorby, 2009; Wai et al., 2009; Uttal et al., 2013b; Buckley et al., 2018; Zhu et al., 2023). Childhood and early adolescence mark an important period of rapid spatial ability development (Thurstone, 1955; Newcombe and Frick, 2010; Maresch and Sorby, 2021). Several studies have explored children’s understanding and uses of visual–spatial representations in relation to their spatial skills (Szechter and Liben, 2004; Hannafin et al., 2008; Frick and Newcombe, 2015). Only a select few studies shed light on how children’s creation of visualizations reflected their spatial thinking (Diezmann and Watters, 2000; Van Meter et al., 2006; Tytler and Prain, 2010), with children in grades one through six, approximately aged 6 to 12. Despite these studies, there remains a need for more research to understand how school-aged children learn, interact, and construct visual–spatial representations, as well as the potential roles spatial thinking plays in these types of learning (Ramadas, 2009; Bergey et al., 2015).
Following the call to make information visualization accessible to novices (Huron et al., 2014a), one type of information visualization technique is gaining increasing attention from researchers, data artists, and educators because of its value in education (Vande Moere and Patel, 2010) and public communication (Taylor et al., 2015). Data physicalization is defined as “a physical artifact whose geometry or material properties encode data” (Jansen et al., 2015, p. 3228). Unlike paper-based or screen-based visual representations, data physicalization leverages physicality and represents abstract information in data variables through properties of tangible objects, such as their forms, dimensions, and positions (Zhao and Vande Moere, 2008). Data physicalization activities are generally engaging and stimulate creativity, and have the potential to promote understanding of data even among novices like children (Bhargava and D'Ignazio, 2017; Kanis, 2019; Bae et al., 2022). Crafting or engaging with data physicalizations taps into our visualization and perceptual exploration competencies (Baker et al., 2009; Huron et al., 2014a,b; Jansen et al., 2015; Jansen and Hornbæk, 2015; Wun et al., 2016; Hull and Willett, 2017). In addition to providing visual cues, data physicalization affords tangible interactions that leverage our active perception skills (Jansen et al., 2015). For example, we can move our bodies to inspect physicalizations from different angles and distances. By organizing visual and tangible cues in a spatial manner, data physicalization creators make use of the spatial relations between data variables (Kirsh, 2009; Hull and Willett, 2017) to highlight meaningful associations (Lin, 1999). On the other hand, viewers apply their spatial perception skills to decipher details from visual and tangible indicators such as shape, volume, and spatial position (Jansen et al., 2015).
This case study aimed to understand how children aged 11–12 make sense of data through their spatial thinking and delved into the diverse ways children utilize spatial thinking during their data physicalization construction (see Figure 1 for an example). Specifically, given that the use of tangible materials distinguishes data physicalization from many conventional paper-based or screen-based visualizations, we also investigated how embodied interactions with tangible materials of visual–spatial properties could engage and support children’s spatial thinking.
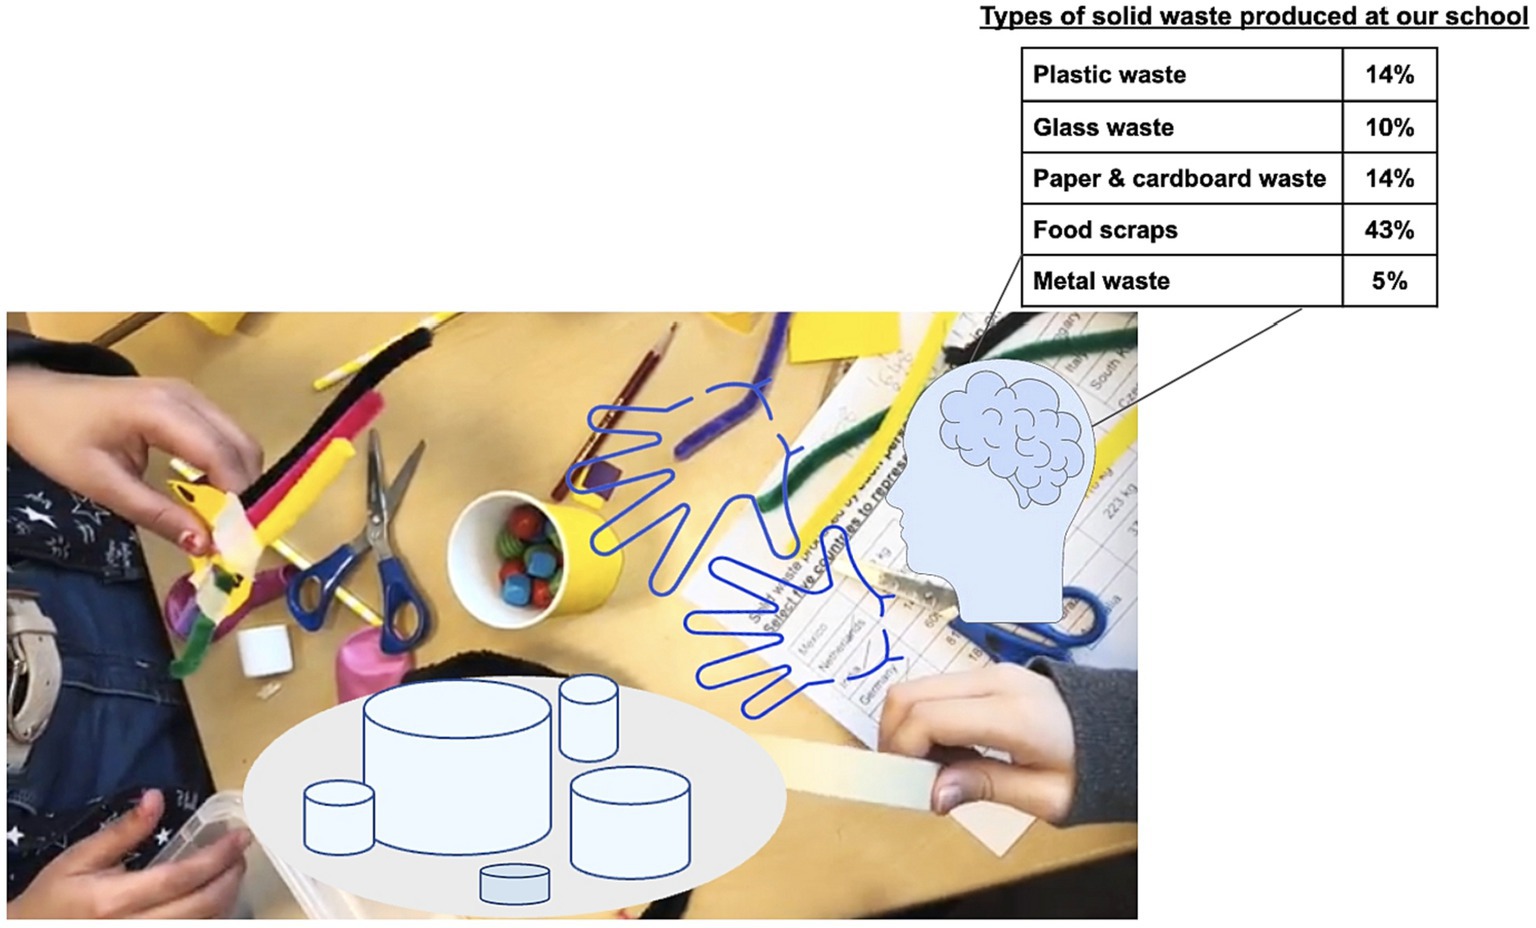
Figure 1. An illustration of children’s construction of data physicalization.
Visualizations such as cladograms in biology, ball-and-stick models in chemistry, and pulley diagrams in physics are essential tools for grasping abstract STEM concepts. Drawing on Mayer’s (2005) cognitive theory of multimedia learning, processing visualizations employs a range of our cognitive functions, such as visual perception and the visuospatial sketchpad, to select, organize, and integrate verbal or textual information into visual representations in mind, and to establish the referential mapping between them. Spatial thinking appears to be an important factor in ensuring that students effectively utilize these visualization tools to traverse different disciplines (National Research Council, 2006).
The abilities to recognize, comprehend, and make use of the information denoted by visualizations develop from a young age (Frick and Newcombe, 2015). Existing literature has mainly explored the relationship between K-12 students’ use of formatted, two-dimensional screen-based or paper-based infographics and their spatial thinking (e.g., Hannafin et al., 2008; Cromley et al., 2013; Frick and Newcombe, 2015; Kragten et al., 2015). Several studies have indicated that secondary school students’ (7th to 12th grades) self-generated visual–spatial representations are helpful tools to facilitate their science learning (e.g., Stieff, 2011; Leopold and Leutner, 2012; Cooper et al., 2017; Tytler et al., 2020). Concurrently, a selection of studies has also shed light on how self-generated visual–spatial representations recruited primary school students’ spatial thinking and helped them make sense of abstract concepts. For instance, when sixth-grade students were challenged (with support) to develop visual representations based on verbal descriptions of a bird’s wing feather placement, they utilized the spatial information provided and spatially located layers of feathers on different wing sections, consequently showing increased knowledge about the structure and mechanics of wings (Van Meter et al., 2006). A longitudinal study by Tytler and Prain (2010) reported that students progressively iterated on their spatial representations of water evaporation from grade one to six, as their understanding of this phenomenon deepened. Moreover, through a series of lessons emphasizing the use of representations, fifth and sixth graders leveraged different modes of visual–spatial representations, such as sketches, graphs, animations, and 3D models, to document their understanding of the dynamic process of water evaporation at the molecular level, demonstrating enriched science reasoning and active use of spatial reasoning (Tytler et al., 2013a).
Recently, a meta-analysis conducted by Hawes et al. (2022) examined the impact of spatial interventions, discovering that spatial training incorporating hands-on manipulatives was more effective in enhancing math performance compared to training delivered in digital or paper-pencil formats without the use of concrete materials. This finding is especially intriguing, considering a primary objective of spatial training is to enhance performance in STEM fields (Newcombe, 2010; Uttal et al., 2013b; Buckley et al., 2018; Zhu et al., 2023). It raises questions about the role of hands-on materials in fostering spatial thinking development, especially among young students. In the following section, we will review how hands-on experiences support spatial thinking and explore the prospect of understanding primary school students’ spatial thinking through data physicalization—a visualization technique that draws heavily from hands-on and embodied manipulations.
A primary means by which children make sense of and learn about their environment is by interacting with physical objects (Piaget, 1952; Inhelder and Piaget, 1964). The embodied cognition perspective, suggesting that our cognitive activities are anchored by our sensorimotor interactions with the surroundings (Wilson, 2002; Noë, 2004; Barsalou, 2008), has gained attention in various disciplines. Friedrich (1782–1852) was one of the first to take the initiative of integrating hands-on materials into the classroom to encourage self-directed playful learning among young children (Liebschner, 2006). What was later known as Fröbel’s gifts consisted of materials such as wooden spheres, cubes, planks, and prisms of different sizes and quantities. These materials allow for various possible ways of manipulation and spark children’s exploration of the properties of different shapes, dimensions, and balance. More recently, research has explored how hands-on, bodily experiences facilitate the learning and externalization of abstract knowledge (O'Malley and Fraser, 2004; Marshall, 2007; Shaer and Hornecker, 2010), such as in physics (Kontra et al., 2015), mathematics (Tsang et al., 2015), and chemistry (Stull et al., 2018). In the field of design and making, particularly, the hand plays a critical role as it “grasps the physicality and materiality of thought” (Pallasmaa, 2017, p. 104). Constructing and interacting with three-dimensional prototypes allow designers—from children to adults—to gain spatial insights and iterate on design concepts and forms (Groth and Mäkelä, 2016).
Spatial thinking, which involves many highly abstract processes that occur in the mind’s eye, also relies on spatial motor movements as one of its basic practices (Maresch and Sorby, 2021). These movements often represent an extension of the visual–spatial perception and cognitive reasoning happening in the mind. Before children develop the capacity to form abstract, verbal representations, their internal representations in the early years, as Kosslyn (1978) theorized, predominantly consist of information represented through actions and mental imagery. Hands-on manipulations, for example, can elicit motor and visual feedback on our mental imagery, enabling us to assess and modify our perceptual and spatial understanding of objects or situations (Frick et al., 2009). Through a series of experiments using the task of visualizing the water levels in tilted glasses, Frick et al. (2009) found that manually tilting the glass, as opposed to imagining the tilting in mind, supported the mental imagery of physical relations and the mental transformation of water levels among children as young as 5 years old. Link et al. (2013) discovered that having first-graders walk along a physical number line and estimate the spatial position of numbers enhanced their numerical competencies. A number of other spatial interventions have leveraged tangible resources such as paper-folding, block-building, and educational robotics to foster children’s development of spatial thinking (Casey et al., 2008; Burte et al., 2017; Julià and Antolì, 2018). For example, Burte et al. (2017) developed a series of paper engineering activities that engaged third-to-sixth-grade children in folding and cutting papers to create three-dimensional pop-ups. These embodied activities led to enhancements in children’s spatial and math task performance, especially for those in higher grades. There are many explanations for why embodied elements can support spatial thinking. For instance, hands-on manipulation can aid problem-solving when mental manipulation imposes too much cognitive load (Wilson, 2002; Shaer and Hornecker, 2010; Stull et al., 2018). Besides, tangible materials can cue mental images that enrich and refine the scope of problem exploration and solution searches (Stigler, 1984; Chao et al., 2000). There remain concerns that hands-on experiences might result in learning outcomes that are primarily due to the scaffolding provided by the manipulatives (Newcombe, 2017). Nevertheless, as the above-mentioned studies show, embodiment appears to play a meaningful role in the spatial development of children in different grades.
To date, the benefits and challenges of using visual displays, such as two- and three-dimensional graphs, diagrams, and models, to facilitate students’ subject learning and spatial skills development have been explored widely (e.g., Wu and Shah, 2004; Stieff et al., 2005). However, the understanding of children’s interaction with tangible visualization—which incorporates both visual and hands-on, embodied element—is still limited and warrants further investigation.
Many existing spatial interventions give children tasks that are analytical in nature, with close-ended, pre-determined answers. Yet from the constructionism viewpoint, children spontaneously develop knowledge and comprehension by engaging with and creating things from their physical and social surroundings (Papert, 1991, 1994), a process that is typically embodied and hands-on. Open-ended activities such as data physicalization therefore provide a window into how children construct their understanding of data by creatively using materials that have diverse visual–spatial properties and can be arranged to represent various spatial relations.
Data physicalization is essentially a process of constructing understandings of intangible data through tangible materials. It is inherently an embodied process, echoing what Wilson (2002) termed as off-loading mental activities onto the materials and the surrounding space. Unlike iconic visual–spatial displays, such as a map, where things being represented already have visible spatial properties, data physicalization often requires the maker to encode numerical information that is not inherently spatial in visual–spatial ways, and requires the viewers to decode the non-spatial information from a spatial representation of number magnitude. Drawing from the information visualization process model (Card and Mackinlay, 1997; Jansen and Dragicevic, 2013), transforming abstract data into visual or tangible representations requires visual mapping. This means assigning visual properties—which can embody spatial or graphical properties (Card and Mackinlay, 1997)—to data variables. Then, the maker carries out presentation mapping to refine the data display, such as tinkering with the way of presentation to facilitate viewers’ perception and understanding (Jansen and Dragicevic, 2013). Although this model does not depict all cognitive processes involved in constructing data physicalization, it shows that mapping intangible information and relations onto visual–spatial forms inherently requires spatial thinking, which, as discussed earlier, involves understanding, representing, and making meanings out of the spatial relations between and within objects.
Several studies have explored how visual–spatial thinking is used when constructing or interacting with data physicalization. For instance, variances in numerical data can be mapped to physical qualities such as sizes (e.g., a line of a certain length, or a 3D shape of a certain volume) (Vande Moere and Patel, 2010; Jansen and Hornbæk, 2015). Makers of data physicalization may determine the layout of the physicalization by allocating unit values to specific dimensions (e.g., lengths) or quantities of tangible objects. These visual parameters can aid in both their processing and depiction of spatial relations among data variables (Huron et al., 2014a,b). In addition, spatial arrangement and ordering can highlight hierarchical or ordinal relationships in data variables (Vande Moere and Patel, 2010; Huron et al., 2014b), reflect an efficient spatial layout (Perin, 2021), or assist viewers in comprehending and organizing information (Wun et al., 2016). Interestingly, Huron et al. (2014b) suggested that arranging tangible materials might impact people’s internal spatial organization, namely their mental representation of the spatial relationship between data points and physical objects. Overall, compared to paper-based or screen-based information visualizations, data physicalization offers tangible and embodied interactions that enrich perceptual insights (Zhao and Vande Moere, 2008; Jansen et al., 2013, 2015; Search, 2015) and prompts an inspection into the spatial organization of visual and tangible elements (Wun et al., 2016). The resulting physicalization artifacts in turn embody such spatial understandings. Notably, the low-tech, tangible resources employed in data physicalization are especially suitable for empowering young novices like children to experiment with diverse concepts and make modifications handily (Huron et al., 2014b; Bhargava and D'Ignazio, 2017; Bae et al., 2022).
Numerous data physicalization workshops have been designed for students in higher education (Vande Moere and Patel, 2010; Huron et al., 2016; Willett and Huron, 2016; Hurtienne and Reinhardt, 2017; Perin, 2021). Yet only a limited number of studies (e.g., Bhargava and D'Ignazio, 2017; Kanis, 2019; Bae et al., 2022) have delved into how younger children craft data physicalizations. These studies have primarily focused on children’s creativity, engagement, and understanding of data during the physicalization process, rather than examining children’s spatial thinking. Through this case study, we aimed to contribute to the ongoing discussion by leveraging the embodied learning experiences in data physicalization to engage children in spatial thinking.
The research questions to be addressed through our qualitative examination are:
1. How does the process of children mapping numerical data onto tangible materials reflect their spatial thinking?
2. How does the embodied process of making data physicalization stimulate children’s spatial thinking?
This study involved 37 children (18 girls, 19 boys), aged 11 to 12, from the final year of primary school at an international school in Netherlands. We selected these children because their Design and Technology teacher collaborated with the researchers to integrate data physicalization activities into the classroom. All participants provided informed consent to be part of this study. By this grade, children have knowledge of multi-digit numbers, multi-step addition and subtraction, multiplication and division, fractions and percentages, characteristics of 2D and 3D shapes, units of measurement and simple unit conversion, collecting, displaying, and interpreting data in data tables, line graphs, bar graphs, and pie charts (International Baccalaureate, 2009), which may be relevant to data physicalization construction. This study targeted students at the primary school level for several reasons. Firstly, it is important for younger students to begin developing visual literacy (Prain and Waldrip, 2010; Tytler et al., 2013b) as well as statistical and data literacy (Ben-Zvi and Garfield, 2004; Mickelson and Heaton, 2004). There remains a need to better understand how primary school students fabricate visual and tangible representations from data. Moreover, primary education places a strong emphasis on hands-on learning. Studies have shown that children from third to sixth grades all benefited from an embodied spatial training, with those at the upper primary level exhibiting more improvements in their math performance than younger children (Burte et al., 2017). Lastly, the primary curriculum is more flexible than secondary education, making it an ideal platform for integrating data physicalization activities into the classroom.
In the data physicalization activity, children used two primary categories of materials for construction: data tables and crafting materials. The data tables, curated to align with the design theme, Designing for Circular Economy, contained only the necessary information to highlight the goal of the task (Waldschütz and Hornecker, 2020). Data values, presented in non-ordered form with units of measurement suitable for this age group such as kilograms and percentages, can be seen in the supplementary materials (Supplementary Figures S1–S5). The children had the option to select from data tables detailing:
1. The percentages (by weight) of five different waste categories produced at their school in 2020;
2. The percentages (by weight) of five different waste categories generated in their native countries, sourced from the World Bank database (2018);
3. The amount (by weight) of solid waste produced per capita in 23 different countries, also sourced from the World Bank database (2018); choose five countries to represent.
A variety of crafting materials, including playdough, elastic bands, straws, pipe cleaners, paper cups and plates, yarn, beads, and balloons, were provided to enable a range of possible operations (Huron et al., 2017), such as molding, bending, tying, and stacking. These materials were familiar to the children, which should help lower the barrier to starting the activity (Bhargava and D'Ignazio, 2017).
The data physicalization activity was integrated into the Designing for Circular Economy curriculum unit, a ten-session design project1 originally created by World’s Largest Lesson in partnership with UNICEF and made use of the Your Turn to Make Your Mark in Design approach developed at TU Delft. In this design project, children explore and analyze the problem of waste, and develop design ideas by reusing, repairing, or repurposing an object for users with different needs in their family, school, or community. They then make, test, and present their designed prototypes. Collaborating with the Design and Technology teacher, the research team integrated the data physicalization activity into the first two sessions of the design project, aiming to have children explore waste-related data and gain a deeper understanding of the importance of designing through reusing and repurposing wastes.
The activities were organized in two classes: the first class of 18 children in the morning and the second class of 19 children in the afternoon, both led by the same Design and Technology teacher. The children were instructed to make creative and easy-to-understand data physicalizations based on their selected data tables. Children were free to choose to work in pairs or individually as they usually do in their design units. On average, children from both classes had 15 min to read data tables, develop initial ideas, and select crafting materials. They then dedicated around 40 min to making the tangible, visual representations of data. The activity concluded with a 15-min session where children presented their data physicalization artifacts to the class. Due to time constraints in the school schedule, only children in the afternoon class had time for in-class presentation. During the class, the researchers occasionally asked open-ended questions to children for clarification on their ideas or their making process.
A total of 23 data physicalization artifacts were created by children: 14 were made in pairs and 9 were made individually. Upon finishing their data physicalizations, children filled out a five-question self-report survey (Supplementary Figure S6) to reflect on their experience in the data physicalization activity. They gave Likert-scale ratings to five statements regarding the process of their data physicalization construction and their understanding of data. The statements were as follows: “Before making, I thought about how the visualization would look”; “During making, I checked to see if the visualization represents the data well”; “I can explain the meaning of the data to others using the visualization”; “I can understand the data better now”; “I have more ideas for what I want to design for the design challenge.” 22 self-report survey were collected. Of all the children, 22 who consented to interviews participated in brief semi-structured interviews. They were asked open-ended questions about how they developed ideas and visualized their physicalizations in mind, how they made key decisions about and changes to their physicalizations, how they thought their physicalizations could help others understand the data, and any challenges they faced.
A total of 6 h and 18 min of video/audio recordings were collected from the classroom and the semi-structured interviews. Transcriptions of classroom and interview recordings were divided into segments, with each segment capturing children’s discussion on a specific topic before transitioning to the next. These conversation segments were analyzed jointly with children’s data physicalization artifacts, constituting episodes of data.
Four researchers contributed to the iterative process of qualitative coding. The initial round of data-driven thematic analysis was carried out on MAXQDA by the principal researcher, rendering a preliminary list of themes. In the second round of coding, three other researchers were invited to independently evaluate the congruence of the themes with randomly selected episodes of data. This included a researcher in design education who is involved in the study, a researcher in mathematics education with less involvement, and another researcher in spatial language from a different institution with no involvement in the study. The four researchers discussed any disagreements regarding themes and coding interpretations. Using the iterated themes, the four researchers carried out the third round of coding, where each of them independently coded seven randomly selected data episodes. Fleiss kappa, which measures the proportion of observed agreement over and above agreement expected by chance (Fleiss and Cohen, 1973), was calculated to determine the inter-rater reliability between the four coders. The kappa value was 0.728 (95% CI, 0.613 to 0.842) with a significance level of p < 0.001, indicating a substantial level of agreement (Landis and Koch, 1977). Any remaining differences in coding were then discussed among researchers, culminating in agreement on the final list of themes as well as interpretations of the randomly selected episodes. Through the data-driven coding process, seven themes were identified to depict the different types of spatial thinking reflected in children’s data physicalization artifacts—Spatial Ways of Representation, and through their making processes—Constructing Spatial Understanding through Embodied Making.
All children were able to create data physicalizations either in pairs or individually. All but two of the data physicalization artefacts explicitly demonstrated topological relations among the data variables and could align with one or more of the spatial thinking themes we identified, either in their ways of representation, their making process, or both. The episodes presented in Table 1 and in subsequent paragraphs came from both in-class observations and semi-structured interviews with children. Note that all children’s names mentioned in these episodes have been pseudonymised. While each episode may align with more than one theme, it is listed under the theme that it reflects most prominently.
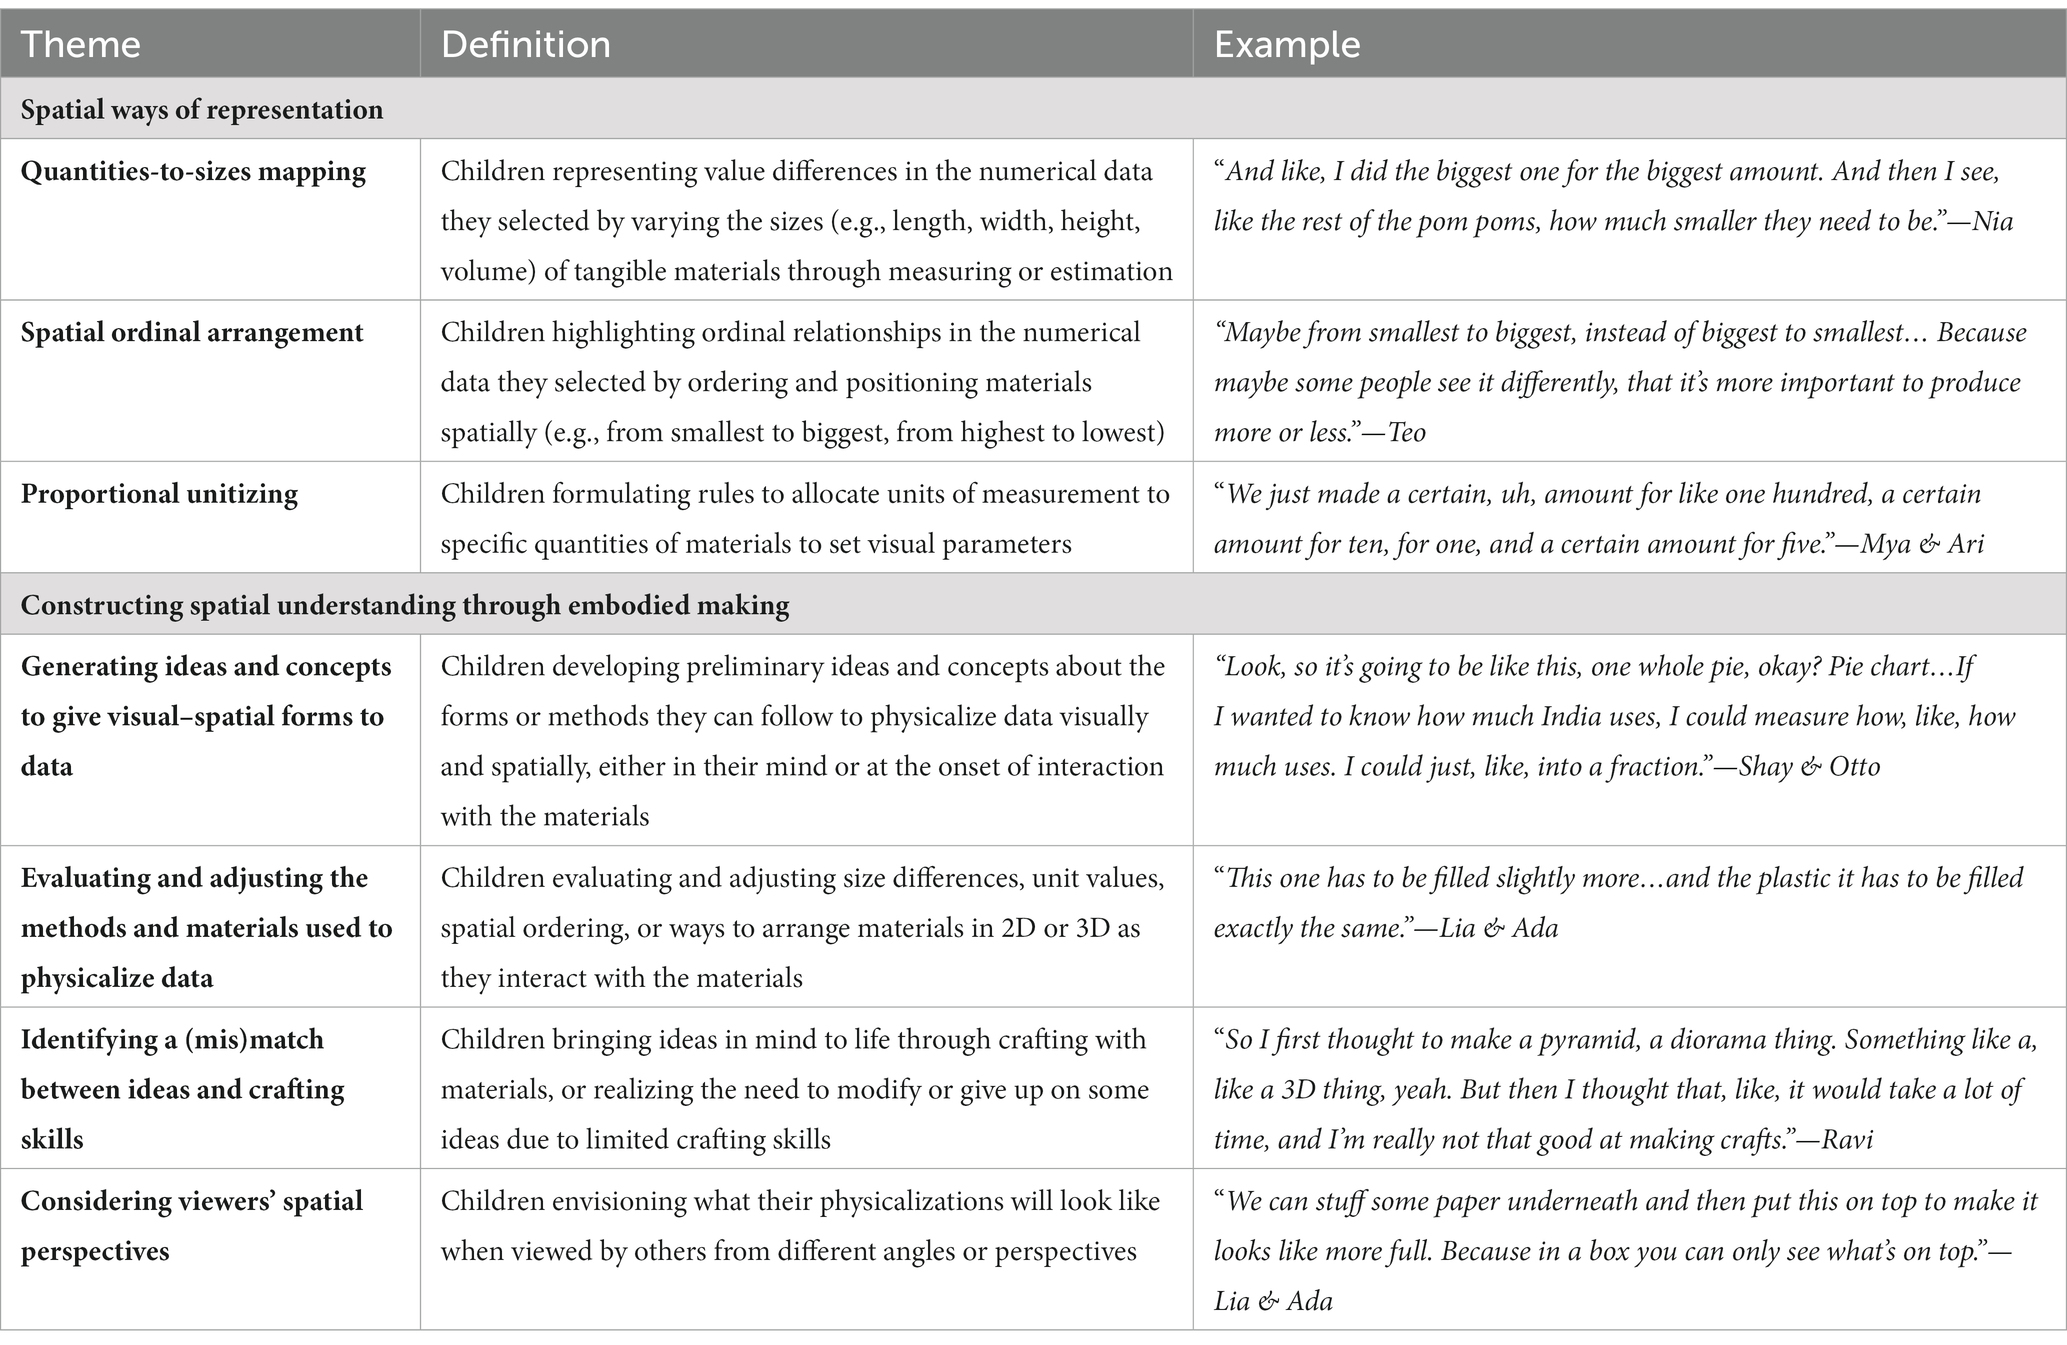
Table 1. Children’s demonstration of spatial thinking in their physicalization artifacts and during their making processes.
Here is an example of children representing value differences in the numerical data they selected by varying the sizes (e.g., length, width, height, volume) of tangible materials either through measuring or estimation (See Figure 2).

Figure 2. Pom poms of varying sizes—Beau’s team.
Beau: So, I made with my partner, like, this design to show how much waste our school produces and which type, so it’s the bigger they are, the more trash. So like, this is really small, the 10% of the trash is of glass. 14% of the paper, cardboard slash paper. Plastic is also 14%. Compostable waste is a whole 43%. And I guess Compostable Waste was made out of quite a lot of things. Also the pom poms sizes were not enough, so we decided to put multiple pom poms in the balloon to represent the compostable. So, you have to read to get the exact percentage, but you know which type of trash is more than this type of trash if you just look.
(After-class interview)
Beau and his teammate decided to use spherical pom poms of varied sizes to represent the differences in the weight (in percentages) of six types of waste produced at their school. By comparing the magnitude of numbers in percentages, they selected pom pom sizes that roughly matched the numerical values through visual estimation. It can be speculated that they either gauged the differences in these spheres’ volumes or used the diameters of the spheres as indicators of size. Beau’s explanation revealed that he was constantly relating the materials with the numerical values, displaying a clear intention to map quantities of waste to the sizes of pom poms. Interestingly, when they realized that they did not have a pom pom big enough to represent 43%—more than double the amount of represented by other pom poms—they decided to combine multiple pom poms not only to represent a much bigger amount but also to convey the idea that the compostable waste category consisted of a mix of wastes. In addition, Beau noted that their physicalization made it easy for viewers to understand the data, allowing them to directly perceive which type of waste was produced in larger or smaller quantities.
Here are two examples of children highlighting ordinal relationships in the numerical data they selected by ordering and positioning materials spatially (e.g., from smallest to biggest, from highest to lowest) (See Figure 3).
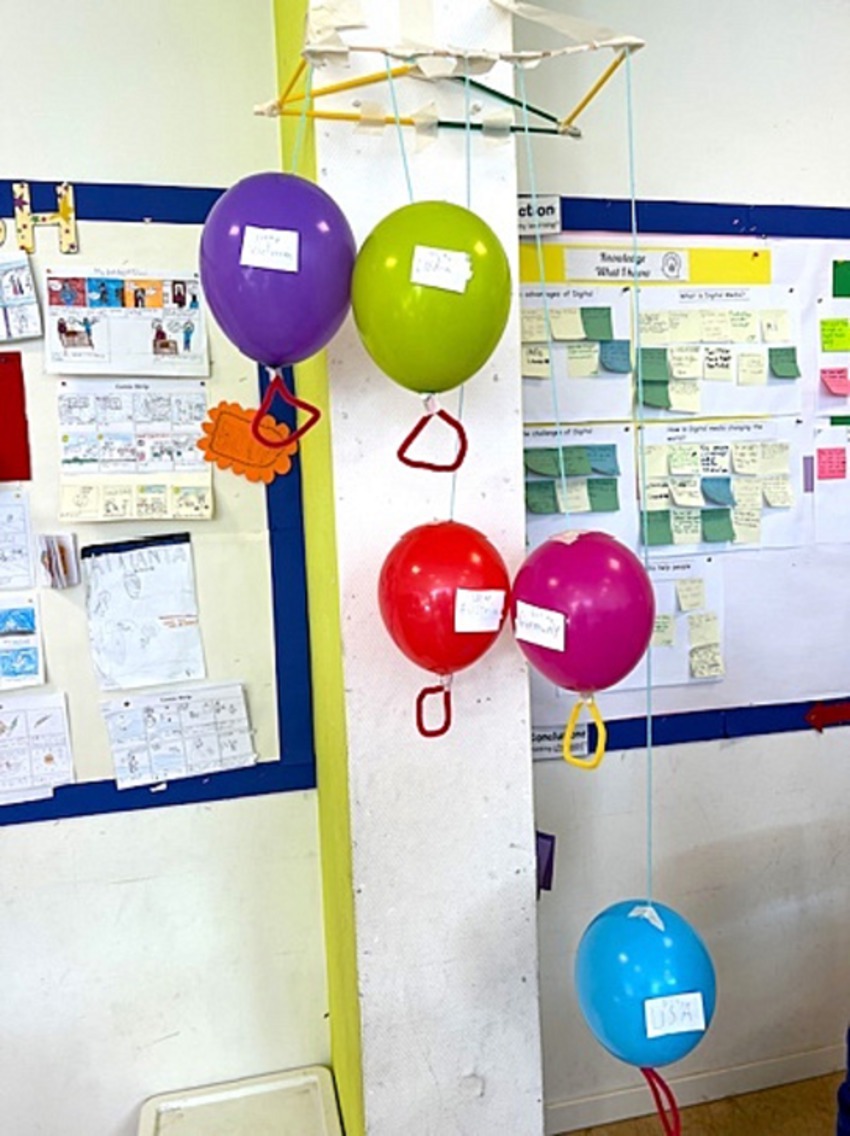
Figure 3. Ordered hot air balloons—Pim.
Pim: Um, so I’m making a bunch of hot air balloons, and since it shows in kg, the lower the air balloon is, the more kg they carry. Each air balloon is a country. So for the lightest we have, uh, Vietnam up here, which is with 110 kilograms, the lightest of our five balloons. Then comes India with 140 kilograms, also really light, slightly heavier though. And then, we are going down a big drop, Austria has 588 kilograms. So, pretty heavy down here. Then we have Germany and USA.
Researcher: Did you put stuff in the air balloon that made them heavy?
Pim: Um, no. So it’s not actually heavier, it’s just gonna be placed lower.
Researcher: Why did you make it this way?
Pim: We made it this way because, um, it was really easy to show the way, like, how the weight was, like, weighing them down. Like a hot air balloon, like, it was being weighed down by its weight. (After-class interview).
While the numerical values in the data tables were not ordered, Pim spatially and ordinally arranged the five “hot air balloons” to represent the waste produced per capita in five different countries of his choice. Viewing from left to right, the spatial positions of the balloons indicated that they were ranked from lightest to heaviest. Pim clarified that he conveyed the idea of weight not by making the balloons heavy, but by varying the lengths of the yarn attached to the balloons, thus achieving different positions of the balloons. He assigned visual and spatial properties to the numerical data and re-ordered the data to highlight the ordinal relationship. This was based on the spatial proximity and distance between the balloons, with the lower-positioned balloons metaphorically representing heavier weights and the higher-positioned ones representing lighter weights, allowing viewers to understand the spatial relations intuitively. This physicalization exemplified an effective use of three-dimensional space to facilitate viewers’ understanding of the data (See Figure 4).
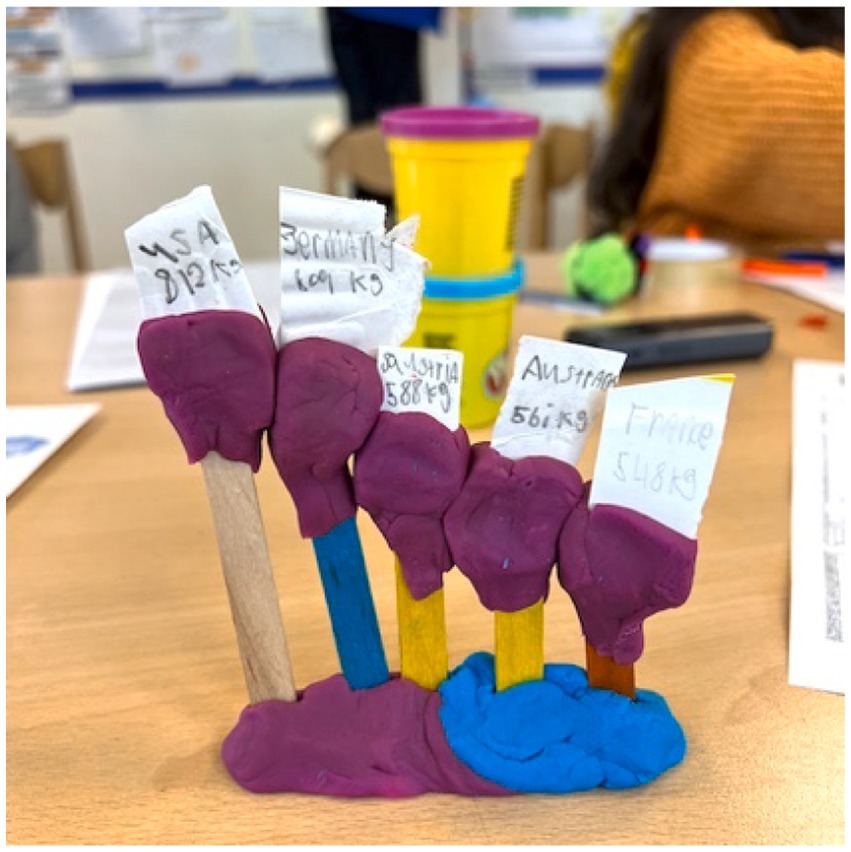
Figure 4. Ordered clay and sticks—Teo.
Teo: So I made this scale, which is representing the five biggest, uh, kilogram countries. USA is the biggest one with 812, Germany, 809 kilograms, and so on down. Um, and each stick, the USA stick is a whole stick, and with each country, which is less kg, it gets smaller each time, as you can see.
Researcher: If you could do it differently, would you change anything?
Teo: Maybe from smallest to biggest, instead of biggest to smallest.
Researcher: Why?
Teo: Because maybe some people see it differently, that it’s more important to produce more or less.
(After-class interview)
This is another example of a spatial representation of number magnitude. Teo also chose to represent the non-ordered data on the weight of waste per capita in five different countries of his choice. He decided that a whole wooden stick represented the biggest number, and the sticks became shorter as the quantities decreased. Teo’s reasoning about number magnitude was aligned with his perception of the sticks’ lengths. Interestingly, when asked about alternative approaches, Teo suggested that changing the ordinal arrangement (in descending or ascending order) could highlight different messages. This illustrated his awareness of conveying messages from data to viewers by emphasizing ordinal relationships and manipulating the different possible spatial arrangements of the materials.
Here are two examples of children formulating rules for allocating units of measurement to specific quantities of materials to set visual parameters (See Figure 5).
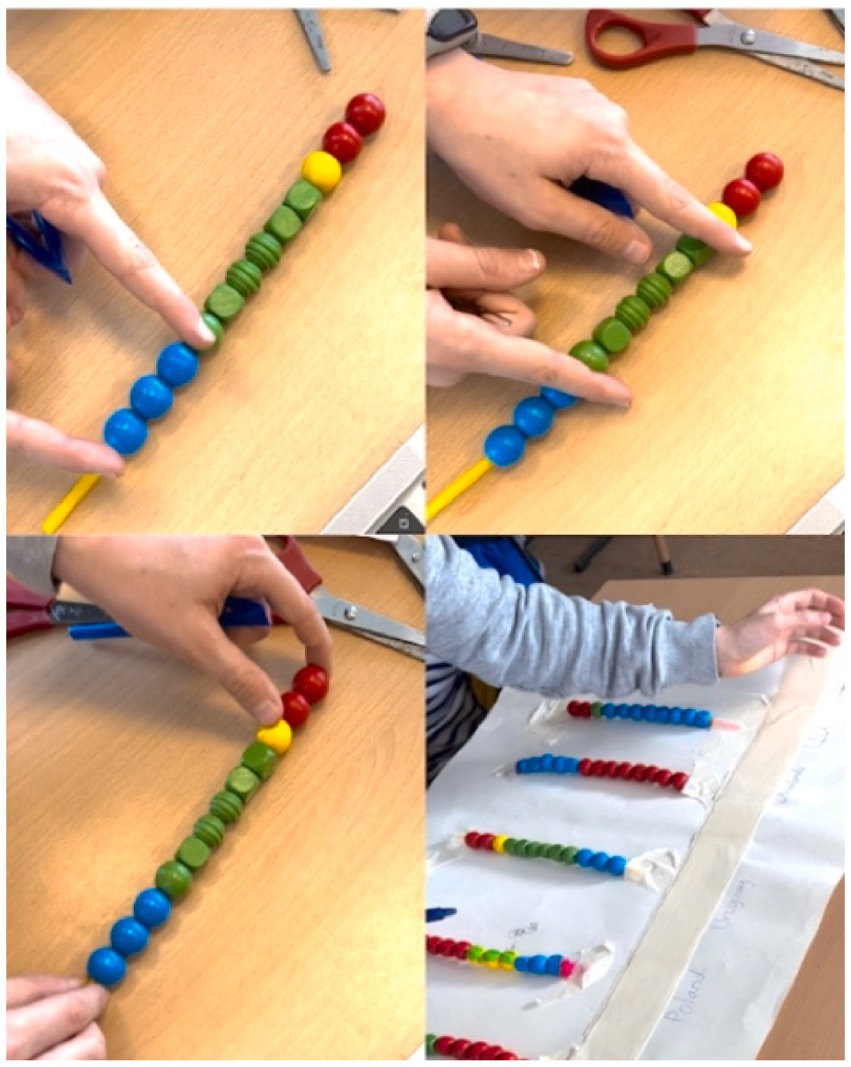
Figure 5. Unitized beads—Kane’s team.
Kane: So, each bead means a different amount of trash that is, that Uraguay has produced. Blue, usually would be 100. So 300. Greens are tens. So they produce three hundred and sixty. Yellows are fives. So, three hundred and sixty-five. And reds are ones. So, it’s three hundred and sixty-seven.
(In-class observation)
Here, Kane was gesturing to explain his team’s decision to use beads of different colors to represent different quantities and assign unit values to colored beads. From his explanation, it became clear that they established meaningful mappings between numerical values in the data and the physical quantities and properties of the beads. To effectively represent large three-digit numbers in 3D with simple and limited materials, Kane and his teammate developed the rule where each blue bead represented 100 kg, each green bead represented 10 kg, each yellow bead represented 5 kg, and each red bead represented 1 kg. This approach demonstrated their proportional reasoning—an important cognitive strategy often used in mathematics and requires spatial reasoning. They then applied this numerical-spatial mapping rule to make stringed beads representing all five countries of their choice (See Figure 6).
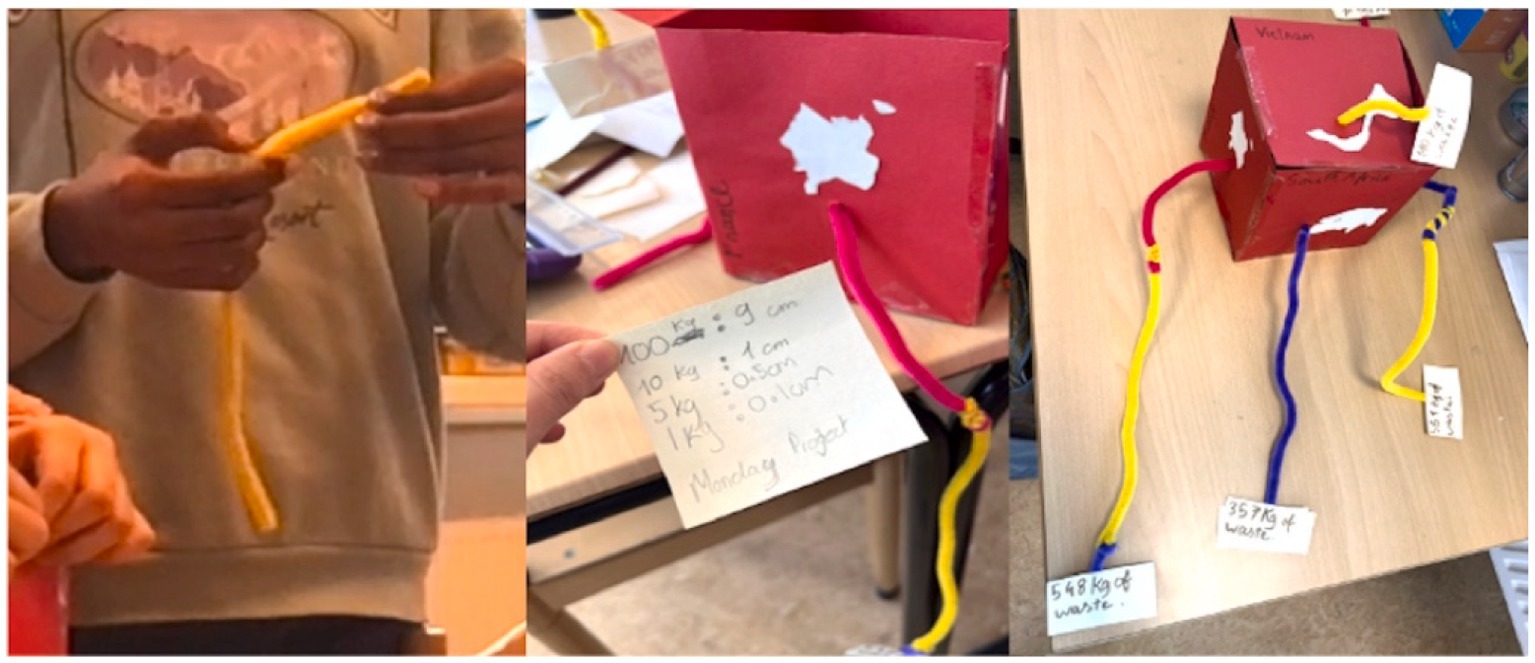
Figure 6. Unitized pipe cleaners around a cube—Mya & Ari.
Ari: Yeah, I think this can be one hundred, this much, this much is one hundred, the way I folded it, and then another one hundred, and then that’s the ten. Okay? Good? And then just fold it.
Mya: Oh yeah, and then you can stick it. Now we need to use.
Researcher: Are you measuring it? How are you coming up with that length?
Mya: Um, we just made a certain, uh, amount for like one hundred, a certain amount for ten, for one, and a certain amount for five.
Ari: So maybe like one hundred could be this much. That’s smart is it? So, how many centimeters?
Mya: It is… 9 cm. One hundred is 9 cm. Ten could be maybe one.
Ari: Okay, yeah, one centimeter because this is exactly, ten is one centimeter.
(In-class observation)
Similarly, Ari and Mya discussed how they could represent the large numbers of waste using pipe cleaners. Having pipe cleaners at hand, they decided to measure a certain length to represent a 100 kg, which turned out to be 9 cm. They quickly deduced that if a 100 kg is represented by 9 cm, 10 kg could be represented by 1 cm. In the figure shown in the middle of the panel, Ari and Mya wrote down the rules that 9 centimeters represented 100 kg, 1 cm represented 10 kg, 0.5 cm represented 5 kg, and 0.1 cm represented 1 kg. It appeared that they were reasoning somewhat proportionally about numerical values from data and the lengths of pipe cleaners. However, they did not realize that, by proportion, 100 kg should correspond to 10 cm instead of 9. Thus, while it was intriguing to see how these children devised rules of unitizing that corresponded intangible numerical values with visual–spatial properties, it was also evident that their proportional reasoning was imprecise.
We now proceed to discuss the four themes that place a stronger emphasis on children’s making process. As the children interacted with materials and their surroundings, they developed new understandings of the visual–spatial properties of the materials at hand. They considered the spatial relations between these materials that could depict relations among data variables and also came up with alternative methods to construct their physicalizations.
First, we present an example of children developing preliminary ideas and concepts about the forms or methods they can follow to physicalize data visually and spatially at the onset of interaction with the materials (See Figure 7).
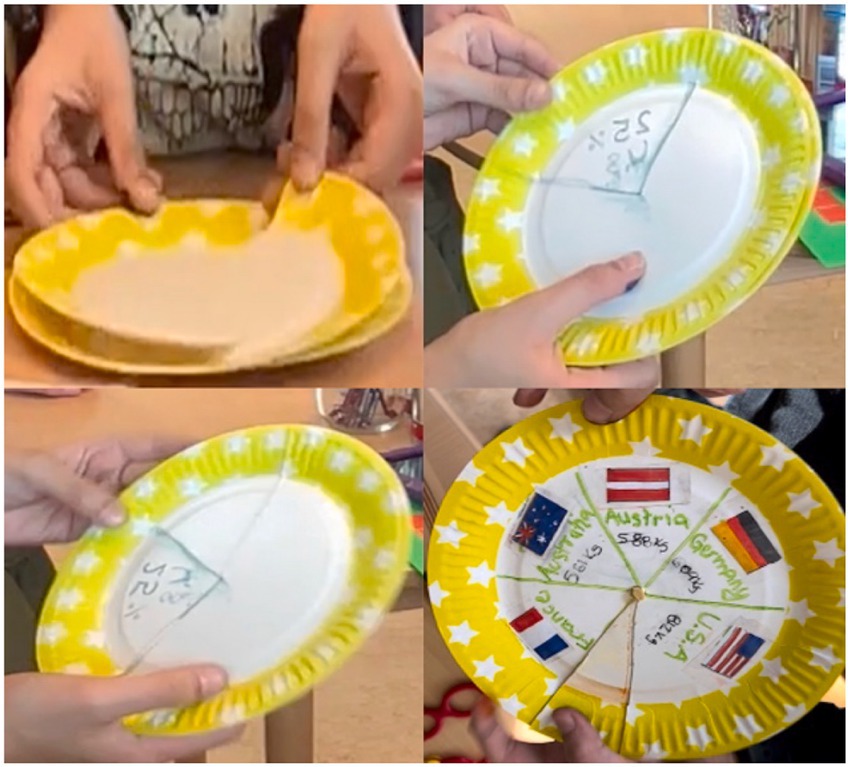
Figure 7. Movable pie chart—Shay & Otto.
Shay: Look what I made. You pull it. (showing the movable plates) So we could like, um, make a pie chart. We can put the information right here.
Otto: Um, how will we fit five countries on that? I’m confused, um, which paper is which. I do not even know which plate is which anymore.
Shay: Look, so it’s going to be like this, one whole pie, okay? Pie chart. And then this is how much… I’m going to have this representing, for example, just give me a pencil, please. Like, this is how much waste India has, okay? If I wanted to know how much India uses, I could measure how, like, how much uses. I could just, like, into a fraction.
Otto: A fraction, yeah, yeah, that would work.
Shay: Yeah. Then we can color it in how much which country to have what.
(In-class observation)
In this team, Shay came up with the idea to make movable plates upon seeing the available materials. He joined two plates at the center with a bendable pin and made cuts on both plates, allowing them to spin. With the plates in hand, he thought of converting the data into a pie chart. According to his idea, rotating the plates would reveal the data on waste per capita in different countries sequentially. Although Otto took some time to grasp his teammate’s idea, they eventually agreed on converting the data in kilograms to a presentation format suitable for a round plate. They did this by calculating the fractions of waste per capita in each country out of the total from the five countries combined, with help from their teacher in calculating these fractions and converting them to percentages.
They then went through the process of visualizing and estimating. For example, to represent that the waste per capita in the United States takes up 25% of the total from the five countries combined, they actively visualized what one fourth of the plate’s area would look like. This process of estimating the area likely involved multiple spatial thinking steps, such as visualizing and comparing areas, and considering the relationship between a portion of the chart and the whole. It is also possible that they considered where the radius of the circle would emerge, visualizing drawing the radius from a certain angle to yield a certain segment of area on the pie chart.
Here are two examples where children evaluated and adjusted aspects such as size differences, unit values, spatial ordering, and ways of arrangement while interacting with the materials. Each example showcases different and meaningful approaches to adjusting the materials (See Figure 8).
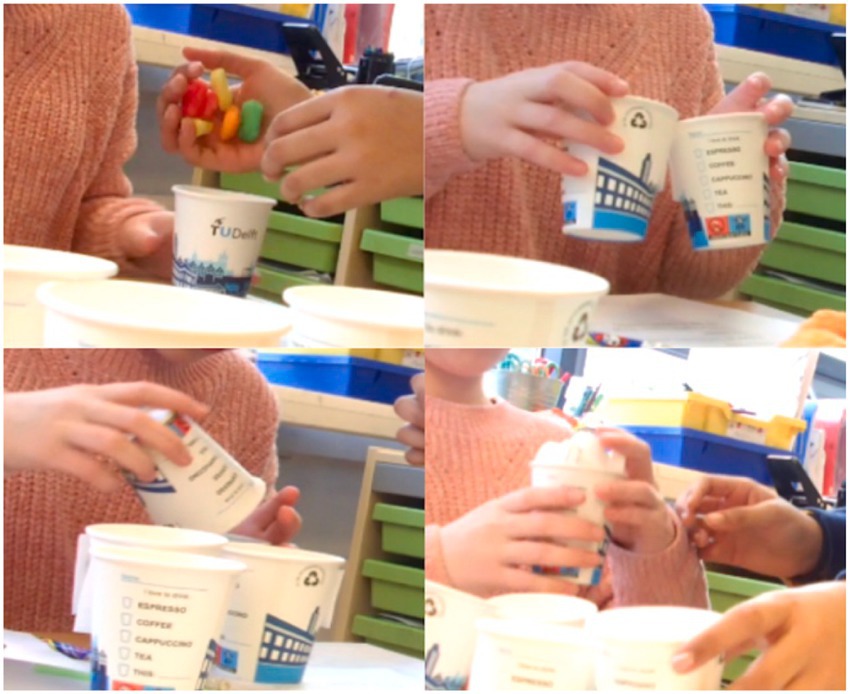
Figure 8. Embodied making and experiment with cups—Lia & Ada.
Lia: I have an idea, so for compost and food we can fill it up until halfway or something (putting the pom poms in the cup to explain the idea) say this is the recycling thing. And fill it up that much. Like, really little, for 5 %. Then, say, for this one (compost), we fill it almost halfway.
Ada: So then, um, how much we fill the plastic?
Lia: We have to fill exactly the same as the paper.
Ada: What if, to make, say, the plastic higher, we can put this on top here, and then we put the lid… And then we can fill that. It’s full of plastic. So wait, but is this 14% about?
Lia: This one has to be filled slightly more…and the plastic it has to be filled exactly the same.
Ada: That looks kind of the same.
Lia: Yeah, that’s fine, that’s fine. Although, this has to be more than this… The tin is 5%…
Ada: So, this is 10% compared to 5%. That’s about half.
Lia: Yeah, I think. Look, I had this fun experiment. Let us dump them all into one and see if that makes exactly a full cup. A full hundred percent. I do not think it will because I think it’s a bit too much. That makes about a full 100%.
Ada: It’s a bit over, right?
Lia: Okay, I’m taking out one of each just to make it slightly smaller.
(In-class observation)
As Lia and Ada interacted with the materials, they were actively constructing spatial understandings of the numbers in the data and the data physicalization task itself. Projecting their understandings of the numbers onto the materials, they visually compared and evaluated whether their spatial-numerical mappings were reasonable and whether the spatial representations of number magnitude were accurate. They used the visual feedback from their embodied interactions with the materials to modify the physicalization, likely gaining new insights into how numerical values can correspond to certain heights and volumes.
There are many spatial moments in the episode shown above, such as gauging the space needed to represent 5% and visualizing how much materials they should fill the cup with. They used phrases such as “a bit over” and “slightly smaller” to indicate the process of comparing number magnitudes. Descriptions like “we fill it almost halfway” and “this is 10% compared to 5%. That’s about half” showcased their proportional reasoning of ratios. Overall, it appeared that as they visualized and estimated the sizes of materials they used, they were actively relating number magnitude with their spatial representations—heights and volumes.
Interestingly, Lia came up with an experiment to test the accuracy of their estimations. The idea of checking whether all the materials would add up to 100 percent showed that they were testing their understanding of percentages with real materials. It appeared that the embodied interactions with the materials sparked the idea of experimenting with cups. Precisely because of the use of tangible materials, these children could receive direct visual feedback on whether the cup would be full or overfull when they combined everything into one cup. It should be noted that Lia and Ada were focused more on the height of the filled materials rather than the volumes (as the cup they used had a larger surface area on the top than at the bottom). This is expected as they had not yet learned about calculating the volumes of cylindrical shapes like cups (See Figure 9).
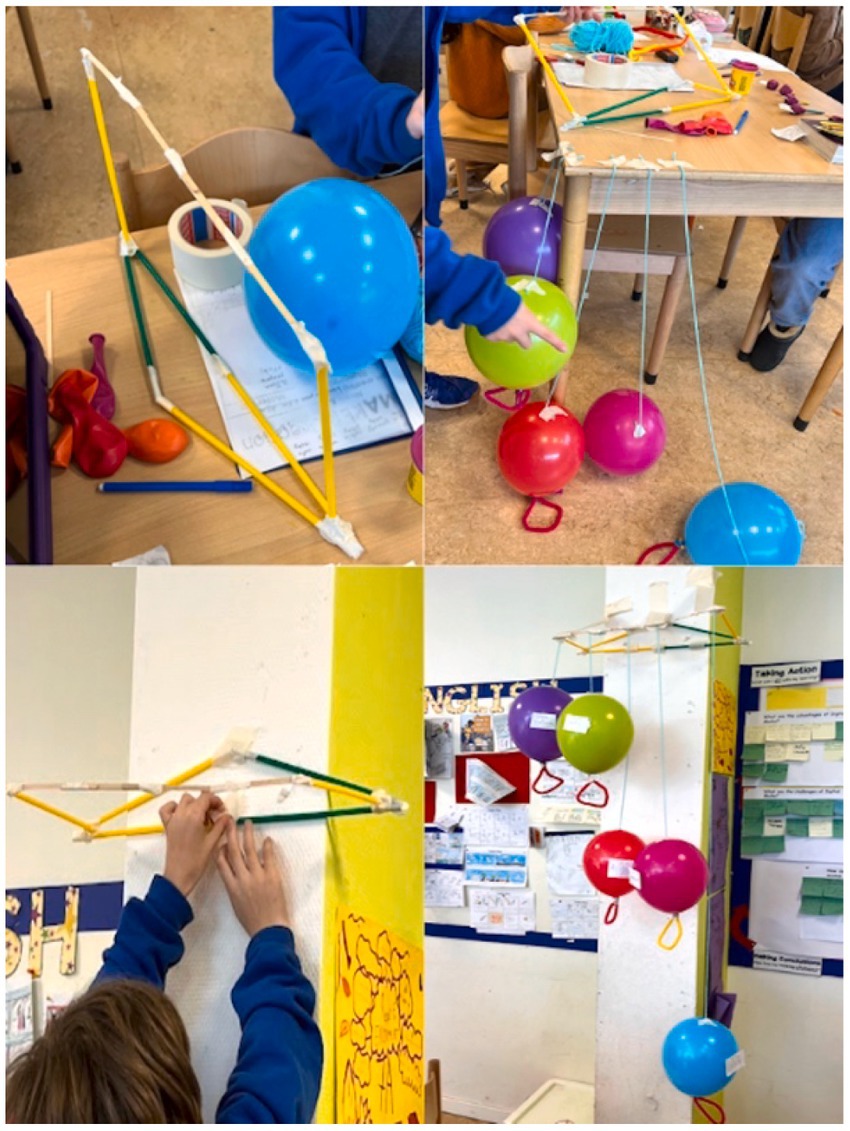
Figure 9. Modifying the balloon stand—Pim.
Pim: And after when I was done with all the balloons, I just thought to myself. Oh, well, I guess I could also make like a stand that’s like standing upwards on the table. And then I noticed that it would not just fit all of them and it would not be high enough. So I noticed I could just flip my stand over and it would fit perfectly on the wall.
(After-class interview)
Pim’s response revealed that embodied interactions with the materials inspired him to consider an alternative approach for presenting his physicalization. Originally, Pim thought of attaching balloons to a stand on the table, as shown on the top left of the panel. However, he noticed that there was not enough height between the table and the floor. This meant that balloons with longer yarn would simply lie on the floor, failing to convey the differences in their spatial positions. As a solution, Pim decided to flip the stand and affix it high up on the classroom wall, effectively using the classroom space to illustrate the large weight differences in waste per capita among countries. Unlike the previous example, where the adjustment was made on the visual mapping process from data to tangible materials, this modification pertained to presentation mapping (Jansen and Dragicevic, 2013) to facilitate viewers’ perception of the physicalized data.
The making of data physicalization artifacts required children to not only give numbers visual–spatial forms but also to use crafting skills to bring their ideas in mind to life. Occasionally, children realized that they needed to modify or give up on some ideas due to their limited crafting skills (See Figure 10).
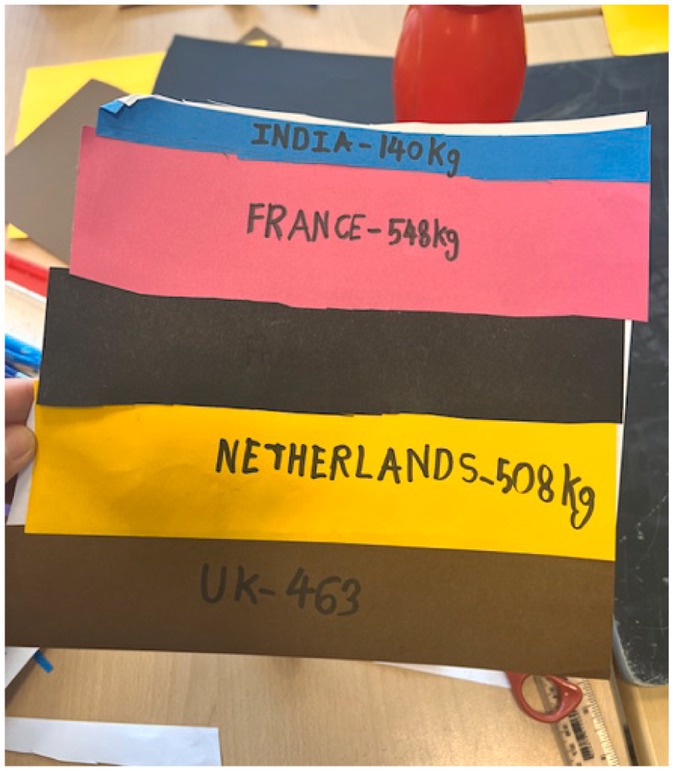
Figure 10. From 3D pyramid to 2D collage—Ravi.
Researcher: What was the biggest challenge for you?
Ravi: Um, so I first thought to make a pyramid, a diorama thing. Something like a, like a 3D thing, yeah. But then I thought that, like, it would take a lot of time, and I’m really not that good at making crafts. And I would love to get all the supplies and I really do not know how to do it. And after that, representing. Put them in a, uh, pyramid, it’s like, tough. And then I think of like a simple way, like other than the pyramid, I thought of a simpler, like, a figure. So I just thought to make a chart out of like, I cut it out some papers and then I stick them on the white piece of paper and I wrote the country’s name, which is easy to understand for people and this would take a bit less time. So for an example, I think, uh, Netherlands were the biggest. So like I cut out a big chunk of paper for Netherlands and a small chunk for India because the number was smaller, was like a hundred something.
(After-class interview)
Due to a lack of certain crafting skills, Ravi gave up on the idea of making a 3D pyramid shape physicalization and opted for a simple 2D collage representation. In his current physicalization, Ravi varied the side lengths of different strips in the collage, showing that Ravi was giving numerical values visual–spatial forms and exploring the different properties of two- and three-dimensional space in his mind. Had he pursued the pyramid idea, it would have demanded more spatial thinking. For instance, he would need to decide which of the many side lengths to vary, which taps into his knowledge of this 3D geometric shape. Moreover, making a pyramid from scratch would be challenging, as he might need to sketch a net plan for the pyramid on paper and then assemble it in 3D. While these were merely our conjectures, it is reasonable to hypothesize that crafting a 3D pyramid would have been more spatially challenging for him had he possessed the crafting skills and sufficient time.
Some of these children were able to craft spatially complex representations. For example, Mya and Ari (Figure 6) built a cube from a net plan and managed to secure the pipe cleaners of varying lengths onto each face of the cube. This process demanded spatial visualization, mental rotation, and possibly prior knowledge about crafting a paper cube from scratch and making knots on papers. For another example, Shay (Figure 7) used simple materials to create a movable design that allowed for spatial transformation. Nevertheless, data physicalization tasks can still be challenging for some children given the limited crafting skills, tight class schedule, and restrictions in available materials.
Here is an example of children envisioning what their physicalizations would look like when viewed by others from different angles or perspective. This conversation is part of an earlier discussion between Lia and Ada (Figure 11).
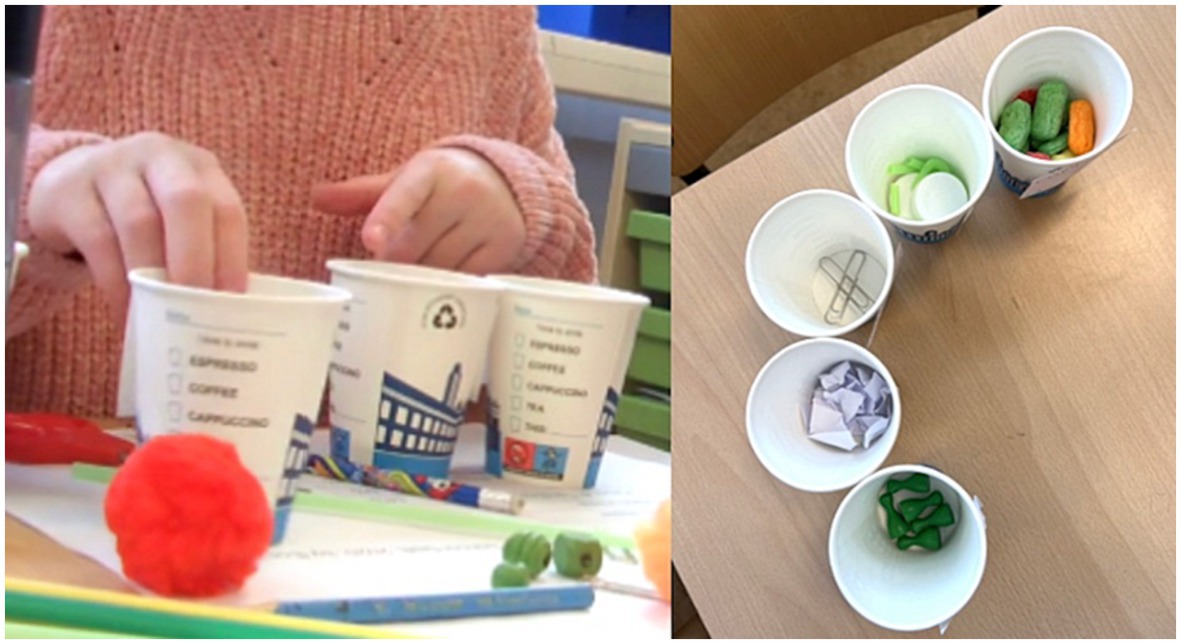
Figure 11. Cups from different perspectives—Lia & Ada.
Lia: Say we do not have enough of glass. We can stuff some paper underneath and then put this on top to make it looks like more full. Because in a box you can only see what’s on top.
Ada: Oh and we can put a mark on the front to say how much of it is inside, but you could also look inside to see like how full it is.
(In-class observation)
Lia and Ada had a limited number of plastic lids available, which were insufficient to represent the quantity of plastic waste. Interestingly, Lia suggested placing other materials underneath and simply covering the top with the two plastic lids they had. She reasoned that viewers could only see what was on the surface when looking from the top. Ada quickly built on this idea, suggesting that they could label the percentages on the cup’s outer wall to facilitate viewers’ understanding from the side. Their discussion revealed that they were envisioning viewers actively perceiving their physicalization from different angles. They developed this solution not just to tackle the problem of limited materials but also to ensure that viewers receive accurate data information, whether viewing from above or from the side.
22 of the 37 children completed the self-report survey individually. The remaining children did not complete the survey, possibly because they missed the instruction, had not finished their artifacts, or misunderstood the instruction so that only one child from a team filled out the survey. Children gave Likert-scale ratings from 1 to 5—1 indicating “I’m not doing it yet/Does not sound like me yet”, 3 indicating “I did it sometimes/Sounds somewhat like me”, and 5 indicating “I did it often/Sounds very much like me.” Among the respondents, 95.5% of the children gave a rating of 3 or above for the statement “Before making, I thought about how the visualization would look”; 81% of the children gave a rating of 3 or above for the statement “During making, I checked to see if the visualization represents the data well”; 95.5% of the children gave a rating of 3 or above for the statement “I can explain the meaning of the data to others using the visualization”; 100% of the children gave a rating of 3 or above for the statement “I can understand the data better now”; and 72.7% of the children gave a rating of 3 or above for the statement “I have more ideas for what I want to design for the design challenge.”
In summary, all children who filled out the survey reported an enhanced understanding of the data about waste. A majority were capable of visualizing what their representation would look like before making and articulating the meaning of their data through their data physicalizations. A number of children reported that they occasionally or frequently checked to see if the representation matched the data well during the making process. Additionally, some of these children reported that the data physicalization activity inspired their design ideas for the Circular Economy design theme.
In this study, children utilized their spatial thinking alongside their numerical and crafting skills to devise a variety of methods for mapping numbers to visual–spatial forms. Specifically, they made creative and effective use of two- and three-dimensionality, resulting in data physicalization artifacts that incorporated a range of materials, sizes, and configurations, depicted ordinal or proportional relationships, and engaged viewers to perceive these artifacts from different angles. At its core, children’s construction of data physicalizations revealed insights into their process of encoding different dimensions of information from the data and transforming non-spatial data into tangible objects with visual–spatial properties and relations.
To address the first research question, our analysis of children’s data physicalization artifacts, conversation, and making processes triangulated evidence that the children used spatial thinking as they mapped numerical data onto tangible materials. Among the different approaches to physicalization, we identified three ways of visual mapping that potentially recruited spatial thinking and were repeatedly observed among the children in our study.
Quantities-to-size mapping, the technique of representing value differences in numerical data by varying the sizes of tangible materials, is commonly seen in data physicalizations made by adults (e.g., Vande Moere and Patel, 2010; Jansen and Hornbæk, 2015; Hurtienne and Reinhardt, 2017; Perin, 2021). This technique was also reflected in all children’s artifacts mentioned above (Figures 2–11). The cognitive strategy of mapping intangible numbers to tangible entities is important in mathematics and requires children’s understanding of quantities and proportional reasoning (Lamon, 1996). This practice recruits spatial thinking, evident in our results where children corresponded numerical values with indicators of size, such as a certain length, width, area, or volume of tangible materials, either through visual estimation or precise measurement. Moreover, to illustrate a comparison of number magnitude in data, children leveraged their knowledge of ratios and proportions, for instance, by spatially scaling the material’s size to represent data values that doubled or tripled (Figures 2, 8).
Proportional unitizing is a reasoning strategy critical to math learning and frequently employed in data visualization and physicalization by novices and experts to map numerical data to visual elements (Huron et al., 2014a). In a study by Huron et al. (2014b), adult participants with little experience in information visualization were given unit tokens to conveniently construct their physical visualizations. From our results, we noticed that children spontaneously thought of using unit rates (Figures 5, 6). Multiple teams developed and adhered to proportional unitizing rules, demonstrating thoughtful consideration of the materials’ visual–spatial properties and adeptness at representing large three-digit numbers with materials of limited sizes and shapes. For other children, this process may have been intuitive rather than rule-based, indicating an implicit understanding of proportional unitizing.
An additional way of representation that required spatial thinking and was evident in children’s artifacts was using spatial ordinal arrangement to highlight meaningful ordinal relationships within the data. This technique is frequently seen in data visualization and physicalization practices of adults (e.g., Ware, 2004; Vande Moere and Patel, 2010). Similarly, in our results, several teams or individual children ranked the materials they used to represent data values in either ascending or descending order (Figures 3, 4). These arrangements are meaningful to the discussion of spatial thinking because the data tables they received were not sorted in specific orders. As children positioned materials in a certain order in the 3D space, they were likely contemplating the relationships between data variables and reasoning how these relationships could be conveyed through spatial proximity and distance.
Our second research question was: How does the embodied process of making data physicalization stimulate children’s spatial thinking? We observed that thinking along and interacting with tangible materials meaningfully stimulated children’s spatial thinking and offered them opportunities to transform numbers into tangible representations with visual–spatial properties.
The theme, generating ideas and concepts to give visual–spatial forms to data, illustrates how children developed ideas for diverse ways of physicalization through interacting with the materials (e.g., Figures 3, 6–9). For example, manipulating pipe cleaners prompted children to correspond certain lengths with certain weights (Figure 6). Similarly, having movable plates at hand gave children the idea of converting data in kilograms into percentages and mapping them onto respective areas on a pie chart-like plate (Figure 7). Our observations revealed that all teams or individual working children were able to give visual–spatial forms to data either in 2D or 3D through active interactions with the materials. This resonates with prior studies suggesting that creating visual–spatial representations facilitates problem exploration as well as perception organization (Tytler et al., 2013a). It may also be explained by earlier findings which indicated that tangible materials and manipulatives function as a “mental tool view” (Chao et al., 2000) and that interactions with physical materials elicit mental imageries that can “guide and constrain their thinking for problem solving” (p. 285).
The theme, evaluating and adjusting the methods and materials used to physicalize data, is exemplified by children experimenting with both visual mapping and presentation mapping. Children’s frequent hand movements around the materials helped them test the accuracy of their spatial understanding of number magnitude (Figure 8) and uncover the optimal spatial layout of their physicalization (Figure 9). It appeared that making tangible representations of data allowed them to visually compare and evaluate the appropriateness of their representations, and any adjustments made may have updated their mental representations (Huron et al., 2014b). These complex embodied thinking processes echo Schön’s (1983) notions of “knowing in action” and “reflecting in action.” They also align with Kelly et al.’s (1987) depiction of the ongoing interaction between mind and action in the design processes of 15-year-olds, where “making activities interact with cognitive activities as the manifestations of our ideas allow us to think more deeply about their implications” (p. 13). In addition, our results under this theme appear to be in line with the findings that spatial motor movements serve as a manifestation of the underlying spatial perception and cognitive reasoning (Maresch and Sorby, 2021) and elicit visual feedback to support mental simulation (Frick et al., 2009).
The theme, considering viewers’ spatial perspectives, aligns with the suggestion that designers need to envision viewers taking an active rather than passive stance when interacting with physicalized data (Jansen et al., 2015). As depicted in Figure 11, children were contemplating how their physicalization could convey a coherent message about quantity to viewers from either a top or side view. This reasoning process is somewhat analogous to solving spatial visualization problems, where students are often tasked to imagine how a set of blocks looks when viewed from the top or the side, or determine which blocks will be visible or hidden (e.g., the Middle Grades Mathematics Project Spatial Visualization Test by Ben-Chaim et al., 1988). However, unlike solving a paper-pencil task on visualizing the different view plans of blocks, the children in our study were using their spatial visualization skills to solve an authentic problem that arose from the many possible arrangements of tangible materials. It allowed for (1) open-ended ways to formulate solutions, and (2) hands-on experimentation with direct visual feedback from the materials. For example, they could check to see if placing plastic lids above other materials would give the visual effect of a fuller cup.
To summarize the themes discussed above, the converging evidence from children’s data physicalization artifacts, conversation, and making processes indicated that children were constructing spatial understandings through the embodied making process of data physicalization, and that their spatial thinking was grounded in their embodied interactions with the materials and the classroom space. Spatial thinking skills are predominantly trained with the goal of having students perform manipulations of mental imagery in mind. However, our findings, consistent with prior research (e.g., Casey et al., 2008; Frick et al., 2009; Link et al., 2013; Burte et al., 2017; Maresch and Sorby, 2021), highlight the important role of embodied experiences in spatial thinking. Our society tends to categorize human activities strictly into physical or intellectual work (Pallasmaa, 2017). Yet we should not always view bodily motions and cognitive capacities as entirely separate agencies. Many examples from our results indicated that had these children been limited to creating infographics in their minds or on paper, they might not have actively envisioned numbers with visual–spatial properties.
Despite the observed benefits of embodied making experiences on children’s construction of data physicalization and their use of spatial thinking throughout the activities, we are mindful of the ongoing debate regarding the role of embodied experience in supporting children’s spatial thinking development. On one hand, there is the perspective that bodily experiences and mental activities complement each other (Wilson, 2002; Pallasmaa, 2017) and that embodied experiences are crucial for spatial thinking development (Frick et al., 2009; Link et al., 2013). On the other hand, there is concern that the use of hands-on manipulatives may diffuse the emphasis on honing children’s abilities to visualize, plan, and solve problems in their minds without external aids (Newcombe, 2017). More research is needed to fully understand how embodiment influences children’s spatial thinking and to determine under which conditions it nurtures or impedes the development of certain spatial skills.
Lastly, we observed a display of spatial creativity, defined as “the ability to create new and rich 2D and 3D ideas for volumetric forms that consist of spatial configuration, organization, and the spatial relationships of the components” (Suh and Cho, 2020, p. 3). For example, the children in Figure 6 attached traced shapes of countries to the faces of a cube, in addition to presenting unitized data information on waste per capita in these countries. In Figure 7, the children created movable plates that allow spatial transformation and interaction with viewers. Unlike visualizing data in a 2D or virtual 3D environment, a physical environment promotes tactile exploration and interactions, allowing the maker to embed the meaning of data in creative ways and the audience to experience data in unexpected ways (Vande Moere and Patel, 2010). We should note that not all of the representations were novel forms, as some resembled conventional bar or line graphs (e.g., Figure 4). Nevertheless, the diversity of artifacts produced by these children still indicated their application of everyday creativity to develop what seemed original and valuable to them (Craft, 2001; Cremin et al., 2018).
Overall, children of this age seem to be able to meaningfully engage in data physicalization activities. Children exercised their spatial and numerical understandings during this brief, versatile classroom activity, which has the potential to be implemented in design and technology education, inquiry-based learning, as well as STEM education. Based on these findings, we will move forward to discuss the practical implications of this study for educators and researchers.
The data physicalization activity discussed in this case study was integrated into a design module and took place in a formal learning environment. This activity effectively directed children towards thinking about waste-related issues, devising methods to communicate data information to others, and subsequently generating ideas on designing through reusing and repurposing waste. Our approach highlights the potential of using data physicalization as a problem-exploration or story-telling tool in design education.
In line with previous findings that data physicalization can be a valuable tool for learning in the classroom (Willett and Huron, 2016), our findings have broad implications for STEM education. Firstly, this qualitative examination paves the way for the development of embodied, educational interventions targeting children’s spatial-numerical understandings. Secondly, given the low-tech and versatile nature of data physicalization activities, coupled with the importance of data literacy across disciplines, there is potential to weave data physicalization activities into STEM, arts, or social science classrooms to facilitate subject knowledge comprehension and enrich the learning experiences with embodied elements. Furthermore, resonating with observations from Bae et al. (2022), we noticed that data physicalization provided children with ample opportunities for hands-on experimentations, such as seeing the change in height and volume as they fill in materials and conveniently remove materials to achieve the desired quantity (Figure 8). Hence, data physicalization may be a promising tool for inquiry-based learning in STEM.
There is room for improvement regarding how the data physicalization activity was organized. Firstly, additional scaffolding is needed to help children better understand data and the physicalization task. Generating visual–spatial representations based on verbal information requires thoughtful selection and integration of information (Van Meter et al., 2006). The use of tangible materials poses further challenges to children’s ability to integrate information, taking into account the visual, spatial, and physical properties of the materials used. Therefore, it could be beneficial to guide children in identifying key data information and exploring the properties of materials, as well as prompting them to think about effective ways of representation. Secondly, due to scheduling challenges, only children in the afternoon class had the opportunity to present their physicalizations to the class. Through practice, we noticed the importance of presenting and receiving feedback, as these enabled children not only to create but also to critically evaluate their own work and that of their peers. For example, feedback nudged children to think about how comprehensible their physicalization is to others. By doing so, educators can better tailor these activities to nurture children’s data literacy, visual literacy, and representational competency. Therefore, in future data physicalization practices, it would be beneficial to provide opportunities for self- and group-reflection, as well as peer feedback. Finally, the children involved in our study come from middle to upper socioeconomic backgrounds, with some having parents in STEM professions. This background might have given them greater exposure to STEM-related knowledge and skills, potentially aiding their data physicalization construction. Future research should consider organizing data physicalization activities with children from varied backgrounds and different levels of data and visual literacy.
It is important to note that children’s ability to create elaborate and spatially complex physicalization artifacts is constrained by their crafting skills. This limitation is exemplified in the theme, identifying a (mis)match between ideas and crafting skills. Oftentimes, the three-dimensional, spatial ideas that were vivid in their minds were compromised due to insufficient crafting skills. Future research is needed to investigate if training in crafting and making skills can benefit children’s spatial making processes.
Lastly, future research should investigate how children with varying spatial ability levels may benefit differently from data physicalization activities. In the current study, our analysis did not explore the dynamics between children working in pairs. Yet, it is conceivable that a child with higher spatial ability might adopt more spatial methods for data physicalization or be more adept at visually estimating, measuring, or crafting. Prior research indicated that external representation and physical manipulation often reduce the cognitive load required for mental computations (Kirsh, 2009). However, some suggested that specific external representations (e.g., on-screen 3D models) may only benefit students with higher spatial abilities while inducing more cognitive load on students with lower spatial abilities (Huk, 2006). Future studies should explore how the use and fabrication of tangible visualizations may influence children with varying spatial ability levels in distinct ways. While our study provided qualitative insights into how tangible visualization activities engage spatial thinking, it is necessary for future quantitative or mixed-methods studies to investigate how these activities can be structured to enhance children’s spatial ability.
The original contributions presented in the study are included in the article/Supplementary material, further inquiries can be directed to the corresponding author.
The studies involving humans were approved by Human Research Ethics Committee TU Delft. The studies were conducted in accordance with the local legislation and institutional requirements. Written informed consent for participation in this study was provided by the participants’ legal guardians/next of kin. Written informed consent was obtained from the individual(s), and minor(s)’ legal guardian/next of kin, for the publication of any potentially identifiable images or data included in this article.
CZ: Conceptualization, Data curation, Formal analysis, Investigation, Methodology, Project administration, Resources, Software, Validation, Visualization, Writing – original draft, Writing – review & editing. RK: Conceptualization, Formal analysis, Funding acquisition, Methodology, Project administration, Resources, Supervision, Validation, Writing – review & editing. MS-O: Conceptualization, Investigation, Project administration, Resources, Writing – review & editing. JS: Conceptualization, Formal analysis, Methodology, Supervision, Validation, Writing – review & editing. MV: Conceptualization, Methodology, Supervision, Validation, Writing – review & editing.
The author(s) declare financial support was received for the research, authorship, and/or publication of this article. This research is part of SellSTEM-Spatially Enhanced Learning Linked to STEM-Marie Skłodowska-Curie Innovative Training Network to investigate the role of spatial ability in and for STEM learning. It has received funding from the European Union’s Horizon 2020 research and innovation programme under the Marie Skłodowska-Curie grant agreement No. 956124.
We would like to thank all the children who participated in this study for their valuable contributions. We thank Jeroen Spandaw and Estefania Gamarra Burga for their contributions to data analysis. We also thank Marije Kanis and Monique Pijls for inspirations in activity design and Gilles Deiters for assistance in data collection. Informed participation consent was obtained from the parents.
The authors declare that the research was conducted in the absence of any commercial or financial relationships that could be construed as a potential conflict of interest.
All claims expressed in this article are solely those of the authors and do not necessarily represent those of their affiliated organizations, or those of the publisher, the editors and the reviewers. Any product that may be evaluated in this article, or claim that may be made by its manufacturer, is not guaranteed or endorsed by the publisher.
The Supplementary material for this article can be found online at: https://www.frontiersin.org/articles/10.3389/feduc.2023.1308117/full#supplementary-material
Ainsworth, S. (2006). DeFT: a conceptual framework for considering learning with multiple representations. Learn. Instr. 16, 183–198. doi: 10.1016/j.learninstruc.2006.03.001
Bae, S. S., Vanukuru, R., Yang, R., Gyory, P., Zhou, R., Do, E. Y. L., et al. (2022). Cultivating visualization literacy for children through curiosity and play. IEEE Trans. Vis. Comput. Graph. 29, 257–267. doi: 10.1109/TVCG.2022.3209442
Baker, J., Jones, D., and Burkman, J. (2009). Using visual representations of data to enhance sensemaking in data exploration tasks. J. Assoc. Inf. Syst. 10, 533–559. doi: 10.17705/1jais.00204
Barsalou, L. W. (2008). Grounded cognition. Annu. Rev. Psychol. 59, 617–645. doi: 10.1146/annurev.psych.59.103006.093639
Baykal, G. E., Alaca, I. V., Yantaç, A. E., and Göksun, T. (2018). A review on complementary natures of tangible user interfaces (TUIs) and early spatial learning. Int. J. Child-Comput. Interact. 16, 104–113. doi: 10.1016/j.ijcci.2018.01.003
Ben-Chaim, D., Lappan, G., and Houang, R. T. (1988). The effect of instruction on spatial visualization skills of middle school boys and girls. Am. Educ. Res. J. 25, 51–71. doi: 10.2307/1163159
Ben-Zvi, D., and Garfield, J. (2004). “Statistical literacy, reasoning, and thinking: goals, definitions, and challenges” in The challenge of developing statistical literacy, reasoning and thinking, vol. 66. eds. D. Ben-Zvi and J. Garfield (Dordrecht: Springer), 3–15.
Bergey, B. W., Cromley, J. G., and Newcombe, N. S. (2015). Teaching high school biology students to coordinate text and diagrams: relations with transfer, effort, and spatial skill. Int. J. Sci. Educ. 37, 2476–2502. doi: 10.1080/09500693.2015.1082672
Bhargava, R., and D'Ignazio, C. (2017). Data sculptures as a playful and low-tech introduction to working with data. In Proceedings of the 2017 Designing Interactive Systems. Association for Computing Machinery.
Buckley, J., Seery, N., and Canty, D. (2018). A heuristic framework of spatial ability: a review and synthesis of spatial factor literature to support its translation into STEM education. Educ. Psychol. Rev. 30, 947–972. doi: 10.1007/s10648-018-9432-z
Burte, H., Gardony, A. L., Hutton, A., and Taylor, H. A. (2017). Think3d!: improving mathematics learning through embodied spatial training. Cogn. Res. Prin. Implic. 2, 13–18. doi: 10.1186/s41235-017-0052-9
Card, S. K., and Mackinlay, J. (1997). The structure of the information visualization design space. In Proceedings of VIZ'97: Visualization Conference, Information Visualization Symposium and Parallel Rendering Symposium (pp. 92–99). IEEE.
Casey, B. M., Andrews, N., Schindler, H., Kersh, J. E., Samper, A., and Copley, J. (2008). The development of spatial skills through interventions involving block building activities. Cogn. Instr. 26, 269–309. doi: 10.1080/07370000802177177
Chao, S. J., Stigler, J. W., and Woodward, J. A. (2000). The effects of physical materials on kindergartners & learning of number concepts. Cognition and Instruction, 18, 285–316. doi: 10.1207/S1532690XCI1803_1
Cooper, M. M., Stieff, M., and DeSutter, D. (2017). Sketching the invisible to predict the visible: from drawing to modeling in chemistry. Top. Cogn. Sci. 9, 902–920. doi: 10.1111/tops.12285
Craft, A. (2001). “Little c creativity” in Creativity in education. eds. A. Craft, B. Jeffrey, and M. Leibling (London: Continuum), 45–61.
Cremin, T., Glauert, E., Craft, A., Compton, A., and Stylianidou, F. (2018). “Creative little scientists: exploring pedagogical synergies between inquiry-based and creative approaches in early years science” in Creativity and creative pedagogies in the early and primary years. ed. T. Cremin (London: Routledge), 45–60.
Cromley, J. G., Bergey, B. W., Fitzhugh, S., Newcombe, N., Wills, T. W., Shipley, T. F., et al. (2013). Effects of three diagram instruction methods on transfer of diagram comprehension skills: the critical role of inference while learning. Learn. Instr. 26, 45–58. doi: 10.1016/j.learninstruc.2013.01.003
Dasgupta, S., and Hill, B. M. (2017). Scratch community blocks: supporting children as data scientists. In Proceedings of the 2017 CHI Conference on Human Factors in Computing Systems (pp. 3620–3631).
Diezmann, C. M., and Watters, J. J. (2000). Identifying and supporting spatial intelligence in young children. Contemp. Issues Early Child. 1, 299–313. doi: 10.2304/ciec.2000.1.3.6
Fish, J., and Scrivener, S. (1990). Amplifying the mind's eye: sketching and visual cognition. Leonardo 23, 117–126. doi: 10.2307/1578475
Fleiss, J. L., and Cohen, J. (1973). The equivalence of weighted kappa and the intraclass correlation coefficient as measures of reliability. Educ. Psychol. Meas. 33, 613–619. doi: 10.1177/001316447303300309
Frick, A., Daum, M. M., Wilson, M., and Wilkening, F. (2009). Effects of action on children’s and adults’ mental imagery. J. Exp. Child Psychol. 104, 34–51. doi: 10.1016/j.jecp.2009.01.003
Frick, A., and Newcombe, N. S. (2015). Young children's perception of diagrammatic representations. Spat. Cogn. Comput. 15, 227–245. doi: 10.1080/13875868.2015.1046988
Groth, C., and Mäkelä, M. (2016). The knowing body in material exploration. Stud. Material Think. 14, 1–11.
Hannafin, R. D., Truxaw, M. P., Vermillion, J. R., and Liu, Y. J. (2008). Effects of spatial ability and instructional program on geometry achievement. J. Educ. Res. 101, 148–157. doi: 10.3200/JOER.101.3.148-157
Hawes, Z. C., Gilligan-Lee, K. A., and Mix, K. S. (2022). Effects of spatial training on mathematics performance: a meta-analysis. Dev. Psychol. 58, 112–137. doi: 10.1037/dev0001281
Hegarty, M. (2010). “Components of spatial intelligence” in Psychology of learning and motivation, vol. 52 (New York: Academic Press), 265–297.
Höffler, T. N. (2010). Spatial ability: its influence on learning with visualizations—a meta-analytic review. Educ. Psychol. Rev. 22, 245–269. doi: 10.1007/s10648-010-9126-7
Huk, T. (2006). Who benefits from learning with 3D models? The case of spatial ability. J. Comput. Assist. Learn. 22, 392–404. doi: 10.1111/j.1365-2729.2006.00180.x
Hull, C., and Willett, W. (2017). Building with data: architectural models as inspiration for data physicalization. In Proceedings of the 2017 CHI Conference on Human Factors in Computing Systems (pp. 1217-1264).
Huron, S., Carpendale, S., Boy, J., and Fekete, J. D. (2016). Using viskit: a manual for running a constructive visualization workshop. In Pedagogy of Data Visualization Workshop at IEEE VIS 2016
Huron, S., Carpendale, S., Thudt, A., Tang, A., and Mauerer, M. (2014a). Constructive visualization. In Proceedings of the 2014 Conference on Designing Interactive Systems, pp. 433–442
Huron, S., Gourlet, P., Hinrichs, U., Hogan, T., and Jansen, Y. (2017). Let's get physical: promoting data physicalization in workshop formats. In Proceedings of the 2017 Conference on Designing Interactive Systems (pp. 1409–1422)
Huron, S., Jansen, Y., and Carpendale, S. (2014b). Constructing visual representations: investigating the use of tangible tokens. IEEE Trans. Vis. Comput. Graph. 20, 2102–2111. doi: 10.1109/TVCG.2014.2346292
Hurtienne, J., and Reinhardt, D. (2017). Teaching data physicalisation to HCI students. In Proc. pedagogy Physicalization workshop DIS.
Inhelder, B., and Piaget, J. (1964). The early growth of logic in the child. New York: Harper & Row.
International Baccalaureate. (2009). Mathematics scope and sequence. International Baccalaureate Organization. Cardiff, Wales.
Jansen, Y., and Dragicevic, P. (2013). An interaction model for visualizations beyond the desktop. IEEE Trans. Vis. Comput. Graph. 19, 2396–2405. doi: 10.1109/TVCG.2013.134
Jansen, Y., Dragicevic, P., and Fekete, J. D. (2013). Evaluating the efficiency of physical visualizations. In Proceedings of the SIGCHI conference on human factors in computing systems 2593–2602. doi: 10.1145/2470654.2481359
Jansen, Y., Dragicevic, P., Isenberg, P., Alexander, J., Karnik, A., Kildal, J., et al. (2015). Opportunities and challenges for data physicalization. In Proceedings of the 33rd Annual ACM Conference on Human Factors in Computing Systems 3227–3236. doi: 10.1145/2702123.2702180
Jansen, Y., and Hornbæk, K. (2015). A psychophysical investigation of size as a physical variable. IEEE Trans. Vis. Comput. Graph. 22, 479–488. doi: 10.1109/TVCG.2015.2467951
Julià, C., and Antolì, J. Ò. (2018). Enhancing spatial ability and mechanical reasoning through a STEM course. Int. J. Technol. Des. Educ. 28, 957–983. doi: 10.1007/S10798-017-9428-X
Kanis, M. (2019). Physical sensemaking: crafting for an invisible world of data. In workshop: Troubling innovation: Craft and computing across boundaries. The ACM CHI conference on human factors in computing systems.
Kelly, A. V., Kimbell, R. A., Patterson, V. J., Saxton, J., and Stables, K. (1987). Design and technological activity: a framework for assessment. London: HM Stationery Office, Department of Education and Science, Assessment of Performance Unit.
Kim, M. J., and Maher, M. L. (2008). The impact of tangible user interfaces on spatial cognition during collaborative design. Des. Stud. 29, 222–253. doi: 10.1016/j.destud.2007.12.006
Kirsh, D. (2009). Interaction, external representations and sense making. In Proceedings of the 31st Annual Conference of the Cognitive Science Society (pp. 1103–1108).
Kontra, C., Lyons, D. J., Fischer, S. M., and Beilock, S. L. (2015). Physical experience enhances science learning. Psychol. Sci. 26, 737–749. doi: 10.1177/0956797615569355
Kosslyn, S. M. (1978). “The representational-development hypothesis” in Memory development in children. ed. P. A. Ornstein (Hillsdale, NJ: Lawrence Erlbaum), 157–189.
Kragten, M., Admiraal, W., and Rijlaarsdam, G. (2015). Students’ ability to solve process-diagram problems in secondary biology education. J. Biol. Educ. 49, 91–103. doi: 10.1080/00219266.2014.888363
Lamon, S. J. (1996). The development of unitizing: its role in children's partitioning strategies. J. Res. Math. Educ. 27, 170–193. doi: 10.2307/749599
Landis, J. R., and Koch, G. G. (1977). The measurement of observer agreement for categorical data. Biometrics 33:159. doi: 10.2307/2529310
Leopold, C., and Leutner, D. (2012). Science text comprehension: drawing, main idea selection, and summarizing as learning strategies. Learn. Instr. 22, 16–26. doi: 10.1016/j.learninstruc.2011.05.005
Liebschner, J. (2006). A child's work: freedom and guidance in Froebel's educational theory and practice. Cambridge: Lutterworth Press.
Link, T., Moeller, K., Huber, S., Fischer, U., and Nuerk, H. C. (2013). Walk the number line–an embodied training of numerical concepts. Trends Neurosci. Educ. 2, 74–84. doi: 10.1016/j.tine.2013.06.005
Lin, X. (1999). Visualization for the document space. Readings in Information Visualization, San Francisco: Morgan Kaufmann. 432–439.
Maresch, G., and Sorby, S. A. (2021). Perspectives on spatial thinking. J. Geom. Graph. 25, 271–293.
Marshall, P. (2007). Do tangible interfaces enhance learning? In Proceedings of the 1st International Conference on Tangible and Embedded Interaction (pp. 163–170)
Mayer, R. E. (Ed.). (2005). The Cambridge handbook of multimedia learning. Cambridge: Cambridge University Press
Mickelson, W. T., and Heaton, R. M. (2004). “Primary teachers’ statistical reasoning about data” in The challenge of developing statistical literacy, reasoning and thinking (Dordrecht: Springer Netherlands), 327–352.
National Research Council. (2006). Learning to think spatially. Washington, DC: The National Academies Press.
Newcombe, N. (2017). Harnessing spatial thinking to support stem learning. OECD education working papers, no. 161, OECD Publishing, Paris.
Newcombe, N. S. (2010). Picture this: increasing math and science learning by improving spatial thinking. Am. Educ. 34:29.
Newcombe, N. S., and Frick, A. (2010). Early education for spatial intelligence: why, what, and how. Mind Brain Educ. 4, 102–111. doi: 10.1111/j.1751-228X.2010.01089.x
O'Malley, C., and Fraser, D. S. (2004). Literature review in learning with tangible technologies (Report 12). Bristol: Nesta FutureLab Series.
Pallasmaa, J. (2017). Embodied and existential wisdom in architecture: The thinking hand. Body and Society, 23, 96–111. doi: 10.1177/1357034X16681443
Papert, S. (1994). The children’s machine: rethinking school in the age of the computer Revised ed New York: Basic Books.
Perin, C. (2021). What students learn with personal data physicalization. IEEE Comput. Graph. Appl. 41, 48–58. doi: 10.1109/MCG.2021.3115417
Prain, V., and Waldrip, B. (2010). Representing science literacies: an introduction. Res. Sci. Educ. 40, 1–3. doi: 10.1007/s11165-009-9153-x
Ramadas, J. (2009). Visual and spatial modes in science learning. Int. J. Sci. Educ. 31, 301–318. doi: 10.1080/09500690802595763
Schön, D. A. (1983). The reflective practicioner: how professionals think in action. New York: Basic Books.
Search, P. (2015). Interactive multisensory data representation. In Design, user experience, and usability: users and interactions: 4th international conference, DUXU 2015, held as part of HCI international 2015, Los Angeles, CA, USA, august 2–7, 2015, proceedings, part II 4 (pp. 363–373). Springer International Publishing.
Shaer, O., and Hornecker, E. (2010). Tangible user interfaces: past, present, and future directions. Found. Trends Hum.-Comput. Interact. 3, 4–137. doi: 10.1561/1100000026
Sorby, S. A. (2009). Educational research in developing 3-D spatial skills for engineering students. Int. J. Sci. Educ. 31, 459–480. doi: 10.1080/09500690802595839
Stieff, M. (2011). Improving representational competence using molecular simulations embedded in inquiry activities. J. Res. Sci. Teach. 48, 1137–1158. doi: 10.1002/tea.20438
Stieff, M., Bateman, R. C., and Uttal, D. H. (2005). “Teaching and learning with three-dimensional representations” in Visualization in science education. Models and modeling in science education. ed. J. K. Gilbert (Dordrecht: Springer), 93–120.
Stieff, M., Hegarty, M., and Dixon, B. (2010). “Alternative strategies for spatial reasoning with diagrams” in International conference on theory and application of diagrams. eds. A. K. Goel, M. Jamnik, and N. H. Narayanan (Berlin, Heidelberg: Springer), 115–127.
Stigler, J. W. (1984). “Mental abacus”: The effect of abacus training on Chinese children’s mental calculation. Cognitive Psychology, 16, 145–176. doi: 10.1016/0010-0285(84)90006-9
Stull, A. T., Gainer, M. J., and Hegarty, M. (2018). Learning by enacting: the role of embodiment in chemistry education. Learn. Instr. 55, 80–92. doi: 10.1016/j.learninstruc.2017.09.008
Suh, J., and Cho, J. Y. (2020). Linking spatial ability, spatial strategies, and spatial creativity: a step to clarify the fuzzy relationship between spatial ability and creativity. Think. Skills Creat. 35:100628. doi: 10.1016/j.tsc.2020.100628
Szechter, L. E., and Liben, L. S. (2004). Parental guidance in preschoolers' understanding of spatial-graphic representations. Child Dev. 75, 869–885. doi: 10.1111/j.1467-8624.2004.00711.x
Taylor, A. S., Lindley, S., Regan, T., Sweeney, D., Vlachokyriakos, V., Grainger, L., et al. (2015). Data-in-place: thinking through the relations between data and community. In Proceedings of the 33rd Annual ACM Conference on Human Factors in Computing Systems (pp. 2863–2872).
The World Bank. (2018). What a waste global database. Data catalog. Available at: https://datacatalog.worldbank.org/search/dataset/0039597 (Accessed January 23, 2023)
Thurstone, L. L. (1955). Differential growth of mental abilities. In Science (Vol. 121, No. 3148, pp. 627). American Association for the Advancement of Science.
Tsang, J. M., Blair, K. P., Bofferding, L., and Schwartz, D. L. (2015). Learning to “see” less than nothing: putting perceptual skills to work for learning numerical structure. Cogn. Instr. 33, 154–197. doi: 10.1080/07370008.2015.1038539
Tversky, B. (2001). “Spatial schemas in depictions” in Spatial schemas and abstract thought. ed. M. Gattis (Cambridge, MA: The MIT Press), 79–112.
Tytler, R., and Prain, V. (2010). A framework for re-thinking learning in science from recent cognitive science perspectives. Int. J. Sci. Educ. 32, 2055–2078. doi: 10.1080/09500690903334849
Tytler, R., Prain, V., Aranda, G., Ferguson, J., and Gorur, R. (2020). Drawing to reason and learn in science. J. Res. Sci. Teach. 57, 209–231. doi: 10.1002/tea.21590
Tytler, R., Prain, V., Hubber, P., and Haslam, F. (2013a). “Reasoning in science through representation” in Constructing representations to learn in science. eds. R. Tytler, V. Prain, P. Hubber, and B. Waldrip (Rotterdam: SensePublishers), 83–107.
Tytler, R., Prain, V., Hubber, P., and Waldrip, B. (Eds.). (2013b). Constructing representations to learn in science. Berlin: Springer Science & Business Media
Uttal, D. H., Meadow, N. G., Tipton, E., Hand, L. L., Alden, A. R., Warren, C., et al. (2013b). The malleability of spatial skills: a meta-analysis of training studies. Psychol. Bull. 139, 352–402. doi: 10.1037/a0028446
Uttal, D. H., Miller, D. I., and Newcombe, N. S. (2013a). Exploring and enhancing spatial thinking: links to achievement in science, technology, engineering, and mathematics? Curr. Dir. Psychol. Sci. 22, 367–373. doi: 10.1177/0963721413484756
Vande Moere, A., and Patel, S. (2010). “The physical visualization of information: designing data sculptures in an educational context” in Visual information communication. eds. M. Huang, Q. Nguyen, and K. Zhang (Boston, MA: Springer US), 1–23.
Van Meter, P., Aleksic, M., Schwartz, A., and Garner, J. (2006). Learner-generated drawing as a strategy for learning from content area text. Contemp. Educ. Psychol. 31, 142–166. doi: 10.1016/j.cedpsych.2005.04.001
Wai, J., Lubinski, D., and Benbow, C. P. (2009). Spatial ability for STEM domains: aligning over 50 years of cumulative psychological knowledge solidifies its importance. J. Educ. Psychol. 101, 817–835. doi: 10.1037/a0016127
Waldschütz, H., and Hornecker, E. (2020). The importance of data curation for data physicalization. In Companion publication of the 2020 ACM designing interactive systems conference (pp. 293–297).
Willett, W., and Huron, S. (2016). A constructive classroom exercise for teaching infovis. In Pedagogy of data visualization workshop at IEEE VIS 2016.
Wilson, M. (2002). Six views of embodied cognition. Psychon. Bull. Rev. 9, 625–636. doi: 10.3758/BF03196322
Wu, H. K., and Shah, P. (2004). Exploring visuospatial thinking in chemistry learning. Sci. Educ. 88, 465–492. doi: 10.1002/sce.10126
Wun, T., Payne, J., Huron, S., and Carpendale, S. (2016). Comparing bar chart authoring with Microsoft excel and tangible tiles. Comput. Graph. Forum 35, 111–120. doi: 10.1111/cgf.12887
Zhao, J., and Vande Moere, A. (2008). Embodiment in data sculpture: a model of the physical visualization of information. In Proceedings of the 3rd International Conference on Digital Interactive Media in Entertainment and Arts (pp. 343–350)
Keywords: spatial thinking, data physicalization, embodied cognition, information visualization, primary education, design, making
Citation: Zhu C, Klapwijk R, Silva-Ordaz M, Spandaw J and de Vries MJ (2023) Cognitive and embodied mapping of data: an examination of children’s spatial thinking in data physicalization. Front. Educ. 8:1308117. doi: 10.3389/feduc.2023.1308117
Edited by:
Gavin Duffy, Technological University Dublin, IrelandReviewed by:
Grace Panther, University of Nebraska-Lincoln, United StatesCopyright © 2023 Zhu, Klapwijk, Silva-Ordaz, Spandaw and de Vries. This is an open-access article distributed under the terms of the Creative Commons Attribution License (CC BY). The use, distribution or reproduction in other forums is permitted, provided the original author(s) and the copyright owner(s) are credited and that the original publication in this journal is cited, in accordance with accepted academic practice. No use, distribution or reproduction is permitted which does not comply with these terms.
*Correspondence: Caiwei Zhu, Yy56aHUtMUB0dWRlbGZ0Lm5s
Disclaimer: All claims expressed in this article are solely those of the authors and do not necessarily represent those of their affiliated organizations, or those of the publisher, the editors and the reviewers. Any product that may be evaluated in this article or claim that may be made by its manufacturer is not guaranteed or endorsed by the publisher.
Research integrity at Frontiers
Learn more about the work of our research integrity team to safeguard the quality of each article we publish.