
94% of researchers rate our articles as excellent or good
Learn more about the work of our research integrity team to safeguard the quality of each article we publish.
Find out more
ORIGINAL RESEARCH article
Front. Educ., 08 January 2024
Sec. Higher Education
Volume 8 - 2023 | https://doi.org/10.3389/feduc.2023.1304016
This article is part of the Research TopicStories of Abandonment. A Biographical-Narrative Approach to the Academic Dropout in Andalusian Universities. Multicausal Analysis and Proposals for PreventionView all 13 articles
 Manuel Fernández Cruz*
 Daniel Álvarez FerrándizF. Borja Fernández García-ValdecasasEsther González Castellón
Problem and objective: University dropout is a major problem that affects more than 31,000 students each year in Andalusian universities, with serious personal and social consequences and an economic cost of more than 222 million euros for the region’s public administration. As concluded from the review of explanatory models we reviewed, dropout has a multicausal origin. The purpose of our work is to test the efficacy of the use of a screening for the early detection of the risk of academic dropout in Higher Education in Andalusian universities.
Procedure: We applied a screening instrument adapted for incoming students in public universities in Andalusia. The survey was applied at the beginning of the second semester. In this article we present data from a sample composed of 976 subjects from the universities of Granada UGR, Jaén UJA and Pablo de Olavide de Sevilla UPO.
Results: With the data obtained we have established the dropout risk group, which includes those students who do not reach an average score of 3.00 in the total screening. There are 34 students representing 3.48% of the sample. Of these 34 students, 26 are women and 8 are men; 20 belong to the UGR, 8 to the UJA and 5 to the UPO. The detection of the risk group will allow the universities to apply preventive measures in a personalized and adjusted way to avoid possible dropout.
Academic dropout is a very important problem in higher education with very negative social and personal consequences. There are many personal situations of a student that can be included in the concept of dropout: change of undergraduate degree, transfer of university, temporary pause in studies and total abandonment of the classroom and the university system. In this article we are going to focus on total dropout, which the Spanish Ministry of Universities of the Government of Spain (2022) defines as the situation of a student who has not graduated on time and is not enrolled in his or her undergraduate degree or in any other degree program at any other university for two consecutive years, so that the student has been left out of the system.
Consistent with this definition, the university system dropout rate is measured as the percentage of students in a cohort who, in year “X” in which they should have graduated, have not obtained their diploma and have not enrolled in any university degree program at in any university for two consecutive years (Ministry of Universities of the Government of Spain, 2022).
The dropout rate is excessively high in developed countries. International organizations such as the OECD (2019) put it at around 20%. The EU indicates for Spain a value that fluctuates around 18% of all university students: bachelor’s and master’s degrees (Eurostat, 2020).
The official data collected in the successive annual reports of Data and Figures of the Spanish University System published by the Government show the evolution of the phenomenon. Specifically, in the 2021 academic year, the rate rises to 13% of undergraduate students (Ministry of Universities of the Government of Spain, 2022). And a double-digit rate is highly worrisome for the University System. That 13% represents a total of 169,000 students who have dropped out of the system throughout Spain of which 31,850 correspond to universities in Andalusia (Ministry of Universities of the Government of Spain, 2022). If we estimate that the state was investing in 2021 about 7,000 euros per year per university position, the cost of dropout (as calculated by Colás Bravo, 2015) is amounting to a total of 1,183 million euros per year in Spain, of which 222 million euros correspond to Andalusia. These figures are lower than those estimated for the United States (Rumberger, 2020) and other regions of the world. Even so, they are unbearable.
In addition to the high economic impact, the negative effects are felt in job training, retraining, social and community assistance programs that must be put in place to care for unemployed young people and even those with social adaptation difficulties.
The social consequences of dropout are closely linked to the personal consequences: feelings of failure, depression, maladjustment or difficulty in finding a quality job in the immediate future.
As it is such a broad and widespread problem with pernicious consequences, many studies are converging to provide knowledge on the phenomenon and its causes (Aina et al., 2022). In his systematic review on the subject, Aljohani (2016) finds six theoretical models that try to explain the causes of dropout and to find the factors of persistence in study that are successful in retaining students.
Spady’s (1970) “Undergraduate Dropout Process” model is based on the assumptions (1) that satisfaction with the college experience will depend on the social and academic rewards available, and (2) that maintaining commitment to college requires both integration into the system and a significant number of positive rewards (academic or social). This theory is based on the idea of student interoperability with the academic system and the social system.
Tinto (1975) developed his “Institutional Departure Model” as an explanatory model of dropout in American universities and is based on a social integration perspective, attributing the cause of dropout to the interaction between the student’s personal attributes and the organizational structures of the institutions. Adjusting the above model for the European context, Heublein et al. (2003) include extra-university contextual factors, such as economic situation, living conditions, family support, and academic and professional guidance received, as causes that influence persistence in the face of dropping out of university studies.
Bean’s (1980) “Student Attrition Model” attempts to create a direct causal pathway so that administrators can point to a specific variable indicating why students drop out. Among the variables studied that influence a student’s decision to persist in studies are: positive GPA, satisfaction with the institution, perceived added value of the education received, opportunities for participation in student life, and adequate organizational norms for effective integration.
With the “Student-Faculty Informal Contact Model,” Pascarella (1980) assumed that a more informal interaction of students with faculty could increase the level of their institutional commitment and, consequently, minimize the risk of dropout. Pascarella (1980) constructed his model of informal student-faculty contact by examining the dimensions: context, exposure, focus, and impact.
Meanwhile, in their “Non-traditional Student Attrition Model,” Bean and Metzner (1985) argue that, while previous models have emphasized the important role of social integration within the academic institution in the student persistence process, this factor has minimal impact on non-traditional students. Rather, nontraditional students appear to be affected primarily by environmental factors, such as family commitments and other external responsibilities.
The “Integrated Model of Student Retention” (Cabrera et al., 1993) analyzes all the statistically confirmed variables of the previous theories, while excluding from the model those that were not validated in the initial analysis and, in addition, merges similar constructs. Thus, the constructs “courses” and “institutional adequacy and quality” from Bean’s (1980) theoretical model are merged with the constructs “academic integration” and “institutional commitments” from Tinto’s theoretical model, respectively. In addition, some indicator variables were extracted from their original constructs and included in the current model as independent variables. For example, in their statistical analysis, Cabrera et al. (1993) found that the variable “GPA,” considered in Tinto’s model as an indicator variable of the construct “academic integration,” had a status equivalent to the construct “parent.” Finally, the variables “financial attitudes” and “encouragement from friends and family” from the construct “environment” of Bean’s theoretical model were included in his model as independent variables because they were found to significantly affect academic integration, institutional commitments, and the persistence decision.
Along with these six classic models, we find other explanatory theories of dropout such as the Theory of Student Involvement (Astin, 1975) which refers to the “quantity and quality of physical and psychological energy that students invest in the college experience” (p. 307). Astin postulated that the degree to which students are involved in college is positively related to their degree of learning and personal development. More recently, Kehm et al. (2019), point out the nine factors that, in their opinion, influence dropout: academic integration, social integration, personal efforts and motivations to study, admission information and requirements, previous academic performance in school, the student’s personal characteristics, the student’s sociodemographic background, and external conditions. Among these external conditions are: the economic situation and the need to make studies compatible with work, even if it is part-time (Argentin and Triventi, 2011).
With his systematic review, Barroso et al. (2022) makes a conceptual map of the factors involved in dropout: (1) Input attributes (mother’s academic level, family economic level, gender, mental health, previous academic path); (2) Goals and commitment (self-efficacy, autonomy, motivation, perspectives); (3) Institutional experiences (academic capacity, time dedicated to study, interaction with peers, extracurricular activities); (4) Academic and social integration (satisfaction, perceived social support); and (5) Measures of identification of risk groups (use of screening, analytical learning, data mining, preventive measures).
We draw attention to the fourth factor referring to proactive institutional intervention in diagnosis and preventive intervention with risk groups, which is the one we focus on in this article. Considerations on the prediction of the phenomenon and the conditions of preventive actions are relevant to this study.
The identification and preventive intervention with students at risk of dropping out has been addressed by Ambiel (2015) who presented a study of construction and validation of the Higher Education Dropout Motivation Scale that considers risk factors and leads to an assessment of institutional, personal, interpersonal and professional motivations, autonomy, social support and academic performance. On the other hand, Lin and Tang (2015) report the construction of a dropout alert system in higher education using data mining strategies. de Oliveira et al. (2021) employs AL Analytic Learning, a strategy that relies on the availability of large amounts of student data (demographic information, grades, behaviors in information systems, grades, behaviors in learning management systems, etc.), to exemplify changes in the way educational institutions use data to address student retention, dropout, and success issues, and focus on the needs of individual students in a personalized, data-driven manner.
This system is used by Ortigosa et al. (2019) with their SPA (Dropout Prediction System), an early warning system that uses these algorithmic models to generate static predictions of early dropout risk and periodically updated dynamic predictions. The goal of its work is to prevent student dropout through retention actions focused on the most at-risk students, seeking to maximize the effectiveness of institutional efforts in this regard. It also supports the recording of the resulting retention-oriented interventions for subsequent analysis.
According to a study by Martínez-López et al. (2023), the use of data mining techniques makes it possible to identify dropout risk indicators in university students. By analyzing academic and sociodemographic factors, predictive patterns of dropout can be detected (Martínez-López et al., 2023).
On the other hand, Moreno-Candil et al. (2022) point out that implementing early warning systems and comprehensive monitoring of vulnerable students is a key strategy for prevention. Timely detection and support can avoid situations of academic failure (Moreno-Candil et al., 2022).
Likewise, Moreno-Guerrero et al. (2022) emphasize the importance of offering socioemotional support within preventive actions. The strengthening of soft skills and sense of institutional belonging reinforces the motivation and commitment of students (Moreno-Guerrero et al., 2022).
In short, we have seen how the phenomenon of university dropout has been studied from different disciplines: psychology (Bakker et al., 2020), sociology (Samuel and Burger, 2020) and economics (Aina et al., 2022). Each of these disciplines points to specific mechanisms and determinants of students’ decisions and achievements. But what is certain is that the models work in an integrated manner and provide a multicausal explanation to the phenomenon (López-Cózar et al., 2020). It is clear, therefore, that to address the prediction of school dropout, as we intend to do in this study, we will have to pay attention to dimensions such as: the student’s personality; the structures available for social integration; the investment in time, money and effort that the student must make to enter, persist and complete their studies; the possible existence of institutional mechanisms for reception and tutorial and academic support; vocational aspects; as well as the effectiveness of the instructional model offered to students and the neurodidactic factors involved (Álvarez et al., 2022).
In this article, we address dropout as a definitive cause of the absence or weakness in the factors that favor persistence. Thus, we understand that weakness in the factors whose strength causes persistence leads to dropout. The purpose of our work is to test the effectiveness of the use of a screening for the early detection of the risk of academic dropout in Higher Education in Andalusian universities.
To achieve this purpose we set the following objectives:
1. To select a screening instrument to detect the risk of dropping out of university studies.
2. To apply the instrument to a large sample of students from public universities in Andalusia.
3. To describe the dropout risk group and compare it with the total sample.
The use of screening instruments to diagnose dropout in universities is increasingly common (Casanova et al., 2021). In this study we applied a screening instrument adapted from Velázquez and González (2017) for incoming students in public universities in Andalusia in order to delimit the risk group and provide data on that would allow institutions to develop policies and adjust actions for immediate attention. The design that is non-experimental, descriptive, explanatory and correlational.
The sample was accessed in 2021 through the opportunity provided by the professors in charge of teaching the second semester of the first course of any degree. For reasons of convenience, the application of the instrument was initiated at the Universities of Granada (UGR), Jaén (UJA) and Pablo de Olavide de Sevilla (UPO).
The sample is composed of 976 subjects. Of the 970 who identified their gender, 755 were women (77.35%) and 215 were men (22.02%). Out of the total, 642 study at the University of Granada (65.77%), 260 at the University of Jaén (26.63%) and 73 at the Pablo de Olavide University in Seville (7.47%), with one student not answering to which university he/she belonged. The students belong to a wide range of programs taught at the Andalusian universities mentioned: from Primary Education studies, which reaches the highest level of presence in the sample with 34.3%, to Criminology or different Engineering programs, which have one or more representatives in the sample. The subjects belong to the first year of the different undergraduate courses.
The instrument was applied to the students at the beginning of the second semester of their university studies. The students were contacted through their professors. For this purpose, a request for collaboration was sent to all professors with classes in the second semester of studies at the Universities of Granada, Jaén and Pablo Olavide in Seville.
For the diagnosis of subjects at risk of dropping out, we have used the “Survey on successful student retention” by Velázquez and González (2017) validated, in the first instance, by applying it to a population of nursing students from the Matamoros Multidisciplinary Academic Unit of the Autonomous University of Tamaulipas and which we have adapted to the academic context of the Spanish university (Álvarez et al., 2022). This survey has been slightly modified in the wording of the items to adapt it to the Spanish student reality, and two of the initial 73 items have been eliminated because they were not considered applicable in our context. In its final application format, the survey consists of 71 items and 6 questions for the sociodemographic identification of the student. The survey takes the form of a five-point Likert-type scale in which the student expresses their degree of agreement or disagreement with the opinion expressed.
Although it already had an excellent content validation, the instrument was again submitted to a content evaluation, with the participation of 12 judges, with the rank of PhD and specialists in the subject (professionalism coefficient k = 0.9), who provided some suggestions on the form of the items. Similarly, a pilot test was carried out using a sample group, from which slight changes were made in the formulation of some items (two in particular), without affecting the structural basis of the items.
The usefulness of using this survey on persistence in studies to diagnose at-risk groups is evident: to the extent that the factors shown to be effective for persistence do not appear in a student, he/she belongs to the at-risk group and is a candidate for corrective measures that enhance the persistence factors and decrease the predictors of dropout (Boyraz et al., 2013). In addition, the survey is easy to apply by the professors themselves in the classroom, which makes it an excellent screening system.
The original survey establishes five dimensions of university studies:
A. -Motivation;
B. -Commitment;
C. -Attitude and behavior;
D. -Socioeconomic conditions;
E. -Continuity.
These dimensions group 10 categories that, according to the authors, represent the theoretical model of persistence vs. dropping out of university studies (Table 1).
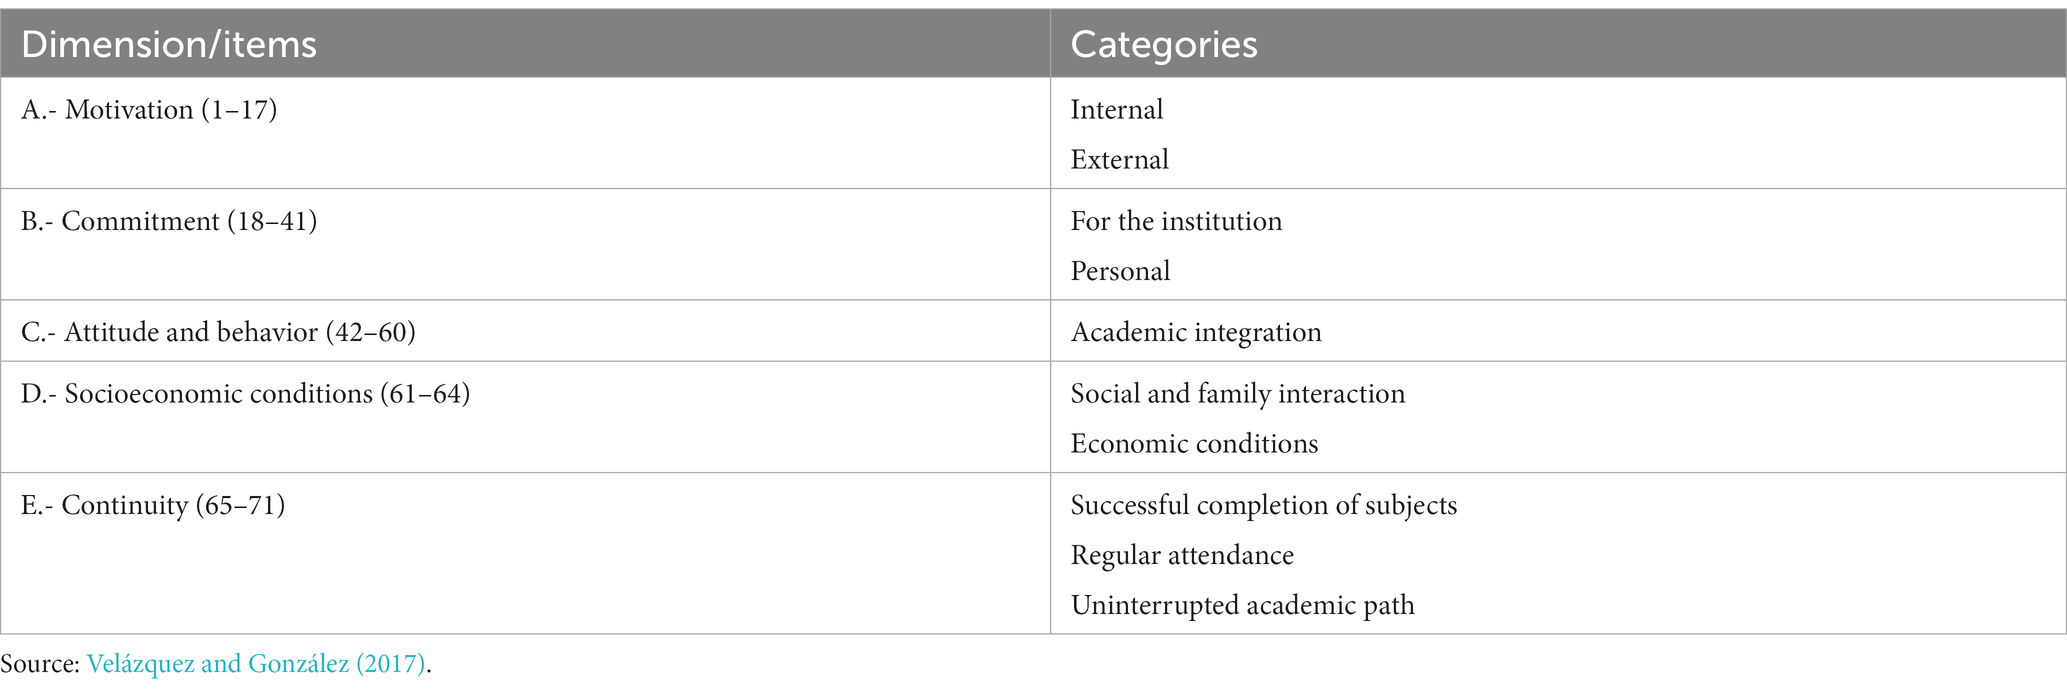
Table 1. Dimensions and category of the survey on persistence in university studies.
With the data collected, we performed a descriptive analysis, a correlation analysis between dimensions using Spearman’s Rho coefficient and an analysis of variance using the Kruskall-Wallis test to study the distribution of each dimension by university. The results of the descriptive analysis were used to make the sensitivity and specificity decisions necessary to estimate the risk group. The following software was used: SPSS V22.0.
The descriptive analysis of the data shows that all dimensions (Table 1) receive a mean score above 3.00, therefore positive. Dimension C-Attitude and behavior has the highest mean (4.35), followed by dimensions E-Continuity (4.11), D-Socio-economic conditions (4.09), B-Commitment (3.88). Dimension A-Motivation has the lowest mean (3.86). The data distribution, as will be seen below, is not normal, so the median should be taken as the main statistic; however, since both coincide, the mean has been shown as the preferred statistic.
The overall mean score achieved by the set of all the items of the entire sample is 3.83, i.e., the student population surveyed seems to be oriented toward persistence in the studies rather than toward dropping out. However, there are seven items that do not reach the mean score of 3.00, i.e., they indicate a certain level of dissatisfaction with the personal situation in the degree program. These items are presented in Table 2.
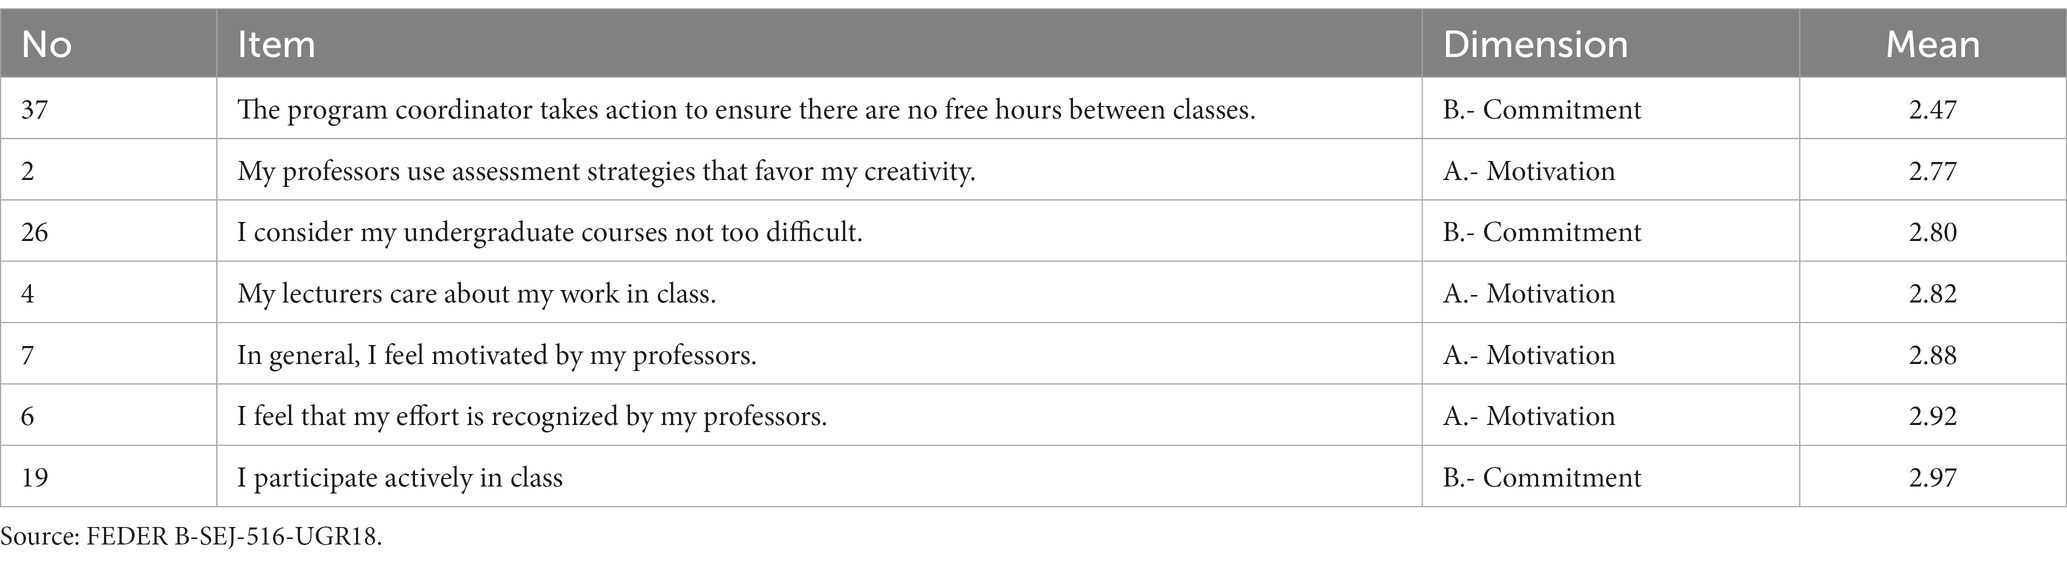
Table 2. Lowest scoring items in la muestra general.
Of the seven items not oriented to persistence, three of them, 37, 26 and 19 belong to dimension B.- Commitment, while the other four items (2, 4, 7, and 6) refer to dimension A.-Motivation.
As we had already discussed in Table 3, motivation and commitment are the traits that stand out the least in the students surveyed.
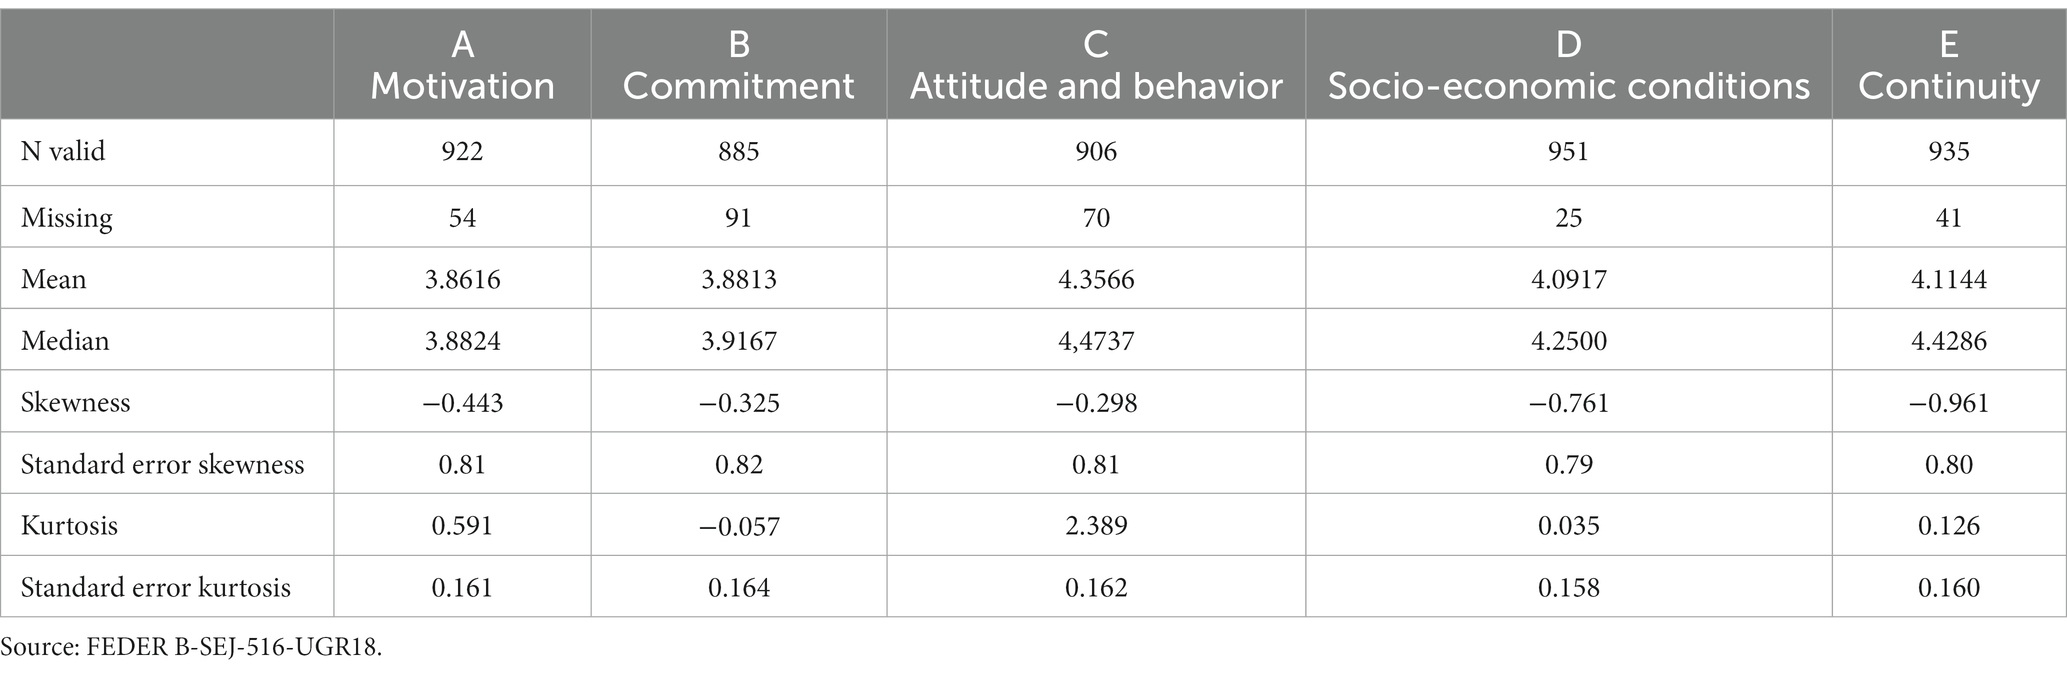
Table 3. Descriptive data by dimension.
To calculate the correlation between dimensions, the Kruskal-Wallis test was previously applied, since there were more than three samples, with the result that the data distribution was not normal, so we proceeded to study the correlation between dimensions using Spearman’s Rho coefficient, obtaining the results shown in Table 4.
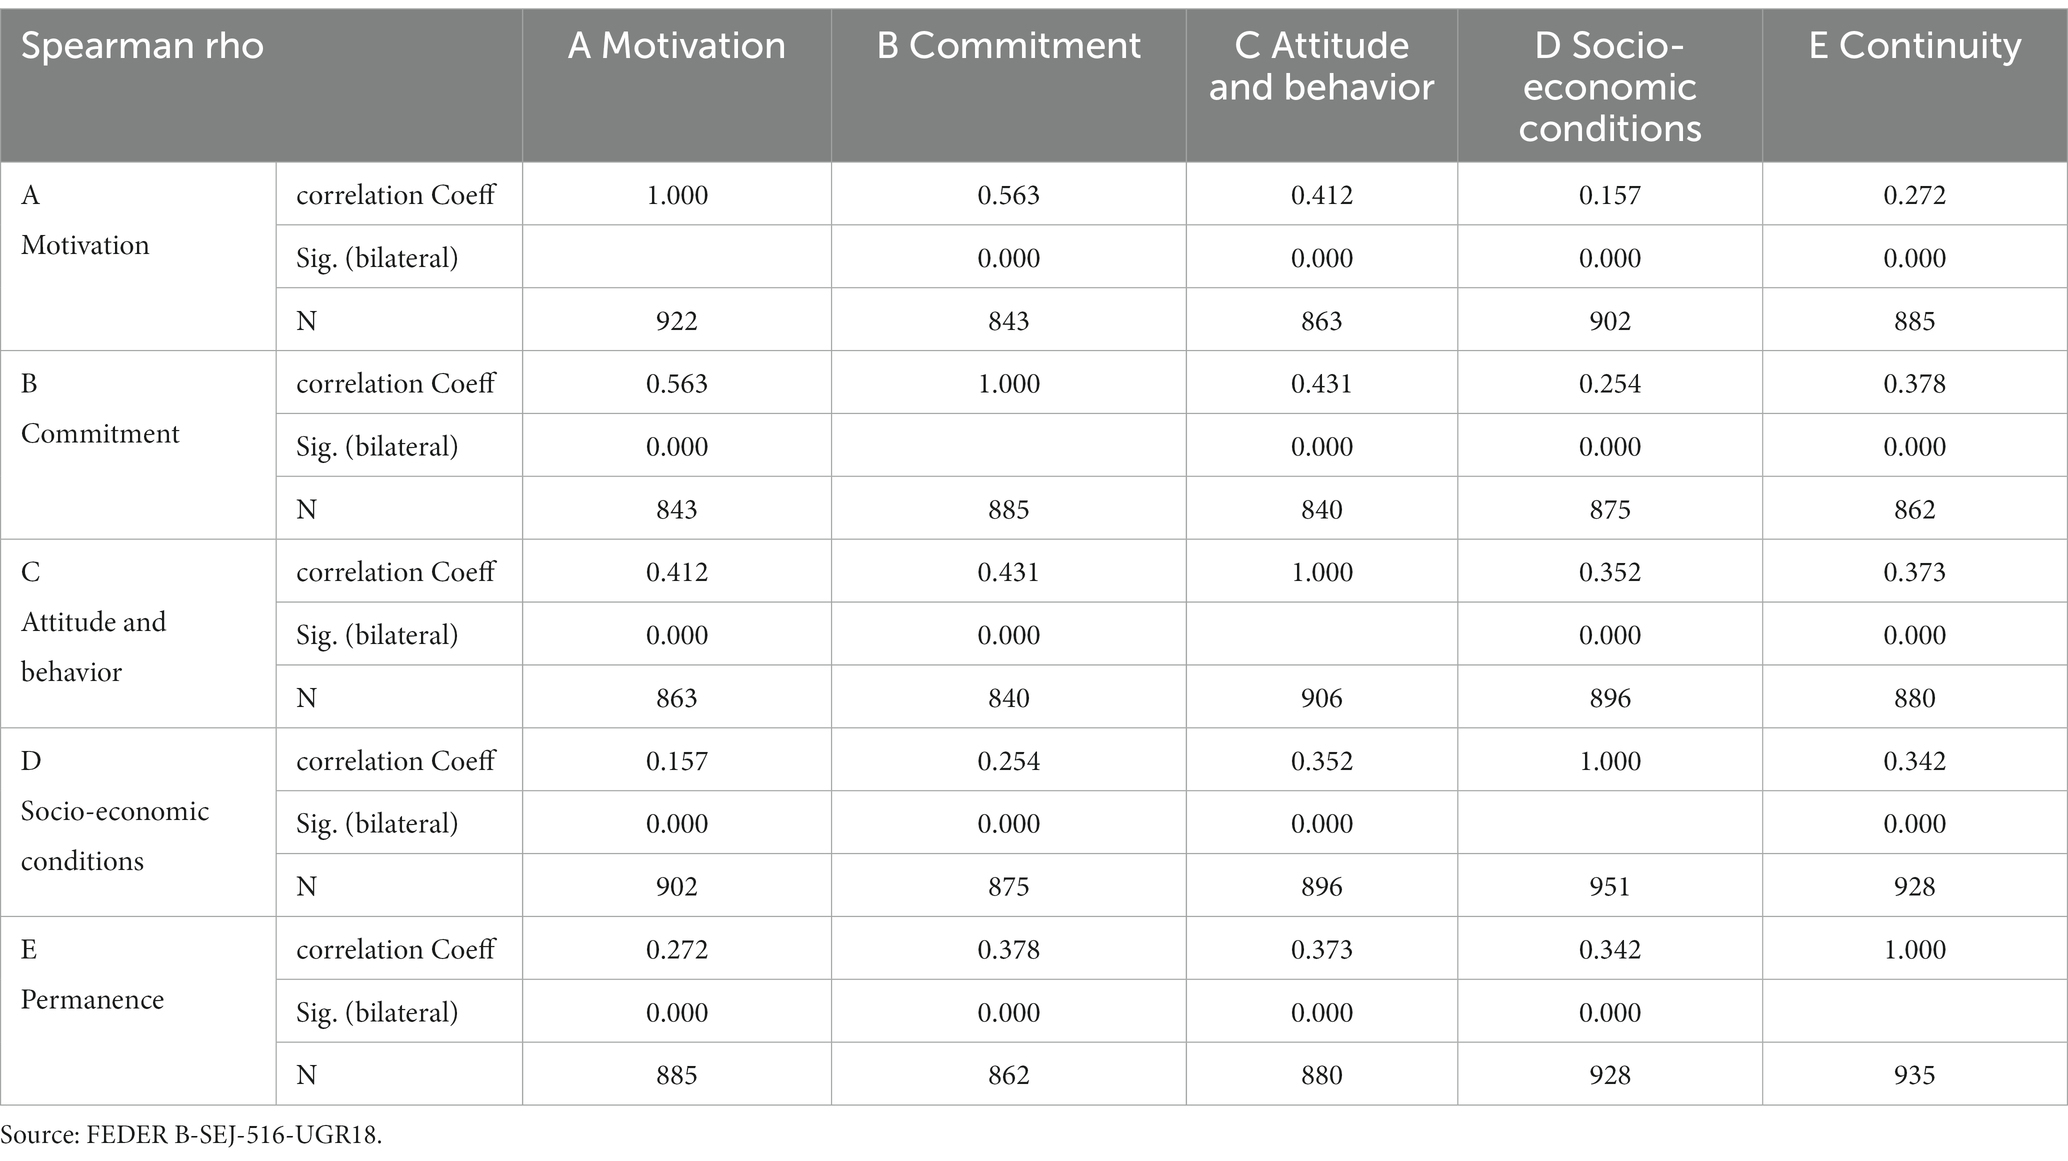
Table 4. Correlations between dimensions.
Table 4 shows the two-by-two correlations of all dimensions. All pairs correlate positively and significantly at level 0.01 (bilateral). These correlations vary in degree of significance. Moderately significant are the correlations (Rho between 0.40 and 0.59) between dimensions A/B (Motivation and Commitment) with a coefficient of 0.563; A/C (Motivation and Attitude and Behavior) with a coefficient of 0.412; and B/C (Commitment and Attitude and Behavior) with a coefficient of 0.431. The dimensions B/E (Attitude and Behavior and Continuity) with coefficient 0.378; C/E (Attitude and Behavior and Continuity) with coefficient 0.373; C/D (Attitude and Behavior and Socioeconomic Conditions) with coefficient 0.352; D/E (Socioeconomic Conditions with Continuity) with coefficient 0.342 appear with a low significant minor correlation (Rho between 0.20 and 0.39); A/E (Motivation with Continuity) with coefficient 0.272; and B/D (Commitment and Socioeconomic Conditions) with coefficient 0.254; Finally, we consider that the correlation A/D (Motivation and Socioeconomic Conditions) with coefficient 0.157, is a very insignificant correlation (Rho greater than 0.00 and up to 0.19).
We have studied the effect that belonging to a different university has on each dimension. To do this, we performed the Kruskal-Wallis test, finding that there are two dimensions that correlate positively with the university variable. These are dimensions A.-Motivation and E.-Continuity with values of 0.007 and 0.012 respectively, as shown in Table 5. Both are significant at a confidence level of 95%.
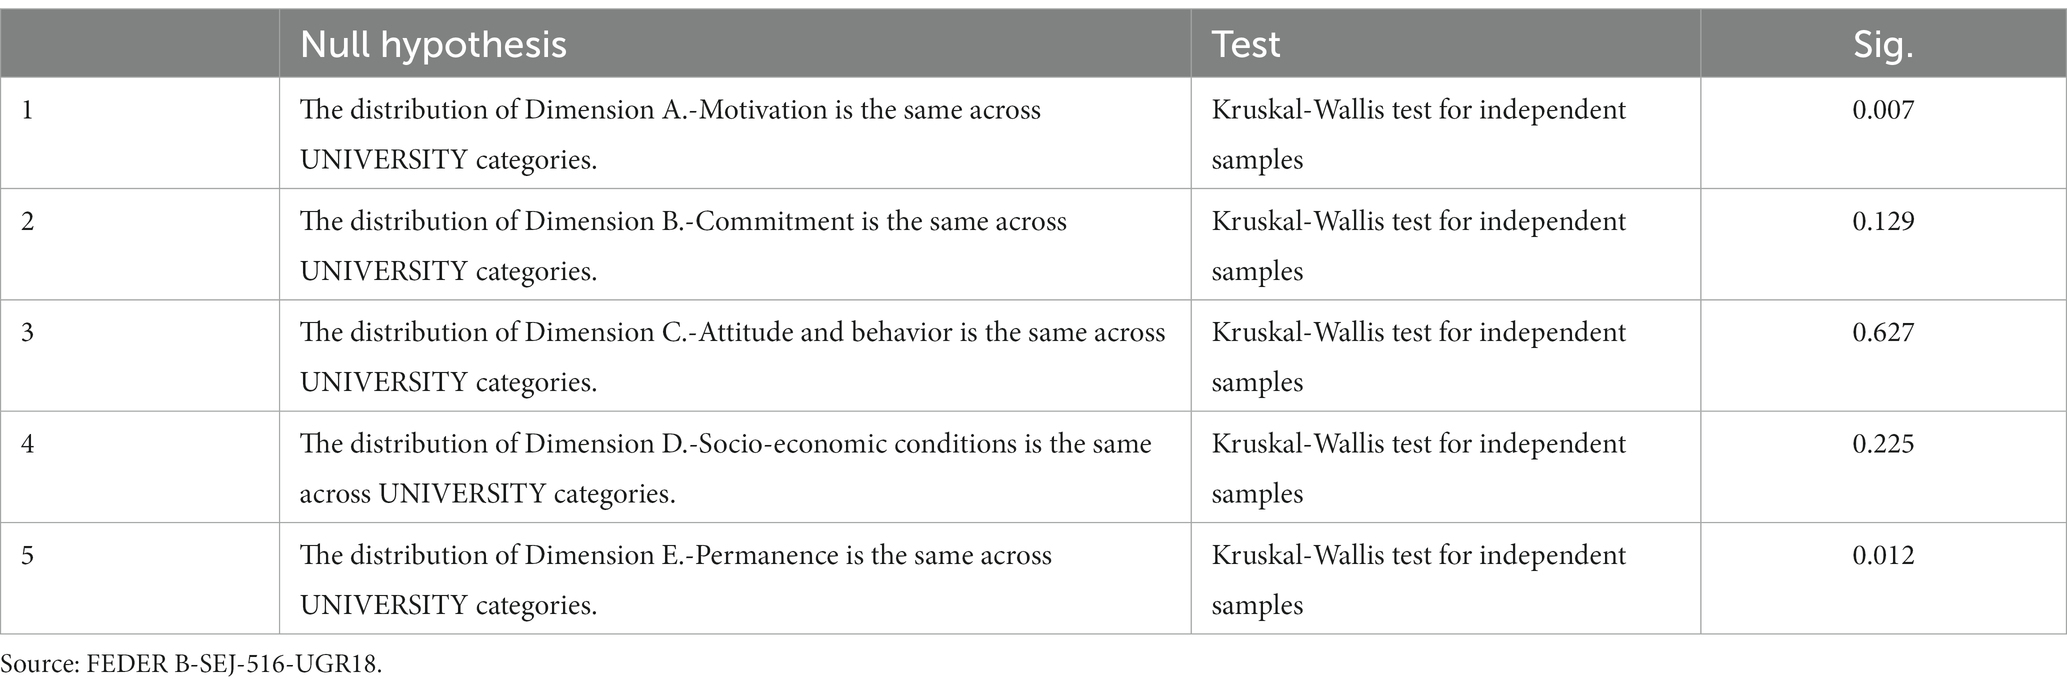
Table 5. Correlation coefficient Kruskall-Wallis.
Studying dimension A.-Motivation (Tables 6, 7), we find that the responses differ between UPO and UGR students, as well as between UPO and UJA students, while there are no significant differences in the responses given by UGR and UJA students. The motivation to persist among UPO students is lower than that of students from other universities and, therefore, the dropout rate at UPO is more likely to be higher.
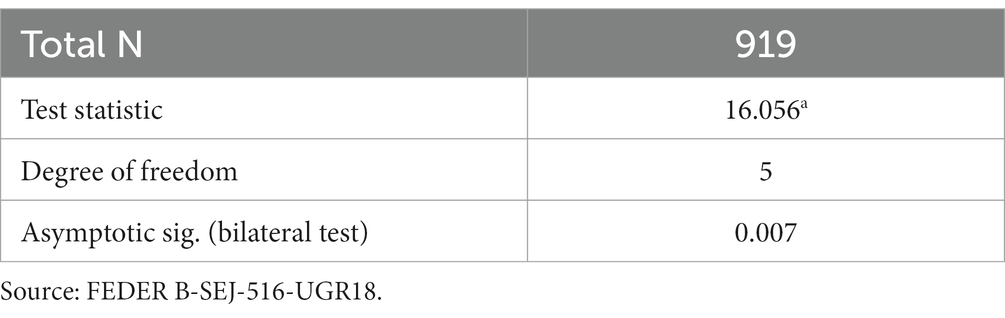
Table 6. Kruskal-Wallis statistics for independent samples dimension A.- Motivation/University.
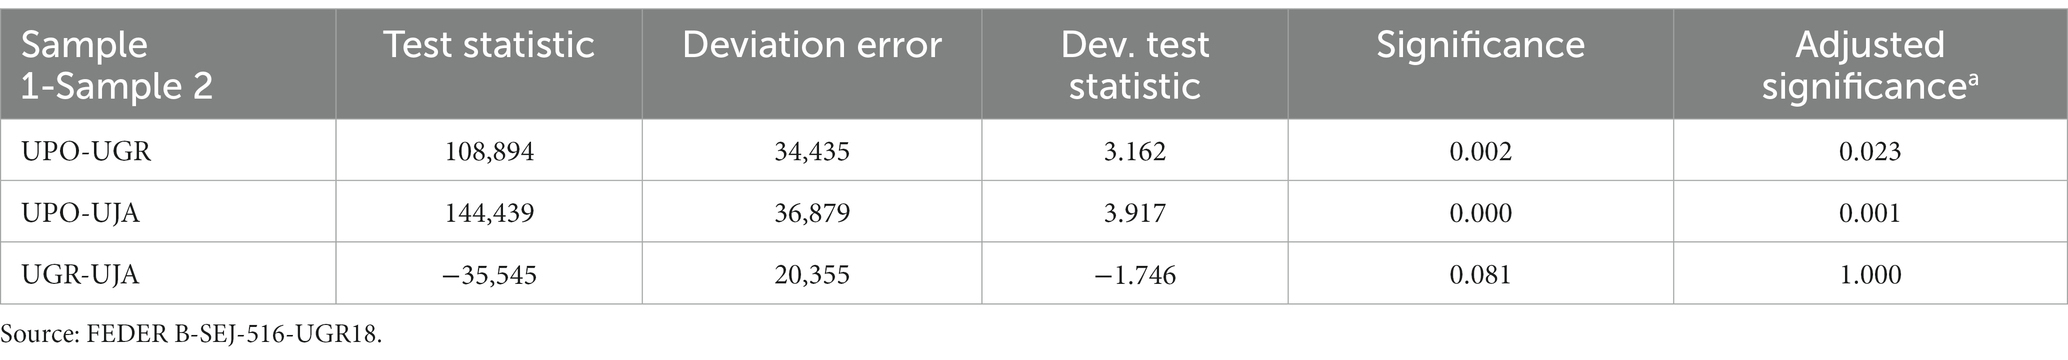
Table 7. University-peer comparisons on dimension A.-Motivation.
Each row tests the null hypothesis that the distributions of the UPO/UGR/UJA subsamples taken in pairs, two by two, are equal. Asymptotic significances (bilateral tests) are shown. The significance level is 0.05. Significance values have been adjusted by Bonferroni correction for several tests. Regarding the E.-Continuity dimension (Tables 8, 9), we again find that the behavior of UPO students is different from that of UGR and UJA students. The data show that UPO students have a lower tendency to continuity than students from the other two universities and, therefore, a higher risk of dropping out.
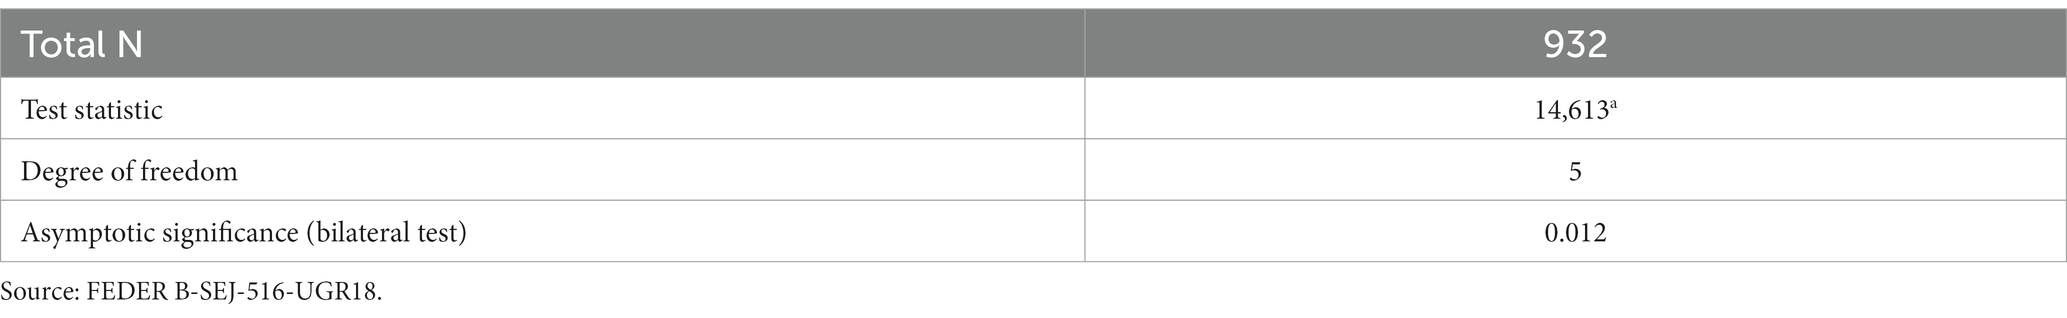
Table 8. Kruskal-Wallis statistics for independent samples dimension E.- Permanence/pairs University.
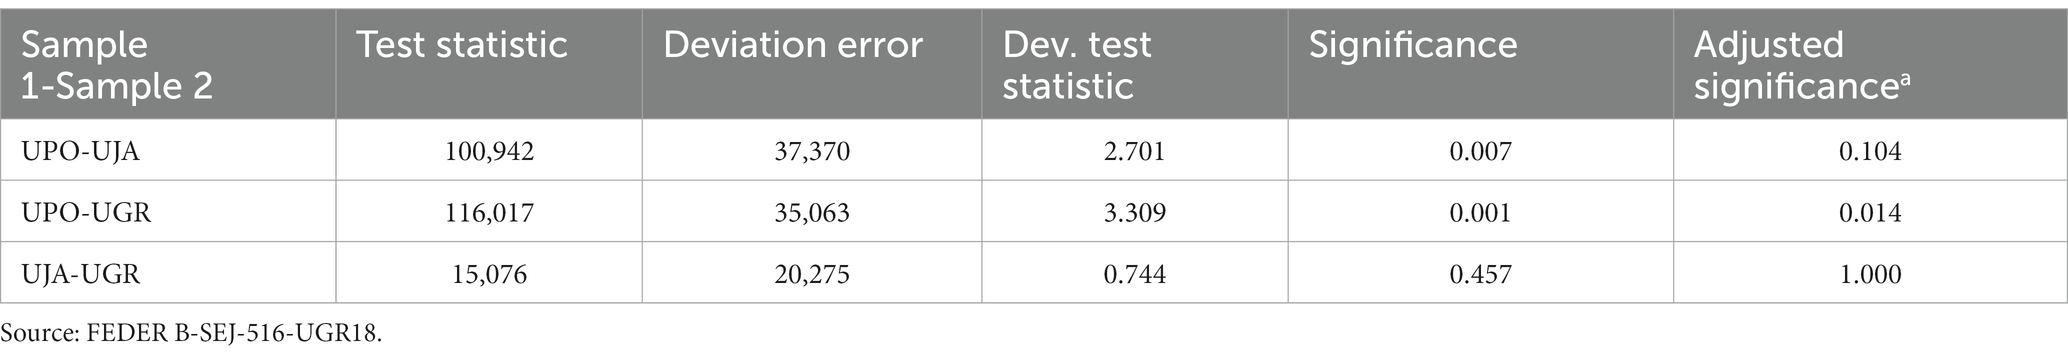
Table 9. University peer comparisons in dimension E.-Continuity.
To establish the at-risk group, we have decided to include those students who do not reach an average score of 3.00 in all their responses to the 71 items. With this cut-off score, we found that there are 34 students who do not reach the minimum value of 3.00. This represents 3.48% of the sample. Of these 34 students, 26 are women and 8 are men; 20 belong to the UGR, 8 to the UJA and 5 to the UPO. The average score achieved by the at-risk group is 2.21 for all their responses. The characteristics of the risk group are shown in Table 10.
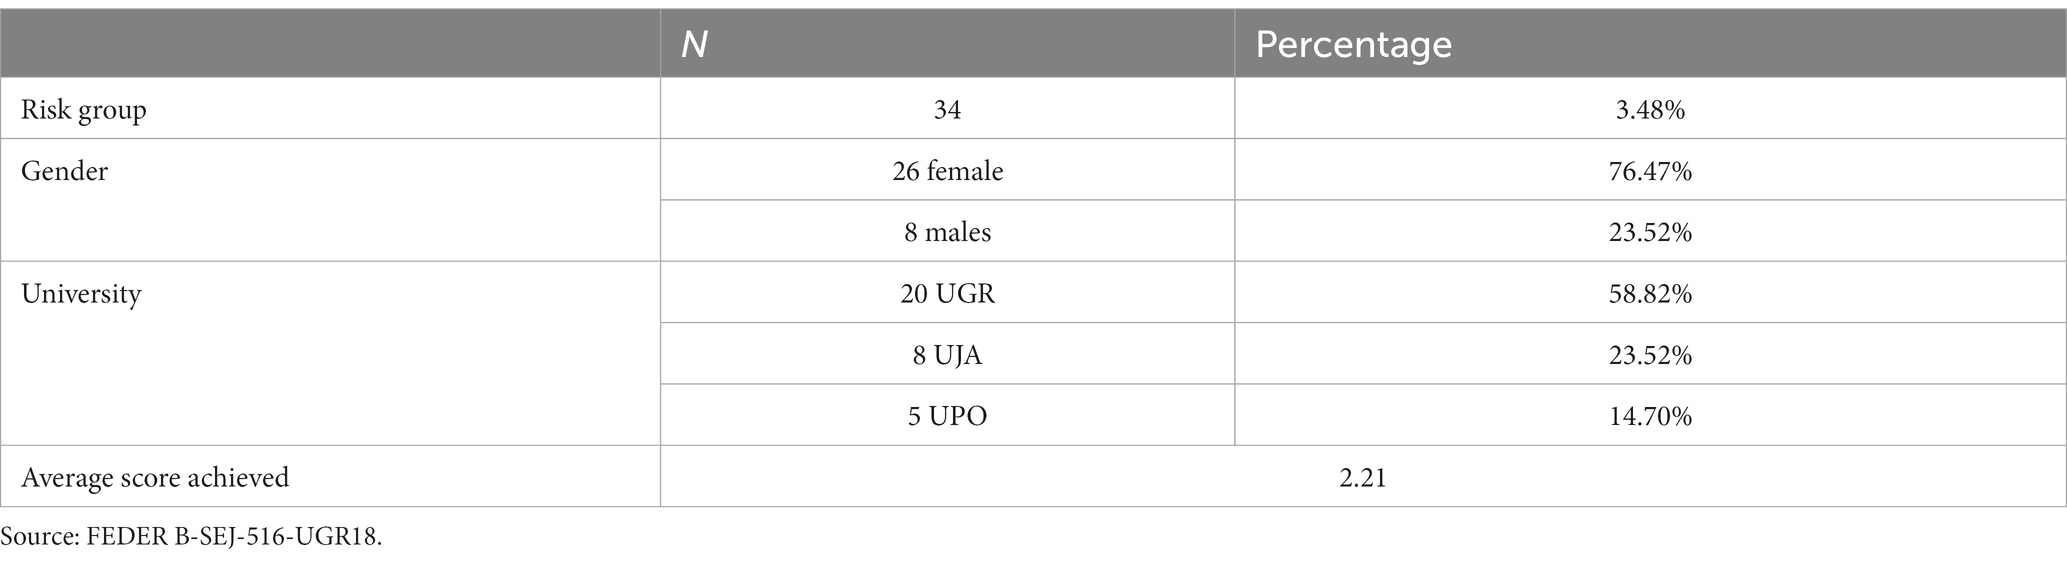
Table 10. Characteristics of the risk group.
Table 11 shows a comparison between the characteristics of the total sample and the characteristics of the risk group, on which we can make the following comments:
1. As already mentioned the overall mean of the risk group drops to 2.21 from the 3.48 points it reaches in the total sample.
2. In the risk group women are overrepresented by 3.12%,
3. Men, on the other hand, are underrepresented by 1.5%.
4. The students of the University of Granada are underrepresented in the risk group by 6.95%.
5. Students from the University of Jaén are also underrepresented in the risk group by 3.11%. 5.
6. Students at the Pablo de Olavide University in Seville are overrepresented in the risk group by almost twice as much as the sample, from 7.47 to 14.70%, i.e., 7.23% more.
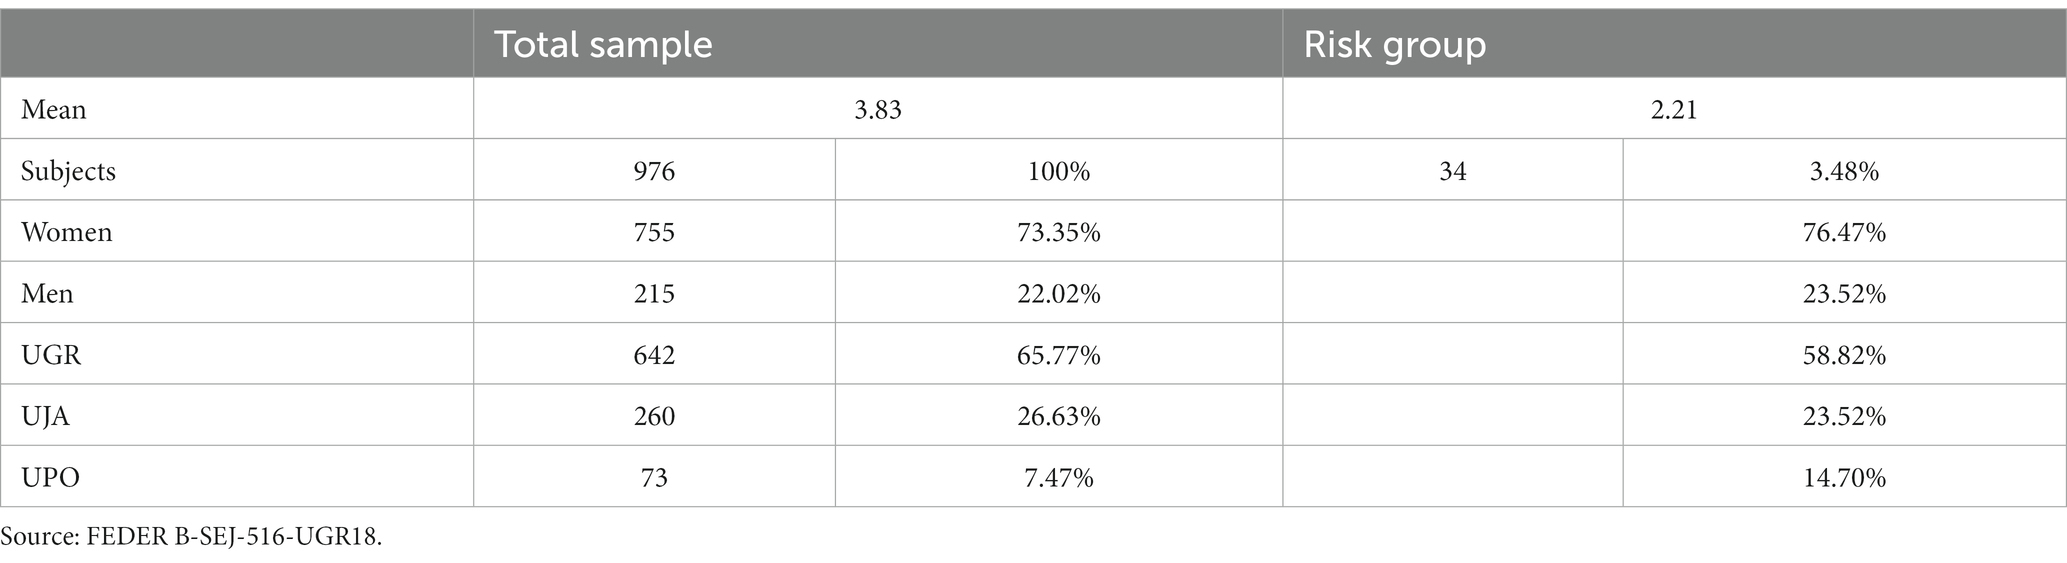
Table 11. Comparison between the characteristics of the at-risk group and the general sample.
That is, the at-risk group has an overrepresentation of female UPO students.
In Table 12 we present the items with the highest scores for at-risk students, i.e., the items that are persistence-oriented since they score above 3.00. These are 11 out of the total of 71 items that make up the survey. This means that, in 60 items, at-risk students score below the mean of 3.00. Interestingly, the items with the highest scores for the at-risk group belong to dimensions A.-Motivation and B.-Commitment.

Table 12. Items with the highest scores for the at-risk group.
Table 13 shows the items with the lowest scores for at-risk students, and which should guide the corrective measures to be proposed. There are 28 items corresponding to all dimensions except the first one: motivation.
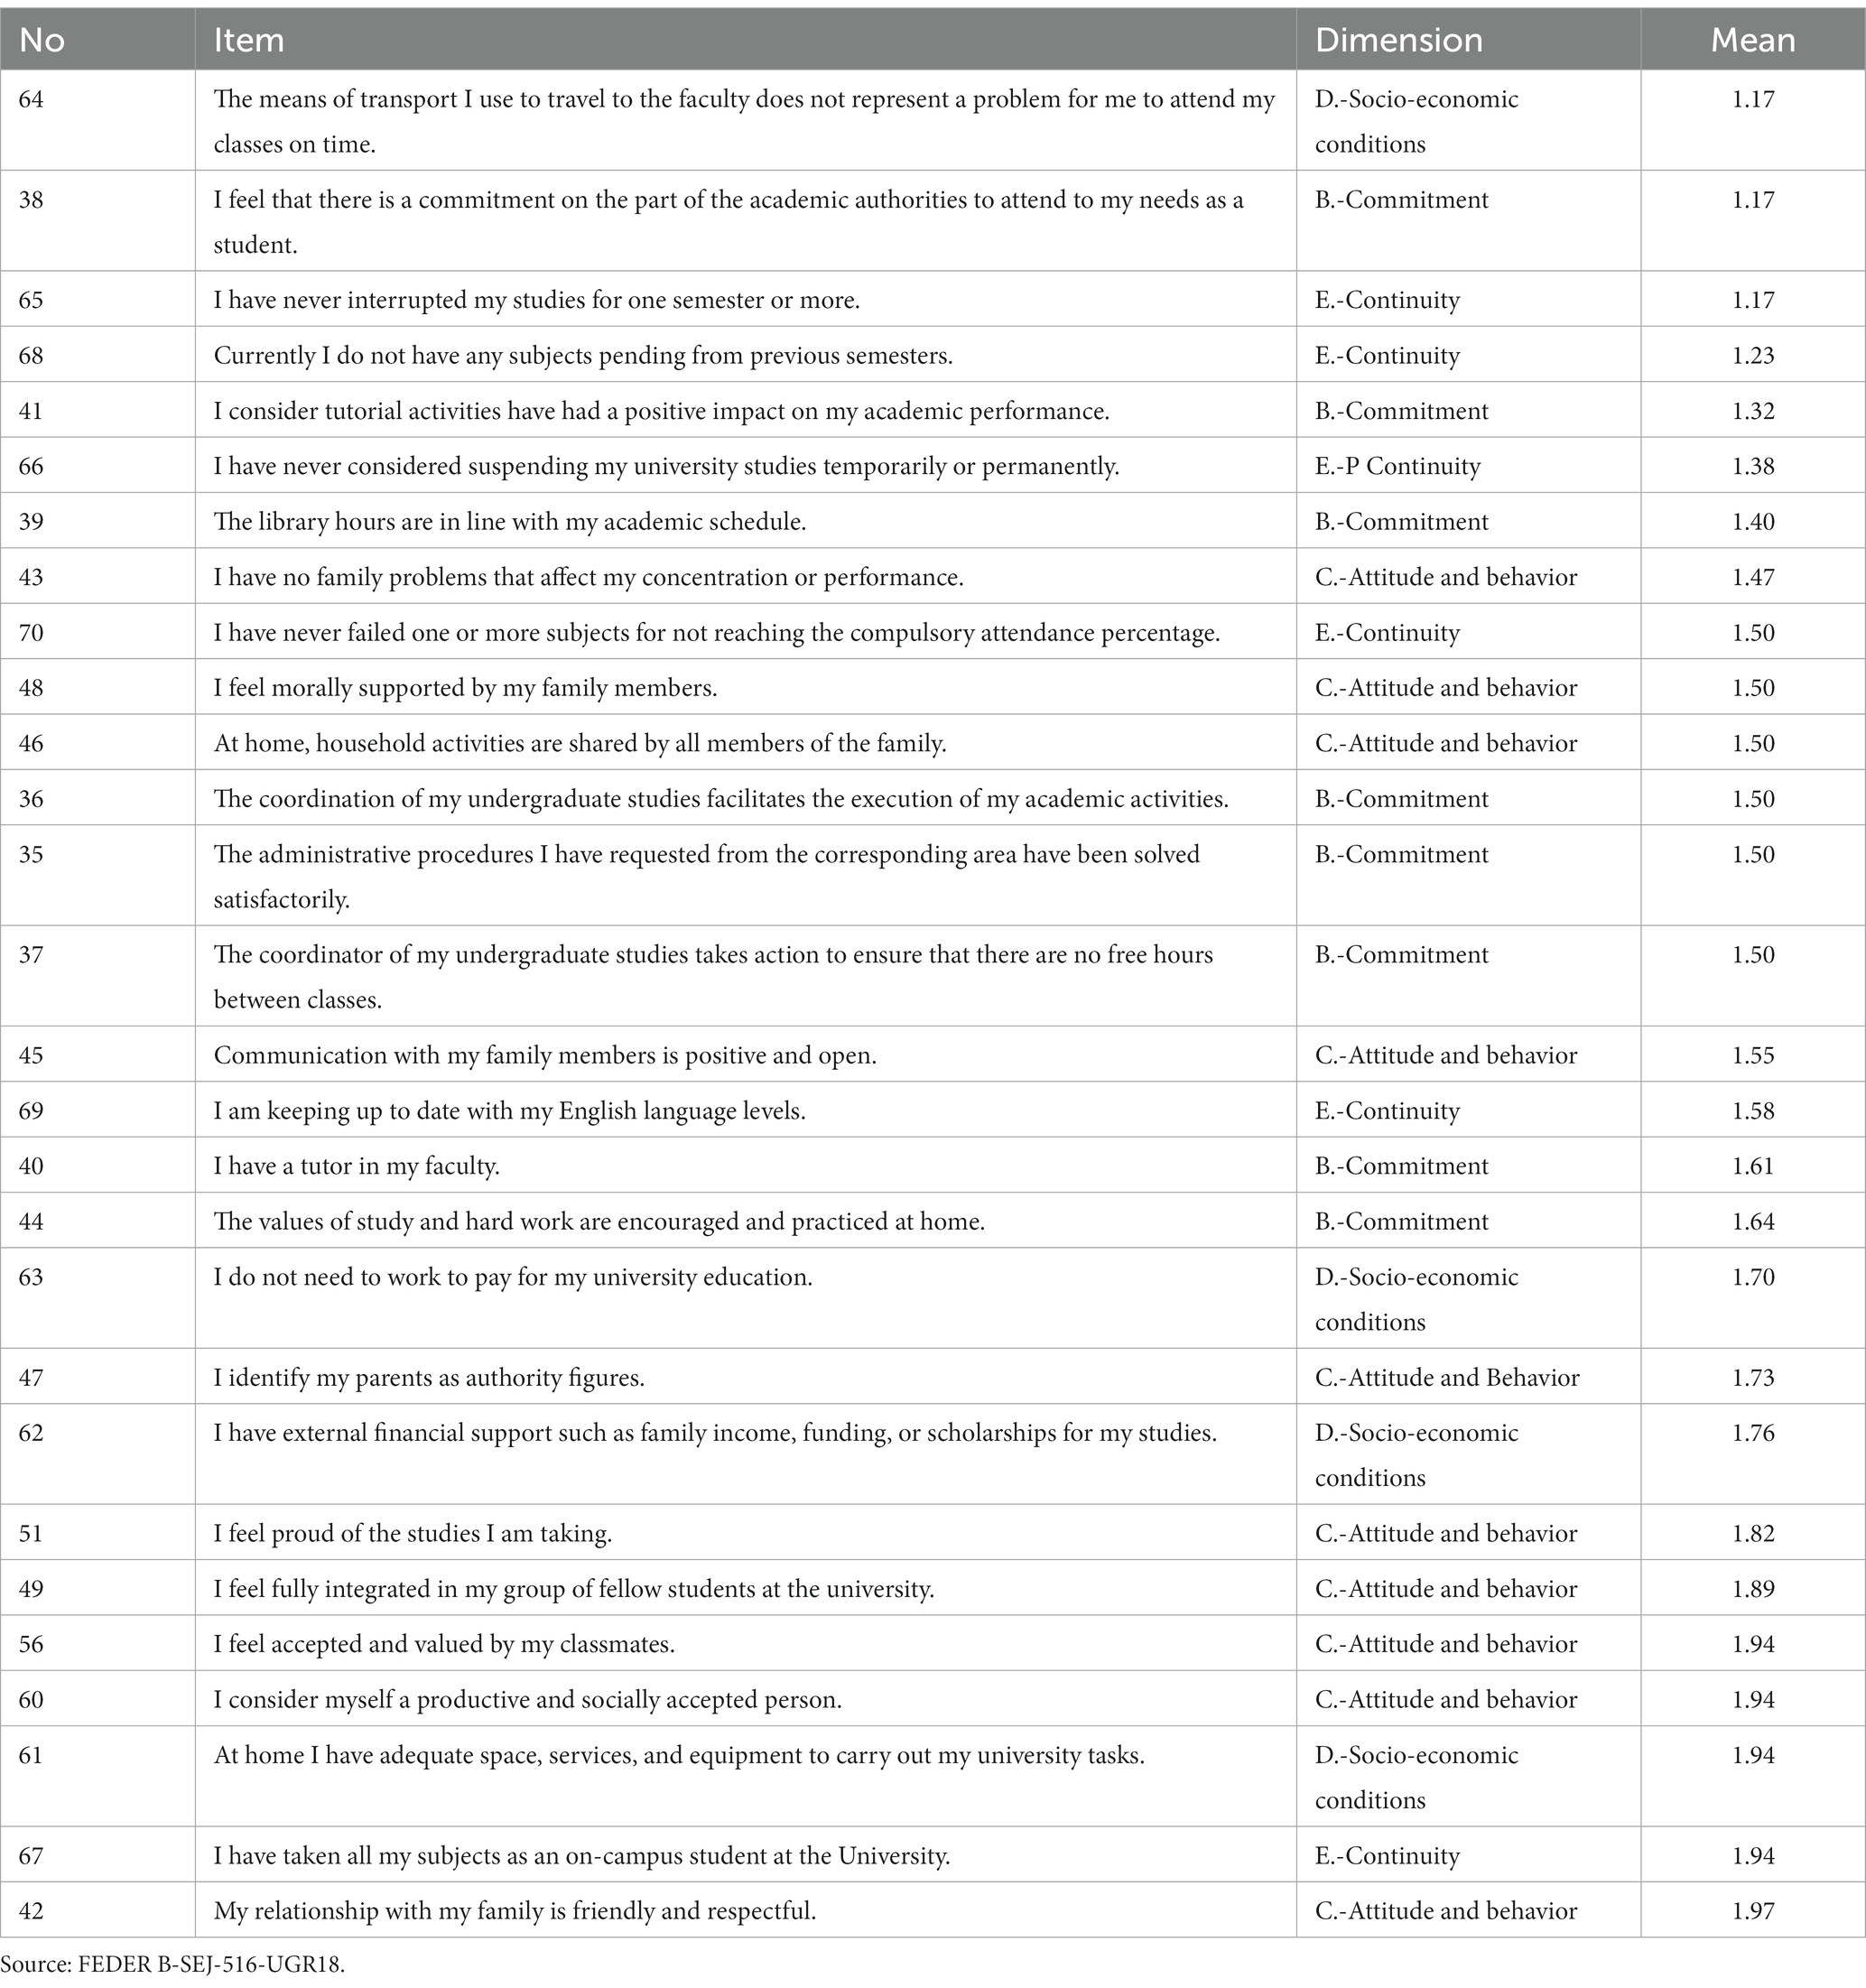
Table 13. Worst-scoring items by students at risk: below 2.00 (1.02–1.97).
Our diagnosis of dropout risk focused on dimensions that have been frequently analyzed in the literature. Motivation to study, both external (for rewards) and internal (student autonomy) has been studied by Barroso et al. (2022) and by Aina et al. (2022) in their cost–benefit analysis of the effort made in the study. In our study we have found that motivation maintains a close relationship with permanence. The Commitment dimension already appears in the model of Spady (1970), Tinto (1975), Pascarella (1980), Cabrera et al. (1993), and Kehm et al. (2019). In all of them it is related to permanence in the same line as evidenced by our results. Positively correlated with permanence, although to a lesser degree, is our dimension Socioeconomic conditions. This same dimension has been addressed in the studies of Heublein et al. (2003), Kehm et al. (2019), and Barroso et al. (2022) as a predictor variable of academic dropout. Our Attitude and Behavior dimension refers to the individual psychological coping variables of the study that are included in most of the models analyzed, such as Astin (1975) or Cabrera et al. (1993).
Same as what has happened to us, Velázquez and González (2017) found that there are significant correlations between the five dimensions that make up the instrument. In their case, the strongest correlation is established between E/A (Continuity and Motivation) followed by the pairs: E/B (Continuity and Commitment); E/D (Continuity and Socioeconomic Conditions) and E/C (Permanence and Attitude and Behavior). The latter with a very low correlation. They preferentially study the pairs integrated with the E/Continuity dimension.
In our case, we have studied all the pairs and have observed that A/B (Motivation and Commitment) and A/C (Motivation and Attitude and behavior) are the most strongly related pairs.
In any case, we agree with Velázquez and González (2017) that the strongest correlation is between the A/B (Motivation and Commitment) dimensions. In their Mexican application, dimensions A.-Motivation and D.-Socioeconomic conditions are strongly correlated and, in our case, the correlation is very low.
With their research, Velázquez and González (2017) wanted to identify risk factors around those items that obtained a lower standardized weight and that are grouped in the categories: internal motivation, personal commitment to study and socioeconomic conditions. This does not coincide with studies such as Pintrich (2004) and Solberg Nes et al. (2009) that point to the important effect of motivation and self-reported learning as retention factors in studies. Indeed, in our total sample, internal motivation scores very low. But there are no significant differences between the total sample and the at-risk group. Moreover, our results coincide with the findings of international and classical studies reported by Tinto (2022).
We have established criteria for diagnosing students at risk of dropping out. We choose a high sensitivity at the expense of a strong specificity. That is, in a first analysis we have opted for the risk group to include those students with a strong prediction of dropping out (high sensitivity), leaving out those students that had a moderate prediction but who will eventually drop out. The latter have not been included in our risk group (low specificity). The advantage of this decision, which has led us to set the cut-off point at 3.00, is that it does not alarm the authorities and allows us to test corrective measures with those most in need knowing that they can later be extended to larger groups.
With adequate follow-up of the surveyed students and with future annual applications of the screening, we will be able to adjust the diagnostic criteria to a reasonable and efficient balance between sensitivity and specificity values in line with the work of Ávalos Ruiz and Fernández Cruz (2022), varying, if necessary, the cut-off point. With our decision, the risk group has a size of 3.48% when the contrasted data offer real dropout data of 13% in Spain (Ministry of Universities of the Government of Spain, 2022). The high sensitivity is far from the real size, so it is our intention to increase the specificity with periodic screening applications.
As pointed out by Aina et al. (2022) and as we have reviewed in our study, university dropout is the result of a sequential process carried out under gradually decreasing levels of uncertainty and students’ awareness of the costs of education and future returns, as well as the level of integration of that student into their academic system.
In short, university dropout is a multivariate phenomenon in which the final decision is mediated by different determinants. The application of screening has made it possible to establish a baseline on the risk factors for dropout in Higher Education in Andalusian universities. Both Ambiel (2015) and Ortigosa et al. (2019) are examples of good practice in establishing dropout risk groups by assessing predictive dimensions such as those we have donated. Ortigosa et al.’s (2019) own work, as previously done by Lin and Tang (2015), uses data mining and learning analytics along with assessment scales to perform the diagnosis. We have limited ourselves to the application of screening. We left the use of data mining for later. We have established the response profile of the student body by gender, degree studies and university of origin. We have established which are the items best rated by the students, which become protective factors, which are the items worst rated by the students and which become risk factors. In addition, we have established the level of correlation between the dimensions that make up the instrument. This constitutes the baseline of the risk of academic failure and dropout in Andalusia.
This is the line followed by those scholars who call for joining academic and scientific efforts to offer predictive strategies and solutions (Gairín et al., 2015). Preventive measures should consider preventing dropout, for example, increasing institutional resources and/or creating interventions to improve academic and social integration, motivation, study skills and study effort.
At the same time, the preventive or corrective measures to be applied in the at-risk population will focus on reversing the orientation of those same factors that, as we have already seen, generate persistence. The descriptive analyses that have been carried out on dropout prevention models reveal that the situation can be alleviated. Different programs and extraordinary measures of attention are being experimented in Higher Education Institutions around the world. These are intended to increase the persistence of students in their studies and minimize the negative effects for the institutions and for the public administrations themselves. To this end, the unproductive expenditure that would be generated by potential dropouts must be transformed into investment that generates productive returns and economic growth, i.e., that applies productive expenditure for graduate students (Tinto, 2022). In short, it is a matter of adjusting university educational policies and their curricular and organizational practices and including palliative, remedial and preventive actions to alleviate the situation (Olmos, 2021).
The raw data supporting the conclusions of this article will be made available by the authors, without undue reservation.
The studies involving humans were approved by Comité de Ética en Investigación Humana de la Universidad de Granada. The studies were conducted in accordance with the local legislation and institutional requirements. The participants provided their written informed consent to participate in this study.
MFC: Investigation, Supervision, Validation, Writing – review & editing. DÁ: Data curation, Formal analysis, Software, Writing – original draft. FBF: Data curation, Software, Validation, Writing – original draft. EG: Methodology, Resources, Writing – original draft.
The author(s) declare financial support was received for the research, authorship, and/or publication of this article. This article comes from the research with reference B-SEJ-516-UGR18 approved in the call for projects I + D + i FEDER Andalucía 2014-20.
The authors declare that the research was conducted in the absence of any commercial or financial relationships that could be construed as a potential conflict of interest.
The reviewer SL declared a shared affiliation with the authors to the handling editor at time of review.
All claims expressed in this article are solely those of the authors and do not necessarily represent those of their affiliated organizations, or those of the publisher, the editors and the reviewers. Any product that may be evaluated in this article, or claim that may be made by its manufacturer, is not guaranteed or endorsed by the publisher.
Aina, C., Baici, E., Casalone, G., and Pastore, F. (2022). The determinants of university dropout: a review of the socio-economic literature. Soc. Econ. Plan. Sci. 79:101102. doi: 10.1016/j.seps.2021.101102
Aljohani, O. (2016). A comprehensive review of the major studies and theoretical models of student retention in higher education. High. Educ. Stud. 6, 1–18. doi: 10.5539/hes.v6n2p1
Álvarez, D., Arias, M., González, E., and Fernández Cruz, M. (2022). Neurodidactics factos in the prediction of academic dropout in Andalusian university students: preventive actions based on ICT. Texto Livre 15, 1–12. doi: 10.35669/1983-3652.2022.40502
Ambiel, R. A. M. (2015). Construção da escala de motivos para evasão do ensino superior. Avaliação Psicológica 14, 41–52. doi: 10.15689/ap.2015.1401.05
Argentin, G., and Triventi, M. (2011). Social inequality in higher education and labour market in a period of institutional reforms: Italy 1992–2007. High. Educ. 61, 309–323. doi: 10.1007/s10734-010-9379-6
Ávalos Ruiz, I., and Fernández Cruz, M. (2022). Validación de un instrumento de cribado para la detección de alumnado en riesgo de exclusión social. Educar 58, 481–499. doi: 10.5565/rev/educar.1519
Bakker, E. J., Kox, J. H., Boot, C. R., Francke, A. L., van der Beek, A. J., and Roelofs, P. D. (2020). Improving mental health of student and novice nurses to prevent dropout: a systematic review. J. Adv. Nurs. 76, 2494–2509. doi: 10.1111/jan.14453
Barroso, P. C. F., Oliveira, Í. M., Noronha-Sousa, D., Noronha, A., Mateus, C. C., Vázquez-Justo, E., et al. (2022). Dropout factors in higher education: a literature review. Psicologia Escolar e Educacional 26:e228736. doi: 10.1590/2175-35392022228736t
Bean, J. P. (1980). Dropouts and turnover: the synthesis and test of a causal model of student attrition. Res. High. Educ. 12, 155–187. doi: 10.1007/BF00976194
Bean, J., and Metzner, B. (1985). A conceptual model of non-traditional undergraduate student attrition. Rev. Educ. Res. 55, 485–540. doi: 10.3102/00346543055004485
Boyraz, G., Horne, S. G., Owens, A. C., and Armstrong, A. P. (2013). Academic achievement and college persistence of African American students with trauma exposure. J. Couns. Psychol. 60, 582–592. doi: 10.1037/a0033672
Cabrera, A., Nora, A., and Castaneda, M. (1993). College persistence: structural equations modeling test of an integrated model of student retention. J. High. Educ. 64, 123–139. doi: 10.2307/2960026
Casanova, J. R., Assis, C. M., Bernardo, A. B., Núñez, J. C., and Almeida, L. S. (2021). Dimensionality and reliability of a screening instrument for students at-risk of dropping out from higher education. Stud. Educ. Eval. 68:100957. doi: 10.1016/j.stueduc.2020.100957
Colás Bravo, P. (2015). Strategies of action: improving employability. Revista Fuentes 16, 9–14. doi: 10.12795/revistafuentes.2015.i16
de Oliveira, C. F., Sobral, S. R., Ferreira, M. J., and Moreira, F. (2021). How does learning analytics contribute to prevent students’ dropout in higher education: a systematic literature review. Big Data Cogn. Comput. 5:64. doi: 10.3390/bdcc5040064
Eurostat (2020). Tertiary education statistics. Available at: https://ec.europa.eu/eurostat/statistics-explained/index.php?title=Tertiary_education_statistics
Gairín, J., Rodríguez, D., Navarro, M., Muñoz, J. L., and Feixas, M. (2015). Hacia la comprensión del abandono universitario en Catalunya: el caso de la Universitat Autónoma de Barcelona. Estudios Sobre Educación 28, 117–138. doi: 10.15581/004.28.117-138
Heublein, U., Spangenberg, H., and Sommer, D. (2003). Ursachen des Studienabbruchs: Analyse 2002 Hannover: HIS.
Kehm, B. M., Larsen, M. R., and Sommersel, H. B. (2019). Student dropout from universities in Europe: a review of empirical literature. Hungarian Educ. Res. J. 9, 147–164. doi: 10.1556/063.9.2019.1.18
Lin, Y. P., and Tang, K. T. (2015). An inductive power and data telemetry subsystem with fast transient low dropout regulator for biomedical implants. IEEE Trans. Biomed. Circ. Syst. 10, 435–444. doi: 10.1109/TBCAS.2015.2447526
López-Cózar, C., Benito, S., and Priede, T. (2020). Un análisis exploratorio de los factores que inciden en el abandono universitario en titulaciones de ingeniería. Rev. Docencia Universitaria 18, 81–96. doi: 10.4995/redu.2020.13294
Martínez-López, Z., Gázquez-Linares, J. J., Sainz-de-Abajo, B., and Cejudo-Macías, R. (2023). Predictive models for identifying at-risk students in higher education using data mining techniques. Appl. Sci. 13:1336. doi: 10.3390/app13031336
Ministry of Universities of the Government of Spain (2022). Estudio sobre el Abandono de los Estudios de Grado en el Sistema Universitario Español.
Moreno-Candil, D., Garzón-Umerenkova, A., and Vera-Baceta, M. A. (2022). Early warning and monitoring systems to reduce dropouts at universities: tools for educational guidance. MDPI Proc. 88:9. doi: 10.3390/proceedings2022088009
Moreno-Guerrero, A. J., López-Belmonte, J., and Hinojo-Lucena, M. Á. (2022). Dropout prevention in higher education through socio-emotional mentoring. Int. J. Environ. Res. Public Health 19:10285. doi: 10.3390/ijerph191610285
Olmos, E. (2021). Análisis de los factores relacionados con la deserción escolar en el Instituto Tecnológico de Tlalpan. TecNM, 2015–2019. Universidad Autónoma de Morelos (Mex), Magister Disertation.
Ortigosa, A., Carro, R. M., Bravo-Agapito, J., Lizcano, D., Alcolea, J. J., and Blanco, O. (2019). From lab to production: lessons learnt and real-life challenges of an early student-dropout prevention system. IEEE Trans. Learn. Technol. 12, 264–277. doi: 10.1109/TLT.2019.2911608
Pascarella, E. T. (1980). Student-faculty informal contact and college outcomes. Rev. Educ. Res. 50, 545–595. doi: 10.3102/00346543050004545
Pintrich, P. (2004). A conceptual framework for assessing motivation and self-regulated learning in college students. Educ. Psychol. Rev. 16, 385–407. doi: 10.1007/s10648-004-0006-x
Rumberger, R. W. (2020). The economics of high school dropouts. Econ. Educ. (2ª Ed), (Academic Press), 149–158.
Samuel, R., and Burger, K. (2020). Negative life events, self-efficacy, and social support: risk and protective factors for school dropout intentions and dropout. J. Educ. Psychol. 112, 973–986. doi: 10.1037/edu0000406
Solberg Nes, L., Evans, D. R., and Segerstrom, S. C. (2009). Optimism and college retention: mediation by motivation, performance, and adjustment. J. Appl. Soc. Psychol. 39, 1887–1912. doi: 10.1111/j.1559-1816.2009.00508.x
Spady, W. (1970). Dropouts from higher education: an interdisciplinary review and synthesis. Interchange 1, 64–85. doi: 10.1007/BF02214313
Tinto, V. (1975). Dropout from higher education: a theoretical synthesis of recent research. Rev. Educ. Res. 45, 89–125. doi: 10.3102/00346543045001089
Tinto, V. (2022). “Exploring the character of student persistence in higher education: the impact of perception, motivation, and engagement” in Handbook of research on student engagement. eds. A. L. Reschly and S. L. Christenson (Cham: Springer), 357–379.
Keywords: higher education, dropout, prediction, risk group, prevention
Citation: Fernández Cruz M, Álvarez Ferrándiz D, Fernández García-Valdecasas FB and González Castellón E (2024) Dropout in Andalusian universities: prediction and prevention. Front. Educ. 8:1304016. doi: 10.3389/feduc.2023.1304016
Edited by:
Ana B. Bernardo, University of Oviedo, SpainReviewed by:
Slava Lopez, University of Granada, SpainCopyright © 2024 Fernández Cruz, Álvarez Ferrándiz, Fernández García-Valdecasas and González Castellón. This is an open-access article distributed under the terms of the Creative Commons Attribution License (CC BY). The use, distribution or reproduction in other forums is permitted, provided the original author(s) and the copyright owner(s) are credited and that the original publication in this journal is cited, in accordance with accepted academic practice. No use, distribution or reproduction is permitted which does not comply with these terms.
*Correspondence: Manuel Fernández Cruz, bWFudWVsZmVybmFuZGV6Y3J1ekB1Z3IuZXM=
Disclaimer: All claims expressed in this article are solely those of the authors and do not necessarily represent those of their affiliated organizations, or those of the publisher, the editors and the reviewers. Any product that may be evaluated in this article or claim that may be made by its manufacturer is not guaranteed or endorsed by the publisher.
Research integrity at Frontiers
Learn more about the work of our research integrity team to safeguard the quality of each article we publish.