 Camilla Spagnolo
 Bianca Nicchiotti
94% of researchers rate our articles as excellent or good
Learn more about the work of our research integrity team to safeguard the quality of each article we publish.
Find out more
CONCEPTUAL ANALYSIS article
Front. Educ., 21 December 2023
Sec. Assessment, Testing and Applied Measurement
Volume 8 - 2023 | https://doi.org/10.3389/feduc.2023.1303041
Gender gap in STEM disciplines is a phenomenon that has been extensively studied and described. In this paper we focus on the gender gap in mathematics and firstly we illustrate the international and national situation that emerges from the reports of large-scale assessment. The core of our work then is the definition and explanation of the gender gap index
From national and international surveys, a significant gap emerges between boys’ and girls’ results in mathematics: boys outperform girls in many countries and at all school levels (Giberti, 2019). In the international framework, Italy shows one of the largest gender gaps in mathematics (OECD, 2019), suggesting the need to deeply investigate the reasons of this disparity and its consequences in didactic practice.
The international organizations studying gender issues in mathematics through large-scale assessment are OECD and IEA.1 PISA (Program for International Student Assessment offered by OECD, the Organization for Economic Co-operation and Development) measures the ability of 15-year-olds in reading, mathematics and science in several countries across the world. The official report (OECD, 2019) summarizes the results of the last edition, taking place in 2018 and involving 79 countries. Regarding gender gap it states that, in mathematics, boys outperformed girls by only five score points on average across OECD countries. In fact, boys significantly outperformed girls in mathematics in 32 countries and economies, while 14 countries presented the opposite pattern. In particular, PISA results demonstrate that the Italian gender gap is one of the widest in favour of male students.
The other international organization studying how mathematics performance of young students differs by gender is TIMSS (Trends in International Mathematics and Science Study), which is a project of IEA (International Association for Evaluation of Educational Achievement) and assesses students’ achievements in mathematics and science at grade four and eight. The official report of the last assessment, performed in 2019 and involving more than 60 countries, draws a comforting picture of the international situation. It affirms that in TIMSS 2019 there was considerable gender equity in average achievement. In 7 countries girls had higher average achievement than boys, in 26 countries there was gender equity in average mathematics achievement, and lastly in 6 countries boys had higher average achievement than girls (Mullis et al., 2020). It confirms that there was significant gender equity in terms of average achievement in TIMSS 2019. Nevertheless, Italy is one of the six countries in which gender gap is statistically significant and unbalanced in favour of boys. Italy is, in fact, the second country with the largest gender gap.
Overall, the international surveys show that gender gap is a heterogeneous phenomenon. In fact, only a few of the countries involved in the study show a statistically relevant gap in favour of males, while in the other countries the gap is in favour of females or is not statistically relevant. Moreover, the disparity does not appear to be related to the general score achieved in the test, as among the countries showing the largest gender gaps in favour of males there are countries scoring above average but also countries scoring below average (Giberti, 2019). International reports, furthermore, underline that in most countries gender gap has been stable from 2009 to 2018 (year of the last report of PISA assessment) or it has been reducing (Giberti, 2019; OECD, 2019). As concerns Italy, considering the trend of the average scores of male and female Italian students at grade 8 from 1999 to 2018, even if the total average score of Italian students has improved, the gender difference has remained relatively stable and significant despite some fluctuations (Giberti, 2019; Mullis et al., 2020; Ferretti and Giberti, 2021).
The presence of a gender gap in favour of males is confirmed also from the results of national large-scale assessment administered yearly by INVALSI (Istituto Nazionale per la Valutazione del Sistema Educativo di Istruzione e di Formazione) to the students of selected grades (grade 2, 5, 8, 10, 13). The last annual technical reports of INVALSI (2019, 2022, 2023) highlighted that in Italy the gender gap in mathematics performance is statistically significant at every school grade and it widens from elementary to high school. In particular, observing the evolution of gender gap from Italian large-scale assessment data, it seems to be not extremely significative during the first years of school (grade 2), but growing specifically during primary school (from grade 2 to 5) and from the beginning of high school onwards (Contini et al., 2017). Moreover, gender gap seems to vary according to the students’ ability level, being accentuated for the top performer students (Contini et al., 2017; INVALSI, 2019, 2022). Research shows that the phenomenon is evident also among gifted students participating in mathematics competitions: girls and boys have similar percentages of correct answers, but the former tend to underestimate themselves, leading to a gender gap in favour of boys in the attendance of such competitions (Mazza and Gambini, 2023). Furthermore, at high school level, the measure of the disparity changes with the type of school. In fact, at grade 10, it results statistically significative2 in favour of males only in technical schools (Istituti Tecnici), while at grade 13 boys of every kind of school perform significatively better than girls in mathematics (INVALSI, 2019, 2022).
To have a full understanding of the phenomenon of gender gap, both for the Italian and international situation, it seems natural to explore the factors that can influence it, which have been extensively analysed over the past decades. A comprehensive review of these research-based explanations is contained in Kanny et al. (2014). The authors offer a list of possible determinants of the gender gap, which includes individual background characteristics (ethnicity, socio-economic status), family influence and expectations (gender-roles in the family, explicit and implicit expectations, provision of different types of tools and toys, parents’ beliefs about their children’s ability in mathematics), structural barriers (biological inclinations, school and classroom characteristics, curriculum and preparation), psychological factors, values and preferences (self-confidence, personality traits, sense of belonging in STEM) and lastly perception of the STEM field (academic and professional prospects, perception of a STEM workplace).
Some Italian studies have highlighted that gender gap is not caused by biological or cognitive differences between genders, but it might depend on a complex of cultural and metacognitive influences, biases, psychological and affective factors, such as low self-esteem and mathematics self-efficacy for girls (Bolondi et al., 2018; Ferretti et al., 2024). In addition, classroom practices, assessment and teaching methods play a role, in fact female students tend to prefer well known strategies and approaches they have already used, to solve a problem. Male students instead are more inclined to experiment and use original strategies, even though they might result in mistakes (Bolondi et al., 2017; Giberti, 2019). This aspect leads to the possibility that the greater influence of the didactic contract on girls is one of the causes of gender gap in mathematics (Bolondi et al., 2018). Finally, even the question format appears to be a cause of gender gap in a test. Namely, boys perform significatively better on multiple-choice questions compared to closed- or open-ended questions, hence the proportion of the different types of questions might be a factor to be considered (INVALSI, 2019; Griselda, 2022).
Therefore, gender gap is undoubtedly a complex and articulate issue, the causes and consequences of which have been described during the last decades and are still debated today (Girelli, 2022).
Having briefly explained the matter of gender gap and its causes, we are going to focus on the analysis of standardized tests, that has been already used to describe in depth the Italian situation, see Giberti (2019), Giofrè et al. (2020), Spagnolo et al. (2021, 2022, 2024), Casalvieri et al. (2023), and Giberti et al. (2023). In order to better understand and evaluate such a complex issue, especially in Italy, we felt the need of a more refined theoretical tool, which could highlight even the shades of the gender gap related to large-scale assessment tasks. Hence, the purpose of this paper is to provide such a tool, based on already existing ones, to categorize the results of mathematical test items in terms of the resulting gender gap. The research questions under investigation are thus:
RQ1: Is it possible to define a new index that characterizes each item in terms of its gender gap and that provides symmetry, clarity and comparability of items?
RQ2: How does such an index work?
For this study, we used as a theoretical framework the indexes that, up to this moment, have been defined and used in mathematical education research to investigate issues related to gender gap emerging from the results of large-scale assessment. They are, thereby, the main reference for the description of our index. Classical Test Theory (CTT) and Item Response Theory (IRT) have been used only as a general framework, as we did not focus on the statistical or mathematical models or on measurement theories, but on the analysis from a mathematical education standpoint.
In fact, previous studies in mathematical education show that in similar analysis, the results obtained using Rasch model and Classical Test Theory measures are coherent and consistent (Bolondi et al., 2020; Cascella et al., 2023). In general, Jabrayilov et al. (2016) underline that even though IRT is better than CTT to analyse some kind of tests, such as the ones containing more than 20 items, “the differences between the two methods are small.” (p. 568). Moreover, studies comparing the two psychometric approaches found that in particular the item difficulty index from CTT are usually closely comparable with the ones from the IRT models, especially Rasch model (Fan, 1998). Finally, the item difficulty index from CTT seems to be also invariant across samples, like male and female groups, the ones we are interested in. Furthermore, its degree of invariance is comparable to, and sometimes better than, that of IRT item difficulty parameter estimates (Fan, 1998).
In general, standardized tests are composed of items, each of which we are going to identify with the index . Every item is described in terms of the following variables:
• Total number of answers.
• Number of correct answers.
• Total number of answers given by male students.
• Number of correct answers given by male students.
• Total number of answers given by female students.
• Number of correct answers given by female students.
Moreover, two additional parameters could be introduced: item difficulty and item gender difference. According to CTT, the difficulty of an item is defined as follows (Barbaranelli and Natali, 2011):
This parameter can take values in the range , where means that the item is extremely difficult while means that the item is extremely easy. Hence, the greater the value of , the easier the item.
We can define the item gender difference of an item as the difference between the fraction of correct answers provided by males and the fraction of correct answers provided by females, respectively defined as follows:
This parameter can take values in the interval [−1,1], where means that the item is balanced between males and females; when males completely outperform females; when females completely outperform males.
However, as suggested in Bolondi et al. (2017), the value of the item gender difference is not always significative if we want to compare the results of different items in terms of gender gap, as shown in the following example.
Let us consider a sample containing 100 male students and 100 female students. We want to compare the results of two items: Item 1 and Item 2, showing the following response pattern:
• Item 1 has and ;
• Item 2 has and .
Computing the item gender difference for the two items we obtain . We could think that the two items would produce gender gaps of the same size but, while in Item 1 the fractions of males and females who answer correctly are quite close ( and ), in Item 2 males double females ( and ).
The example suggests the need to consider the respective sizes of and . Hence, it is more meaningful to consider the ratio , which can assume the values: if the item is balanced, if males performed better, if females performed better. In some cases, the reciprocal ratio may be useful. It is defined in UNESCO Institute for Statistics (2009) as the gender parity index ( ), which indicates parity between males and females when it is equal to 1, disparity in favour of males when smaller than 1, and in favour of females when greater than 1. This is actually an index often used in international reports about education, see UNESCO (2020, 2023) and as a reference in various studies to define new indexes, see Chang (2018) and Marshall et al. (2020).
An extension of this index has been used in some studies in mathematical education research. In fact, in Guiso et al. (2008) and then in Fryer and Levitt (2010) the gender gap emerged from OECD PISA surveys is compared to the value of the World Economic Forum’s Gender Gap Index, which takes into account economic, political, educational and health conditions.
Another possible index is defined in Bolondi et al. (2017), which considers the proportion of correct answers and consequently the difficulty of the question:
The items characterized by a positive value of this index are those in which males outperform females, while the ones characterized by a negative value of the index are those in which females outperform males. This index has been often used in research in mathematical education (see Bolondi et al., 2017, 2018) because it considers the relative difficulty of the item, as we will explain in the following paragraphs.
In this section, we give the definition of a new gender gap index and we highlight the differences between this new index and the indexes used so far.
At international level, concerning large-scale assessment surveys and trends in average achievement by gender, OECD clusterizes students in M (male) and F (female), while IEA clusterizes students in Boys and Girls. Even at national level INVALSI pinpoints two main clusters, labeled as “Male” and “Female,” identified through the national Registry Office records. The difference in achievements between the two clusters is referred to as “gender gap.” Our study adopts the same perspective as OECD, IEA and INVALSI, analysing gender through these clusters. Specifically, ours is a second-level analysis, so the details of how the data were collected and clustered are mentioned in INVALSI Technical Reports (INVALSI, 2019; INVALSI, 2022; INVALSI, 2023).
The aforementioned considerations, discussed in sections 1, 2 and 3, lead to the definition of a new index that takes account of elements such as symmetry, clarity and comparability of items.
So, we can define the gender gap index of an item as follows:
This index is symmetrical around zero, value that represents the absence of gender gap in one item. In fact, when the item is balanced, when males students perform better, when female students perform better. To be more precise, GGIk assumes the same value in modulus, but with opposite sign, in the case where Mk and Fk switch their values. It maintains and clearly shows the proportions between gender gaps in different items. In addition to that, its value shows, in percentage, how many more males answered correctly compared to females, if the gender gap is in favour of the former. On the other hand, distinguishing the two cases in the definition, allows us to have a specular interpretation when the gender gap is in favour of females.
Moreover, the interpretation we have just explained permits to establish threshold values to distinguish gender gaps of different magnitude. Provided that different choices can be made depending on personal preferences, we have defined a reference set of values, summarized in Table 1, basing on the considerations on the size of gender differences in large-scale assessment results reported in Giberti (2019).
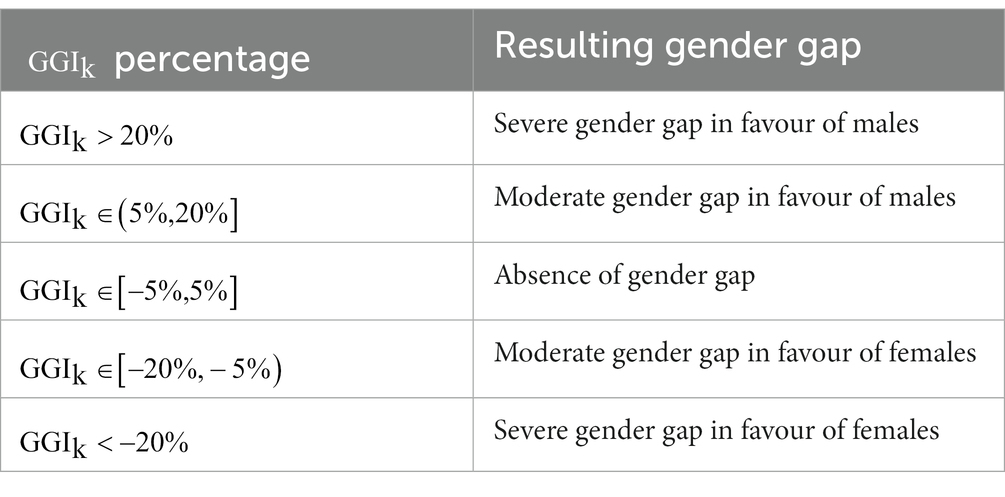
Table 1. Threshold values of .
We believe that a reasonable range of values of for balanced items might be between −5 and 5%. When is larger than 5% or smaller that −5%, we reckon that a gender gap is present. To differentiate a moderate gender gap from a severe one, we set the boundary on 20% and − 20%, meaning that if is larger than 20% or smaller than −20%, the gender gap must be considered severe; otherwise, it can be considered moderate.
The indexes presented in the theoretical framework are meaningful; however, they are affected by some issues that make the information communicated by them not always clear. We are now going to analyse each index and explain in detail the construction of the gender gap index defined in the previous paragraph.
Firstly, as shown and briefly explained in the example, the item gender difference does not allow to compare the results of different items, as it does not consider the respective sizes of and . Secondly, the ratio takes into consideration this last element, but its downside is the fact that this index is not symmetrical around 0. This aspect might make its interpretation not always immediate. The same arguments are valid for the reciprocal ratio, which represents the gender parity index . Lastly, the index is symmetrical around zero but the comparison between different items is not straightforward: we understand which item has a larger gender gap, but we do not know by what amount.
The natural consequence of all these considerations is the definition of the gender gap index , which preserves the strengths of the above-mentioned indexes but in the meantime overcomes the issues. First of all, we shift the ratio of the value −1, in order to fix at 0 the value of the index for balanced items. Therefore, we will have: if the item is balanced, if males performed better and if females performed better.
This adaptation is also useful because it offers an intuitive interpretation. In fact, let us consider a sample containing 100 male students and 100 female students. In a given question of a mathematics test, 70 males and 50 females answer correctly.
The value of the ratio shifted of −1 is
This value indicates exactly by which percentage the number of females answering correctly should be increased to reach the same level of males. In other words, increasing of 40% the 50 female students that have given the right answer, we are going to have 20 more females answering correctly, for a total of 70 females, the exact same number as males answering correctly.
Anyway, this interpretation fails if the proportions between males and females are inverted. Because of that, in case the gender gap is in favour of females, which means that , we can obtain the same meaning preserving the intuitive interpretation dividing by instead of , as we have done distinguishing the two cases in the definition of .
To summarize similarity and differences between different indexes we are going to provide an example. Let us consider four mathematics items characterized as in Table 2. It is worth noticing that swapping the roles of males and females in item 1 we get item 4 and the same happens in items 2 and 3. Namely, items 1 and 4 represent symmetrical situations exactly as items 2 and 3 do.
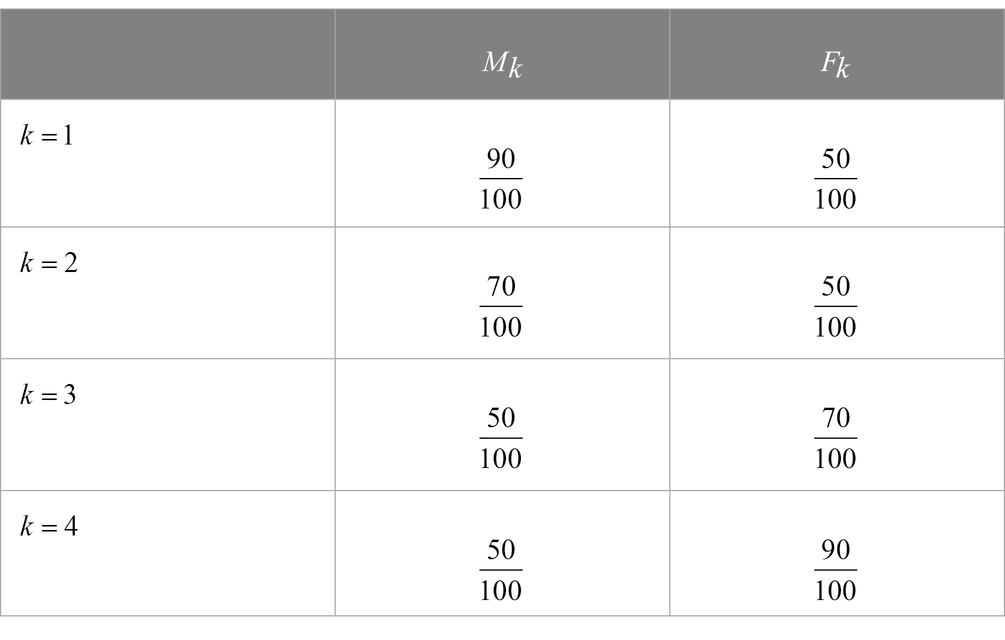
Table 2. Response pattern of four different mathematics items (item 1, item 2, item 3, item 4).
For each item, we would like to calculate the value of the ratio , the gender parity index (or the reciprocal ratio , the index and the gender gap index ; all the values are summarized in Table 3.
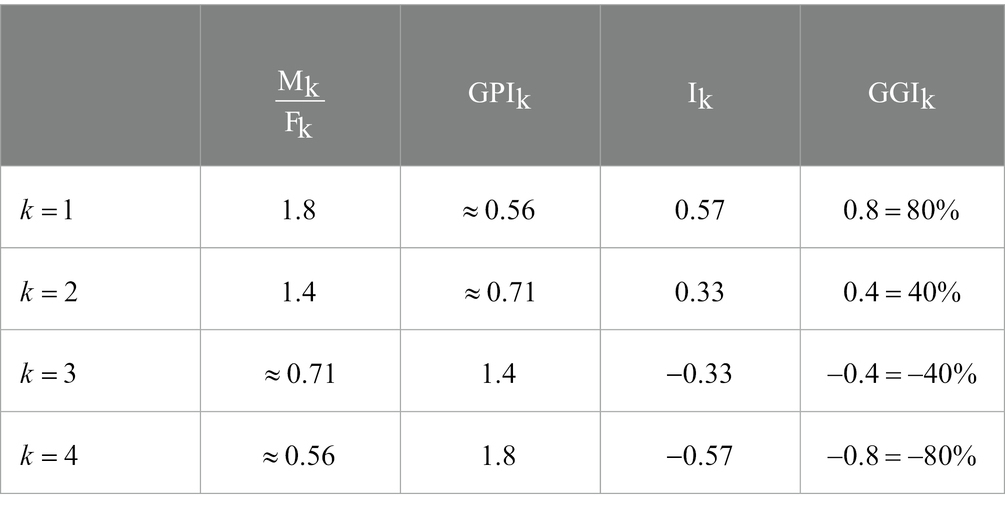
Table 3. Values of the four different indexes (, , , ) for each of the four items.
First of all, we observe that the symmetry between items 1 and 4 and items 2 and 3 that we described earlier does not appear evident using the ratio or the index . In fact, considering items 1 and 4, the values 1.8 and 0.56 have different distances from 1 and a similar situation happens for items 2 and 3. Both ratios lack symmetry around 1, value corresponding to an equal performance for boys and girls. On the contrary, the index is indeed symmetrical around 0 and its values clearly show the symmetry between items 1 and 4 and items 2 and 3. The only issue with this index is that the comparison between items is not immediate. For instance, while it is clear that item 1 is characterized by a larger gender gap than item 2, since 0.57 is greater than 0.33, we cannot determine by what amount, and this same issue emerges with the two previously analysed indexes.
The index instead overcomes both issues described: it is symmetrical around 0 and allows an immediate and intuitive comparison between different items. At a glance, the computed values show clearly that items 1 and 4 are symmetrical swapping males and females and the same happens for items 2 and 3. Moreover, the gender gap in item 1 is double the size of gender gap in item 2: showing the exact proportion between the gender gaps of the two items, the comparison between them is finally possible and easy to interpret.
In this paragraph, we are going to provide some examples of the possible use of the gender gap index for mathematics education. We will analyse some items and the relative data from INVALSI tests to highlight once again the differences between the indexes.
We have analysed four questionnaires, each of which containing approximately 50 items, for a total of 211 items. The questionnaires are INVALSI tests administered between 2011 and 2014 to Italian K-10 students. We have not considered the answers given by students that have not stated their gender in the INVALSI questionnaire; nevertheless, their number is so small (0.6%) that it does not have a significative influence on data and our analysis. The 211 total items we analysed, can be divided according to the set of values we established as summarized in Table 4. For context, the average difficulty is calculated for each category.
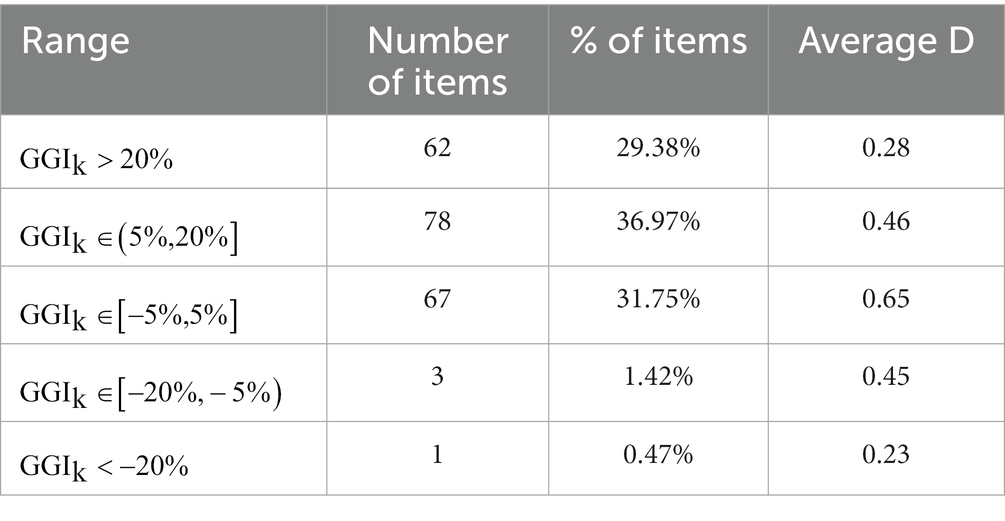
Table 4. Distribution of the 211 items, according to the set of values defined for the .
It is worth noticing that the great majority of the items is characterized by a positive value of the gender gap index. As a matter of fact, a large number of items has shown a severe gender gap in favour of male students. On the contrary, 67 items are balanced (31.75%) and only 4 present a gender gap in favour of females (less than 2% of the total). Observing the values of the average difficulty of the items of each category, we can see that the items in which gender gap is not present are in general easier than the others, whereas the items with severe gender gap are more difficult. These conclusions can be drawn also from Figure 1, which displays how the value of the gender gap index varies in relation to the difficulty parameter.
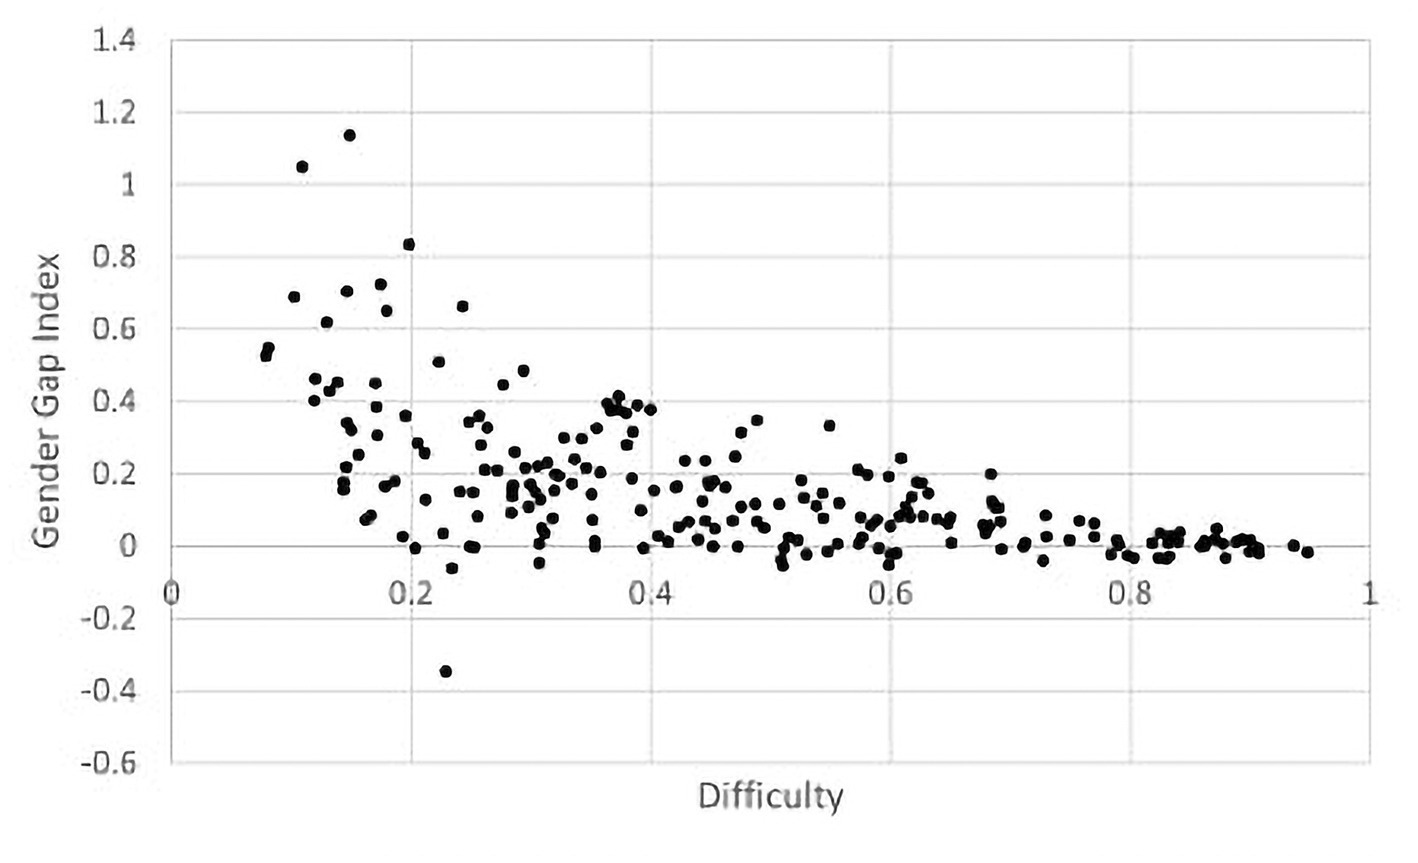
Figure 1. Plot of the points (Dk, GGIk).
It is also interesting to examine the distribution of students’ performance in each item, sorted by gender, in relation to the difficulty of the item. The plot in Figure 2 displays, for each item , the points in blue and in pink. The colors allow a clear visual distinction: male students perform better in most items. The aforementioned considerations are still valid since, for greater values of D (approximately greater than 0.75), pink and blue dots overlap, meaning that for very easy items the item gender difference is close to 0. On the contrary, for intermediate and difficult items, the item gender difference grows. Obviously, the difficulty of the items is only one of the factors that can be considered in the analysis related to gender gap. Nevertheless, we decided to focus on this one because the difficulty index is used also by INVALSI in its analysis and it provides a first descriptive information about the difficulty of an item.
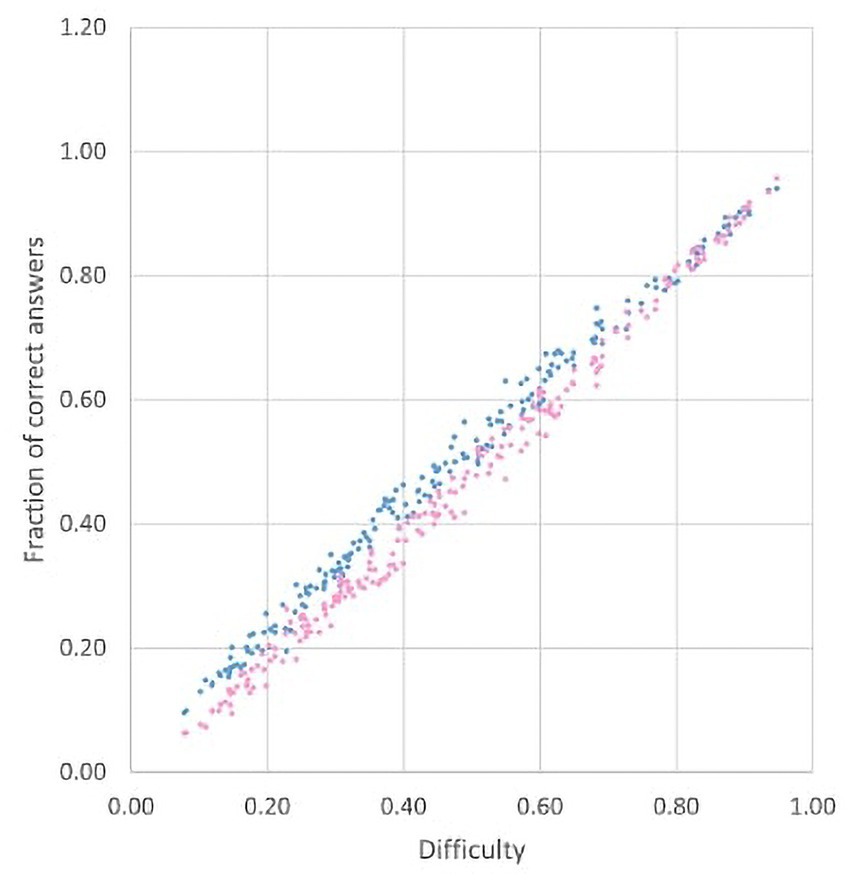
Figure 2. Plot of the points (Dk, Mk) in blue and (Dk, Fk) in pink.
For each of the 211 items, we calculated the values of all the four indexes described in the previous paragraphs. In the following paragraphs, we will discuss in detail only some of the items analysed. All of them are from the INVALSI test administered in 2014 to grade 10 Italian students (15-year-old students). For each item we reported the original formulation of the item in Italian, taken from the INVALSI online database,3 as well as an English translation provided by the authors.
The items have been selected because they highlight different and interesting use cases of the gender gap index. We described the analysis of an item of medium difficulty which shows a gender gap in favour of males, in which the values of the indexes and are close but not the same. Then we presented an item characterized by a gender gap in favour of males, in which the values of the indexes and are different. Finally, we have a difficult item but with a gender gap in favour of females. We believe that the use of the gender gap index might help identify items in large-scale assessment that are characterized by a significative gender gap, in order to focus further research on them specifically.
In Figure 3 you can see the item D1. The percentages of answers for each option can be found in Table 5; the correct answer is C, in bold in the table.
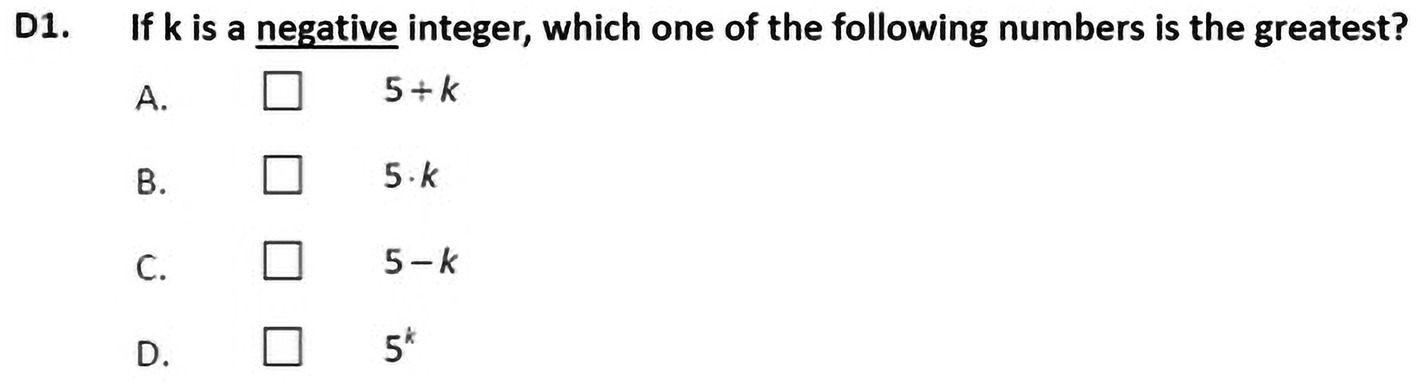
Figure 3. Question D1 of INVALSI test grade 10, year 2014. Translation by the authors. Source: https://www.gestinv.it.
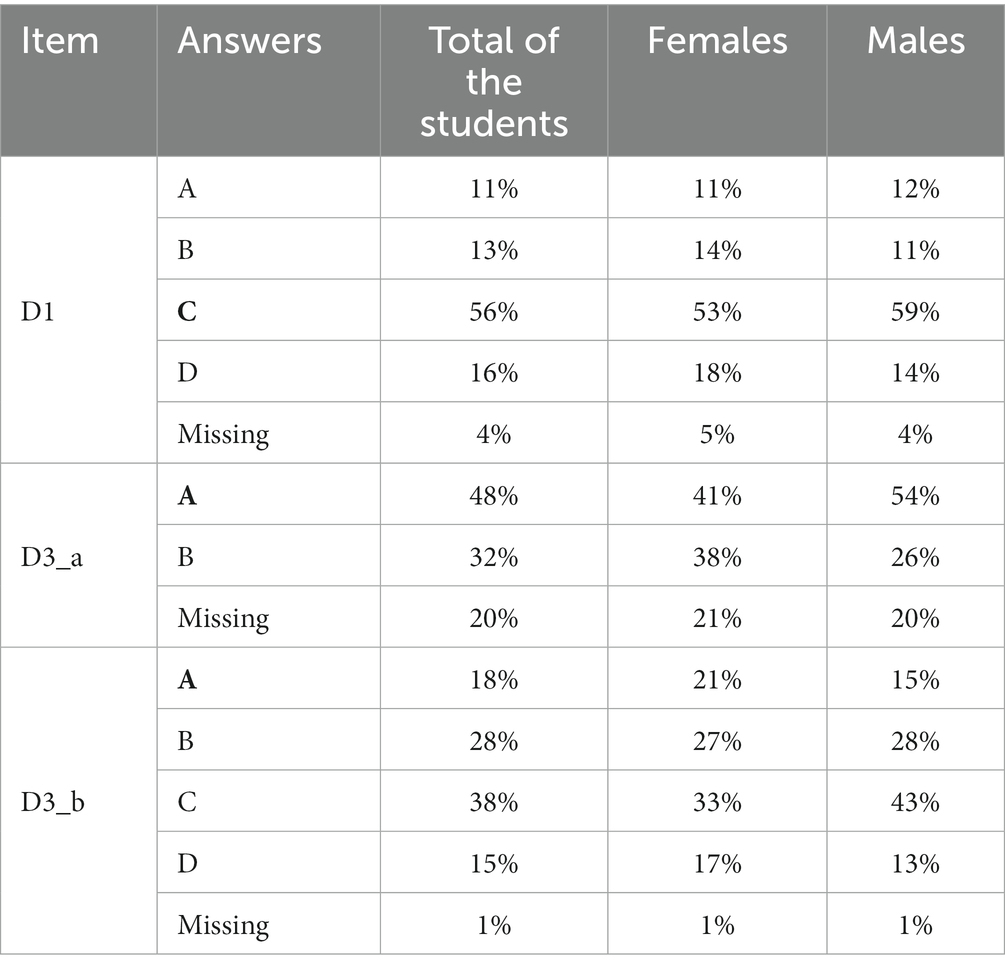
Table 5. Percentage of answers for each option for the items D1, D3_a, D3_b, sorted by gender.
As Table 6 shows, this is an example of the case in which both the indexes and the gender gap index have almost the same value. Referring to the previously established threshold values for the gender gap index, we can state that this item is affected by a moderate gender gap in favour of males. Even though the item can be considered of a medium difficulty, it clearly shows the presence of a gender gap. In accordance with the aforementioned considerations, the indexes and are not so self-explanatory.
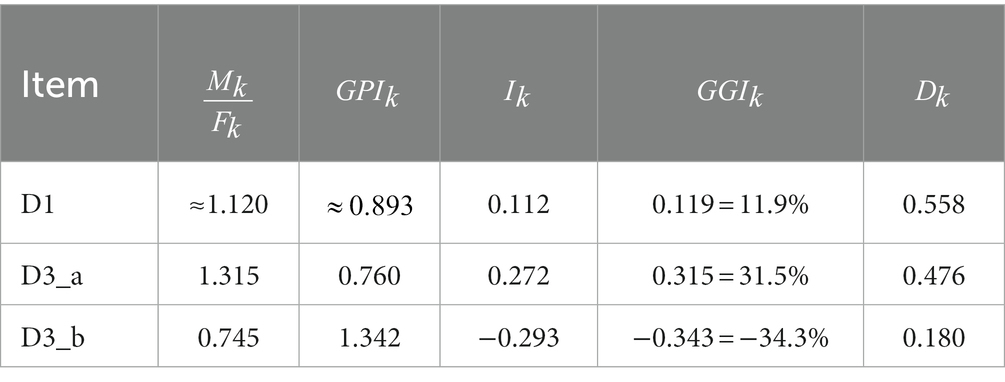
Table 6. Values of the four different indexes for the items D1, D3_a, D3_b, and their difficulty.
In Figure 4 you can see the item D3_a and D3_b. Question D3 is composed by two items which show completely different characteristics in terms of the resulting gender gap. Moreover, for both items, the indexes and the gender gap index have quite different values. Obviously, the value of will always be smaller than the value of .
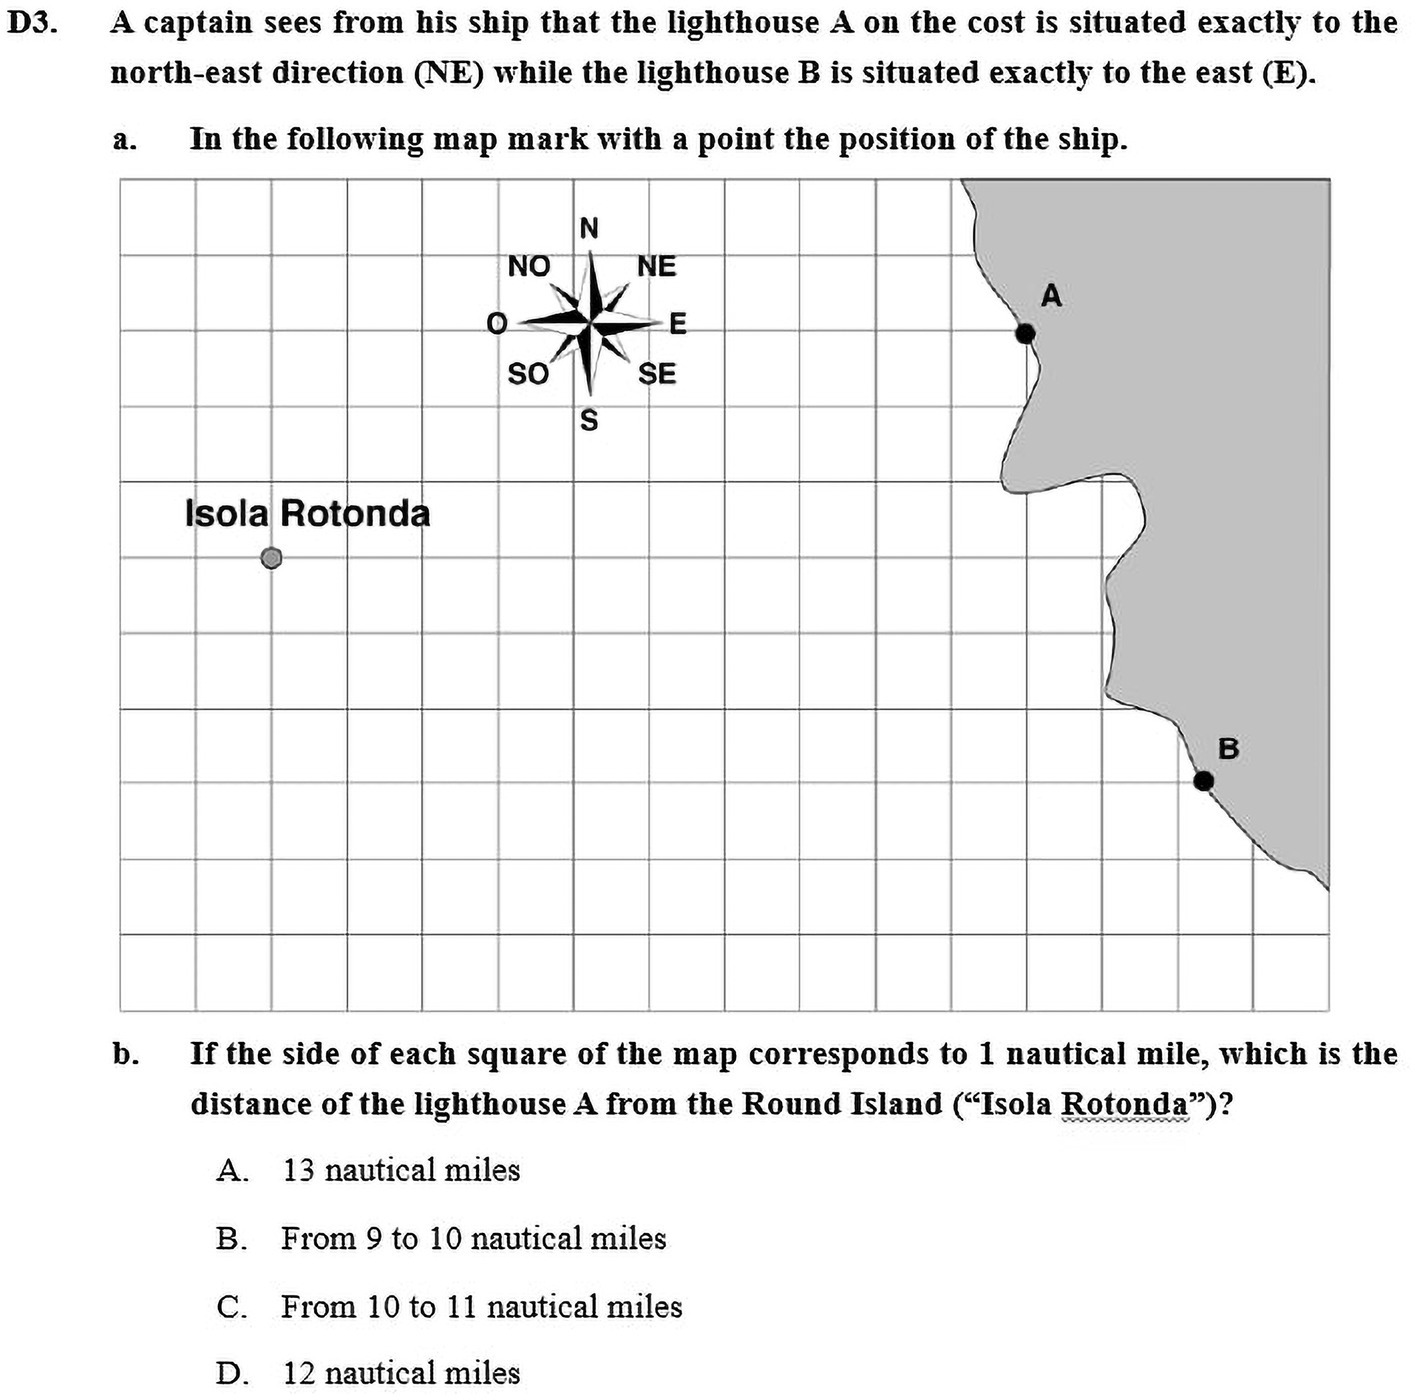
Figure 4. Question D3 of INVALSI test grade 10, year 2014. The question is made of two different items, shortly named D3_a and D3_b, translation by the authors. Source: https://www.gestinv.it.
The item D3_a is an open answer item, so in our analysis we have used the option “A” to indicate a correct answer and option “B” to indicate an incorrect one. On item D3_a, and have different values, as shown in Table 6; for completeness, Table 5 reveals that in this item males outperform females of 13 percentage points (54% of correct answers against 41%). In terms of percentages of correct answers, this item shows a significative gap between males and females rate of correct answers and it is reflected in the value of , which allows us to put the item in the “severe gender gap in favour of males” class.
The difficulty of this item is approximately average, however the gender gap is classified as severe. It might be because of a variety of reasons that it could be worth exploring, among which the format of the question, the unusual task and the content that it wants to investigate, which regards in general also the visual ability.
Regarding the possibility to compare the results of different items, let us do it with item D1, which we analysed in the previous paragraph, and item D3_a. They have a gender gap index respectively equal to 11.9% and 31.5%, which is roughly three times greater (2,65 times, precisely). The indexes and are in a similar proportion but not equal proportion as they are equal to 0.112 and 0.272, respectively (so the latter is 2,43 times the former).
From the results of both the indexes we can infer that item D1 and item D3_b are characterized by a gender gap of different proportion in favour of males. Nonetheless, from the results of the index we cannot figure out that the exact amount of this difference. In fact, from the values of and we can see that in the item D1 we need a 11.9% more of girls’ correct answers to reach gender balance, while for the item D3_a we need a percentage that is three times higher, from which the higher gender gap.
The correct answer for item D3_b is A and the percentages of answers for each option can be found in Table 5. As we can observe in Table 6, for item D3_b the indexes and have still different values, but this time the gap is in favour of female students and it can be defined severe. In this item, the percentages of correct answers are 21% for females and 15% for males, so females outperform males of 6 percentage points and the percentage of correct answers itself is not very big. It is interesting to notice that this is one of the very few items, among the ones we have analysed, that show a gender gap in favour of female students and it is the only one in which the gender gap in favour of females is severe.
This item is also one of the most difficult of the set, so the fact that it is characterized by a large gender gap is not surprising. What might be surprising is the fact that it is in favour of females, but we should consider that even though the answer of this item is not immediate, with a little reasoning it may be brought back to classical exercises about the distance calculation.
Gender gap in STEM and in particular in mathematics is a widely known issue, it has been extensively studied and analysed as a phenomenon (Leder, 1992; Leder and Forgasz, 2008). Because of its crucial consequences from a socio-economic point of view, in the last few years gender gap has gained importance and relevance internationally. Having Italy a serious situation (Giberti and Spagnolo, 2021), it is even more urgent to address the issue and attempt to reduce the gap as soon as possible.
In order to do this, it is fundamental to understand and describe objectively the gender gap, using appropriate tools. The aim of this paper was exactly to define and describe a new and powerful tool to classify the result of each item of standardized tests in terms of gender gap and in this way highlighting the ones it might be more useful to analyse. The gender gap index has been proved to clearly display the information needed and to allow the comparison between different items, which is difficult to do with different indexes. Moreover, an example of analysis of different items taken from INVALSI tests has been provided, to show the use of the index and make some considerations about it.
It seems reasonable to focus further research using the described index, on the relationship between gender gap and the factors that characterize an item in a large-scale assessment, such as the difficulty of the item, its format or its content area. Furthermore, it is surely worth also investigating the metacognitive aspects, affective and internal factors that are generally regarded as predictors of mathematics achievement as well as the perceived difficulty of the item, that is sometimes linked to the latter.
CS: Conceptualization, Formal Analysis, Funding acquisition, Investigation, Methodology, Project administration, Resources, Supervision, Writing – original draft, Writing – review & editing, Validation. BN: Data curation, Formal Analysis, Methodology, Resources, Writing – original draft, Writing – review & editing, Visualization.
The author(s) declare financial support was received for the research, authorship, and/or publication of this article. This work was supported by the Open Access Publishing Fund of the Free University of Bozen-Bolzano.
The authors thank teachers and students who participated in the experiments.
The authors declare that the research was conducted in the absence of any commercial or financial relationships that could be construed as a potential conflict of interest.
All claims expressed in this article are solely those of the authors and do not necessarily represent those of their affiliated organizations, or those of the publisher, the editors and the reviewers. Any product that may be evaluated in this article, or claim that may be made by its manufacturer, is not guaranteed or endorsed by the publisher.
1. ^From an international perspective, OECD and IEA are working on large-scale assessment. Both OECD and IEA have a range of different programs and flagship studies about education (respectively CELE LEEP, CERI, PAI, PIAAC, PISA, TALIS and TIMSS, PIRLS, ICCS, ICILS, REDS, LaNA). The ones dealing with mathematics achievements are PISA, developed by OECD (https://www.oecd.org/pisa/) and TIMSS, conducted by IEA (https://www.iea.nl/studies/iea/timss).
2. ^This expression indicates the possibility of generalisation of a statistical measure, obtained on a sample, to the population from which the sample is drawn within the established confidence interval.
2. ^Database available at link www.gestinv.it.
Barbaranelli, C., and Natali, E. (2011). I test psicologici: Teorie e modelli psicometrici. Carocci.
Bolondi, G., Cascella, C., and Giberti, C. (2017). “Highlights on gender gap from Italian standardized assessment in mathematics” in Equity and diversity in elementary mathematics education. Proceedings of the international symposium elementary Maths teaching—SEMT 17. eds. J. Novotná and H. Moraová (Prague, Czech Republic: Charles University, Faculty of Education), 81–90.
Bolondi, G., Cascella, C., and Giberti, C. (2020). “Formulazione della domanda e funzionalità psicometrica: Evidenze empiriche su un campione di studenti della terza secondaria di primo grado” in I dati INVALSI: uno strumento per la ricerca. ed. P. Falzetti (FrancoAngeli), 68–92.
Bolondi, G., Ferretti, F., and Giberti, C. (2018). Didactic contract as a key to interpreting gender differences in maths [Il contratto didattico come una chiave di lettura per interpretare le differenze di genere in matematica]. J. Educ. Cult. Psychol. Stud. 18, 415–435. doi: 10.7358/ecps-2018-018-bolo
Casalvieri, C., Gambini, A., Spagnolo, C., and Viola, G. (2023). Formative assessment in LDL: the concept of derivatives through eye-tracker analysis. In Proceedings of the 15th international conference on computer Supported education (CSEDU 2023), 2, 378–385.
Cascella, C., Giberti, C., and Maffia, A. (2023). Percentages versus Rasch estimates: alternative methodological strategies for replication studies in mathematics education. Res. Math. Educ. 1–19. doi: 10.1080/14794802.2022.2154826
Chang, D. F. (2018). Effects of higher education expansion on gender parity: a 65-year trajectory in Taiwan. High. Educ. 76, 449–466. doi: 10.1007/s10734-017-0219-9
Contini, D., Di Tommaso, M. L., and Mendolia, S. (2017). The gender gap in mathematics achievement: evidence from Italian data. Econ. Educ. Rev. 58, 32–42. doi: 10.1016/j.econedurev.2017.03.001
Fan, X. (1998). Item response theory and classical test theory: an empirical comparison of their item/person statistics. Educ. Psychol. Meas. 58, 357–381. doi: 10.1177/0013164498058003001
Ferretti, F., Gambini, A., and Spagnolo, C. (2024). Management of semiotic representations in mathematics: quantifications and new characterizations. Eur. J. Sci. Math. Educ. 12, 11–20. doi: 10.30935/scimath/13827
Ferretti, F., and Giberti, C. (2021). The properties of powers: didactic contract and gender gap. Int. J. Sci. Math. Educ. 19, 1717–1735. doi: 10.1007/s10763-020-10130-5
Fryer, R. G., and Levitt, S. D. (2010). An empirical analysis of the gender gap in mathematics. Am. Econ. J. Appl. Econ. 2, 210–240. doi: 10.1257/app.2.2.210
Giberti, C. (2019). Differenze di genere in matematica: dagli studi internazionali alla situazione italiana. Didattica Della Matematica. Dalla Ricerca Alle Pratiche d’aula. 5, 44–69. doi: 10.33683/ddm.18.5.2
Giberti, C., Santi, G., and Spagnolo, C. (2023). The role of metaphors in interpreting students’ difficulties in operating with percentages: a mixed method study based on large scale assessment. Eur. J. Sci. Math. Educ. 11, 297–321. doi: 10.30935/scimath/12642
Giberti, C., and Spagnolo, C. (2021). Educazione matematica e differenze di genere: capire il presente per cambiare il futuro. In Disparità di genere: processi identitari, dinamiche interpersonali e cornici socioculturali, a cura di Roberta Di Pasquale (Lubrina Editore, Bergamo, 53-81. Available at: https://hdl.handle.net/10863/33437
Giofrè, D., Cornoldi, C., Martini, A., and Toffalini, E. (2020). A population level analysis of the gender gap in mathematics: results on over 13 million children using the INVALSI dataset. Intelligence 81:101467. doi: 10.1016/j.intell.2020.101467
Girelli, L. (2022). What does gender has to do with math? Complex questions require complex answers. J. Neurosci. Res. 101, 679–688. doi: 10.1002/jnr.25056
Griselda, S. (2022). The gender gap in math: What are we measuring?. Available at: https://ssrn.com/abstract=4022082
Guiso, L., Monte, F., Sapienza, P., and Zingales, L. (2008). Culture, gender, and math. Science 320, 1164–1165. doi: 10.1126/science.1154094
INVALSI . (2019). Rapporto nazionale prove INVALSI 2019. Available at: https://invalsi-areaprove.cineca.it/index.php?get=static&pag=rapporti_invalsi (Accessed 01 August 2023).
INVALSI . (2022). Rapporto nazionale prove INVALSI 2022. Available at: https://invalsi-areaprove.cineca.it/index.php?get=static&pag=rapporti_invalsi (Accessed 01 August 2023).
INVALSI . (2023). Rapporto nazionale prove INVALSI 2023. Available at: https://invalsi-areaprove.cineca.it/index.php?get=static&pag=rapporti_invalsi (Accessed 01 August 2023).
Jabrayilov, R., Emons, W. H. M., and Sijtsma, K. (2016). Comparison of classical test theory and item response theory in individual change assessment. Appl. Psychol. Measur. 40, 559–572. doi: 10.1177/0146621616664046
Kanny, M., Sax, L., and Riggers-Pieh, T. (2014). Investigating forty years of stem research: how explanations for the gender gap have evolved over time. J. Women Minorities Sci. Eng. 20, 127–148. doi: 10.1615/jwomenminorscieneng.2014007246
Leder, G. C. (1992). “Mathematics and gender: changing perspectives” in Handbook of research on mathematics teaching and learning. ed. D. A. Grouws (Macmillan), 597–622.
Leder, G., and Forgasz, H. (2008). Mathematics education: new perspectives on gender. ZDM – Int. J. Math. Educ 40, 513–518. doi: 10.1007/s11858-008-0137-5
Marshall, A. H., Zenga, M., and Kalamatianou, A. (2020). Academic students’ Progress indicators and gender gaps based on survival analysis and data mining frameworks. Soc. Indic. Res. 151, 1097–1128. doi: 10.1007/s11205-020-02416-6
Mazza, L., and Gambini, A. (2023). The phenomenon of the gender gap among gifted students: the situation in Italy based on analysis of results in mathematics competitions. Teaching Mathematics and its Applications: An International Journal of the IMA, 42, 170–186.
Mullis, I., Martin, M., Foy, P., Kelly, D., and Fishbein, B. (2020). TIMSS 2019 international results in mathematics and science. Boston, USA: TIMSS & PIRLS International Study Center.
OECD . (2019). PISA 2018 results (volume II): Where all students can succeed. Paris: OECD Publishing.
Spagnolo, C., Casalvieri, C., and Gambini, A. (2024). Different processes for graphical recognition of derivative of a function: an eye-tracker analysis. Springer LNNS series.
Spagnolo, C., Giglio, R., Tiralongo, S., and Bolondi, G. (2021). Formative assessment in LDL: a teacher training experiment. In Proceedings of the 13th international conference on computer Supported education (CSEDU 2021), 1, 657–664.
Spagnolo, C., Giglio, R., Tiralongo, S., and Bolondi, G. (2022). Formative assessment in LDL workshop activities: engaging teachers in a training program. In Computer Supported Education: 13th international conference, CSEDU 2021, virtual event, April 23–25, 2021, revised selected papers, 560–576. Cham: Springer International Publishing.
UNESCO . (2020). Global education monitoring report 2020: Inclusion and education: All means all. Paris: UNESCO.
UNESCO . (2023). Global education monitoring report 2023: Technology in education—A tool on whose terms? Paris: UNESCO.
Keywords: gender gap, gender gap index, large-scale assessment, mathematics education, standardized tests
Citation: Spagnolo C and Nicchiotti B (2023) Interpreting gender gap issues in standardized tests: definition and application of a theoretical tool. Front. Educ. 8:1303041. doi: 10.3389/feduc.2023.1303041
Edited by:
Janet Clinton, The University of Melbourne, AustraliaReviewed by:
Lorenzo Mazza, Sapienza University of Rome, ItalyCopyright © 2023 Spagnolo and Nicchiotti. This is an open-access article distributed under the terms of the Creative Commons Attribution License (CC BY). The use, distribution or reproduction in other forums is permitted, provided the original author(s) and the copyright owner(s) are credited and that the original publication in this journal is cited, in accordance with accepted academic practice. No use, distribution or reproduction is permitted which does not comply with these terms.
*Correspondence: Camilla Spagnolo, Y2FtaWxsYS5zcGFnbm9sb0B1bmliei5pdA==
Disclaimer: All claims expressed in this article are solely those of the authors and do not necessarily represent those of their affiliated organizations, or those of the publisher, the editors and the reviewers. Any product that may be evaluated in this article or claim that may be made by its manufacturer is not guaranteed or endorsed by the publisher.
Research integrity at Frontiers
Learn more about the work of our research integrity team to safeguard the quality of each article we publish.