 Marjorie Valls
- UER Développement, Haute Ecole Pédagogique Vaud, Lausanne, Switzerland
Introduction: Although test anxiety had traditionally been conceptualized as composed of negative dimensions, the French Revised Test Anxiety + Regulatory scale (FRTA + R) includes a noteworthy positive dimension which represents the regulatory component of anxiety. Perceived control is thus supposed to reflect a potential coping capacity.
Method: This study investigates the psychometric properties of the FRTA + R using confirmatory factor analysis, as well as its reliability and invariance across gender and grade levels in a sample of 259 secondary school students from a French-speaking canton of Switzerland (Mage = 13.51, SD = 1.05; 51% girls). The aim is also to identify test anxiety profiles using cluster analysis.
Results: The main findings support the five-factor structure of FRTA + R (CFI = 0.97; TLI = 0.97; RMSEA = 0.047) and confirm invariance across gender and grade levels at both configural, metric, and scalar levels. While the reliability of the scale is broadly supported, the test-irrelevant thinking factor presents relatively heterogeneous factor loadings, suggesting a possible lack of precision and stability. Findings from latent mean comparisons showed that girls reported higher levels on three dimensions (i.e., Bodily symptoms, Tension, and Worry) as well as lower levels of perceived control than boys, while 9th graders also reported higher levels on these three negative dimensions compared to 10th and 11th graders. A preferred 3-cluster solution was identified, corresponding to low (41% of whom 66% boys), medium (37% of whom 60% girls), and high (22% of whom 72% girls) levels of test anxiety.
Discussion: Although the pertinence of defining test-irrelevant thinking and perceived control as a full-fledged dimension of test anxiety is questioned, results contribute to the extensive body of research supporting gender differences and are also discussed in terms of practical implications and benefits of FRTA + R.
1. Introduction
According to the Organization for Economic Co-operation and Development report (Organisation for Economic Co-operation and Development [OECD], 2017) presenting the results of the PISA 2015 study on student well-being, a significant number of students would experience anxiety especially when confronted with test situations. Indeed, approximately 59% of students reported concerns about the difficulty of tests and 55% reported feelings of high anxiety despite being well prepared for a test (Organisation for Economic Co-operation and Development [OECD], 2017, p. 84).1 Although data from Switzerland in this report are generally lower than the average across OECD countries, it appears that test anxiety affects more than 30% of students with respect to the question asked.2 It also seems that the overall prevalence of test anxiety is constantly increasing. For example, data from this report indicates that over 60% of students in the United Kingdom were experiencing test anxiety, while Putwain and Daly (2014) found evidence of high-test anxiety in 16% of students in their sample aged between 14 and 16. These discrepancies in proportion may be due to the use of different measures and the consideration of levels (i.e., low, moderate, and high) to define students who may be considered test anxious.3
Although it is difficult to obtain a true estimation of the prevalence of test anxiety without using standardized tests with cut-off scores, it appears that evaluation situations (i.e., tests) are a significant source of anxiety for students (McDonald, 2001). Despite some methodological problems previously mentioned that make it difficult to effectively compare study results (e.g., particularly due to the diversity of measure instruments used; McDonald, 2001), this remains an alarming observation knowing that test anxiety generally leads to performance decrements (Spielberger et al., 2015). However, if some associations between school achievement and students’ health are mentioned in The Swiss Education Report (e.g., Swiss Coordination Centre for Research in Education [CSRE], 2018), this is mainly to assess the impact of some factors such as body weight, physical fitness and physical disabilities on motivation and performance, test anxiety not being considered. Therefore, the availability of a reliable and valid tool appears to be an essential condition for collecting data specific to the construct studied and for conducting comparative studies.
Trait-state anxiety theory provides a conceptual framework for understanding test anxiety. Spielberger (1966, 1972) defined state anxiety as a temporary emotional state that can occur in any individual faced with a situation appraised as potentially threatening, and which is characterized by subjective feelings of apprehension, fear and tension, as well as activation of the autonomic nervous system This state of anxiety can vary in intensity and fluctuate over time. Trait anxiety is defined as a predisposition to appraise a wide range of stimuli that are more or less neutral (i.e., non-dangerous) as representing a personal threat, resulting in a tendency to respond to these perceived threats with intense state-anxiety reactions that are disproportionate to the situation. This trait of anxiety is relatively stable, and levels of state anxiety are chronically higher than those of most other individuals. Test anxiety, in turn, can be defined as a set of symptoms (i.e., physiological, emotional, cognitive, and even behavioral) experienced by students when faced with a performance assessment situation (i.e., test) perceived as threatening (Putwain and Daly, 2014; Lowe, 2021; Mascret et al., 2021). This appraisal situation and the perceived threat associated with it would generate irrelevant worries as well as intense and often negative emotional responses such as feelings of apprehension, distress, and even depression (McDonald, 2001; Spielberger et al., 2015). As a result, during a high-stakes test situation where a student has a poor belief in one’s ability to cope, this student will be more likely to perceive the test as a threat which will increase one’s state anxiety (Putwain and Daly, 2014). Thus, test anxiety can be conceptualized as a situation-specific (i.e., exam or test) form of trait anxiety with a disposition to react to the perceived threat with an increase in state anxiety, which is characterized by feelings of tension and worries associated with physiological arousal (Spielberger, 1980 cited by Spielberger and Vagg (1995), pp 6–8). However, individuals with a high level in trait test anxiety will not necessarily respond to all threatening situations with an increased level of state anxiety, only to those where their performance will be evaluated (Putwain and Pescod, 2018).
This conceptualization led to the definition of two main dimensions, namely Emotionality (sometimes referred to as Tension; e.g., Putwain and Daly, 2014) and Worry. Emotionality (i.e., Tension) represents the affective-physiological component with activation and perception of physiological responses, while Worry represents the cognitive component with activation of negative and self-critical thoughts (Putwain and Daly, 2014; Mascret et al., 2021). According to McDonald (2001), the negative thoughts present both before and during a test can be related to doubts about one’s ability to succeed, negative comparisons with others, or unfavorable consequences of a poor test performance. The most widely used scale in line with this two-dimensional model of test anxiety is the Test Anxiety Inventory developed by Spielberger (1980), which however presents some reliability problems (i.e., low internal consistency of the Worry dimension) as well as overlap between the two dimensions (Mascret et al., 2021). Nevertheless, there has been an evolution in the conceptualization of test anxiety. For example, Emotionality has been described as including various physiological manifestations (particularly bodily symptoms), while the cognitive component would include both worries about test performance or consequences and irrelevant thoughts unrelated to the task (Spielberger and Vagg, 1995, p. 10; Thomas et al., 2018). These considerations led to the definition of test anxiety as composed of four dimensions, namely Worry, Test-irrelevant thinking, Bodily symptoms, and Tension (Sarason, 1984; Spielberger and Vagg, 1995, p. 10) that can be measured with the Revised Test Anxiety scale (RTA; Benson and El-Zahhar, 1994). This multidimensional scale can therefore encompass the full range of cognitive, affective and physiological manifestations of test anxiety.
Recently, Mascret et al. (2021) translated the RTA scale into French and added a fifth dimension that supposedly represents the regulatory component of anxiety (i.e., Perceived control), providing the possibility of assessing the adaptive potential of test anxiety. This dimension is presented by these authors as “the perception of feeling capable of coping and attaining goals under stress.” They specifically insist on the fact that it is a full-fledged dimension of anxiety reflecting a potential coping capacity that enables to apprehend the variation of anxiety levels. The items composing the Perceived Control dimension were developed on the basis of Cheng et al. (2009) three-dimensional model of performance anxiety, in which individuals anxious in test situations are considered to appraise not only the situation as representing a threat, but also their potential ability to cope with it. For example, believing oneself to be well prepared, capable of coping with the evaluation situation and performing well could lead to the mobilization of additional resources (Mascret et al., 2021) and be associated with positive feelings (McDonald, 2001) despite the anxiety felt. Spielberger and Vagg (1995, p. 12) had already mentioned this adaptive potential, where correctly answering several questions on a test could be associated with positive thoughts and a reappraisal of the situation as less threatening, whereas inability to answer a question could be associated with negative thoughts, worry, feelings of tension and a state of physiological arousal. Some authors have also discussed this concept as the degree of certainty regarding one’s ability to achieve a good mark or avoid failure by mobilizing certain resources (e.g., effort, strategies), which would also influence how one prepares for test situations (Putwain and Aveyard, 2018). This definition seems close to the definition of Mascret et al. (2021) previously mentioned. Although other measurements include a dimension close to Perceived Control (i.e., lack of confidence), it remains conceived as a negative dimension of test anxiety without taking into account its positive and adaptive effects.
Thus, in their study conducted among a sample of 403 French students aged 13 to 18, Mascret et al. (2021) demonstrated satisfactory psychometric properties of the FRTA + R. An initial confirmatory factor analysis (CFA) led to the deletion of 8 out of 26 items from the five-factor model with factor loadings below 0.50. A second CFA run on the remaining 18 items showed good fit indices (i.e., CFI = 0.98; IFI = 0.98; RMSEA = 0.049; and SRMR: 0.05), with factor loadings ranging from 0.54 to 0.91. When compared with alternative models (one-, two- and three-factor), the five-factor model showed a better fit to the data (ECVI value = 0.84) with measurement invariance across gender at both metric and scalar levels. Significant correlations between factors ranged from −0.16 (i.e., between test-irrelevant thinking and perceived control) to 0.62 (i.e., between worry and tension). However, test-irrelevant thinking was not significantly correlated with any of the other negative dimensions of test anxiety, while perceived control was negatively correlated with all four negative dimensions. This last element is important to consider, as it underlines the potential positive effects of this dimension. Given that test anxiety is recognized in the literature as a multidimensional construct, the choice of a scale measuring five dimensions already available in French seemed most relevant. Although students’ ability to cope with test situations could influence their perception and appraisal of these situations as threatening or non-threatening (Spielberger and Vagg, 1995), suggesting that perceived control would be more of an antecedent of test anxiety, the added value of this dimension makes it an instrument of choice to determine whether students are able to mobilize some resources despite the perceived threat and resulting anxious response. As pointed out by Mascret et al. (2021), the FRTA + R scale may thus be useful for screening at-risk student profiles, combining both high levels in negative dimensions (i.e., worry, test-irrelevant thinking, bodily symptoms and tension) and low levels of perceived control.
Indeed, some studies using a person-centered approach have identified recurring profiles of low, medium and high levels of test anxiety in middle/high school and undergraduate students (e.g., Chapell et al., 2005; Thomas et al., 2018; Lowe, 2021). The proportions of students belonging to the high-test anxiety profile varied between 16 and 22% depending on the study. In addition, McDonald (2001) pointed out that studies using self-report measures of test anxiety consistently reported higher levels among female participants, with levels generally increasing with age. Gender differences would mainly concern Tension dimension with higher levels in girls (Putwain and Daly, 2014; Mascret et al., 2021) while boys would report higher levels of perceived control (Mascret et al., 2021). McDonald (2001) explained these persistent gender differences as possibly reflecting the greater willingness of girls to report anxiety symptoms. For Switzerland, the Pisa study (Organisation for Economic Co-operation and Development [OECD], 2017) showed that, although the proportions were still lower than the average across OECD countries, gender differences were significant with 57% of girls reporting worry about having difficulty taking a test and 41% reporting feeling anxious despite being well prepared (vs. 39 and 26% of boys, respectively). Associations with age are more difficult to establish, with some studies reporting no significant association (e.g., Mascret et al., 2021) while others show that middle school students would be more likely to have high levels of test anxiety (e.g., Lowe, 2021).
A reliable measure is needed to assess the impact of test anxiety and to develop appropriate interventions by targeting relevant components. For example, Spielberger and Vagg (1995) questioned the pertinence of including irrelevant thoughts as a full-fledged component of test anxiety, pointing out that: “Task-irrelevant thoughts that are unrelated to worry about test performance or consequences, like poor study habits and negative attitudes toward teachers and courses, would seem to be more meaningfully conceptualized as a correlate of test anxiety rather than a component” (p. 10). Thus, the main objective of this study is to analyze the psychometric properties of the French version of the RTA scale including the regulatory component of anxiety (FRTA + R; Mascret et al., 2021) in a sample of Swiss secondary school students. Another aim is to test the factorial invariance of the scale across gender and grade levels in order to compare latent means. Latent mean comparison analysis is more powerful and outperforms traditional techniques of comparison by providing more accurate results and less biased mean estimations (Chen et al., 2019; Kouvava et al., 2022). Grade level was preferred to age since Mascret et al. (2021) had found no significant results for the predictive role of age in a large sample of French students. Finally, since adequate cut-off scores do not exist (McDonald, 2001), a further aim is to identify student profiles based on FRTA + R components using a person-centered approach, in order to determine whether the three levels of test anxiety frequently reported (i.e., low, medium, high) can be replicated.
2. Materials and methods
2.1. Research design and study procedure
This study was conducted in accordance with the Code of Research Ethics for the Universities of Teacher Education (Conference of Directors of Universities for Teacher Education [CDHEP], 2002) and the International Ethical Guidelines for Health Research Involving Humans (Council for international organization of medical science [CIOMS], 2016). The data were collected in a way that preserves the anonymity of the participants. The parents of each student received an information letter explaining the general objectives of the study (namely, to explore students’ feelings about test situations), the identity of the supervisor, the institution involved and a contact address in order to respect the duty to inform. They could refuse their child’s participation in the data collection, and each student could also decline to complete the study given that participation was voluntary. Under these conditions, no refusals were recorded.
Data were collected from secondary school students (nine to eleven graders) in a French-speaking canton of Switzerland during the 2021 to 2022 school years. In Switzerland, grades nine to eleven correspond to cycle 3 of compulsory education, which ends with the school certificate. Cycle 3 consists of two divisions: the general division (VG) for students intending to pursue a trade or vocation (i.e., vocational training, general and commercial school, or vocational baccalaureate school) and the pre-matura division (VP) for students who aspire to an academic career. For this study, the target population included only students in the pre-matura division (VP). Data collection was conducted in each classroom under the supervision of Master students, and participants completed the questionnaire anonymously in approximately 10 min.
2.2. Participants
The FRTA + R were administered to 259 students aged between 11 and 16 years old (Mage = 13.51, SD = 1.05), including 133 girls (51%; Mage = 13.39, SD = 1.06) and 124 boys (48%; Mage = 13.62, SD = 1.04) as two participants did not report their gender. Of these students, 101 were in 9th grade (39% of the total sample, 42% of boys), 81 in 10th grade (31% of the total sample, 33% of girls) and 77 in 11th grade (30% of the total sample, 31% of girls).
Although Little’s Missing Completely at Random (MCAR; Little, 1988) test was not significant (χ2 = 320.95, df = 283, p = 0.060), multiple imputation was performed for 26 missing data on FRTA + R items to avoid data loss and not bias the estimates.
2.3. Measure
2.3.1. Test anxiety and regulatory dimension of anxiety
After providing their age, gender, and grade level, participants were asked to complete the FRTA + R (Mascret et al., 2021). This self-report questionnaire is composed of 18 items divided into five factors: (1) Worry (3 items; e.g., item 2 “I seem to defeat myself while taking important tests”); (2) Test-irrelevant thinking (3 items; e.g., item 12 “During tests I find I am distracted by thoughts of upcoming events”); (3) Bodily symptoms (3 items; e.g., item 14 “I sometimes find myself trembling before or during tests”); (4) Tension (4 items; e.g., item 11 “I am anxious about tests”); and (5) Perceived control (5 items; e.g., item 10 “During tests I believe that I have the resources to receive a good grade”). Each item is rated on a 4-point Likert scale ranging from almost never (1) to almost always (4). For the factors related to the negative components of test anxiety (i.e., Worry, Test-irrelevant thinking, Bodily symptoms, and Tension), the higher the score, the more the respondent exhibits the symptoms described. For the factor related to the positive component of test anxiety (i.e., Perceived control), the higher the score, the more the respondent has the ability to mobilize resources to deal with test situations despite the anxiety felt. In their study, Mascret et al. (2021) reported mostly satisfactory internal consistency values (Cronbach’s alpha between 0.70 and 0.87 and McDonald’s Omega between 0.68 and 0.87), as well as reliability values (average variance extracted between 0.41 and 0.56 and composite reliability between 0.67 and 0.87) according to the thresholds used. The lowest values were systematically found for the Worry factor, and the highest values for the test-irrelevant thinking factor.
2.4. Statistical analysis
First, we performed descriptive statistics (for each item and for each factor of the original model) by reporting means (M) and standard deviations (SD), as well as skewness and kurtosis values. Data can be considered to be normal if skewness values are between −2.00 to 2.00 and kurtosis values are between–7.00 to 7.00 (Byrne, 2010; Hair et al., 2010).
Second, we conducted confirmatory factor analyses (CFAs) with maximum likelihood estimation to compare the original five-factor model (M1) with other models: a three-factor model where the three latent factors represented the cognitive (i.e., Worry and Test-irrelevant thinking), physiological (i.e., Bodily symptoms and Tension) and positive (i.e., Perceived control) dimensions of test anxiety (M2); a two-factor model where the two latent factors represented the negative (i.e., Worry, Test-irrelevant thinking, Bodily symptoms and Tension) and positive (i.e., Perceived control) dimensions of test anxiety (M3); and a one-factor model where all items loaded on a single latent factor referring to the construct of test anxiety (M4). The following criteria were used as cutoffs to assess model fit to the data: the ratio of chi-square to its degree of freedom (χ2/df ≤ 3.00; Carmines and McIver, 1981); the Comparative Fit Index (CFI ≥ 0.90; Tucker and Lewis, 1973; Bentler, 1990); the Tucker–Lewis Index (TLI ≥ 0.80; Hu and Bentler, 1999; Schumaker and Lomax, 2004); the incremental fit index (IFI ≥ 0.95; Byrne, 2010); the Root Mean Square Error of Approximation and the Standardized Root Mean Square Residual (RMSEA ≤ 0.06 and SRMR ≤ 0.08; Hu and Bentler, 1999); and the Akaike Information Criterion (AIC with the lowest value indicating the model that best fits the data; Akaike, 1987). The Expected Cross Validation Index was also used to assess the models’ replication potential (ECVI with the smallest value indicating the largest potential; Byrne, 2010).
Third, the reliability and discriminant validity of the scale were explored using procedures described by Teo et al. (2009), but specific thresholds were adjusted. We examined item reliability by ensuring that factor loadings for each item were above 0.50. We also used the composite reliability (CR) and average variance extracted (AVE) indices, computing the average standardized factor loading and corresponding standard deviation for each factor to follow the recommendations made by Valentini and Damasio (2016). These authors demonstrate that AVE is highly sensitive to models with high factor loadings and high factor loadings heterogeneity (i.e., high standard deviation of average factor loadings), while CR is sensitive to models with more than 10 items. The commonly accepted thresholds for CR (i.e., ≥0.70) and AVE (i.e., ≥0.50) were therefore adjusted accordingly, and analyzed in conjunction with the standard error of measurement (SEM < SD/2; e.g., Kouvava et al., 2022). Cronbach’s alpha and McDonald’s omega coefficients, as well as correlations between the FRTA + R factors were also observed. Discriminant validity, in turn, was examined using the square root of the AVE for each factor, which must be higher than the correlations between that factor and other factors.
Fourth, multi-group CFAs were conducted according to three steps (Byrne, 2010; Comşa, 2010) to assess measurement invariance across gender and grade levels (9th vs. 10th vs. 11th) for the model retained. In step 1, we tested the configural invariance model by estimating the overall model fit across groups, in line with the thresholds previously defined for CFI and RMSEA. In step 2, we tested the metric invariance model where factor loadings were constrained to be equal across groups. In step 3, we tested the scalar invariance model where factor loadings and intercepts were constrained to be equal across groups. Chi2 difference test (∆χ2 nonsignificant; Cheung and Rensvold, 2002; Byrne, 2010) and changes in CFI (∆CFI ≤ 0.01; Cheung and Rensvold, 2002) and RMSEA (∆RMSEA ≤ 0.015; Chen, 2007) were used to estimate the fit of the metric and scalar invariance models. Because residual invariance is not a required condition for latent mean comparisons as residuals are not part of the latent factor (Vandenberg and Lance, 2000; Putnick and Bornstein, 2016), this model was not tested.
Then, we compared latent means by gender and grade levels with the scalar invariance model serving as a baseline model (Chen et al., 2019). To compare latent means between gender, the girls’ group’s latent mean was constrained to 0 (i.e., reference group) while the boys’ group’s latent mean was freely estimated (i.e., comparison group). To compare latent means between the three grade levels, we proceeded as follows: the latent mean of the 11th group was first constrained to 0 (i.e., reference group 1) while the latent mean of the other two groups was freely estimated, allowing latent mean comparisons between 11th and 9th and between 11th and 10th; then the latent mean of the 10th group was constrained to 0 (i.e., reference group 2) with the latent mean of the other two groups freely estimated, allowing latent mean comparison between 10th and 9th. The critical ratio (CR) value was used to assess differences in latent means (CR > 1.96 indicating statistically significant differences): a positive CR value indicating a higher latent mean for the comparison group and a negative CR value indicating a lower latent mean for the comparison group (Chen et al., 2019).
Finally, as our sample was too small to conduct latent profile analyses which generally require a minimum of 300 to 500 participants (e.g., Nylund-Gibson and Choi, 2018), we decided to perform cluster analyses. A hierarchical cluster analysis was conducted (Ward’s method with squared Euclidean distance) based on the standardized scores (z-scores) in order to confirm the discriminating power of the FRTA + R and to identify student profiles with low, medium, or high test-anxiety levels. The agglomeration schedule as well as the dendrogram were used to identify the number of clusters, and the K-means classification was performed to assign individuals to one of the identified clusters for each solution. Then, discriminant analyses were run using the classification variables as predictors of cluster solution membership by reporting Wilks’ Lambda values (λ ≤ 0.90, with the lower value indicating high discriminative power). Knowing that there is no cut-off score for FRTA + R, the identified profiles remain specific to our sample.
3. Results
3.1. Descriptive statistics
Table 1 provides descriptive statistics for each factor and item of the FRTA + R. The mean factor scores are above 2.00 indicating overall positive responses, except for the bodily symptoms factor. Although the standard deviations ranged from 0.73 to 1.15 (suggesting some dispersion of item scores), the normality assumption does not appear to be severely violated since Skewness and Kurtosis values are mostly below the thresholds previously defined.
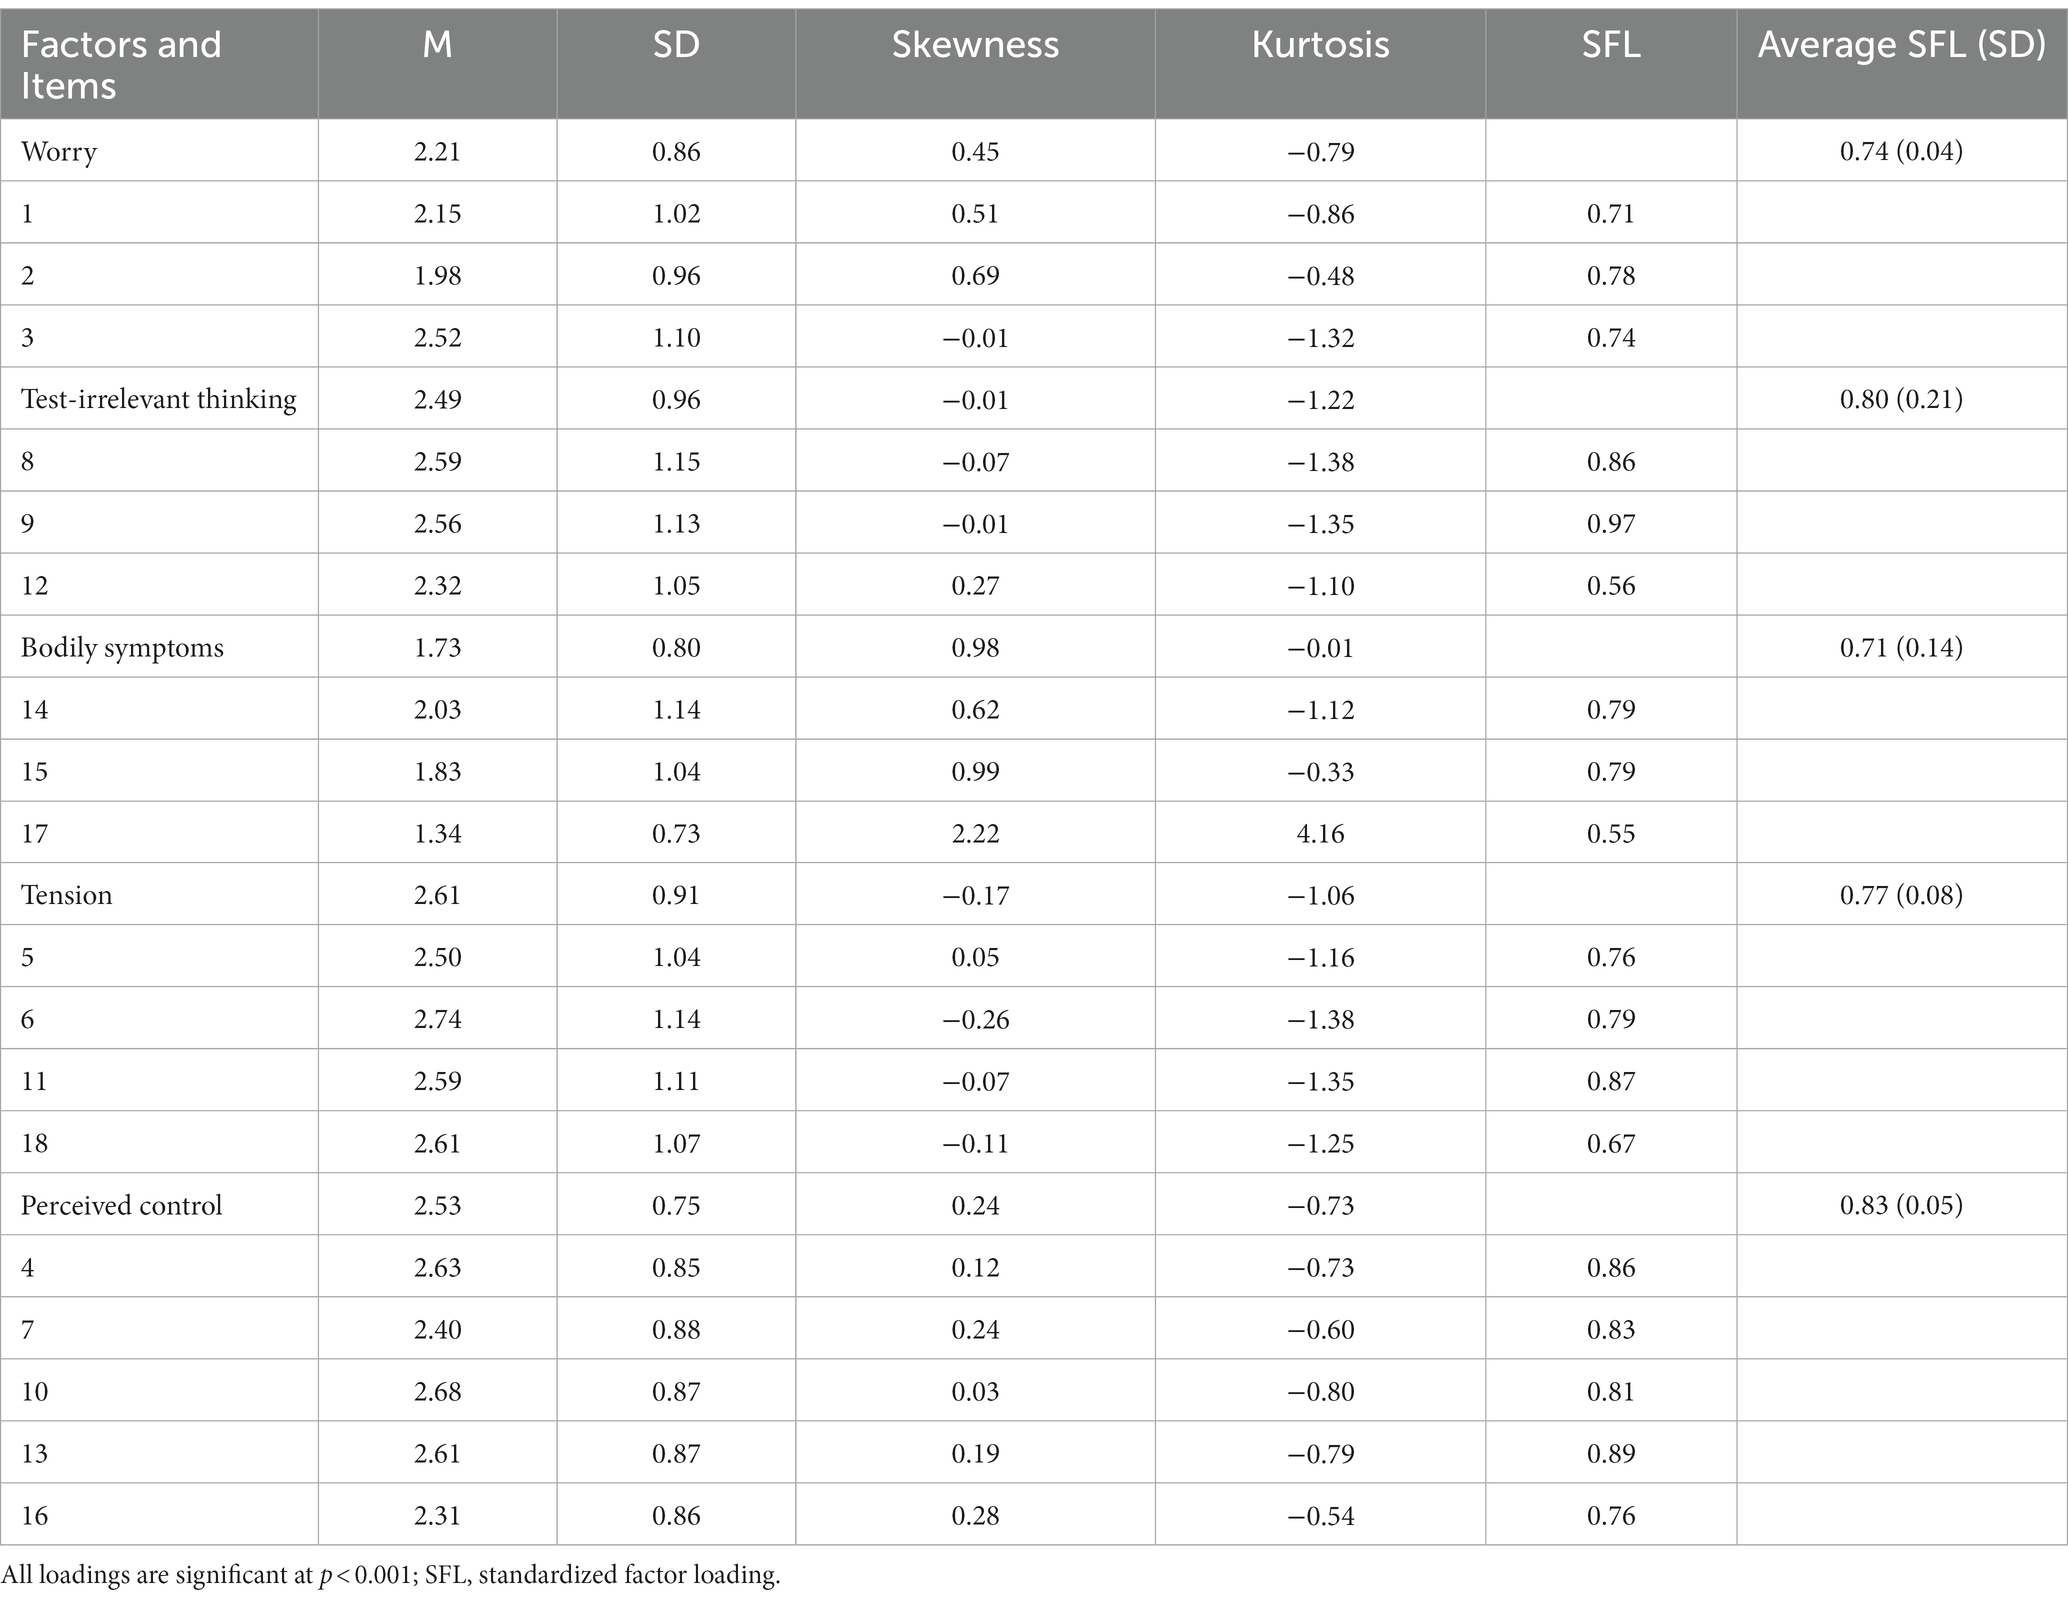
Table 1. Means (M), standard deviations (SD), skewness and kurtosis of factors and items (N = 259).
Only item 17 (e.g., “I have difficulty breathing while taking a test”) shows a Skewness value above 2.00. This item (included in the Bodily symptoms factor) also shows the lowest mean and factor loadings. Following Teo et al. (2009), if we refer to the guidelines of severe non-normality defined by Kline (2005); i.e., (Skewness > 3.00 and Kurtosis > 10.00), the data can be considered fairly normal and maximum likelihood estimation procedures can be used for further analyses.
3.2. Comparison with alternative models
Based on previous findings, we defined an alternative model (M1’) in addition to the four other models tested (M1 to M4). The model M1’ was identical to the original five-factor model (M1), except that it excluded item 17 from the analysis. Models were then estimated and compared.
CFA results presented in Table 2 clearly show a poor fit to our data for models M2, M3, and M4, whereas models M1 and M1’ were nearly equivalent. A chi-square difference test (Brown, 2006, p. 164; Byrne, 2010) was therefore performed to compare these two models. The result indicated that both models fit statistically equally well (χ2diff(16) = 22.51; p = 0.127). Although model M1’ showed the lowest AIC and ECVI values, we decided to retain the original five-factor model for further analysis.

Table 2. Fit indices for the different models tested.
3.3. Reliability and discriminant validity
Regarding the reliability of the FRTA + R, we can first note that the standardized factor loadings for all items were above 0.50 and that the average standardized factor loading for all factors was above 0.70 (Table 1). Since no factor includes more than 10 items, the threshold for CR was maintained at 0.70 with values ranging from 0.76 to 0.92 (Table 3), and the corresponding SEM values were all below the defined threshold. Concerning AVE, the average standardized factor loadings and their respective standard deviations were used to define thresholds for each factor (Table 3). Thus, AVE is acceptable for four of the five factors, with test-irrelevant thinking showing an AVE value below the adjusted threshold. Taken together, these results demonstrate reliability at item and construct level, except for the test-irrelevant thinking factor, which shows relatively heterogeneous loadings (SD > 0.20). Cronbach’s alpha and McDonald’s omega values also indicated a satisfactory level of internal consistency for all factors (Table 3).
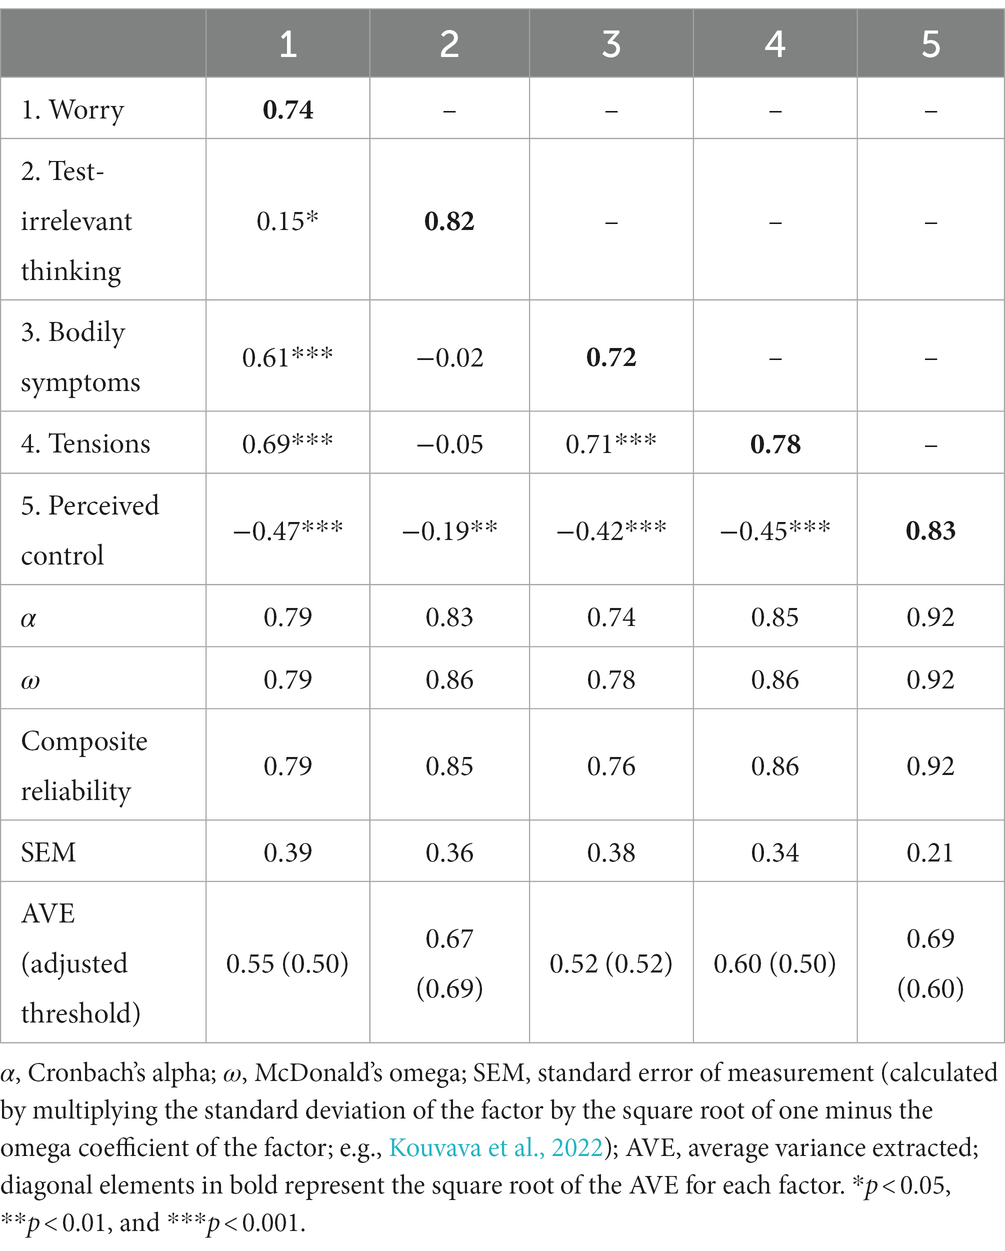
Table 3. Correlations and indices of reliability and discriminant validity for model M1.
As shown in Table 3, perceived control was negatively correlated with the other four factors of test anxiety. The lowest correlations were found between test-irrelevant thinking and two other factors (i.e., Worry and Perceived control) while the highest were found between bodily symptoms and tension which both represent the affective-physiological component of test anxiety. Moreover, test-irrelevant thinking was not significantly correlated with these two factors.
Regarding the discriminant validity of the FRTA + R, AVE square root values indicated that each factor shared more variance with its own items than with the other factors (see bolded values in Table 3), albeit somewhat limiting for bodily symptoms in relation to tension.
3.4. Multi-group analyses of invariance
Table 4 shows results of multi-group invariance analyses by gender and grade levels. These results suggested that the data was relatively well fitted. Despite slightly larger RMSEA values for girls as well as for 10th and 11th graders (i.e., 0.066, 0.077, and 0.063; respectively), goodness of fit indices supported configural invariance.
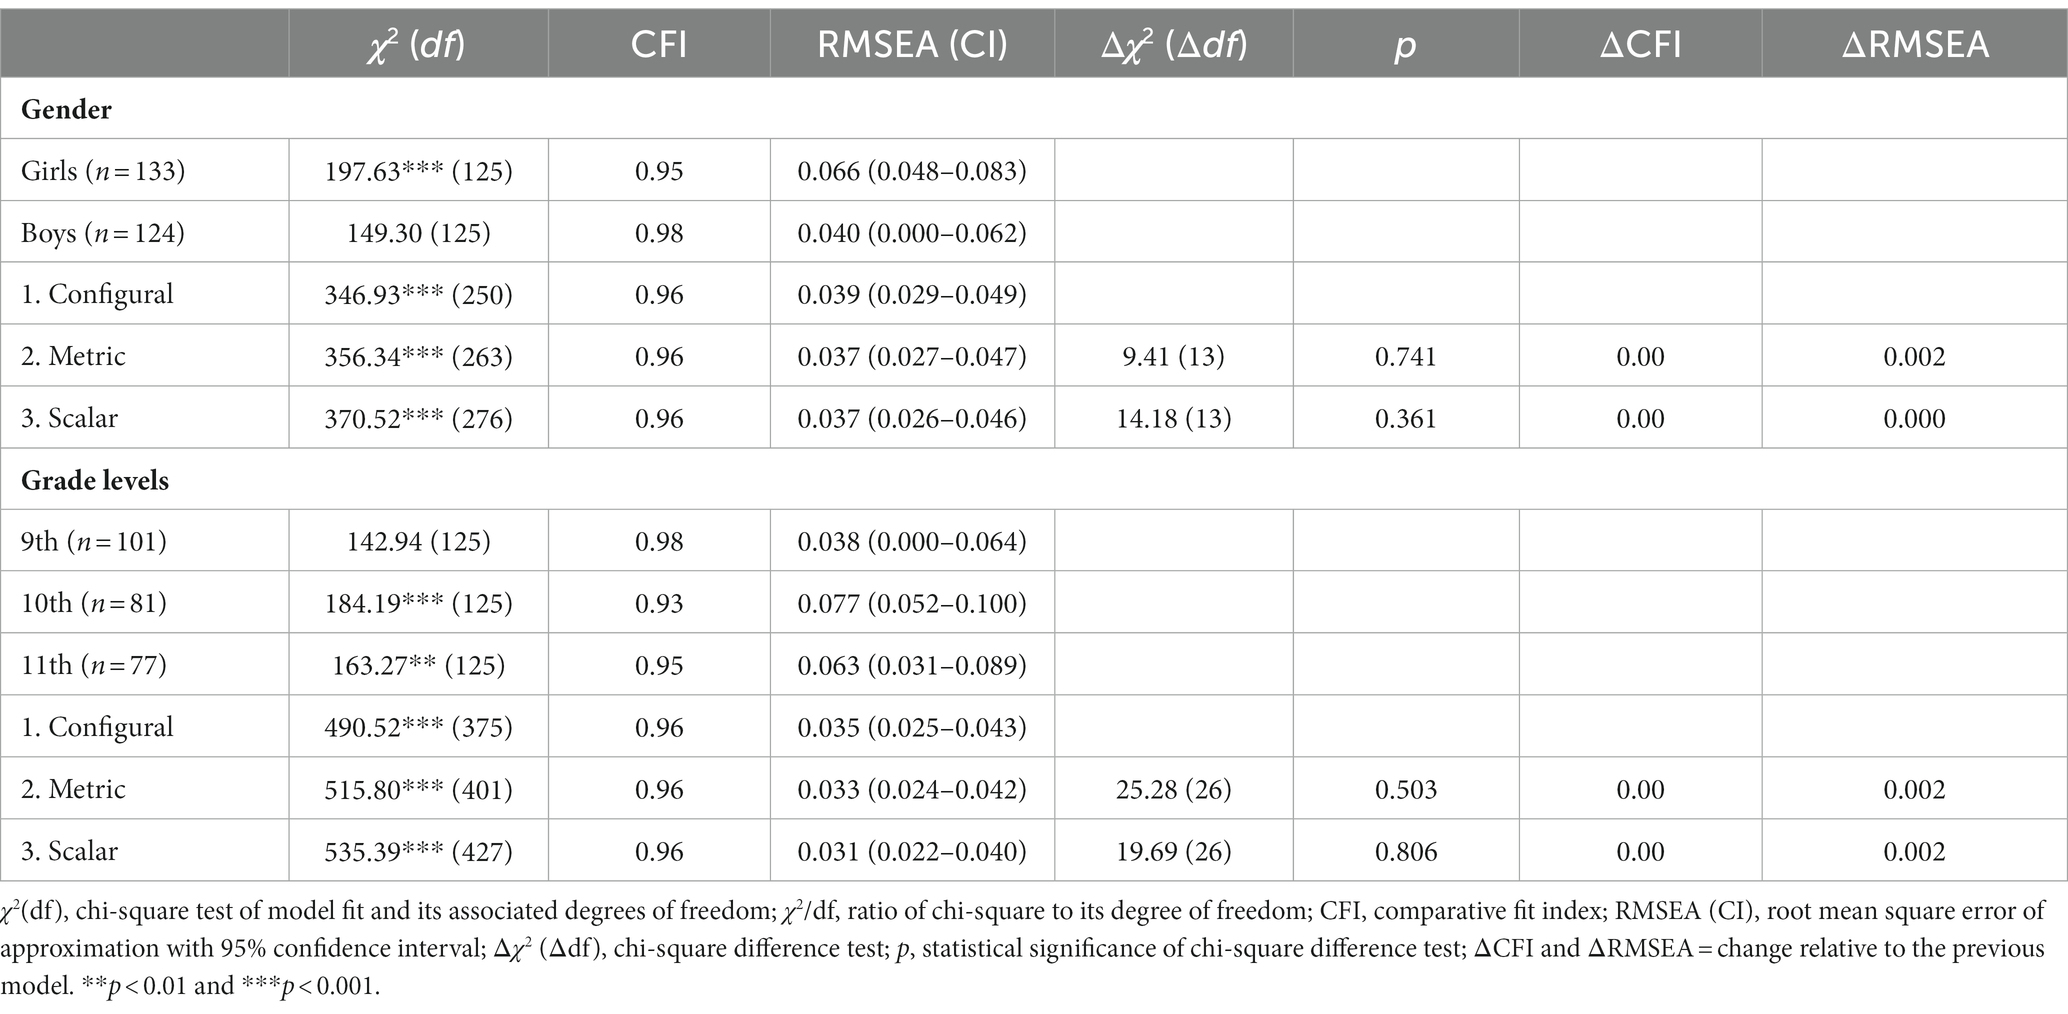
Table 4. Fit indices for measurement invariance (i.e., configural, metric, and scalar) tests across gender and grade levels for model M1.
Following confirmation of equal form across groups, metric invariance was tested. These additional constraints increased the chi-square values (gaining 13 degrees of freedom for the gender comparison and 26 for the grade levels comparison) without showing significant differences in χ2, CFI, and RMSEA and thus supporting metric invariance by gender and grade levels.
Finally, adding additional constraints to test scalar invariance also showed an increase in chi-square values with no significant change in χ2, CFI, and RMSEA between models. Thus, the fit indices also support scalar invariance by gender and grade levels, allowing us to perform latent mean comparison analyses between groups.
3.5. Latent mean differences
Findings of the latent mean comparisons between gender showed that boys scored significantly lower on Worry (CR = −4.60, p < 0.001; Cohen’s d = 0.58), Bodily symptoms (CR = −5.09, p < 0.001; Cohen’s d = 1.30) and Tension (CR = −6.06, p < 0.001; Cohen’s d = 0.78), and higher on Perceived control (CR = 6.63, p < 0.001; Cohen’s d = 0.86). No difference was found for test-irrelevant thinking (CR = 0.43, p = 0.667).
Results of the latent mean comparisons among grade levels first indicated that 9th graders scored significantly higher on Worry compared to 11th (CR = 2.85, p < 0.01; Cohens d = 0.42) and 10th (CR = 2.08, p < 0.05; Cohen’s d = 0.35) graders. The same results applied to Bodily symptoms (CR = 2.41, p < 0.05, Cohen’s d = 0.35 and CR = 2.21, p < 0.05, Cohen’s d = 0.29; respectively) and Tension (CR = 2.60, p < 0.01, Cohen’s d = 0.40 and CR = 2.16, p < 0.05, Cohen’s d = 0.30; respectively). There was no difference between the 9th graders and the other two groups in test-irrelevant thinking (CR = −1.26, p = 0.209 and CR = 0.22, p = 0.823; respectively) and perceived control (CR = −1.12, p = 0.264 and CR = −0.97, p = 0.335; respectively). In addition, no significant differences were found between 11th and 10th graders, as all CR values were above the threshold of 1.96. The means and standard deviations for each group are presented in Table 5 for reference.
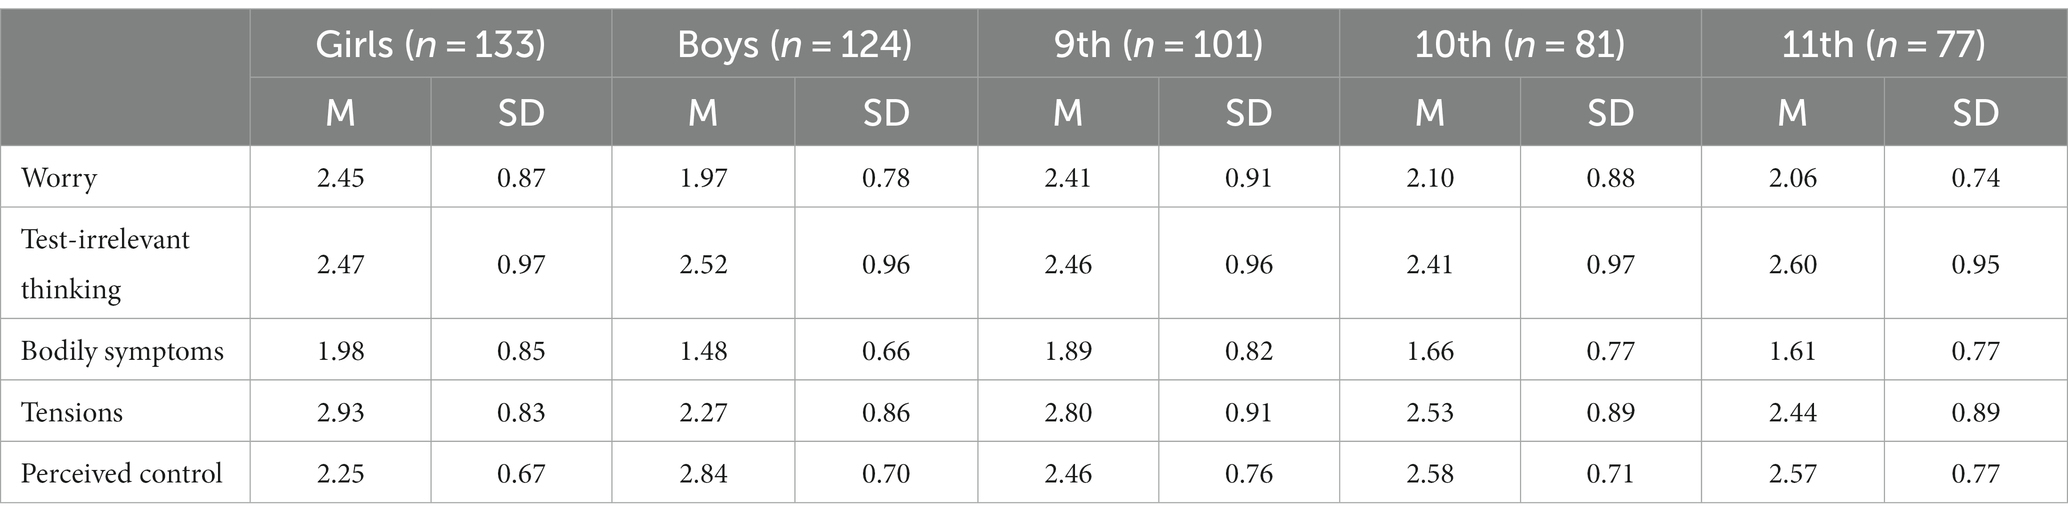
Table 5. Means (M) and standard deviations (SD) according to gender and grade levels.
3.6. Cluster analysis
A first cluster analysis was performed including the five dimensions of the FRTA + R as classificatory variables. While a 3-cluster solution appeared most appropriate, it explained only 29.22% of the variance in test-irrelevant thinking (vs. between 41.63 and 62.04% for the four other dimensions). One group consisted exclusively of individuals with high levels of test-irrelevant thinking, the other four dimensions showing moderate levels. In addition, this variable had low discriminative power compared to the others (i.e., λ = 0.86 vs. λ ≤ 0.63). Due to the lack of significant differences in latent means for this dimension across both gender and grade levels, it was removed from the analysis.
A second analysis was therefore performed with Worry, Bodily symptoms, Tension, and Perceived control entered as classificatory variables. Based on the dendrogram, a 3-cluster solution was identified, confirmed by the agglomeration schedule which showed a sudden increase in linkage distance when three clusters were merged to two clusters (from 435.36 to 573.61). This suggests that the passage from three to two clusters would have more impact on the heterogeneity of the clusters than previous steps of the analysis. Results of the discriminant analysis showed a distinction between the three clusters (Wilks’ λ = 0.11, p < 0.001) with 98% of the participants correctly classified. The highest discriminant power was reported for Bodily symptoms (λ = 0.28), followed by Worry and Tension (λ = 0.37 and 0.38, respectively) and finally Perceived control (λ = 0.58). This 3-cluster solution explained 56.50% of the variance in Perceived control, 57.53% of the variance in Worry, 57.90% of the variance in Bodily symptoms and 60.13% of the variance in Tension. Means (z-scores) of each profile are presented in Figure 1.
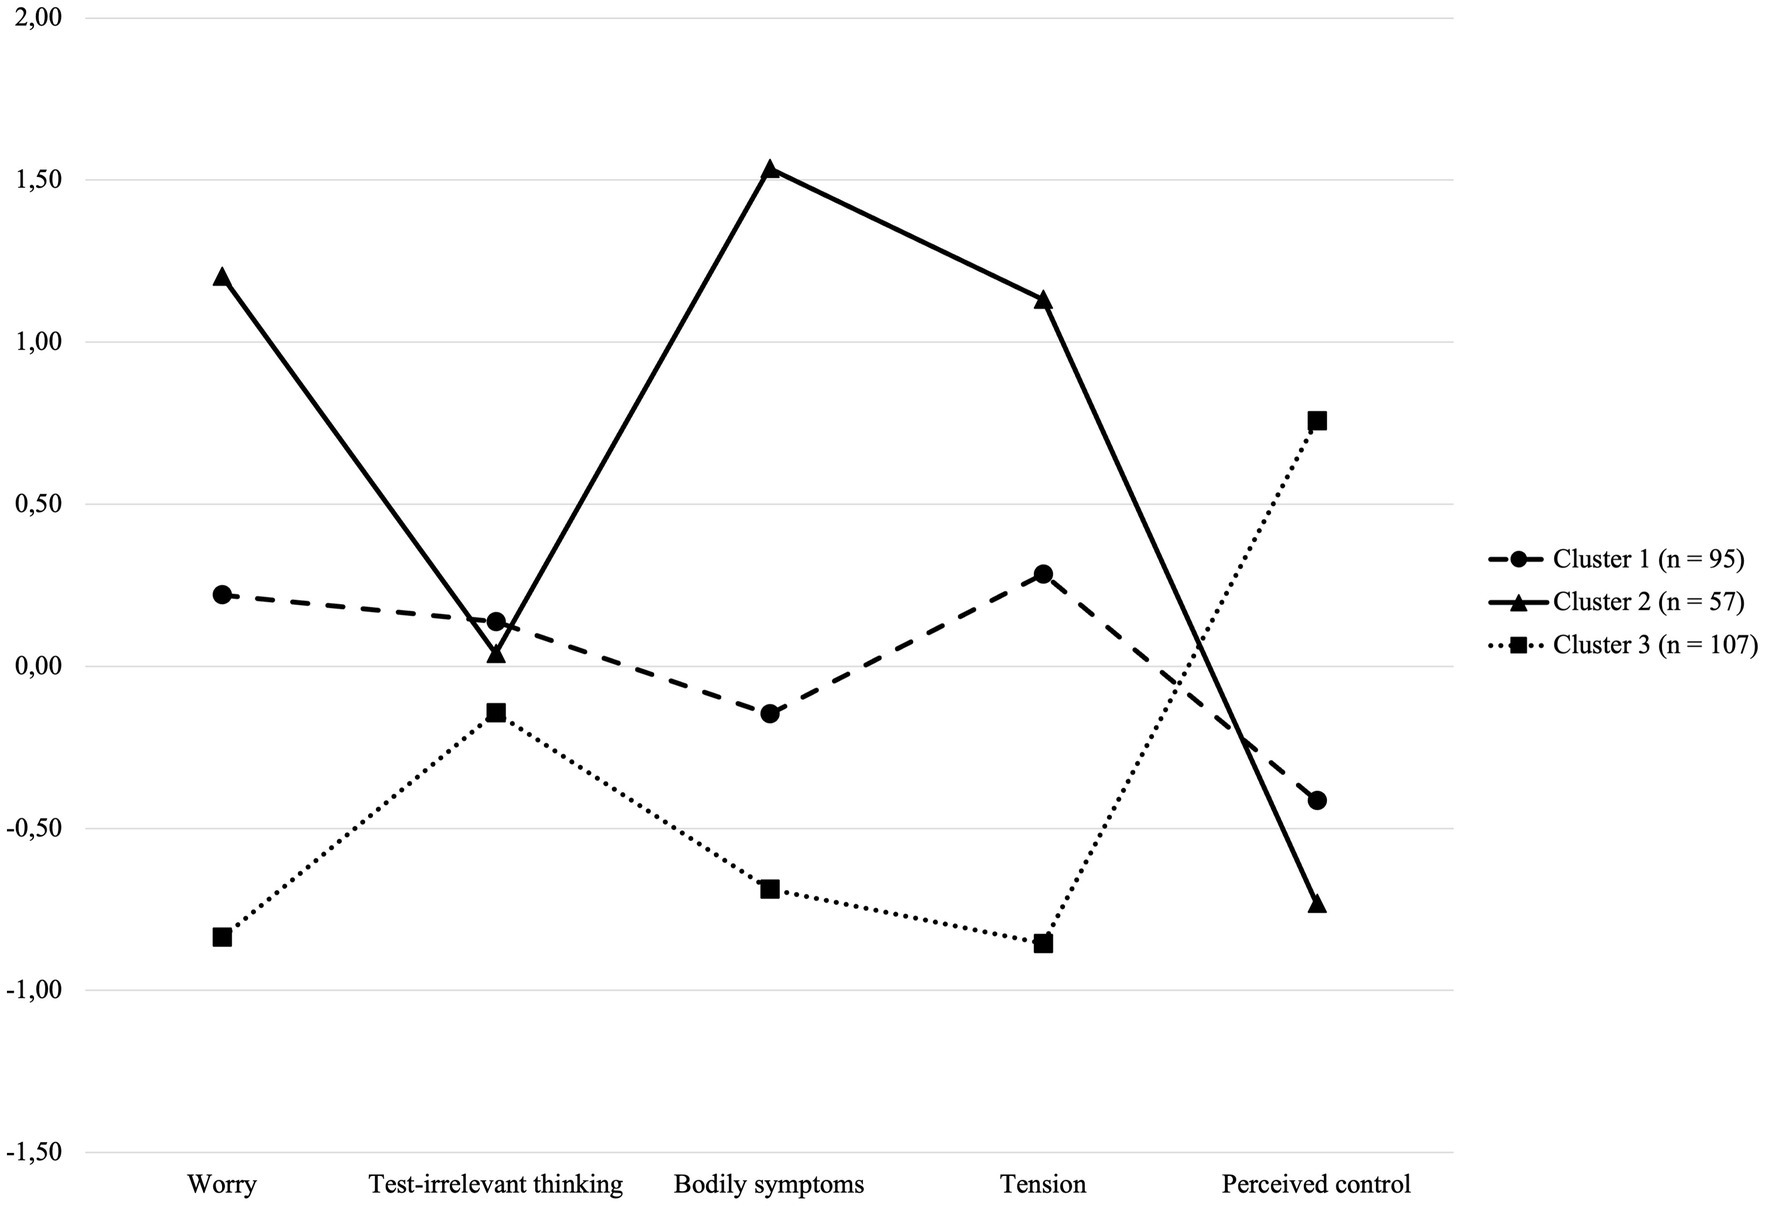
Figure 1. Mean (z-scores) of FRTA + R factors according to the three-cluster solution. Cluster 1, medium levels of test anxiety; Cluster 2, high levels of test anxiety; Cluster 3, low levels of test anxiety.
The first cluster (37% of the total sample; girls = 60%) had moderate levels on all dimensions with Worry and Tension means above the sample means by less than half standard deviation (SD) and with bodily symptoms and perceived control means below the sample means by less than half SD. The second group (22% of total sample; girls = 72%) reported high levels on all three negative dimensions of test anxiety (with means above the sample means by more than one SD) and low levels of perceived control (with a mean below the sample mean by more than half SD). The third group (41% of the total sample; boys = 66%) had high levels of perceived control (with a mean above the sample mean by more than half SD) and low levels on the other three dimensions (with means below the sample mean by more than half SD).
When considering the total sample of the study, girls seem to be overrepresented in cluster 2 (high test anxiety: 16% vs. only 6% of boys) while boys seem to be overrepresented in cluster 3 (low test anxiety: 27% vs. 14% of girls). Although girls are more present in cluster 1 (medium test anxiety: 22% vs. 15% of boys), the discrepancy appears to be relatively less pronounced. Concerning grade levels, the distribution is homogeneous within the different clusters, knowing that 9th graders are more numerically present in the total sample (i.e., 9th, 10th, and 11th graders respectively: cluster 1 = 14% vs. 11% vs. 12%; cluster 2 = 12% vs. 6% vs. 5%; cluster 3 = 14% for all grades).
4. Discussion
This study had several objectives, which will be discussed consecutively. The first objective was to explore the psychometric properties of the FRTA + R for assessing test anxiety based on self-reported experiences of Swiss secondary school students. In a second step, the factorial invariance of the scale across gender and grade levels was tested. With regard to construct validity, CFA results confirmed the multidimensional structure of the FRTA + R, in line with the original five-factor model (M1) defined by Mascret et al. (2021). The unidimensional model (i.e., M4) as well as models grouping items according to the three components (i.e., M2: cognitive, affective-physiological and regulatory) or to positive/negative dimensions (M3) of test anxiety yielded poor to mediocre fit indices. Even though item 17 of the Bodily symptoms factor had the highest positive Skewness value (indicating a right-skewed distribution), the factor loading was above the predefined threshold of 0.50, and removing this item did not significantly improve the model. As item 17 refers to an important and potentially incapacitating physiological manifestation (i.e., difficulty breathing), it may be less frequent and therefore less reported by students. The analyses also provided overall evidence of the scale’s reliability and discriminant validity, with bodily symptoms and tension strongly correlated with each other in our sample compared to the findings in the French study [i.e., 0.71 for the present study vs. 0.52 in the study conducted by Mascret et al. (2021)]. These two dimensions belonging to the affective-physiological component vary conjointly. However, it seems that bodily symptoms associated with test anxiety are consistently less frequently reported by students than feelings of tension, regardless of the group observed (e.g., according to gender or grade level; see Table 5). Although these dimensions are different, it could be that physiological manifestations (i.e., Bodily symptoms) occur simultaneously with emotional responses (i.e., related to Tension), and that the latter are more strongly perceived and therefore more easily reported. Therefore, it appears appropriate to consider these two dimensions separately, since the model combining them was unsatisfactory and some studies have shown differences in their associations with other variables of interest, such as academic self-concept (ASC) or test-taking skills (e.g., Putwain et al., 2010).
Another question, previously addressed, concerns the adequacy of the factor test-irrelevant thinking. Indeed, analyses have revealed a problem of reliability, suggesting lack of precision and stability. In addition, the significant correlation between this factor and Worry was weak and its discriminant value appeared to be low, resulting in our decision to remove it from cluster analyses. Contradictory results have already been reported, with some studies finding moderate (e.g., Putwain et al., 2010) or non-significant (e.g., Mascret et al., 2021) associations between these two dimensions of the cognitive component. Some authors have underlined the need to measure test-irrelevant thinking experienced as a source of distraction or cognitive interference (Schillinger et al., 2021), which should be inhibited in order to re-direct attention to the task at hand. However, Schillinger et al. (2021) indicate that the effect of worry would be negligible when the effect of interference by test-irrelevant thinking is controlled for. It might be that the majority of FRTA + R items relating to test-irrelevant thinking (e.g., item 9 “I think about current events during a test”) fail to capture cognitive interference, which would be more present in the Worry dimension (e.g., item 3 “During tests I find myself thinking about the consequences of failing”). Moreover, despite a relatively high frequency in our sample, test-irrelevant thinking may be more similar to “mind-wandering,” describing spontaneous thought that is less deliberately constrained than goal-directed thought and should be differentiated from ruminations, for example (Christoff et al., 2016). Interestingly, no latent mean differences were found for this factor, either according to gender or grade levels. Christoff et al. (2016) explain that mind-wandering must be distinguished from thoughts marked by a high degree of automatic constraints that operate outside cognitive control and therefore make thought excessively constraining.
Multi-group invariance analysis results confirmed that the five-factor model demonstrated adequate configural, metric, and scalar invariance across gender and grade levels, allowing effective group comparisons to be run using each dimension separately. Regarding gender differences, results of latent mean comparisons are in line with those reported in previous studies generally showing that girls reported higher levels of test anxiety with larger differences for the affective-physiological component and particularly for Tension (e.g., Putwain, 2007; Putwain and Daly, 2014; Mascret et al., 2021). However, our results showed that the effect is very strong for Bodily Symptoms compared to Tension and Worry. This may be due to a greater propensity for girls to report symptoms of anxiety (McDonald, 2001) or other negative emotions (Frenzel et al., 2007), but could also be related to perceived competence and stereotype threat (see Putwain and Daly, 2014, pp. 558–560). It is also interesting to note that, like the findings of Mascret et al. (2021), girls in our sample showed a lower level of perceived control compared to boys. Unfortunately, we lack evidence to explain this difference: it might, however, be related to the gender differences in perceived academic competence commonly reported in the literature. It appears that the concept of perceived control is close to those of academic self-efficacy and lack of confidence. Academic self-efficacy can be defined as perceived confidence or belief in one’s ability to succeed on specific academic tasks at given levels (Bong and Skaalvik, 2003), while lack of confidence is sometimes included in measures of test anxiety and corresponds to low confidence in one’s ability to perform well on a test (Raufelder and Ringeisen, 2016; Schillinger et al., 2021). According to Schillinger et al. (2021), lack of confidence could reduce the perseverance of test-anxious students, who would give up more easily when faced with difficulties. Moreover, Raufelder and Ringeisen (2016) reported a fairly strong negative correlation between lack of confidence and academic self-efficacy. Some authors (Putwain and Aveyard, 2018; Putwain and Pescod, 2018) also discuss the effects of a lack of perceived control, namely uncertain control. According to Putwain and Pescod (2018), uncertain control corresponds to a self-belief involved in evaluating test situations as representing a threat, particularly characterized by a lack of confidence in one’s abilities and an anticipation of failure. As the definitions reviewed are quite similar, there is a need for further clarification concerning perceived control dimension of test anxiety, which could possibly be considered as an antecedent of test anxiety (Spielberger and Vagg, 1995; Putwain and Aveyard, 2018; Putwain and Pescod, 2018) also related to the perception of competence which includes both academic self-concept and academic self-efficacy (Bong and Skaalvik, 2003). Nevertheless, we can observe that all these studies consider the concept of perceived control from a negative perspective (i.e., lack of confidence, uncertain control). By contrast, Bertrams et al. (2016) highlighted that students with a high self-control capacity would experience fewer symptoms of mathematics test anxiety. According to these authors, attentional self-control (which is a form of self-control) would help to cope with distracting thoughts and worries in order to focus on the task at hand. Their findings, based on a sample of German secondary school students, suggest that improving self-control could reduce anxiety-impaired cognition during test situations, while self-efficacy would have no effect. We can therefore relate this self-control capacity to the regulatory dimension of test anxiety (corresponding to feeling capable of coping and attaining goals despite the anxiety felt Mascret et al., 2021). Although the issue of perceived control as an antecedent of test anxiety needs to be clarified, the major interest of the FRTA + R scale is that it addresses this concept as a positive dimension that helps counteract the adverse effects of test anxiety. Furthermore, this dimension discriminates well between different profiles of test-anxious students, and can therefore be screened to benefit from targeted interventions aimed at improving and consolidating it.
With regard to grade levels, we might have expected higher levels of test anxiety in 11th graders, given that levels would increase with age (McDonald, 2001) and that high levels had already been observed in middle school students compared to high school students (Lowe, 2021). This final year of compulsory schooling is also marked by obtaining the school certificate, which is awarded based on the average marks obtained at the end of the year. As the school certificate in the pre-matura division gives access to all streams of post-compulsory education, it can be a decisive year for some students. Nevertheless, our results indicated that the highest levels of anxiety, tension and bodily symptoms were found among 9th graders. Given that transition from primary to secondary school has been described as a sensitive period (e.g., Bélanger and Marcotte, 2013; Richard and Marcotte, 2013), it seems necessary to specifically focus on this grade level in order to identify factors that can reduce symptoms related to test anxiety. Although the possibility of being reoriented to the general division is present in both 9th and 10th grades and can be a stressful factor for students, we did not take into account, for example, the number of students who are repeating a year or who have learning difficulties within each grade. It is therefore possible that some factors (internal to both students and schools) may have influenced the results obtained. Another interesting finding was the absence of any significant difference in Perceived control across grade levels, indicating that this type of self-belief is not necessarily related to the stakes of the grade concerned. Further studies are thus needed to explore not only the stability of perceived control levels through longitudinal data, but also its association with other variables related to the perception of academic competence (such as self-concept and self-efficacy). As perceived control is linked to the belief of having the resources to cope with test situations and to receive a good grade, it also seems important to consider test performance.
A third and final objective was to identify student profiles based on test anxiety levels, using a person-centered approach. This approach is interesting because it allows to determine whether subgroups of similar individuals exist within a given population in order to classify them into unique profiles on the basis of a selected set of variables (Howard and Hoffman, 2018), and to observe how these variables cluster identically or differently. The person-centered approach overcomes the assumption of a homogeneous population and provides more information on the relationship between symptoms. In this way, a preferred 3-cluster solution was identified, corresponding to the three levels of test anxiety previously found in past studies (e.g., Chapell et al., 2005; Thomas et al., 2018; Lowe, 2021). Our results suggest that 22% of the sample would experience high levels of test anxiety, which is consistent with the rates reported by other studies. For example, Thomas et al. (2018) jointly used latent class and cluster analyses and yielded similar preferred 3-cluster solutions, with rates of undergraduate students reporting high levels of test anxiety ranging from 25% (latent class analysis) to 22% (cluster analysis). In addition, our findings support those of the latent mean comparisons, since girls were over-represented in clusters 1 (medium) and 2 (high) while boys were over-represented in cluster 3 (low), showing the persistence of gender differences in test anxiety and the specific sensitivity of the female population. Distinctions were less marked for grade levels, although 9th graders were more likely to be included in cluster 2, which was also consistent with results from latent mean comparison analyses.
4.1. Limitations of the study
One of the major limitations of the present study lies in focusing on students’ self-reported experiences, since there is no cut-off score for identifying high levels of test anxiety (McDonald, 2001; Putwain and Daly, 2014) and it was hardly conceivable to use an experimental method for inducing test anxiety in school settings. Thus, the rate of students with high levels of test anxiety (i.e., 22.00%) may be overestimated. Although some studies have found high levels of test anxiety in approximately 16 to 18.50% of students (e.g., Chapell et al., 2005; Putwain and Daly, 2014; Lowe, 2021), the proportion found in this study is similar to those reported by Thomas et al. (2018) using cluster analyses in undergraduate students. This finding is a cause for concern given that test anxiety is currently not sufficiently considered in Switzerland as a factor impacting school achievement. Yet it is generally accepted that “highly test anxious students tend to perform worse than their low test anxious counterparts, irrespective of their ability level” (Putwain and Daly, 2014, p. 565). Another limitation concerns the exclusion of the factor test-irrelevant thinking from cluster analyses. This decision was taken not only in response to the inconclusive results of the first cluster analysis, but also because this factor remains the least associated with the other three negative dimensions of test anxiety. These results therefore raise questions about the appropriateness of including a factor that is supposed to reflect test-irrelevant thinking without including its distracting or interfering actions (Schillinger et al., 2021). Other limitations include not considering students’ performance on one or more tests, or restricting the sample to students in the pre-matura division without considering those in the general division. Consequently, our results cannot be considered in a specific context, such as a subject-specific test of particular importance to the student (e.g., related to mathematics test anxiety), and refer to more general/global test situations. Indeed, authors have discussed the fact that test anxiety levels can vary according to the value or stakes accorded to the test. A high-stakes test for the student’s schooling may result in an appraisal of the test situation as a threat and increase anxiety (Putwain and Daly, 2014), whereas a generally test anxious student may not be highly disturbed during a low-stakes test (McDonald, 2001). Thus, test anxiety is a vast topic of interest potentially involving many variables which are difficult to control for in a single study.
5. Conclusion
The results of this study underline the frequency of test anxiety among secondary school students (especially girls and 9th graders), while questioning the relevance of the test-irrelevant thinking factor. Given the present findings and the associations that have been established between test anxiety and academic achievement (e.g., Spielberger et al., 2015; Putwain and Aveyard, 2018), it seems crucial that not only practitioners in schools but also policy makers address this topic. For example, if the skills acquired to cope with test situations can influence its appraisal (Spielberger and Vagg, 1995, p. 12), we might consider that improving perceived competence would reduce the anxiety felt (Putwain and Daly, 2014). According to Putwain (2008), perceived competence remains a concept closely linked to test anxiety. In particular, this author suggests that self-confidence could act as a “bridge” in the relationship between academic self-concept and test anxiety. In this regard, Raufelder and Ringeisen (2016) found strong negative correlations between lack of confidence and and the two dimensions of perceived competence namely academic self-concept and academic self-efficacy (−0.51 and −0.54, respectively vs. between 0.02 and −0.34 for the other components of test anxiety), also reporting that academic self-efficacy and lack of confidence were not significantly correlated with Worry. Further studies should explore the relationships between these variables to clarify their direct and indirect effects on the different negative dimensions of test anxiety. This would also make it possible to examine whether an improvement in control would contribute to a reduction in test anxiety symptoms. This would then be followed by the implementation of interventions aimed at developing control strategies (e.g., controlling thoughts about potential failure, postive reappraisal, test preparation strategies), such as those proposed by the STEPs intervention (i.e., Steps to Success; Putwain et al., 2014). Another interesting direction concerns the status of error in school settings. Making errors less dramatic would not only enable teachers to assist students in their understanding and correction, but would also help them to progressively conceive tests as a way of monitoring and regulating their learning, which could indirectly influence the anxiety felt in test situations. A recent study conducted in French-speaking Switzerland by Hanin et al. (2022), with a sample of 115 secondary school students, compared two types of immediate remediation proposed during test situations (i.e., the last of the two scores is taken into account vs. conservation of the best of the two scores) with no possibility of remediation, and explored links with mathematics test anxiety. Their results showed that students reported significantly less anxiety in the condition where the best score was conserved, with a difference between conditions more pronounced in girls. These authors thus emphasize that remediation approaches which recognize the right to error, and which are easy to implement, could be effective in reducing test anxiety as well as promoting mastery goals, which could lead to improved performance. This study provides insights that we consider essential to explore and test in future work on test anxiety in secondary school students. Thus, the FRTA + R scale has proven to be a valuable, globally reliable and robust instrument for screening potential at-risk students, with low levels of perceived control associated with high levels on three of the four negative test anxiety dimensions. It appears useful for identifying groups of students who could benefit from support and targeted interventions, notably because of its ease of administration and low intrusiveness.
Data availability statement
The raw data supporting the conclusions of this article will be made available by the authors, without undue reservation.
Ethics statement
Ethical approval was not required for the studies involving humans because the study was conducted in accordance with the Code of Research Ethics for Universities of Teacher Education (CDHEP, 2002) and the International Ethical Guidelines for Health Research Involving Humans published by the Council for the International Organization of Medical Sciences (CIOMS). Data were collected in a way that preserve the anonymity of the participants. The studies were conducted in accordance with the local legislation and institutional requirements. Written informed consent for participation was not required from the participants or the participants’ legal guardians/next of kin in accordance with the national legislation and institutional requirements because in order to respect the duty to inform, each parent was informed by letter of the general objectives of the study, the identity of the supervisor (with a contact address) and the name of the institution involved, and could decline their child’s participation in the data collection. Under this condition, no refusals were recorded and the anonymity of the participants was preserved.
Author contributions
MV: Writing – original draft.
Funding
The author(s) declare that financial support was received for the research, authorship, and/or publication of this article. Open access funding by Haute école pédagogique du canton de Vaud (HEP Vaud).
Acknowledgments
Particular acknowledgments is given to the Master students for their support in collecting data.
Conflict of interest
The author declares that the research was conducted in the absence of any commercial or financial relationships that could be construed as a potential conflict of interest.
Publisher’s note
All claims expressed in this article are solely those of the authors and do not necessarily represent those of their affiliated organizations, or those of the publisher, the editors and the reviewers. Any product that may be evaluated in this article, or claim that may be made by its manufacturer, is not guaranteed or endorsed by the publisher.
Footnotes
1. ^Average student across OECD countries.
2. ^For example: 48% of students agreed or strongly agreed with the statement “I often worry that it will be difficult for me taking a test” vs. 34% with the statement “Even if I am well prepared for a test I feel very anxious.”
3. ^Concerning the study conducted by Putwain and Daly (2014), the combined proportions of students with high and moderate levels of test anxiety yields a close rate to the PISA 2015 study for the United Kingdom (OECD, 2017), which is approximately 69%.
References
Bélanger, M., and Marcotte, D. (2013). Étude longitudinale du lien entre les changements vécus durant la transition primaire-secondaire et les symptômes dépressifs des adolescents. Can. J. Behav. Sci. 45, 159–172. doi: 10.1037/a0025010
Benson, J., and El-Zahhar, N. (1994). Further refinement and validation of the revised test anxiety scale with cross-validation. Struct. Equ. Modeling 1, 203–221. doi: 10.1080/10705519409539975
Bentler, P. M. (1990). Comparative fit indices in structural models. Psychol. Bull. 107, 238–246. doi: 10.1037/0033-2909.107.2.238
Bertrams, A., Baumeister, R. F., and Englert, C. (2016). Higher self-control capacity predicts lower anxiety-impaired cognition during math examinations. Front. Psychol. 7:485. doi: 10.3389/fpsyg.2016.00485
Bong, M., and Skaalvik, E. M. (2003). Academic self-concept and self-efficacy: how different are they really? Educ. Psychol. Rev. 15, 1–40. doi: 10.1023/A:1021302408382
Brown, T. A. (2006). Confirmatory factor analysis for applied research. New York: The Guilford Press.
Byrne, B. M. (2010). Structural equation modeling with AMOS. Basic concepts, applications, and programming. New York: Routledge.
Carmines, E. G., and McIver, J. P. (1981). Analyzing models with unobserved variables: analysis of covariance structures, Social measurement: current issues, Eds. G. W. Bohrnstedt and E. F. Borgatta (Beverly Hills: Sage), 65–115.
Chapell, M. S., Blanding, Z. B., Silverstein, M. E., Takahashi, M., Newman, B., Gubi, A., et al. (2005). Test anxiety and academic performance in undergraduate and graduate students. J. Educ. Psychol. 97, 268–274. doi: 10.1037/0022-0663.97.2.268
Chen, F. F. (2007). Sensitivity of goodness of fit indexes to lack of measurement invariance. Struct. Equ. Modeling 14, 464–504. doi: 10.1080/10705510701301834
Chen, H., Dai, J., and Gao, Y. (2019). Measurement invariance and latent mean differences of the Chinese version physical activity self-efficacy scale across gender and Education levels. J. Sport Health Sci. 8, 46–54. doi: 10.1016/j.jshs.2017.01.004
Cheng, W. N. K., Hardy, L., and Markland, D. (2009). Toward a three-dimensional conceptualization of performance anxiety: rationale and initial measurement development. Psychol. Sport Exerc. 10, 271–278. doi: 10.1016/j.psychsport.2008.08.001
Cheung, G. W., and Rensvold, R. B. (2002). Evaluating goodness-of-fit indexes for testing measurement invariance. Struct. Equ. Modeling 9, 233–255. doi: 10.1207/S15328007SEM0902_5
Christoff, K., Irving, Z., Fox, K. C. R., Spreng, R. N., and Andrews-Hanna, J. R. (2016). Mind-wandering as spontaneous thought: a dynamic framework. Nat. Rev. Neurosci. 17, 718–731. doi: 10.1038/nrn.2016.113
Comşa, M. (2010). How to compare means of latent variables across countries and waves: testing for invariance measurement. An application using eastern european societies. Sociológia. 42, 639–669.
Conference of Directors of Universities for Teacher Education [CDHEP] (2002). Code of Research ethics for the universities of teacher Education. Available at: https://etudiant.hepl.ch/files/live/sites/files-site/files/filiere-ps/programmeformation/code-ethique-recherche-cdhep-2002-fps-hep-vaud.pdf
Council for international organization of medical science [CIOMS]. (2016). International ethical guidelines for Health Research involving humans. Available at: https://cioms.ch/wp-content/uploads/2017/01/WEB-CIOMS-EthicalGuidelines.pdf
Frenzel, A. C., Pekrun, R., and Goetz, T. (2007). Girls and mathematics – a “hopeless” issue? A control-value approach to gender differences in emotions towards mathematics. Eur. J. Psychol. Educ. 22, 497–514. doi: 10.1007/BF03173468
Hair, J., Black, W. C., Babin, B. J., and Anderson, R. E. (2010). Multivariate data analysis. Upper Saddle River: Pearson Education
Hanin, V., Lepareur, C., Hascoët, M., Pouille, J., and Gay, P. (2022). Quelle remédiation à l’anxiété de performance en mathématiques? Une étude comparant trois conditions d’évaluation en vue de minimiser l’anxiété mathématique. La Revue LEeE 5:e5. doi: 10.48325/rleee.005.05
Howard, M. C., and Hoffman, M. E. (2018). Variable-centered, person-centered, and person-specific approaches: where theory meets the method. Organ. Res. Methods 21, 846–876. doi: 10.1177/1094428117744021
Hu, L., and Bentler, P. M. (1999). Cutoff criteria for fit indexes in covariance structure analysis: conventional criteria versus new alternatives. Struct. Equ. Modeling 6, 1–55. doi: 10.1080/10705519909540118
Kline, R. B. (2005). Principles and practice of structural equation modeling. New York: Guilford Press.
Kouvava, S., Antonopoulou, K., Kokkinos, C. M., and Voulgaridou, I. (2022). Psychometric properties of the Greek translation of the friendship quality questionnaire. Psychol. Sch. 60, 1–21. doi: 10.1002/pits.22812
Little, R. J. (1988). A test of missing completely at random for multivariate data with missing values. J. Am. Stat. Assoc. 83, 1198–1202. doi: 10.1080/01621459.1988.10478722
Lowe, P. A. (2021). Examination of latent test anxiety profiles in a sample of US adolescents. Int. Educ. Stud. 14, 12–20. doi: 10.5539/ies.v14n2p12
Mascret, N., Danthony, S., and Cury, F. (2021). Anxiety during tests and regulatory dimension of anxiety: a five-factor French version of the revised test anxiety scale. Curr. Psychol. 40, 5322–5332. doi: 10.1007/s12144-019-00481-w
McDonald, A. S. (2001). The prevalence and effects of test anxiety in school children. Educ. Psychol. 21, 89–101. doi: 10.1080/01443410020019867
Nylund-Gibson, K., and Choi, A. Y. (2018). Ten frequently asked questions about latent class analysis. Transl. Issues Psychol. Sci. 4, 440–461. doi: 10.1037/tps0000176
Organisation for Economic Co-operation and Development [OECD] (2017). PISA 2015 Results (Volume III): Students’ Well-Being. Paris: PISA, OECD Publishing.
Putnick, D. L., and Bornstein, M. H. (2016). Measurement invariance conventions and reporting: the state of the art and future directions for psychological research. Dev. Rev. 41, 71–90. doi: 10.1016/j.dr.2016.06.004
Putwain, D. W. (2007). Test anxiety in UK schoolchildren: prevalence and demographic patterns. Br. J. Educ. Psychol. 77, 579–593. doi: 10.1348/000709906X161704
Putwain, D. W. (2008). Deconstructing test anxiety. Emot Behav Diffic 13, 141–155. doi: 10.1080/13632750802027713
Putwain, D. W., and Aveyard, B. (2018). Is perceived control a critical factor in understanding the negative relationship between cognitive test anxiety and examination performance? Sch. Psychol. Q. 33, 65–74. doi: 10.1037/spq0000183
Putwain, D. W., Chamberlain, S., Daly, A., and Sadreddini, S. (2014). Reducing test anxiety among school-aged adolescents: a field experiment. Educ. Psychol. Pract. 30, 220–240. doi: 10.1080/02667363.2014.964392
Putwain, D., and Daly, A. L. (2014). Test anxiety prevalence and gender differences in a sample of English secondary school students. Educ. Stud. 40, 554–570. doi: 10.1080/03055698.2014.953914
Putwain, D. W., and Pescod, M. (2018). Is reducing uncertain control the key to successful test anxiety intervention for secondary school students? Findings from a randomized control trial. Sch. Psychol. Q. 33, 283–292. doi: 10.1037/spq0000228
Putwain, D. W., Woods, K. A., and Symes, W. (2010). Personal and situational predictors of test anxiety of students in post-compulsory Education. Br. J. Educ. Psychol. 80, 137–160. doi: 10.1348/000709909X466082
Raufelder, D., and Ringeisen, T. (2016). Self-perceived competence and test anxiety. J. Individ. Differ. 37, 159–167. doi: 10.1027/1614-0001/a000202
Richard, R., and Marcotte, D. (2013). La relation temporelle entre l’anxiété et la dépression dans le contexte de la transition primaire-secondaire. Sante Ment. Que. 38, 257–275. doi: 10.7202/1023999ar
Sarason, I. G. (1984). Stress, anxiety, and cognitive interference: reactions to tests. J. Pers. Soc. Psychol. 46, 929–938. doi: 10.1037/0022-3514.46.4.929
Schillinger, F. L., Mosbacher, J. A., Brunner, C., Vogel, S. E., and Grabner, R. H. (2021). Revisiting the role of worries in explaining the link between test anxiety and test performance. Educ. Psychol. Rev. 33, 1887–1906. doi: 10.1007/s10648-021-09601-0
Schumaker, R. E., and Lomax, R. G. (2004). A beginner’s guide to structural equation modeling. Mahwah: Lawrence Erlbaum Associates.
Spielberger, C. D. (1966). Theory and Research on anxiety, Anxiety and behavior, (Ed.) C. D. Spielberger, New York: Academic Press, 3–20.
Spielberger, C. D. (1972). Anxiety as an emotional state, Anxiety: Current trends in theory and Research. 1, (Ed.) C. D. Spielberger, New York: Academic Press, 23–49.
Spielberger, C. D. (1980). Preliminary professional manual for the test anxiety inventory. Palo Alto: Consulting Psychologists Press.
Spielberger, C. D., Anton, W. D., and Bedell, J. (2015). The nature and treatment of test anxiety. Emotions and anxiety. New concepts, methods, and applications, Eds. M. Zuckerman and C. D. Sielberger, New York: Psychology Press, 317–344.
Spielberger, C. D., and Vagg, P. R. (1995). Test anxiety: a transactional process model, Test anxiety. Theory, assessment, and treatment, Eds. C. D. Sielberger and P. R Vagg, Washington: Taylor & Francis, 3–14.
Swiss Coordination Centre for Research in Education [CSRE] (2018). Swiss Education Report 2018. Available at: https://www.skbf-csre.ch/fileadmin/files/pdf/bildungsberichte/2018/Swiss_Education_Report_2018.pdf
Teo, T., Lee, C. B., Chai, C. S., and Wong, S. L. (2009). Assessing the intention to use technology among pre-service teachers in Singapore and Malaysia: a multigroup invariance analysis of the technology acceptance model (TAM). Comput. Educ. 53, 1000–1009. doi: 10.1016/j.compedu.2009.05.017
Thomas, C. L., Cassady, J. C., and Finch, W. H. (2018). Identifying severity standards on the cognitive test anxiety scale: cut score determination using latent class and cluster analysis. J. Psychoeduc. Assess. 36, 492–508. doi: 10.1177/0734282916686004
Tucker, L. R., and Lewis, C. (1973). A reliability coefficient for maximum likelihood factor analysis. Psychometrika 38, 1–10. doi: 10.1007/BF02291170
Valentini, F., and Damasio, B. F. (2016). Average variance extracted and composite reliability: reliability coefficients [Variancia media Extraida e Confiabilidade Composta: Indicadores de Precisao]. Psicologia: Teoria e Pesquisa 32:e322225. doi: 10.1590/0102-3772e322225
Keywords: test anxiety, confirmatory factor analysis, factorial invariance, latent mean comparison, student profiles
Citation: Valls M (2023) Exploring the psychometric properties of the French revised test anxiety + regulatory scale in Swiss secondary school students. Front. Educ. 8:1289892. doi: 10.3389/feduc.2023.1289892
Edited by:
Jerrell C. Cassady, Ball State University, United StatesReviewed by:
Paloma Cavalcante Bezerra Medeiros, Federal University of Piauí, BrazilJosé M. Pêgo, University of Minho, Portugal
Copyright © 2023 Valls. This is an open-access article distributed under the terms of the Creative Commons Attribution License (CC BY). The use, distribution or reproduction in other forums is permitted, provided the original author(s) and the copyright owner(s) are credited and that the original publication in this journal is cited, in accordance with accepted academic practice. No use, distribution or reproduction is permitted which does not comply with these terms.
*Correspondence: Marjorie Valls, bWFyam9yaWUudmFsbHNAaGVwbC5jaA==