 Kristin Michod Gagnier
 Steven J. Holochwost
 Melissa Ceren4
 Kelly R. Fisher
- 1AnLar LLC, Arlington, VA, United States
- 2Science of Learning Institute Johns Hopkins University, Baltimore, MD, United States
- 3Lehman College, The City University of New York, Bronx, NY, United States
- 4The Graduate Center, The City University of New York, New York, NY, United States
American students continue to perform poorly on national and international assessments of Science, Technology, Engineering, and Mathematics (STEM) competencies, and achievement gaps spanning racial/ethnic and socioeconomic lines emerge early and widen over time. Scholars and practitioners agree that expanding access to high-quality STEM education has the potential to improve students’ performance and reduce inequalities. Research has elucidated the critical role that students’ self-perceptions play in driving academic achievement, which has spurred the development of many educational programs and initiatives aimed at increasing students’ confidence, self-efficacy, and interest. However, our capacity to determine what programs and initiatives are effective and for whom is limited by our lack of psychometrically sound measures that assess science-related self-perceptions and interests of elementary students from diverse populations. To address this gap, we developed and tested measures of Science Self-Efficacy, Science Self-Concept, Interest in Science Activities, and Attitudes toward STEM careers in a sample of third-grade students (8–9 years) traditionally underrepresented in STEM careers (94% of our sample identified as either African American or Hispanic). We present initial evidence, from a preliminary pilot study, for the reliability and validity of these measures and reveal the multi-dimensional nature of students’ self-perceptions and interests in science. We discuss how such measurement tools will inform our understanding of the nature of young students’ science self-perceptions, how the utilization of such tools can inform educational practice, and highlight the critical importance of conducting measurement development research with diverse populations.
1 Introduction
Improving Science, Technology, Engineering, and Mathematics (STEM) education offers great promise for elevating the livelihood and future potential of America’s children, and several key indicators suggest the need for novel approaches to STEM education. The majority of U.S. students continue to perform at or below proficiency levels in math and science across elementary, middle, and high school (National Academies of Sciences, Engineering, and Medicine, 2015; Organization for Economic Co-operation and Development, 2018). Achievement disparities spanning racial/ethnic, socioeconomic, and gender lines emerge in elementary and widen over time (Reardon, 2011), leading to decreased participation and success in STEM. These sobering statistics have motivated investments to improve students’ participation and achievement in STEM, with additional focus on groups that have historically been underrepresented in STEM fields (National Academies of Sciences, Engineering, and Medicine, 2015; National Research Council et al., 2015; U.S. Department of Education, 2022). A large body of research has shown students’ self-perceptions and interests are critical drivers of participation and achievement in academic disciplines (Choi, 2005), and that interest in a subject develops over time (Schiefele et al., 1992; Hidi and Renninger, 2006; Rotgans and Schmidt, 2011). These findings have spurred investments in new programs and interventions designed to increase students’ interest, engagement, and achievement in STEM (e.g., Chittum et al., 2017; Sainz et al., 2022).
However, the lack of comprehensive, age-appropriate measures to assess elementary students’ science self-concept, self-efficacy, and interest in STEM activities and careers hinders our capacity to understand and assess how students’ science-related self-perceptions and interests change over time and in response to such interventions. Moreover, examining these factors in elementary school is essential to set students on a path toward STEM. In this paper, we detail the development of four measures of science self-perceptions, current interest in engaging in formal and informal science activities, and interest in future STEM careers in a sample of third-grade students (ages 8–9) historically underrepresented in science fields and careers (Hurtado et al., 2010).
1.1 The state of STEM education in the United States
The United States faces several significant STEM workforce and educational challenges. First, the demand for well-trained STEM workers continues to outpace the supply [Bureau of Labor Statistics, 2014; Office of Innovation and Improvement (OII), 2016]. Second, the majority of U.S. students continue to perform at or below proficiency levels in math and science across elementary, middle, and high school (National Academies of Sciences, Engineering, and Medicine, 2015; Organization for Economic Co-operation and Development, 2018). For example, only 36% of 4th graders reach proficiency levels in science and this rate drops to 22% in 12th grade [U.S. Department of Education, Institute of Education Sciences, National Center for Education Statistics, National Assessment of Educational Progress (NAEP), 2019]. From the 2015 to 2019 NAEP, data from 8th grade and 12th grade remained constant, but in fourth grade, a higher percentage scored below NAEP Basic compared to 2015, indicating scores were moving in the wrong direction even before the COVID-19 pandemic. Third, data from the National Student Clearinghouse Research Center on the impacts of the COVID-19 pandemic suggests that total postsecondary enrollment in 4-year schools declined by 3.05 percent in fall 2021, with STEM majors being most adversely impacted. Enrollment was down 7.2% in Physical Science, 5.6% in Mathematics and Statistics, and 4.2% in Biological and Biomedical sciences (National Student Clearing House Research Center, 2021) and there is evidence that enrollment rates in 2022 are worsening (National Student Clearing House Research Center, 2022).
Fourth, achievement disparities spanning racial/ethnic, socioeconomic, and gender lines emerge in elementary and widen over time (Reardon, 2011; U.S. Department of Education, Institute of Education Sciences, National Center for Education Statistics, National Assessment of Educational Progress (NAEP), 2019). For example, in the 2019 NAEP results, 4th grade White students scored an average of 163 on the science test while Black students scored 130. Similar disparities were observed between students identified has having a disability and those not (average score of 124 and 156 respectively), and students identified as English Language Learners those not identified as English Language Learners (average score of 122 and 155). The same trends are magnified in 8th and 12th grade; 12th-grade English Language learners scored an average of 99. These trends directly contribute to a continued lack of diversity in STEM occupations, as highlighted in a recent report produced by the Pew Charitable Trusts (Fry et al., 2021). Given the current trends with educational disparities worsening during the COVID-19 pandemic [U.S. Department of Education, Institute of Education Sciences, National Center for Education Statistics, National Assessment of Educational Progress (NAEP), 2022], it is probable that these disparities will worsen as well.
1.2 Self-perceptions: self-concept and self-efficacy
A significant body of work has shown that the beliefs and perceptions we hold about ourselves and our competence in a variety of domains (e.g., school, sports, physical appearance) influence our actions and behaviors. Self-concept and self-efficacy are two of the most well-researched self-perceptions, both formed and influenced by one’s experiences and interactions with the world. Self-concept refers to one’s awareness and understanding of their own self and attributes (Shavelson et al., 1976), whereas self-efficacy refers to an individual’s belief that he or she possesses the capabilities to accomplish a goal and successfully carry out a particular course of action (Bandura, 1977). While these two self-perceptions have historically been studied as separate constructs, recent work by Marsh and colleagues demonstrated the “murky” empirical distinction that exists between these two constructs, reporting that scores on measures of self-efficacy and self-concept were highly correlated in a sample of German 11 to 12-year-olds (r > 0.90; Marsh et al., 2019a, p. 331). Yet while observing that these two self-perceptions are closely related, Marsh et al. (2019a) also notes an important conceptual distinction between them: self-efficacy tends to be future-oriented (probing what a person can do in the future) whereas self-concept is based on past achievements and accomplishments.
Both self-concept and self-efficacy are conceptualized to have multifaceted hierarchical structures, with a global, general sense of self at the top and academic and nonacademic domains nested underneath (Marsh and Martin, 2011; Marsh and Scalas, 2011) that are further differentiated into subdomains (e.g., academic self-concept has subdomains in English, history, math, and science self-concepts). Academic self-perceptions have been a core domain of investigation for decades (e.g., Marsh et al., 2019b). Academic self-concept refers to a person’s knowledge and perceptions about their own academic competencies (Wigfield and Karpathian, 1991; Ferla et al., 2009). Self-concept beliefs are more general self-perceptions that can include evaluations of self or affective evaluations of one’s feelings. For example, “I am good at science” or “I look forward to science” (Beier and Rittmayer, 2008). Academic self-efficacy, on the other hand, refers to a student’s beliefs that s/he can master the knowledge and skills necessary to succeed in an academic discipline (Schunk, 1991; Ferla et al., 2009). As such, academic self-efficacy is related to both task-specific and future expectations. Academic self-efficacy judgments are often made without consideration of others’ capabilities but rather are focused on oneself (Gist and Mitchell, 1992; Bong and Skaalvik, 2003).
Decades of research have shown that self-perceptions significantly influence a person’s functioning and well-being both in school and beyond. In academic settings, these self-perceptions can predict and explain students’ motivation, behaviors, and achievement (Bong and Clark, 1999). For example, individuals with high self -efficacy in a particular academic subject, like math, tend to engage in activities and tasks they feel capable of accomplishing while avoiding those in which they feel less efficacious. Self-efficacy also influences how much people persist and persevere in challenging situations (Lent et al., 1984; Schunk, 1995). Individuals with high self-efficacy are also more likely to persist in the pursuit of desired outcomes and tend to be more resilient to setbacks. As such, academic self-efficacy influences a student’s engagement and persistence in academic activities and the resulting academic outcomes (Schunk and Pajares, 2002).
The same is broadly true of research on self-concept; studies in educational settings have shown that having a positive academic self-concept (e.g., feeling you are good at school) facilitates educational behaviors (persistence, course-work selections; Eccles, 2005), and academic achievement and attainment (Guay et al., 2004; Marsh and Craven, 2006; Pinxten et al., 2010; Chen et al., 2013; Trautwein and Möller, 2016). Meta-analyzes (Valentine et al., 2004; Huang, 2011) and longitudinal studies (Marsh and O'Mara, 2008) have also shown that academic achievement and self-concept are positively and reciprocally related to each other.
1.3 Science self-perceptions and STEM education
Research has shown the subdomains of academic self-perceptions are distinct (Marsh and Martin, 2011; Marsh and Scalas, 2011), suggesting that one can perceive oneself as more capable in in one subject than another. A handful of studies have explored students’ self-perceptions in STEM subject areas and have shown that individuals with high STEM self-perceptions perform better and persist longer in STEM disciplines relative to those with lower self-perceptions in STEM. For example, science self-perceptions and beliefs are related to STEM persistence and achievement in middle school (Britner and Pajares, 2006) and beyond. Science self-efficacy predicts a variety of academic behaviors and outcomes, including science grades in middle school (Britner and Pajares, 2001), science capacities in high school (Jansen et al., 2015a), science performance and persistence in college students (Andrew, 1998; Byars-Winston et al., 2010; Hanauer et al., 2016). Heilbronner (2011) found that self-efficacy beliefs in one’s ability to achieve in STEM predicted the choice of STEM majors in college. Students who believed that they could excel in STEM were more likely to graduate with a STEM degree compared with those of lacked these beliefs. Similarly, high-school students who express positive science self-efficacy beliefs tend to persist in STEM majors compared to those who do not express these beliefs (Shaw and Barbuti, 2010). Recently, a handful of studies has shown that self-concept in the sciences is distinguishable from self-concept in math and language (Jansen et al., 2014; Marsh et al., 2015; Jansen et al., 2015a, 2019) and that students hold differentiated beliefs across subjects such as chemistry, biology, and physics.
Evaluation of the extant literature shows several prominent gaps in the literature that limit our understanding of how science self-concept and self-efficacy develop over time. First, the majority of research has primarily focused on high school and college student populations. We were unable to find any research that examined science self-perceptions in elementary student populations, which represents a key period when students begin formal science education and influence burgeoning self-perceptions in this academic domain. Second, this age-related gap in research is likely due to the lack of developmentally-appropriate science self-perception measures. Third, research often probes general STEM self-perception beliefs rather than specific beliefs about science, and evidence suggests that students’ self-perceptions may, indeed, vary by subject. Understanding and predicting how motivational factors influence educational outcomes in the sciences is seen as critical in both research and educational practice and policy (Osborne et al., 2003; Organization for Economic Co-operation and Development, 2007; Bybee and McCrae, 2011; Taskinen et al., 2013; Jansen et al., 2015b). Despite the value of such knowledge, we currently lack age-appropriate, comprehensive measures to probe science self-perceptions in elementary school students.
1.4 Student interest in STEM
Students’ motivation to achieve in a particular subject is influenced not only by their self-perceptions but also by the value that they assign to a particular area (Wigfield and Eccles, 2000). The most common type of value belief is individual interest in a given topic or area. With respect to STEM, students’ interests in STEM fields and STEM jobs influence their pursuit of math and science courses, their performance in these courses, and their entry into STEM majors in college (Lichtenberger and George-Jackson, 2013). For example, interest in math and science in middle school influences students’ selection of high-school math and science courses (Farenga and Joyce, 1998; Köller et al., 2001). Students who express interest in STEM in eighth grade are up to three times more likely to ultimately pursue STEM degrees later in life than students who do not express such an interest (The President’s Council of Advisors on Science and Technology (PCAST), 2010). This relationship extends to high school and college. Harackiewicz et al. (2002) reported that interest predicts college students’ choice of academic major, and that interest combines with external factors to predict academic outcomes. Similarly, Maltese and Tai (2011) found that high-school students’ interest in mathematics and science is more predictive of entry into a STEM major than achievement test scores. Like science self-perceptions, less is known about elementary students’ interests in science-related activities in and out of school and how these interests are associated with future careers. Understanding interest in early elementary science is critical, as these interests have the potential to influence engagement in future STEM courses and informal learning opportunities throughout elementary, middle, and high school.
1.5 The need for measures of students’ self-perceptions in science validated with diverse populations
There is agreement amongst researchers, educators, and policymakers that expanding access to high-quality STEM education has the potential to reduce inequities in education and beyond. Efforts to improve STEM education in the U.S. were well underway prior to the pandemic (National Science and Technology Committee (NSTC), 2018), and included (1) innovative standards for science literacy (e.g., the Next Generation Science Standards), (2) novel recommendations to maximize science teachers’ instructional effectiveness (National Academies of Sciences, Engineering, and Medicine, 2015), (3) investments in STEM education and programs for underrepresented students, and (4) a research agenda focused on whether these programs can foster the development of students’ self-efficacy, self-concept, interest, and ultimately achievement in STEM fields. The continued effects of the pandemic on education renew the importance of programs aimed to foster high-quality STEM experiences for all students. Yet, understanding what programs lead to changes in students’ STEM attitudes, competencies, and achievement hinges upon having suitable measures to examine change in diverse populations.
In particular, understanding how science self-perceptions and interest in students from historically underrepresented backgrounds in STEM develop and change over time requires measures to be developed and validated with diverse populations. However, many of the measures that are most widely used in psychological research were developed with homogenous samples of White, relatively affluent students (e.g., Stewart et al., 2012). There is evidence that measures display different psychometric properties when administered to samples of students drawn from different sociodemographic and socioeconomic backgrounds, and that these differences have consequences for how we interpret the scores on those measures as well as estimating program intervention outcomes (Nagengast and Marsh, 2014; Dong and Dumas, 2020; Soland, 2021). For this reason, a priority for STEM research is to examine the psychometric properties of measures developed with diverse samples of students, beginning with these measures’ reliability and validity.
1.6 The current study
In sum, there is a lack of age-appropriate, reliable, and valid measures to assess science-related self-perceptions and interest in elementary student populations from diverse backgrounds. We took the first step to address this gap by developing new age-appropriate measures of students’ science self-efficacy, science self-concept, interest in science activities, and interest in future STEM careers. In this paper, we describe the development and preliminary pilot test of these measures with a sample of third grade students (ages 8–9) representative of a population that has historically been underrepresented in STEM careers (94% of our sample was African American and Hispanic). In this preliminary study, we focused on the measures’ reliability and validity, and addressed three specific research questions: (1) Do the measures demonstrate reliability and construct validity? (i.e., are they internally consistent and measuring what we think they should?), (2) How are scores on each of these measures distributed? and (3) Do the measures demonstrate convergent validity? (i.e., do the scores on these measures relate to one another?).
2 Methods
2.1 Participants
Participants were 204 third-grade students (54.9% female, 45.1% male; Mage = 9.09 years, SD = 0.39) attending four elementary schools in a single school district. The school district is a large (one of the 25th largest in the country), urban district that prioritizes science education, even in elementary school. While most students were African American (73.5%), participants included students who were Hispanic/Latino (20.6%), White (3.9%), Asian (1.0%), American Indian (0.5%), or Multiracial (0.5%). Five students (2.5%) were classified by the district as having a disability, and 30 (14.7%) were classified as having limited English proficiency (LEP). Over 40 % of the sample (84 students, or 41.2%) qualified for the district’s free or reduced-price meals program. Eligibility for this program is based on receipt of other benefits (Food Supplement Program or Temporary Cash Assistance) or falling within the Federal Income Eligibility Guidelines, which required that a family’s gross income be no more than 1.85 times the federal poverty level (which was $25,750 for a family of four in the year that data were collected).
2.2 Measures
Below we describe how we developed a new measure and adapted established measures for middle childhood students for use in this study.
2.2.1 Science self-efficacy scale
This 8-item survey was developed to represent two aspects of science self-efficacy highlighted in the self-efficacy literature: academic self-efficacy and perceptions of competence. Four questions were adapted from the Patterns of Adaptive Learning Scale, Academic Efficacy sub-scale by Midgley et al. (2000), which is a well-researched and reliable measure (Alpha = 0.78, Midgley et al., 2000) that probes students’ perceptions of their competence to do their class work. We modified this scale by replacing the subject area with “science” to probe science efficacy (see Table 1, items 1, 4, 5, 7). For example, the original question, “I can do even the hardest work in this class if I try” was modified to “I can do even the hardest work in science if I try.” Students rated the degree to which they agreed with each statement on a 5-point scale, ranging from strongly disagree (0) to strongly agree (4). We created four additional questions to probe student perceptions of their competence in science (see Table 1, items 2, 3, 6, 8). The framing of these four questions was informed by other measures of self-efficacy (e.g., Bandura, 2006) that were not fully reflected in the original Midgley scale and that do eliminate frame-of-reference effects by asking about things that will happen in the coming academic year. The wording of these questions was intended to phrase student competencies in ways that are common for 3rd graders (e.g., “This year I will become the best student in my class at science.”).
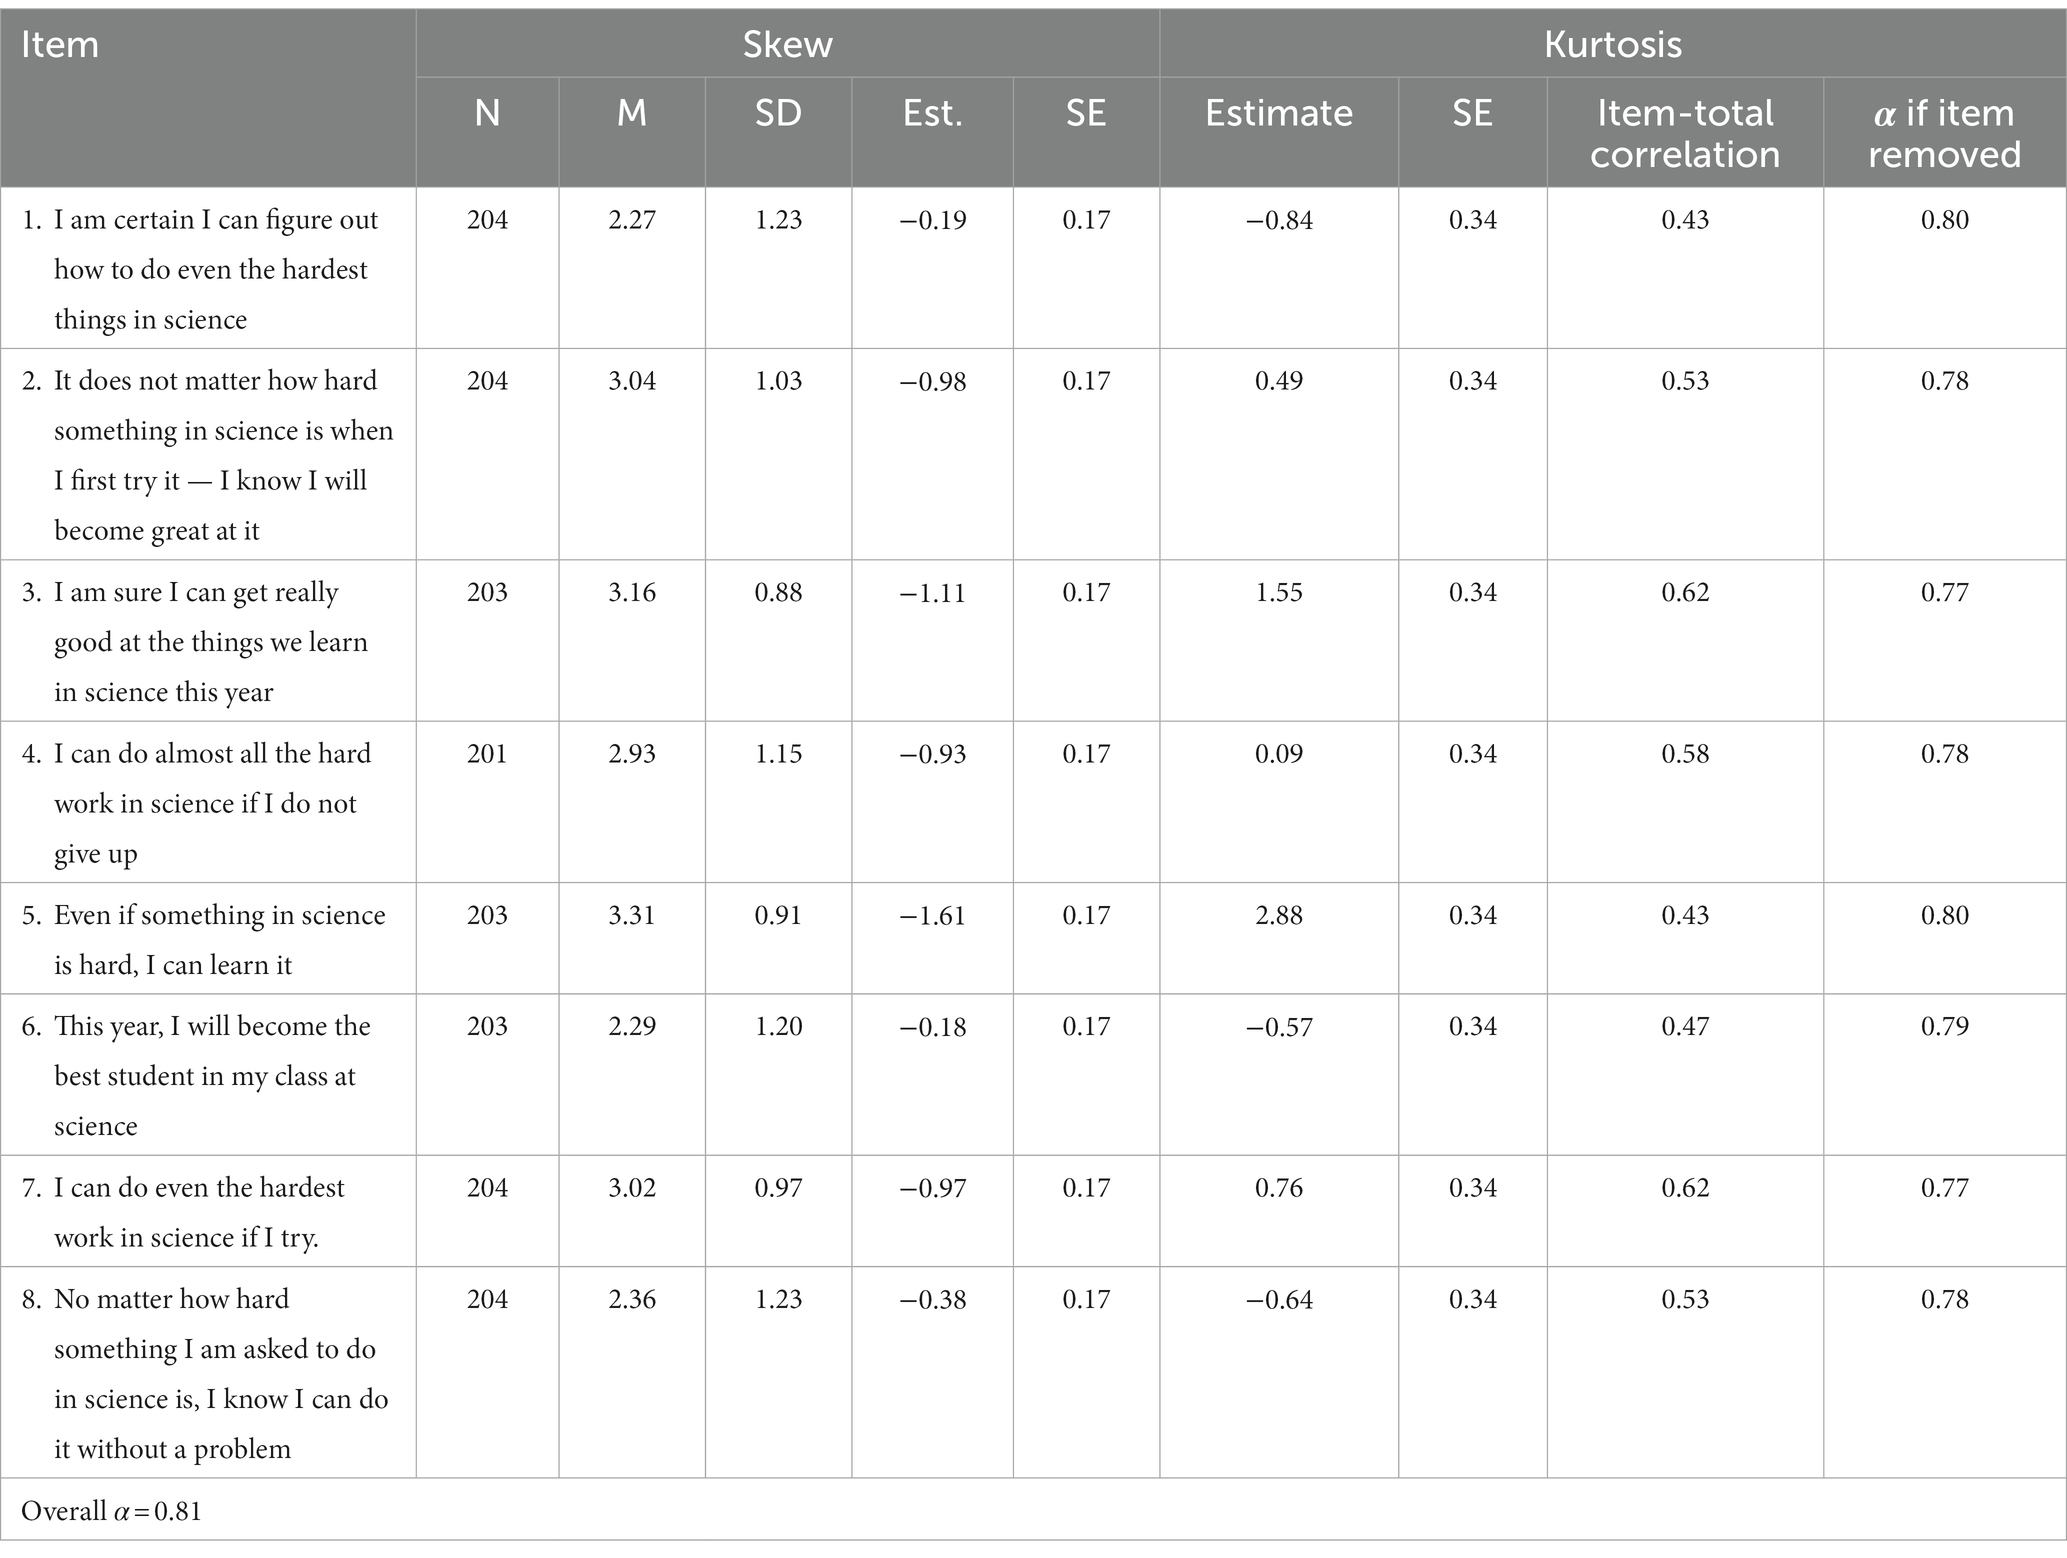
Table 1. Item descriptives, outliers, total correlations, and adjusted Cronbach’s alphas for the science self-efficacy scale.
2.2.2 Science self-concept scale
This 10-item survey was adapted from the Academic Self-Concept Scale (Marsh, 1990) to probe students’ perceptions of their own academic skills specific to science. The original measure has demonstrated reliability, with reported alphas ranging from 0.88 to 0.94 (see Marsh, 1990). We modified this scale by replacing the word “school” with “science” across each item (e.g., I am a good student in science; I learn things quickly in science). Students rated the degree to which they agreed with each statement on a 5-point scale ranging from strongly disagree (0) to strongly agree (4). Prior research with older student populations suggests this scale may assess a single global factor of science self-concept or be differentiated into two factors – perceptions of self-competence and feelings about school (affect) (e.g., Arens et al., 2011).
2.2.3 Student interest in science activities (middle childhood) scale
A 11-item survey was constructed to examine elementary students’ interest in age-appropriate, science-related activities. In middle childhood, children spend time in a range of structured and less-structured1 activities (e.g., Fletcher et al., 2003; Fisher et al., 2008; Fisher, 2009; Hofferth, 2009). Structured activities are more formal in nature, reflecting activities that are organized by an adult and include parameters or conventions of engagement aimed at achieving a particular goal (e.g., formal lessons in school, science club activities). Unstructured, or less-structured, activities are more informal, reflecting those that are more self-directed and have few, if any, specified goals (e.g., reading books, free-play exploratory activities). Drawing on this framework and focus groups conducted with 3rd–5th grade teachers in our partner district, we identified ten structured and less-structured science-related activities that students may engage in during this age (e.g., participating in a science club after school, where kids use science to solve problems, invent things, or compete in science challenges; Reading books that tell you how to do science activities at home). Students rated their level of interest in each type of activity, on a 5-point scale ranging from not at all interested (0) to extremely interested (4). They were also given an “I do not know” option if they were unfamiliar with the described activity. The measure is presented in full in Supplementary Appendix A.
2.2.4 Student attitudes toward STEM careers scale
(S-STEM Upper Elementary Your Future Survey). We adapted the S-STEM -Your Future survey (Friday Institute for Educational Innovation, 2012) for early elementary students. This is a 12-item questionnaire that describes different types of work that students can do when they are older in specific STEM fields (physics, environmental science, biology, veterinary medicine, mathematics, medicine, earth science, computer science, medical science, chemistry, energy and electrical science, and engineering). Students rated their level of interest in doing each type of work when they are older on a 5-pt scale, ranging from not at all interested (0) to extremely interested (4). They were also given an “I do not know” option. Given the original measure was developed for 4th-5th grade student use, we made small adaptations to make it more appropriate for 3rd graders on select 7 of the 12 items (see Supplementary Appendix). We simplified wording and expanded the descriptions of the professions to reduce ambiguity and variations in students’ interpretations of the descriptions, particularly given that 3rd graders may not be familiar with different aspects of the professional work, as seen below. When possible, we opted for expansions that mapped onto concepts and practices outlined in the Next Generation Science Standards (NGSS), which students in our district partner were familiar with. For instance, in the example below, we expand the description of environmental work to include “inventing solutions to these problems,” which is highlighted in NGSS.

2.3 Procedure
Students completed the battery of surveys during a 30-min session that was administered in the following order: Science Self-efficacy Scale, Science Self-concept Scale, Student Interest in Science Activities (Middle Childhood) Scale, and Student Attitudes Toward STEM Careers Scale (S-STEM Upper Elementary Your Future Survey). The measures were group administered in the classroom by a team of two researchers. Before beginning the surveys, students were encouraged to think about how they (not others) feel about each statement and were assured that there were no right or wrong answers and to answer what is true for themselves. Students were given a single, paper-and-pencil packet of all measures and one of the research team members led students through each measure, reading each statement aloud (while students followed along silently) and pausing for students to circle their response before moving on to the next statement for each measure. The team member read each statement twice pausing between each to ensure students had a chance to follow along and understand the statement. While one member of the research team read each statement according to an experimental script, the other team member walked around the classroom ensuring that students were on the correct statement and circling an answer choice for each statement. Students were told that the team would like to learn more about their feelings about and interests in school and science and that all students will have different answers because everyone has different feelings. See the Supplementary Appendix for specific instructions provided for each measure.
2.4 Data analysis
To establish initial evidence for the reliability and validity of these measures, data analysis steps were designed to answer our research questions:
2.4.1 Do the measures demonstrate reliability and construct validity?
To answer these questions, first, we established the reliability of each measure to examine its internal consistency. Internal consistency is a measure of whether students’ responses to all the items in each measure cohered or constituted a logical (or literally, internally consistent) pattern. The internal consistency of each measure was assessed by calculating (1) Cronbach’s alpha for each scale and (2) inspecting the change in Cronbach’s alpha if any item was removed from the measure.
Next, we estimated a series of exploratory and confirmatory factor analytic models to examine the construct validity of each measure (i.e., an assessment of whether each scale measures what it is intended to measure). Even when the items that comprise a measure demonstrate a relatively high degree of internal consistency, it is possible that those items capture multiple related constructs, such as different specific aspects or components of science self-concept. A commonly used approach to establishing construct validity is to conduct a factor analysis of the items that comprise a given scale (DiStefano and Hess, 2005). The results of a factor analysis suggest whether these items cohere as a single “construct” (e.g., self-efficacy; mathematical skill), or whether multiple constructs may be present. In this study, factor analyzes proceeded in two stages: first, we conducted an exploratory factor analysis (EFA) to obtain a range of the number of constructs (also referred to as factors or latent variables) that a particular measure may be assessing, and to provide an initial sense of which items might be measuring the same construct for those measures that seemed to assess at least two constructs. We then estimated a series of confirmatory models based on the results of the exploratory factor analyzes.
The goals of our confirmatory factor analysis (CFA) were to identify a model for each measure that: 1) was a good fit2 to the data (where “data” corresponds to the pattern of children’s responses to the items that comprised the measure); 2) was reasonably parsimonious (given that adding more factors to the model will improve fit, but at the expense of parsimony); and that 3) yielded an interpretable factor structure or pattern of associations (i.e., factor loadings) between items and underlying constructs. For example, if the exploratory factor analyzes indicated that the particular measure might be assessing one or two constructs, we would estimate both one- and two-factor confirmatory models. For the one-factor confirmatory model, we would specify that all the measure items would be associated with (or “load on”) the factor representing the single construct the measure assessed. For the two-factor model, we would specify which items loaded on which of the two factors or constructs. These factor analytic models allowed us to determine the most appropriate approach to calculate score(s) for a measure. We would calculate an overall score for a measure that assesses a single construct or calculate a set of sub-scale scores for a measure that assesses multiple constructs.
2.4.2 How are scores on each of these measures distributed?
Guided by this confirmatory factor analysis, we report descriptive statistics and the distribution of scores for each measure and the subscales identified by the factor analysis. These statistics allow for an examination of any problematic psychometric properties (e.g., “ceiling effects”) and can serve as a reference for future researchers who may seek to use these measures in their own work.
2.4.3 Do the measures demonstrate convergent validity?
We conducted a preliminary exploration of the convergent validity of the scales and subscales assessed by our measure. Convergent validity explores whether two measures that should be related to each other (e.g., height and weight) are, in fact, related. Drawing upon subscales of each measure identified by our confirmatory factor analysis, we examine correlations between subscales to determine how related these measures are.
3 Results
As our intended audience is both STEM educational researchers as well as practitioners who might use these measures in a program evaluation, we frame our results relative to the research questions outlined in the introduction and data analysis sections. For simplicity, we present confirmatory models below and exploratory models in the Supplementary material.
3.1 Do the measures demonstrate reliability and construct validity?
3.1.1 Science self-efficacy scale
3.1.1.1 Step 1: internal consistency
Descriptives, outliers, total correlations, and adjusted Cronbach’s alphas for the Science Self-Efficacy Scale are shown in Table 2. As can be seen in the table, the overall Cronbach’s alpha was 0.81, which is above the threshold of 0.70 established by Nunnally (1978) for an acceptable level of internal consistency. As can be seen in the right-most column, removing individual items did not result in large improvements in Cronbach’s alpha, which indicates that removing individual items would not improve internal consistency. It is also evident in Table 2 that the item-total correlation for each item ranges from 0.43 to 0.62, providing an initial indication that the scale may be assessing a single construct.

Table 2. Summary of fit indices for exploratory and confirmatory factor models.
3.1.1.2 Step 2: construct validity
Based on the results of the exploratory factor analyzes (see Supplementary material), a 1-factor confirmatory model was fit to the data, in which all items loaded on a single construct, science self-efficacy. While the RMSEA (0.08, 90% CI = [0.05, 0.11]) and SRMR (0.05) indicated an acceptable model fit, the data suggest a marginal fit due to CFI (0.93) and TLI (0.91) values below the thresholds established by Hu et al. (2022). The results of the confirmatory analysis more closely revealed that allowing the error terms (or residual variances) of items 4 and 7 to covary would improve the fit of the model (that is, an inspection of the modification index indicated that this would reduce X2 by 13.87). This modification had a sound conceptual basis, in that items 4 and 7 were likely to share residual variance due to the similarity in the phrasing of the items (i.e., both items referred to the being able to complete “the hard work in science” or “the hardest work in science;” see Table 1). Therefore, we made this change and re-estimated the model, which resulted in a model that was a very good fit to the data. As shown in the top row of Table 3, the RMSEA and SRMR are both below.08 and the TLI is at 0.95.
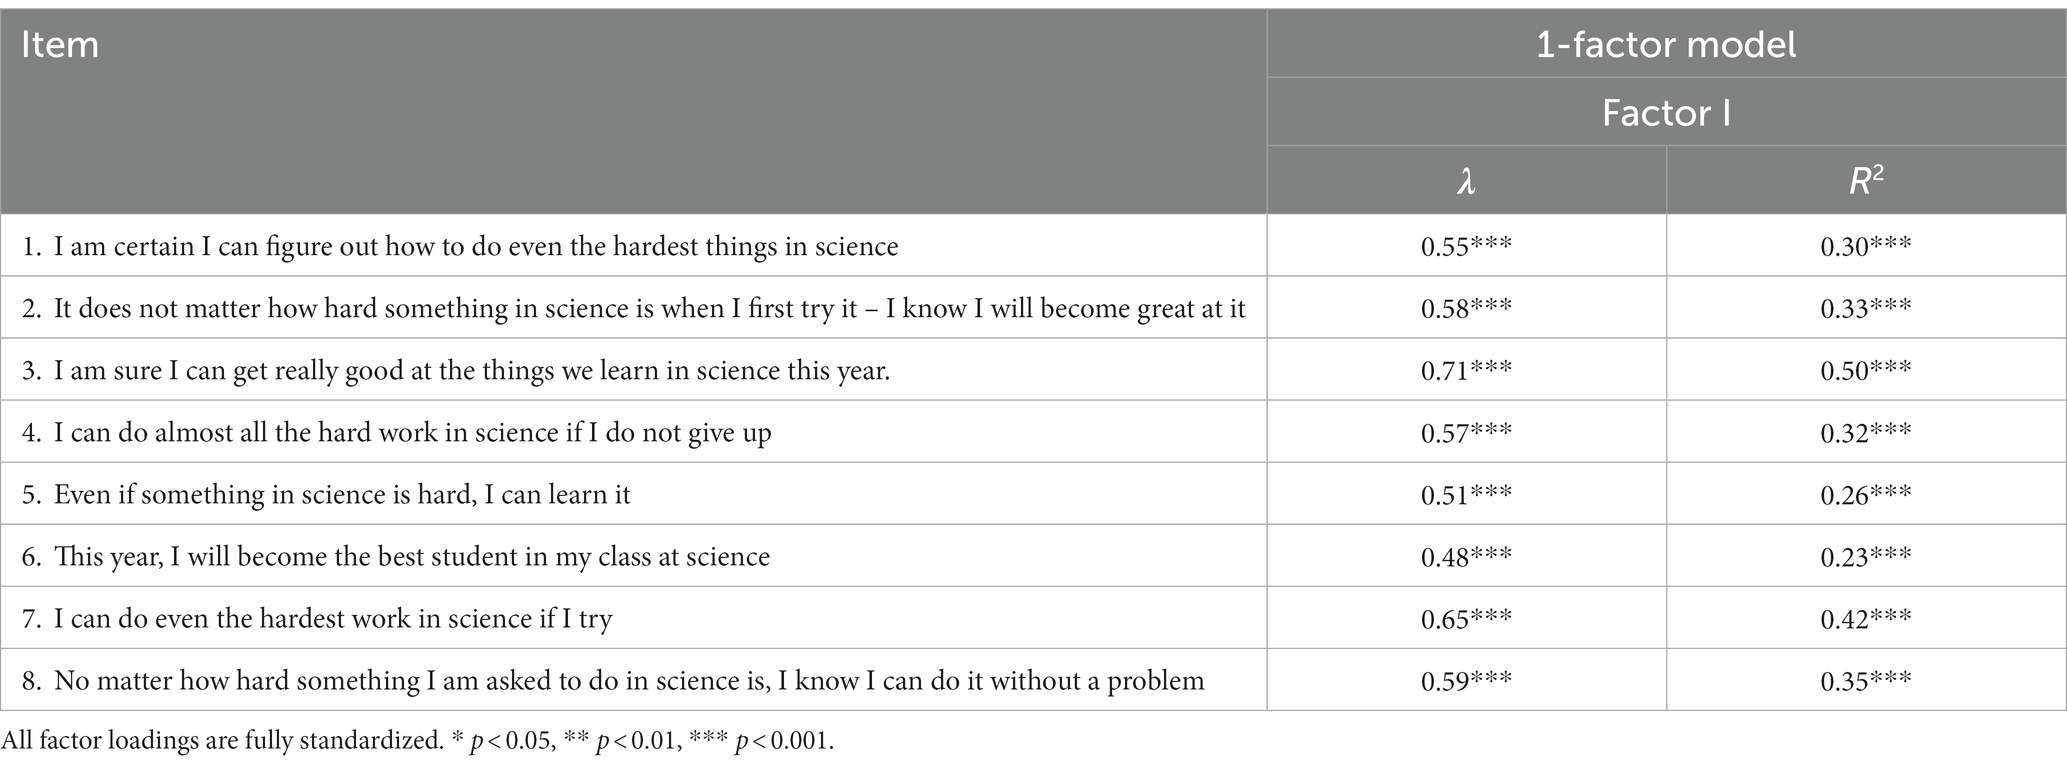
Table 3. Summary of factor structures for final confirmatory factor models of science self-efficacy.
The factor loadings displayed in Table 1 indicate how strongly related each item was to the underlying construct of science self-efficacy. These loadings are fully standardized, and therefore can fall between −1 to 1 and can be interpreted much like a Pearson correlation coefficient (r). Here the values of the loading ranged from 0.48 to 0.71, with only the loading for item 6 falling below the threshold of 0.50 established by Comery and Lee (2013) for a “good” factor loading. All loadings were statistically significant (p < 0.001). The proportion of variance in each item accounted for by its respective factors (R2) ranged from 0.23 to 0.50, and all proportions were also significant (p < 0.001). Based on these findings, we determined that this 8-item scale reflects a single science self-efficacy construct (i.e., these items displayed a unidimensional factor structure).
3.1.2 Science self-concept scale
3.1.2.1 Step 1: internal consistency
As shown in Table 4, the overall Cronbach’s alpha was 0.86. As can be seen in the right-most column, removing individual items did not result in large improvements in Cronbach’s alpha. As can be seen in the right-most column, removing individual items would not improve internal consistency. Table 4 shows that the item-total correlation for each item ranges from 0.47 to 0.69.
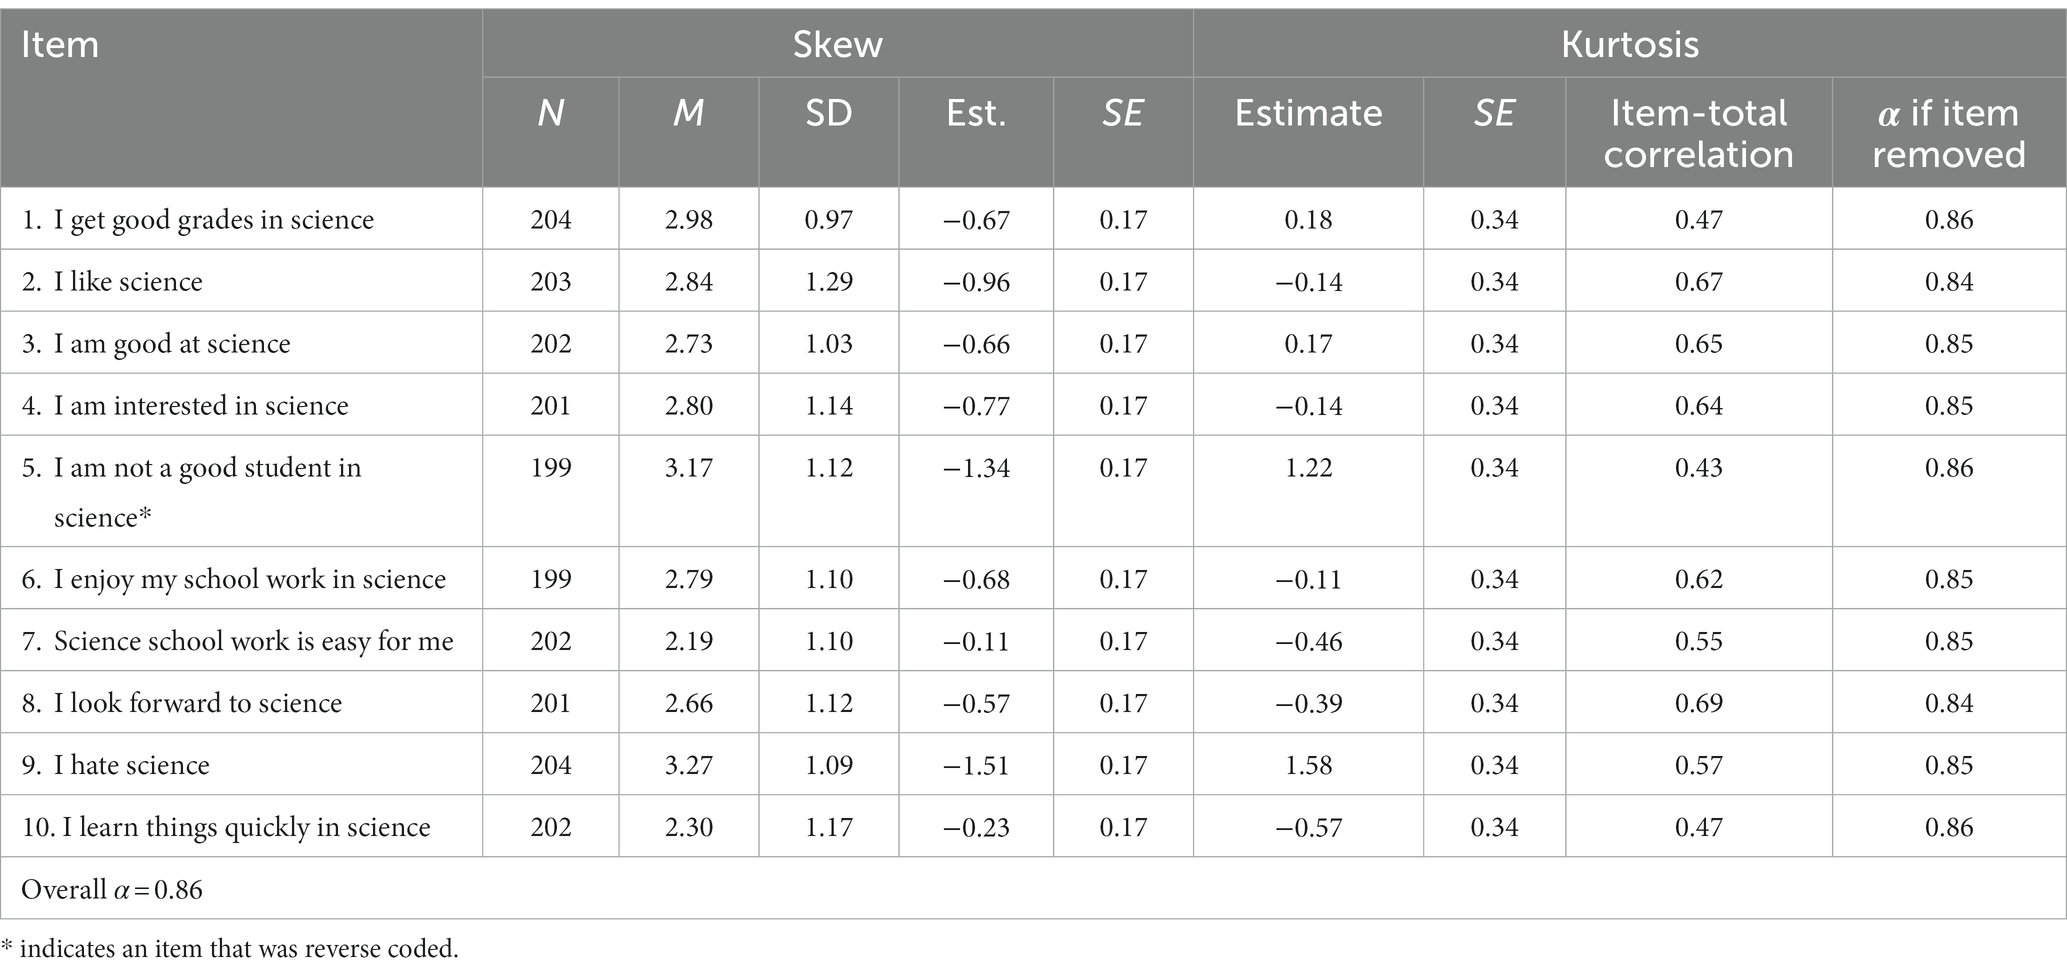
Table 4. Item descriptives, outliers, total correlations, and adjusted Cronbach’s alphas for the science self-concept scale.
3.1.2.2 Step 2: construct validity
Based on the results of the exploratory factor analyzes (see supplementary materials), two confirmatory models were estimated: a 1-factor model in which all items loaded on the single factor, and a 2-factor model in which items 1, 3, 5, 7, and 10 loaded on factor 1 and items 2, 4, 6, 8, and 9 loaded on factor 2. Both models are shown in Table 3. As can be seen, the 1-factor model was a marginal fit to the data, but the 2-factor model was an excellent fit to the data, and a significant improvement over the 1-factor model, as indicated by the results of a LRT (ΔX2 (1) = 113.9, p < 0.001).
The factor loadings for the 2-factor model are displayed in Table 5. All the loadings were statistically significant (p < 0.001), and only one loading (item 5 on factor I) fell below the threshold for a “good” loading (0.55; Comrey and Lee, 2013). The proportion of variance in each item accounted for by its respective factors (R2) ranged from 0.23 to 0.75, and all proportions were also significant (p < 0.001). Based on these results, we determined that the measure of Science Self-Concept assessed two constructs. Factor I included items related to Perceptions of Science Competence (e.g., I am good at science) while Factor II included items related to Feelings about Science (Science Affect). Sub-scale scores for each of these constructs were calculated as the mean of the items that loaded onto each factor. Values of Cronbach’s alpha for Factors I and II were 0.77 and 0.88, respectively.
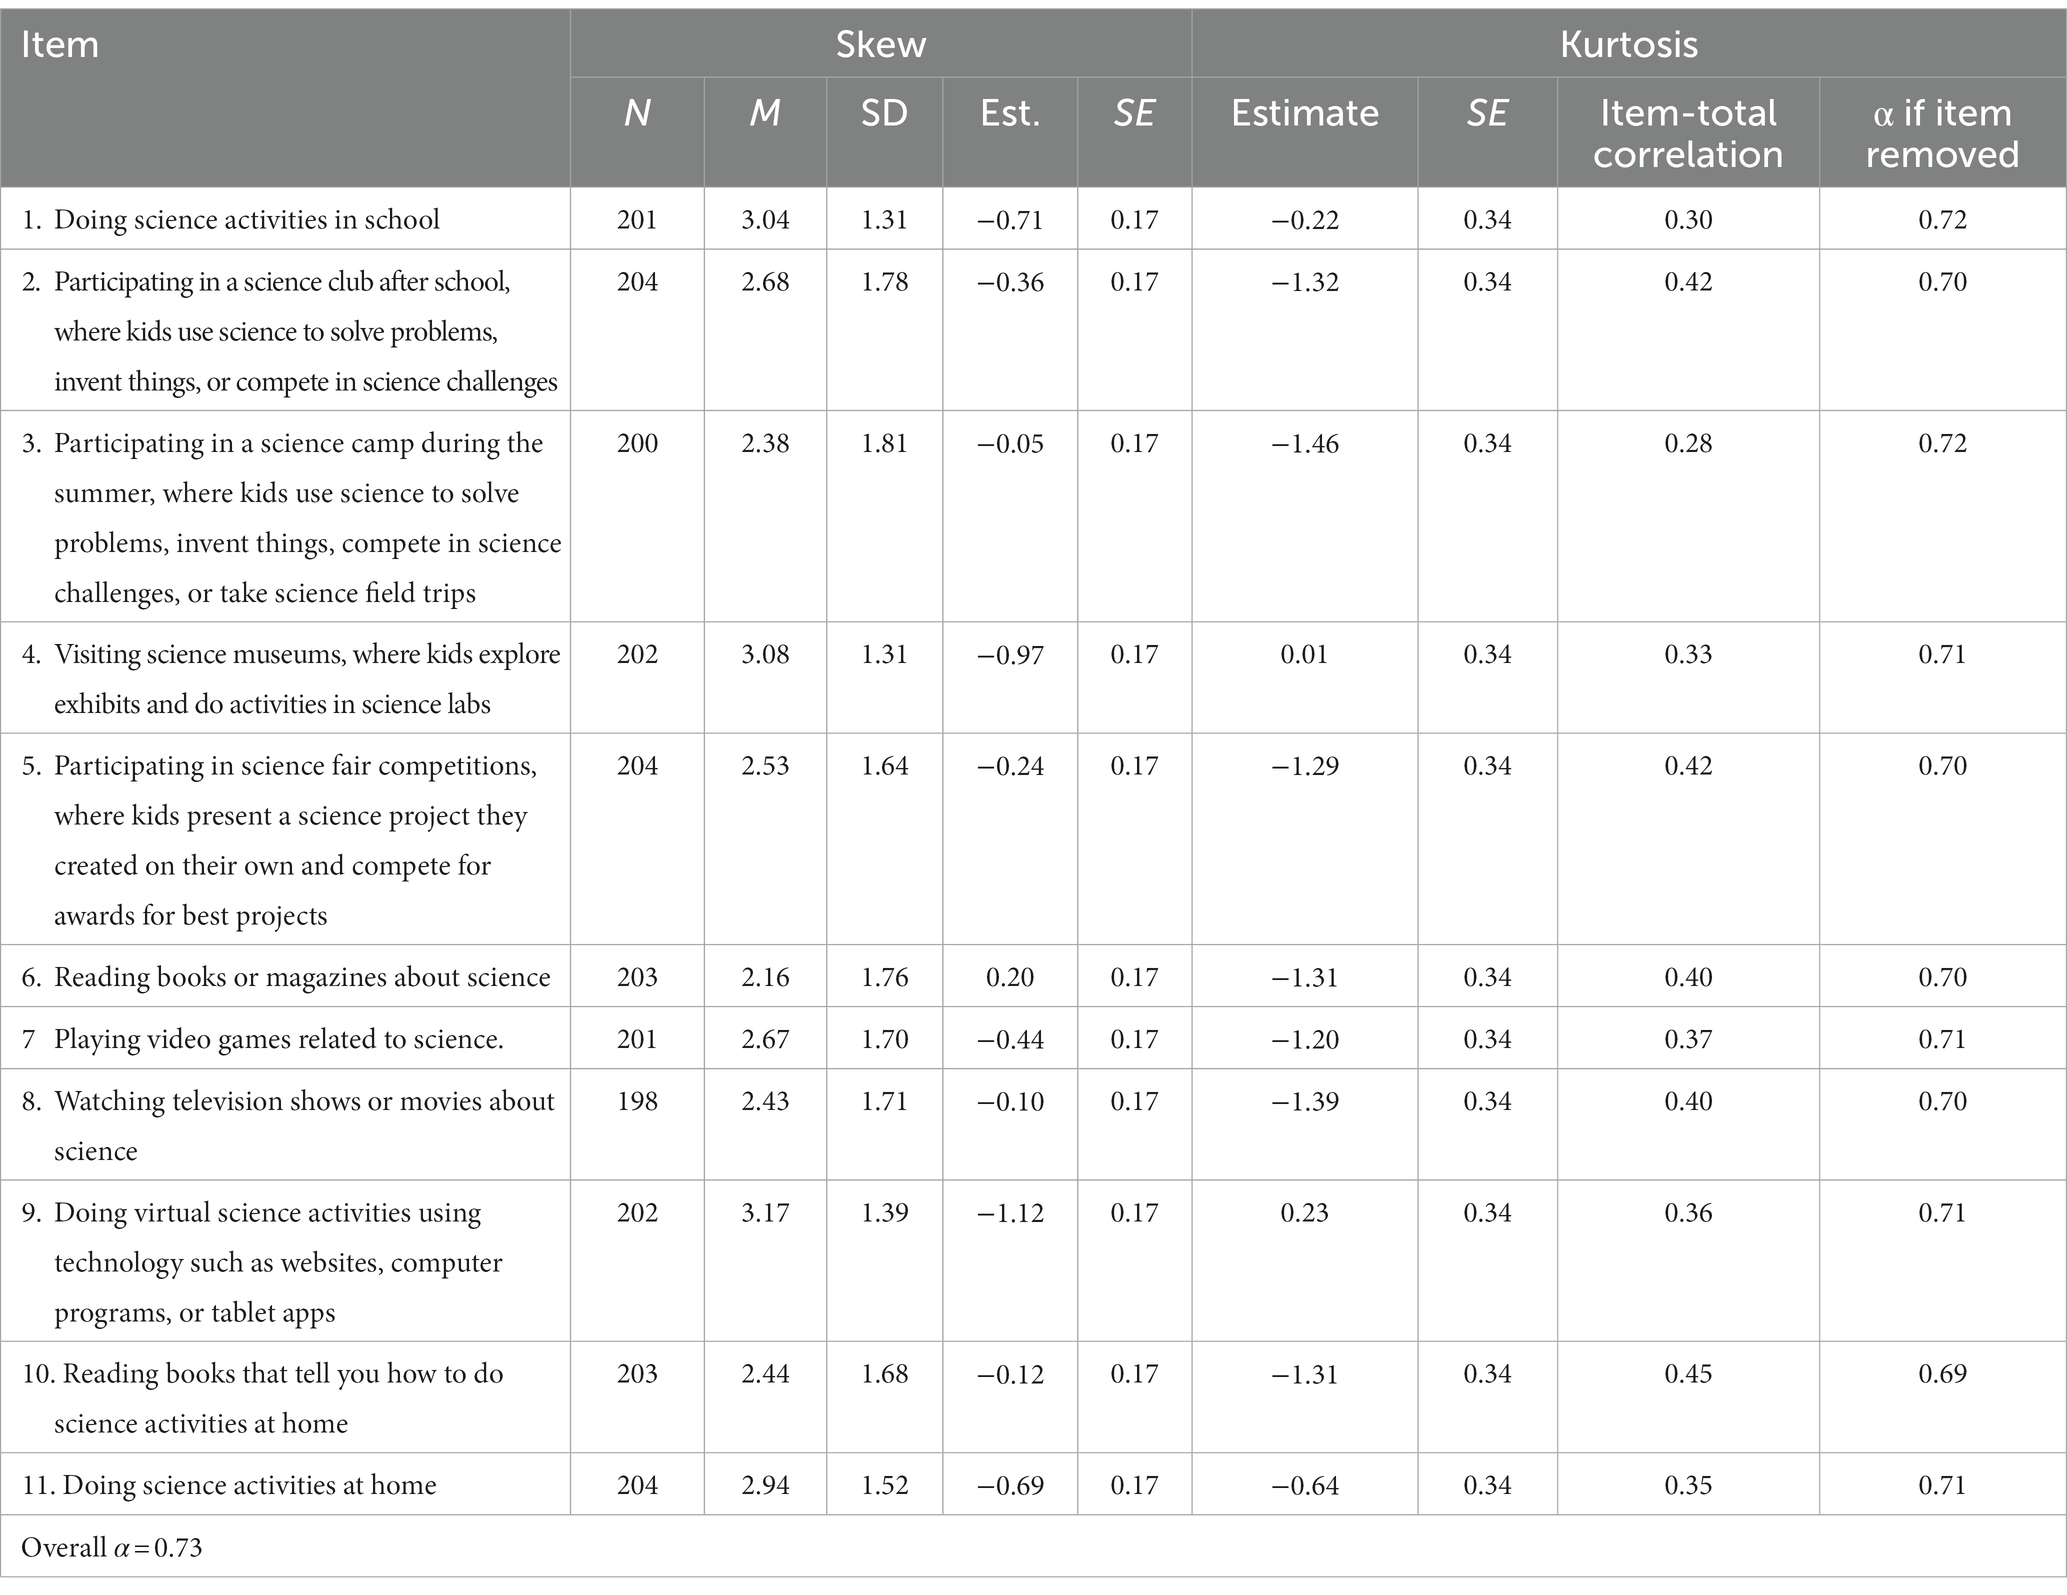
Table 5. Summary of factor structures for final confirmatory factor models of science self-concept.
3.1.3 Student interest in science activities (middle childhood) scale
3.1.3.1 Step 1: internal consistency
As shown in Table 6, the overall Cronbach’s alpha was 0.73 and removing individual items did not result in large improvements in Cronbach’s alpha. Also evident in Table 6 is the item-total correlation for many items are lower than those for science self-efficacy and self-concept measures (ranging from 0.28 to 0.42) indicating that the scale may be assessing multiple constructs. Twenty-two responses across 2,244 possible responses (11 items X 204 participants) were not included in analyzes for internal consistency because these responses were missing (n = 14, or 0.62% of possible responses) or because participants selected the “I do not know” response option (n = 8, or 0.36% of responses).
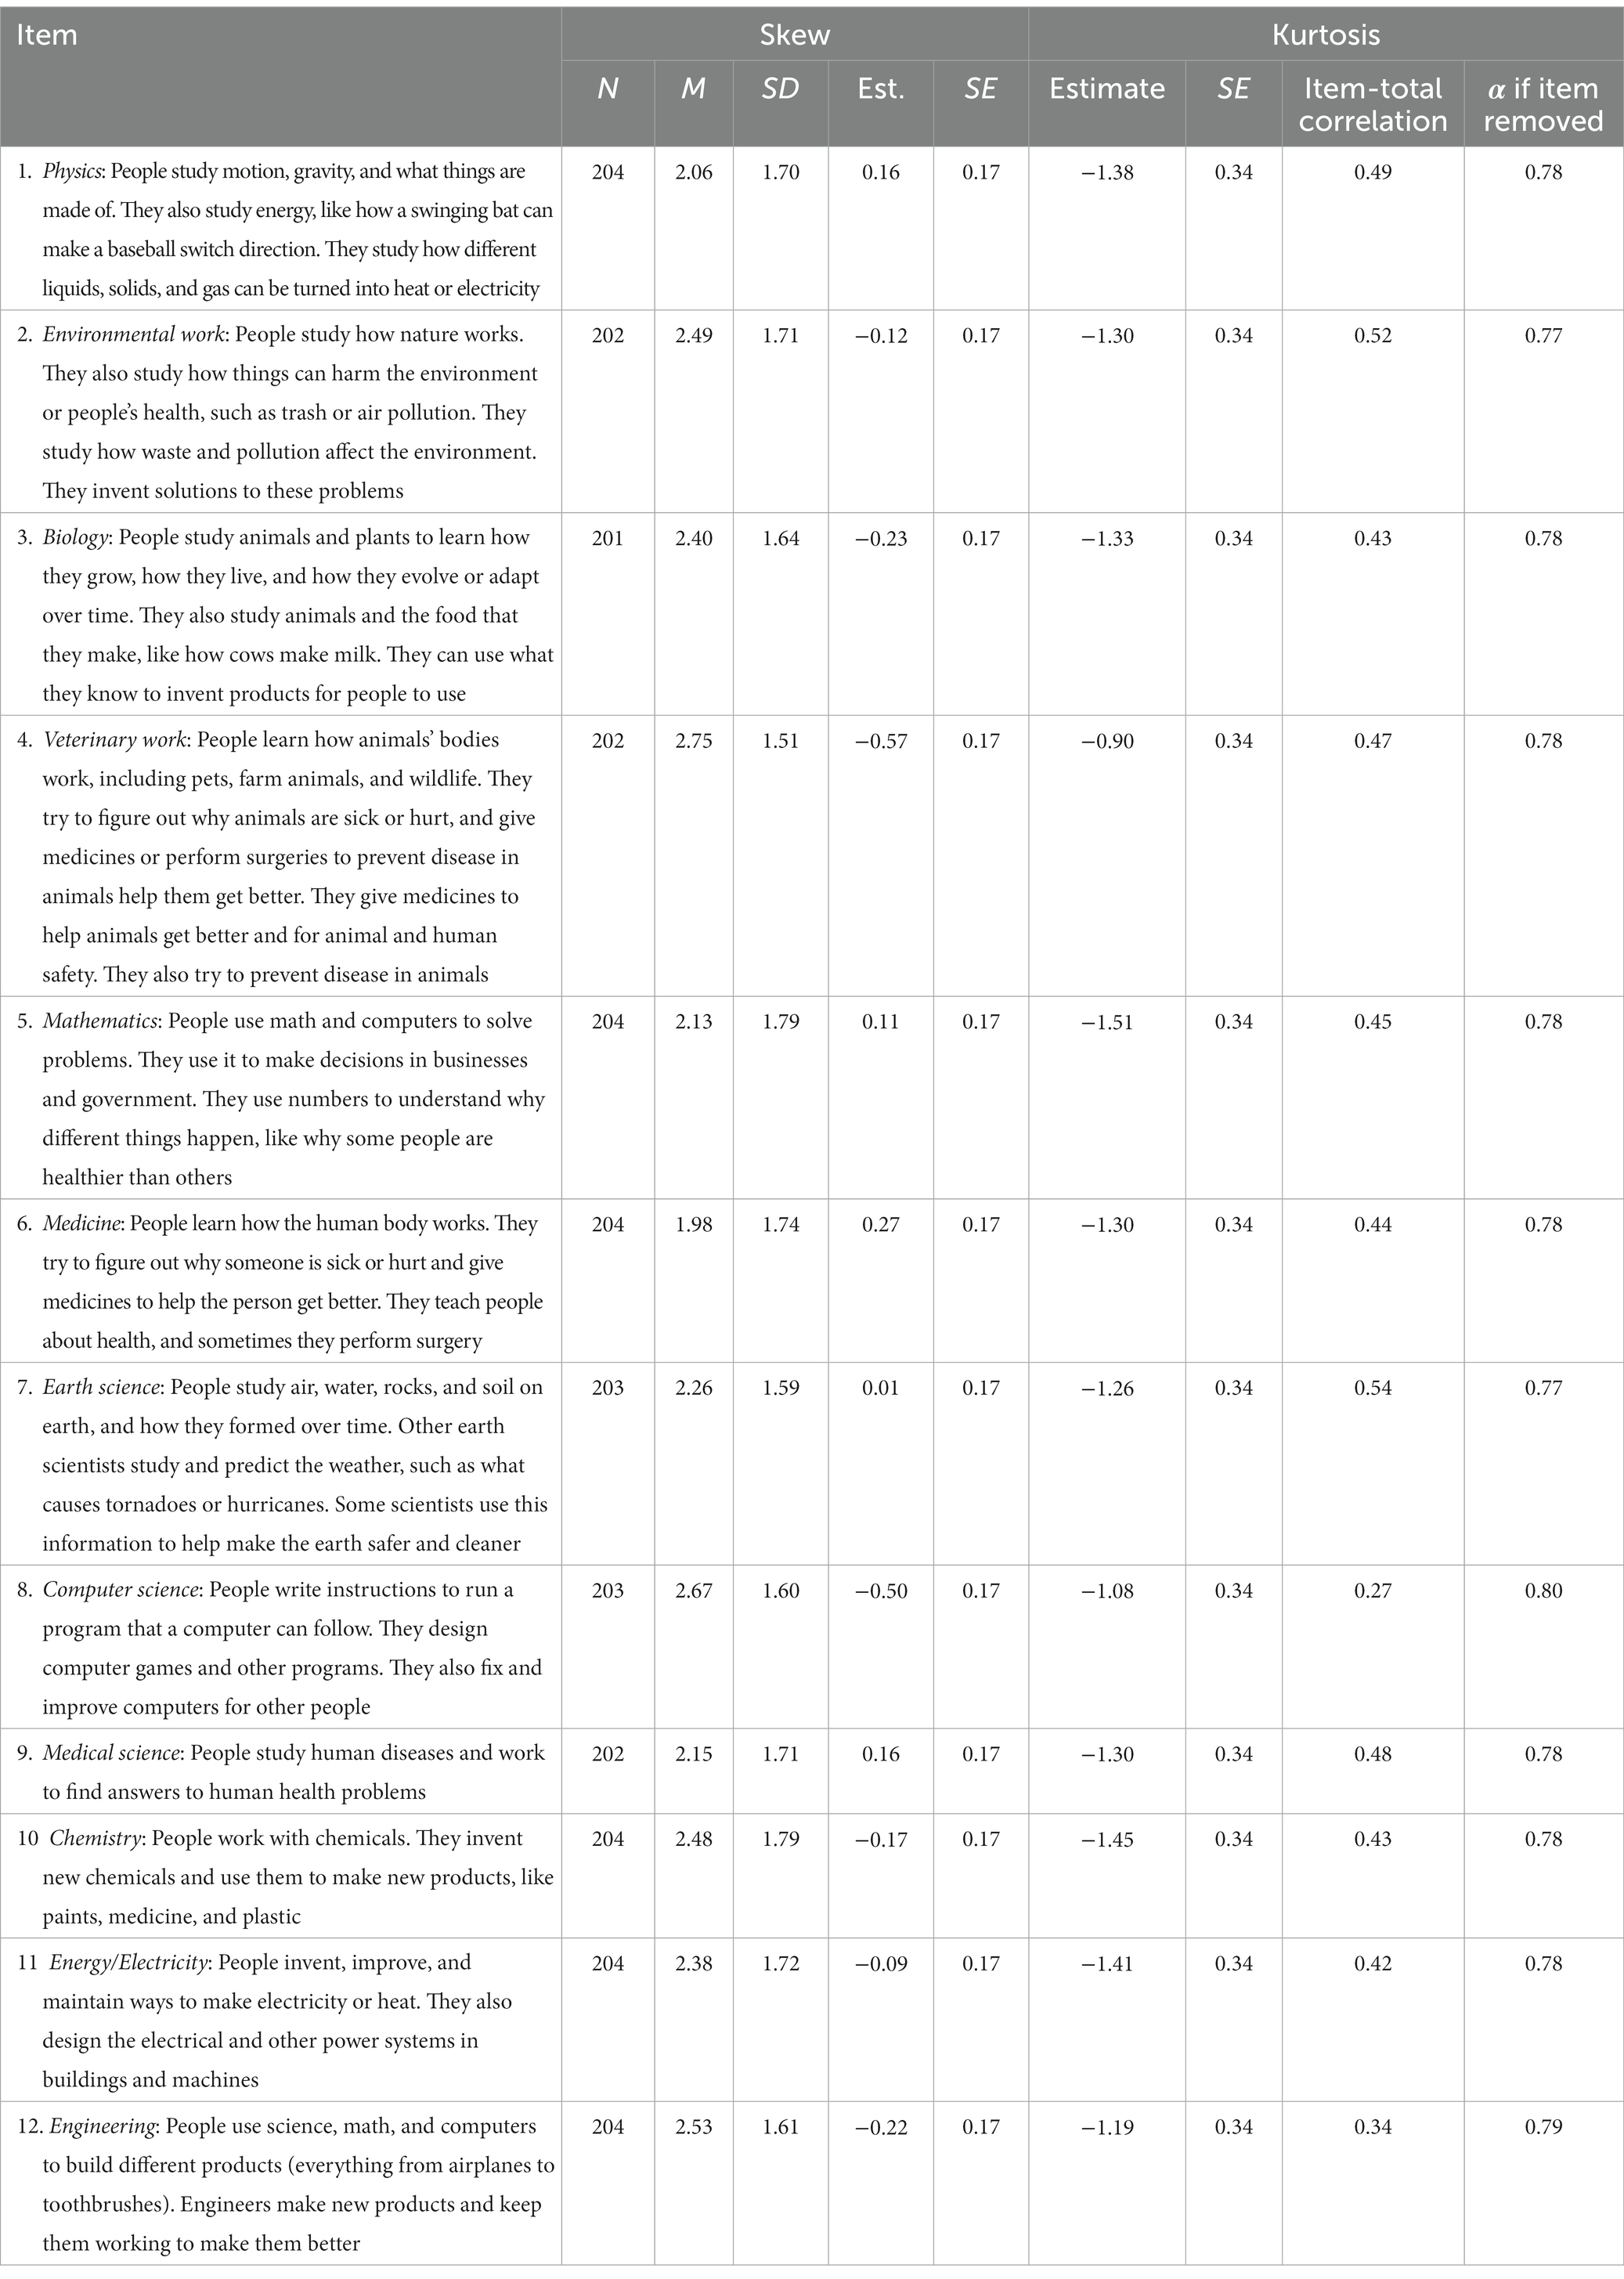
Table 6. Item descriptives, outliers, total correlations, and adjusted Cronbach’s alphas for the student interest in science activities (middle childhood) scale.
3.1.3.2 Step 2: construct validity
The results of the exploratory factor analyzes indicated that models with more than 2 factors were not identified. Therefore, 1- and 2-factor confirmatory factor models were estimated. These models are shown in Table 3. As can be seen, the 1-factor confirmatory model was a marginal fit to the data, with CFI and TLI values well below the preferred threshold. The LRT indicated that the 2-factor model was a significant improvement over the 1-factor model (ΔX2 (1) = 20.2, p < 0.001), but as shown for the second model in Table 3, the CFI and TLI values remained well under the threshold. The model results indicated that allowing the residual variances of items 7 and 8 to covary would result in a substantial improvement in model fit (i.e., the modification index indicated that this would reduce X2 by 12.6). These items were judged to be likely to share variance beyond that accounted for by the underlying factor structure because both items 7 and 8 asked students about their interest in science activities that involved digital media (television and video games, respectively; see Table 7). Therefore, the 2-factor model was modified and then re-estimated; the resulting fit indices are reported in Table 3. As can be seen in the Table, the fit of this model was an improvement over the unmodified model, though the CFI and TLI did not reach 0.95.
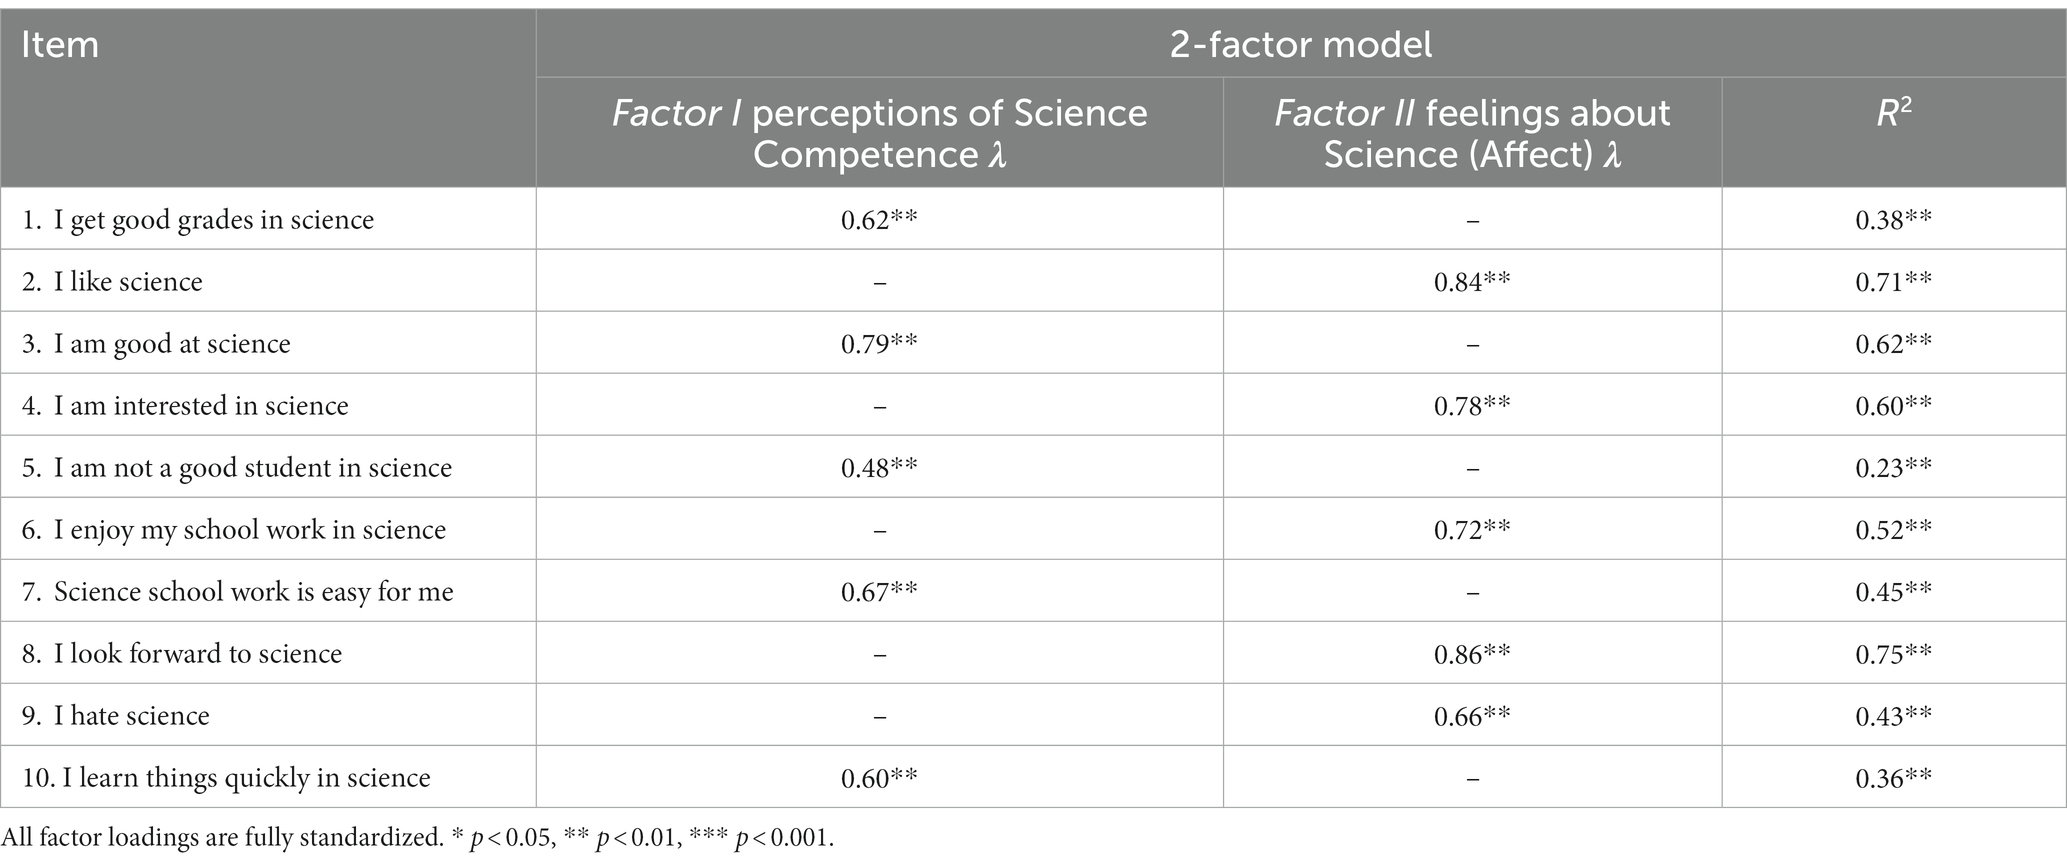
Table 7. Summary of factor structures for final confirmatory factor models of student interest in science activities (middle childhood) scale.
The factor loadings for the modified 2-factor model are displayed in Table 7. All loadings were statistically significant (p < 0.001), though six fell within 0.05 of the cut-point for a “fair” loading of λ = 0.45 (Comrey and Lee, 2013). The proportion of variance in each item accounted for by its respective factor (R2) ranged from 0.14 to 0.49 (p < 0.05 in all cases). The items that loaded on Factor I generally reflected informal, less-structured, and self-directed activities, while items loading on Factor II generally reflected formal, structured, and more adult-directed activities. Crombach’s alpha for Factor I was 0.63 and was 0.62 for Factor II. Possible explanations for these relatively low values, as well as the nuances and potential challenges of the factor categorization are presented in the General Discussion.
3.1.4 Student attitudes towards STEM careers scale
3.1.4.1 Step 1: internal consistency
As shown in Table 8, the overall Cronbach’s alpha was 0.80. As can be seen in the right-most column, removing individual items did not result in large improvements in Cronbach’s alpha, which indicates that removing individual items would not improve internal consistency. Also evident in Table 8 is the total item correlation ranges from 0.27 to 0.54. This variability again suggests that this measure may be measuring multiple constructs. As was the case for the previous measure, a small number of responses were not included in our analyzes because of missing (n = 6, or 0.24% of possible responses) or “I do not know” responses (n = 5, or 0.20% of responses).
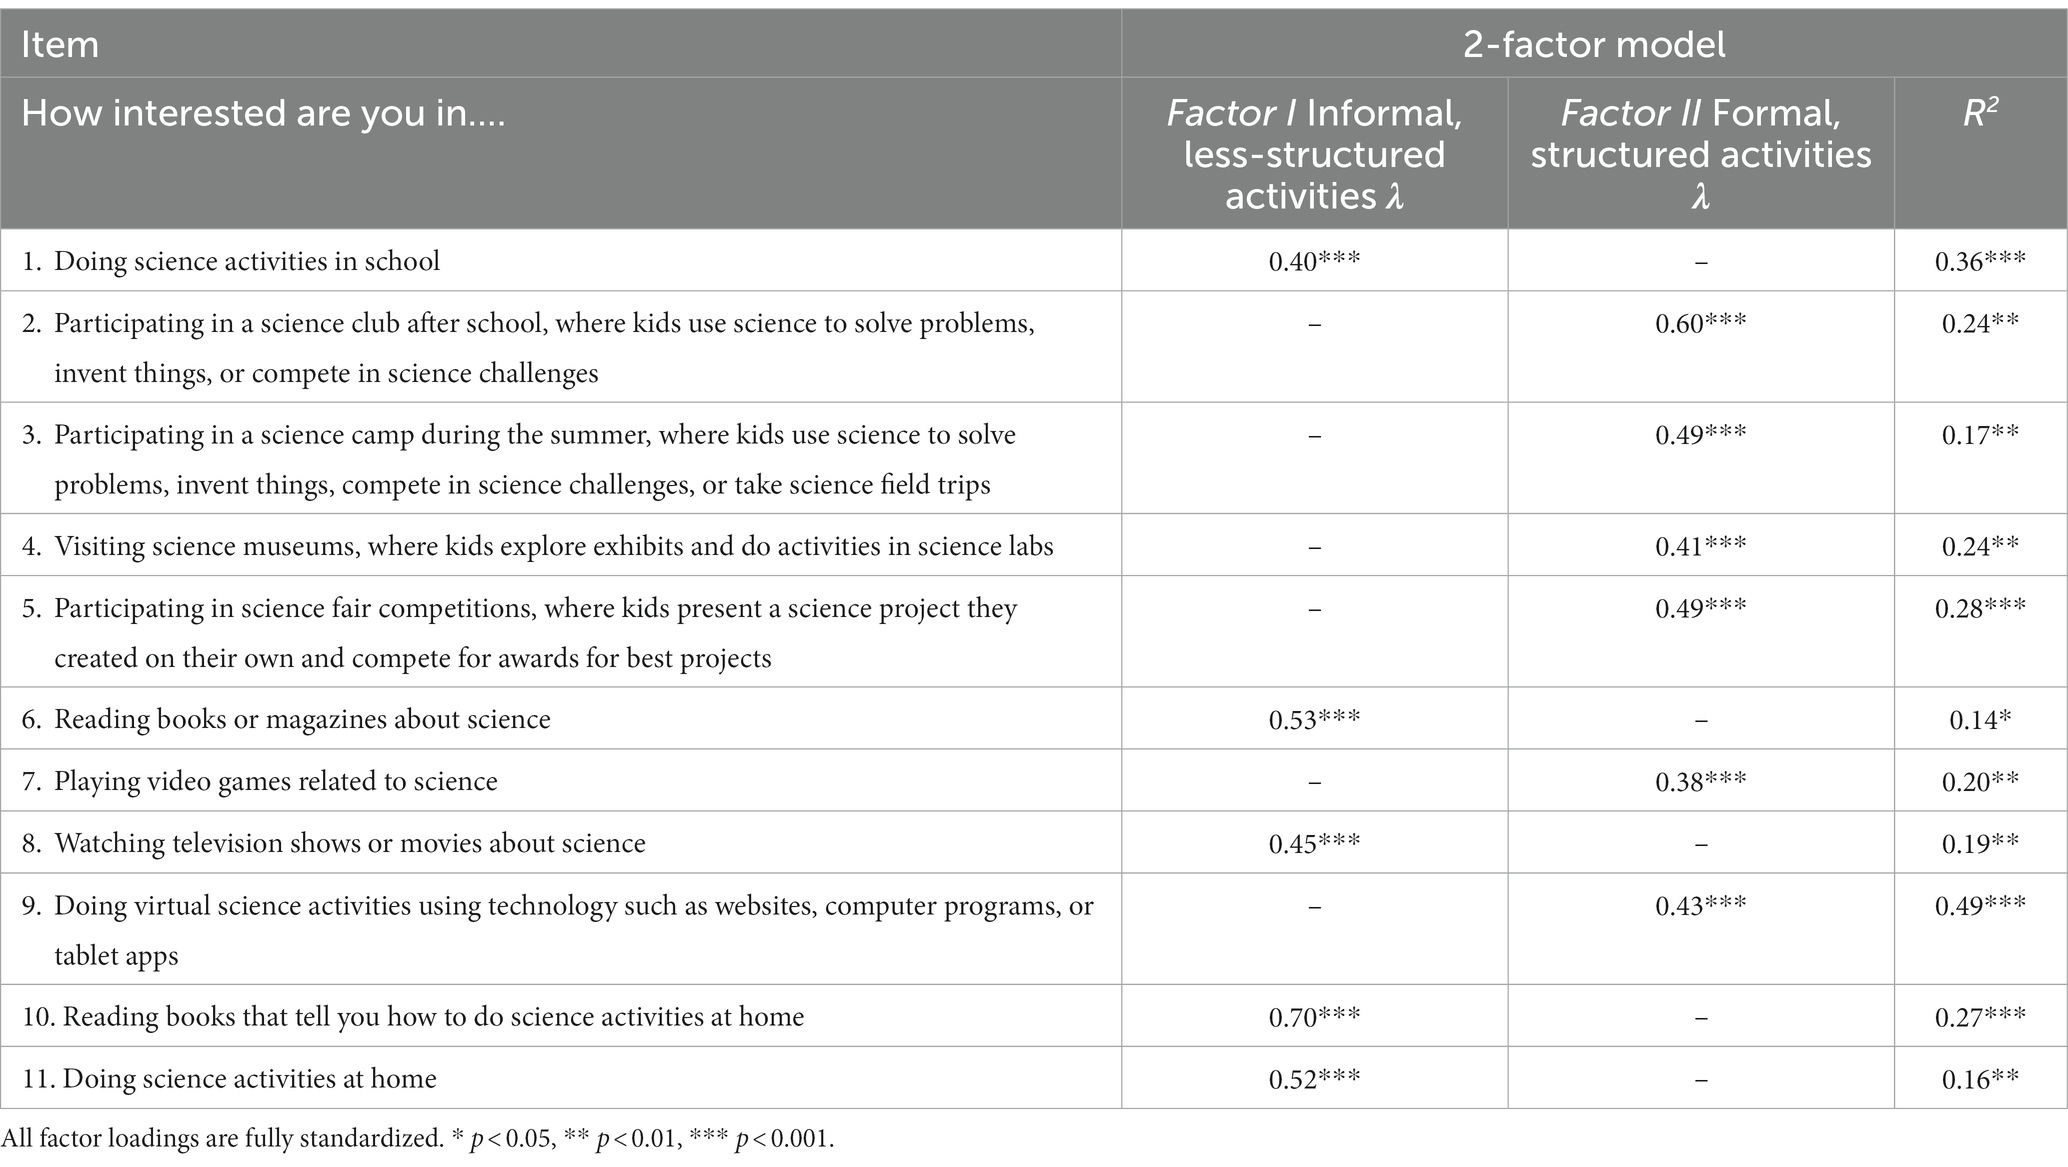
Table 8. Item descriptives, outliers, total correlations, & adjusted Cronbach’s alphas for the student attitudes toward STEM careers scale.
3.1.4.2 Step 2: construct validity
While the published measure (Friday Institute for Educational Innovation, 2012) does not specify the number of constructs probed by this measure, based on the internal consistency results and EFA (shown in Supplementary materials), we estimated confirmatory models with 1-, 2-, and 3-factors. As can be seen in Table 3, all fit indices suggest that the 1-factor model was a marginal fit to the data. An LRT, revealed that the fit of the 2-factor model was a significant improvement over that of the 1-factor model (ΔX2 (1) = 42.2, p < 0.001) and an acceptable fit to the data overall. However, as shown in Table 9, the 3-factor model was a better fit to the data (ΔX2 (1) = 22.3, p < 0.001), and an excellent fit overall (RMSEA = 0.03, 90% CI = [0, 0.05]; SRMR = 0.05; CFI = 0.98, TLI = 0.98). Therefore, we interpreted the factor loadings for the 3-factor model, which are displayed in Table 9.
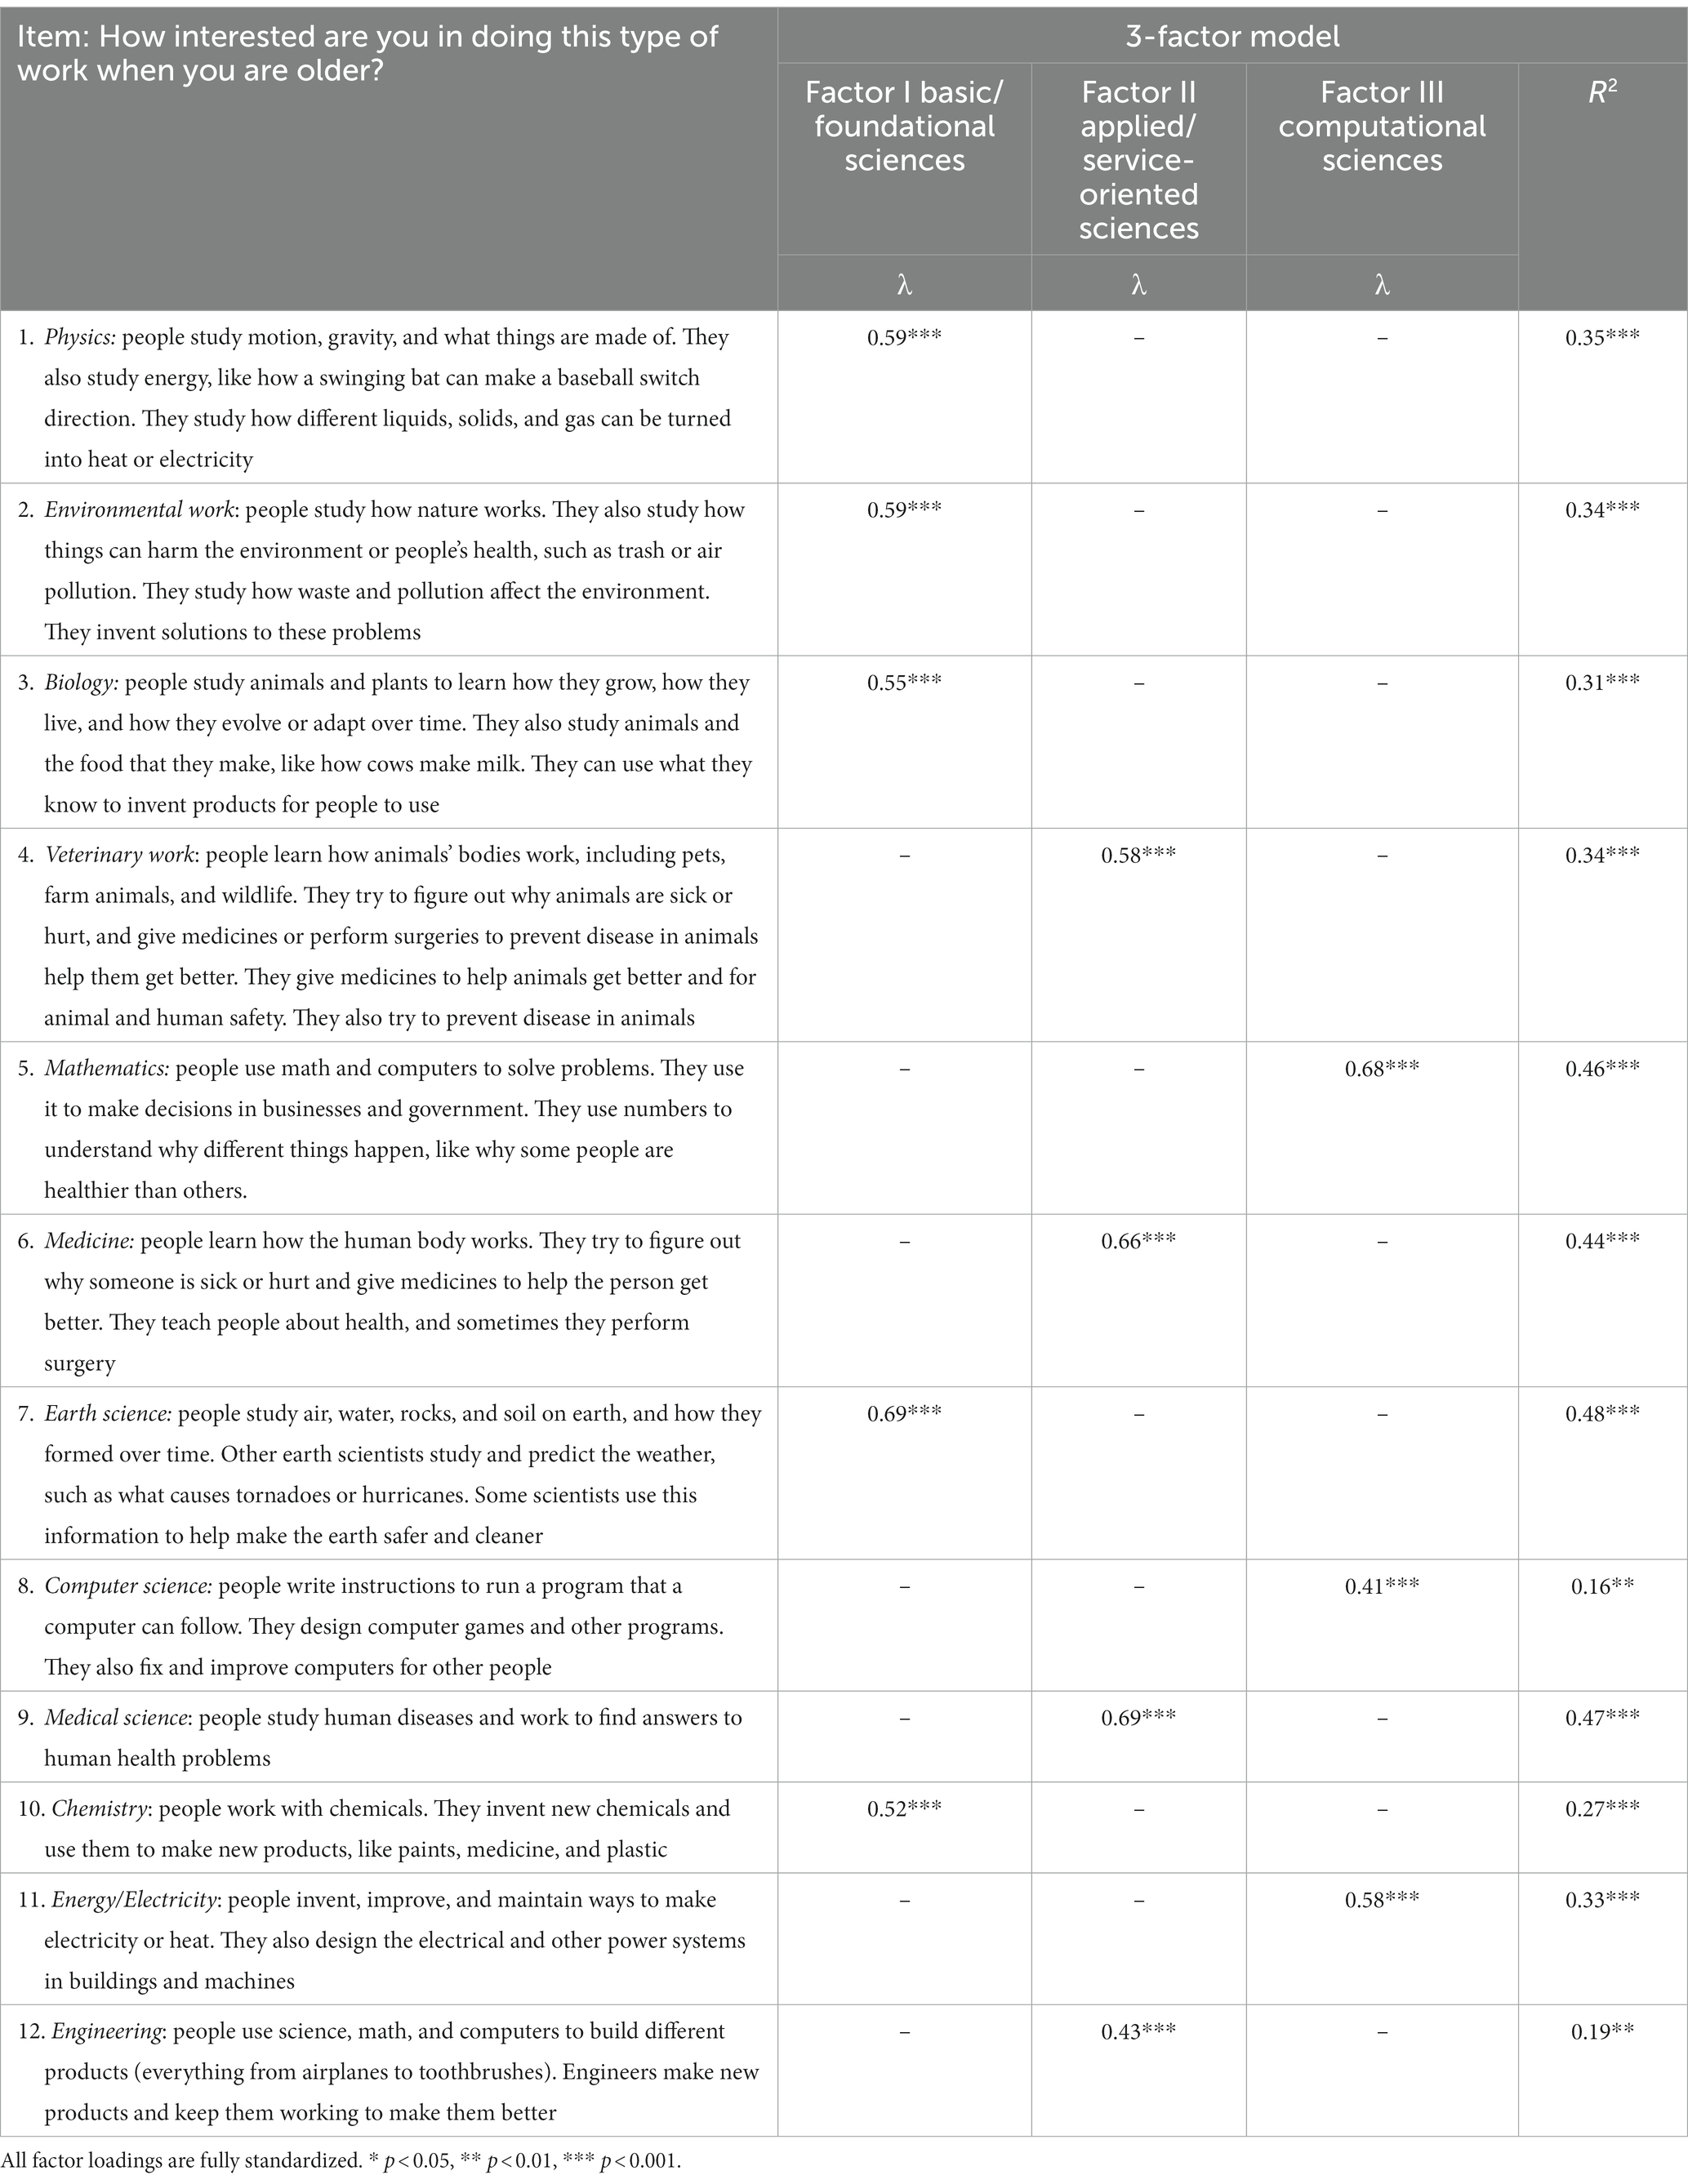
Table 9. Summary of factor structures for final confirmatory factor models of student attitudes toward STEM careers scale.
All loadings were statistically significant (p < 0.001), and all approached or exceeded the threshold for a “good” loading (λ = 0.55; Comrey and Lee, 2013), with two exceptions: the loading of item 12 on factor II and the loading of item 8 on factor III, both of which were slightly below the threshold of a “fair” loading (λ = 0.45). Not surprisingly, the proportion of variance for items 12 and 8 accounted for by the factors with which they were associated was lower (R2 = 0.19 and 0.16, respectively) than that accounted for by the other items, which ranged from 0.27 to 0.48 (p < 0.001). Factor 1 represented Basic/Foundational Sciences, with item loadings associated with physics, biology, earth science, and chemistry (α = 0.73). These are science domains that aim to advance foundational knowledge and understanding of the natural world and follow a systemic methodology to establish evidence. Factor II represented Applied/Service-Oriented Sciences, with item loadings associated with veterinary work, medicine, and engineering (α = 0.68). These fields solve problems and directly address the needs of society in order to help and improve quality of life. Finally, Factor III reflected Computational Sciences, which included energy/electricity, mathematics, and computer science -related items, all involve the use of math and electricity to solve problems (α = 0.73).
3.2 How are scores on each of these measures distributed?
Scores for each scale or sub-scale were calculated as the mean of the completed items. Means, standard deviations, and statistics reporting skew and kurtosis are presented in Table 10, while histograms of the distributions for each scale and sub-scale are presented in Figures 1–4. As can be seen in Figure 1, the distribution of scores for the Science Self-efficacy scale is slightly negatively skewed, indicating more positive feelings of self-efficacy in science. Figure 2 shows the two factors for Science Self-concept: (1) Competence and (2) Feelings about Science (Affect). As can be seen in the figure, the Competence subscale approximates a normal distribution while the Affect subscale exhibited a moderate degree of negative skew, indicating overall positive feelings about science. Figure 3 shows the distribution of scores for the 2 factors of the Student Interest in Science Activities (Middle Childhood) scale. As can be seen in the figures, factor 1: informal/less structured activities approximated a normal distribution while factor 2: formal/structured activities exhibited a slight degree of negative skew. The negative skew for this factor again indicates students displayed more interest in engaging in formal activities around science. Finally, Figure 4 shows the distributions of the three subscales for Student Attitudes Toward STEM Careers. As can be seen in Figure 4, factors 1 Basic/Foundational, and 2, Applied/Service-oriented approximated a normal distribution. For Factor 3, Computational Sciences, the distribution is more spread out, indicating that some students are expressing strong disinterest in these types of careers, while others are expressing interest in them.
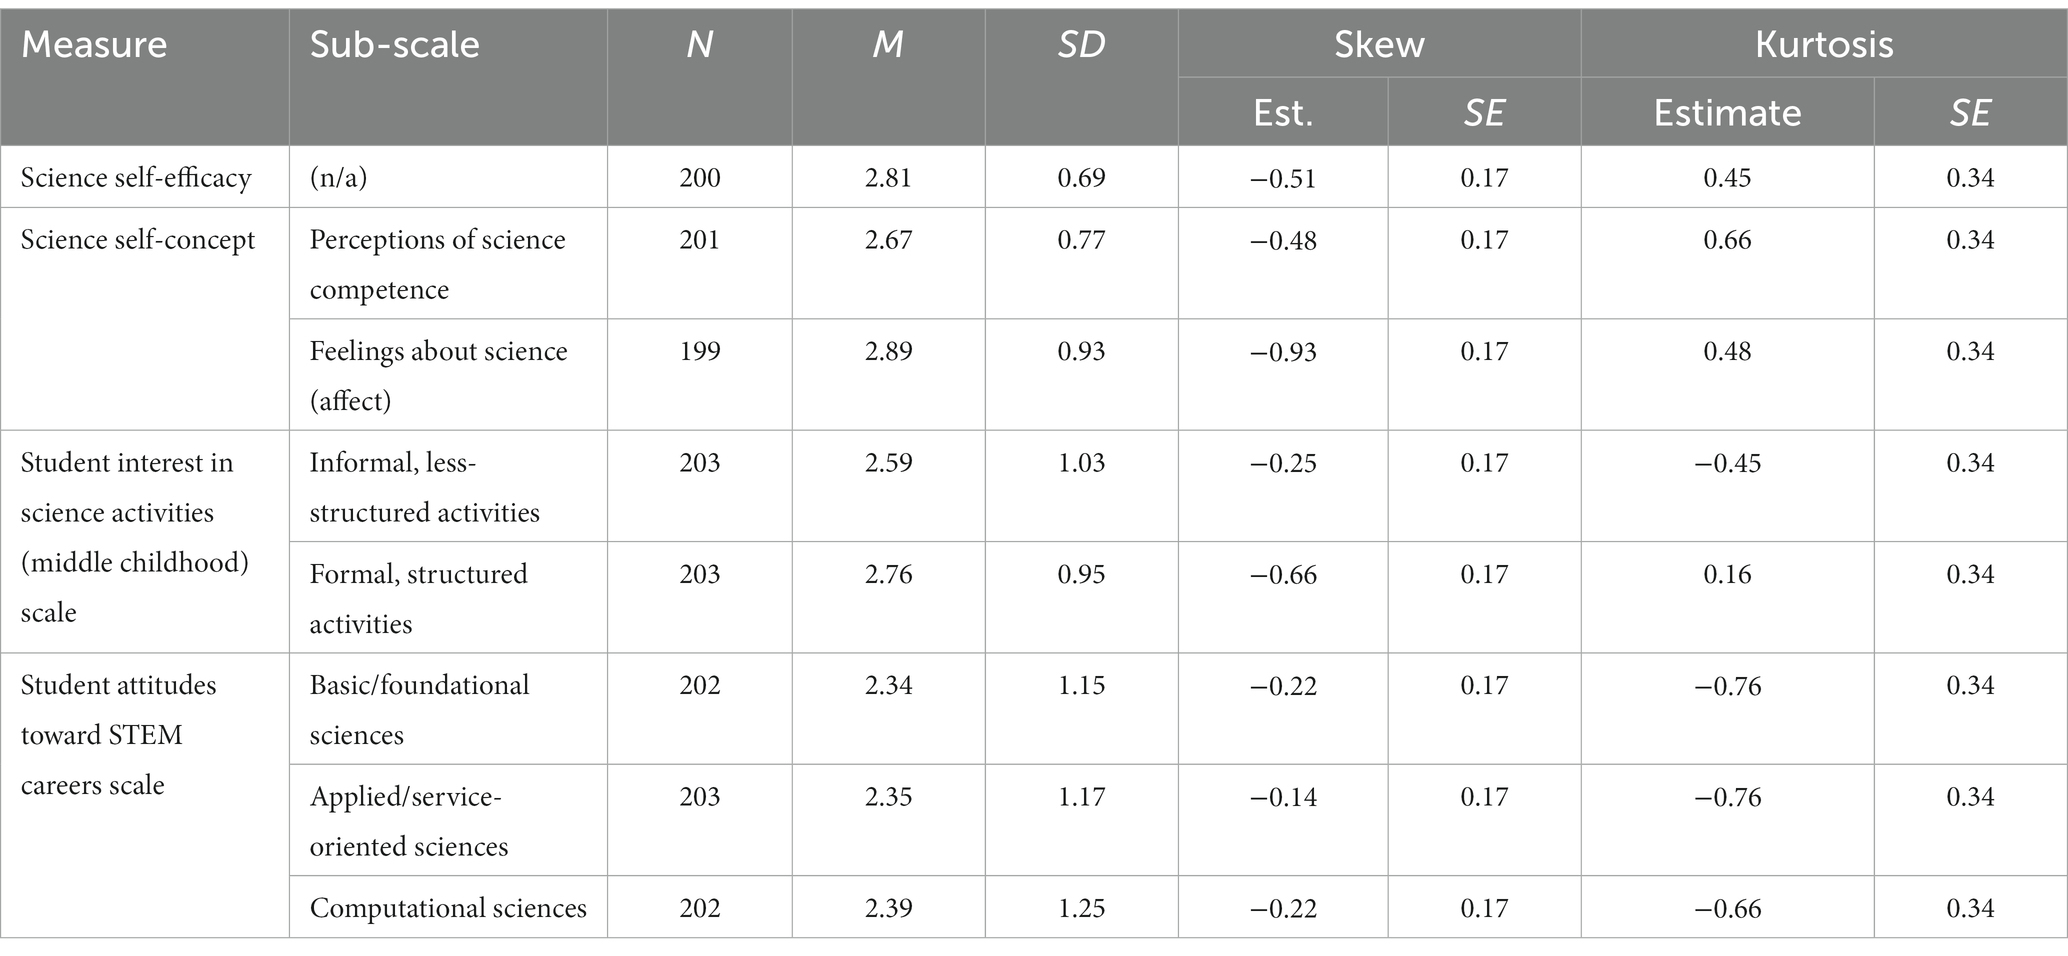
Table 10. Scale and sub-scale descriptives.
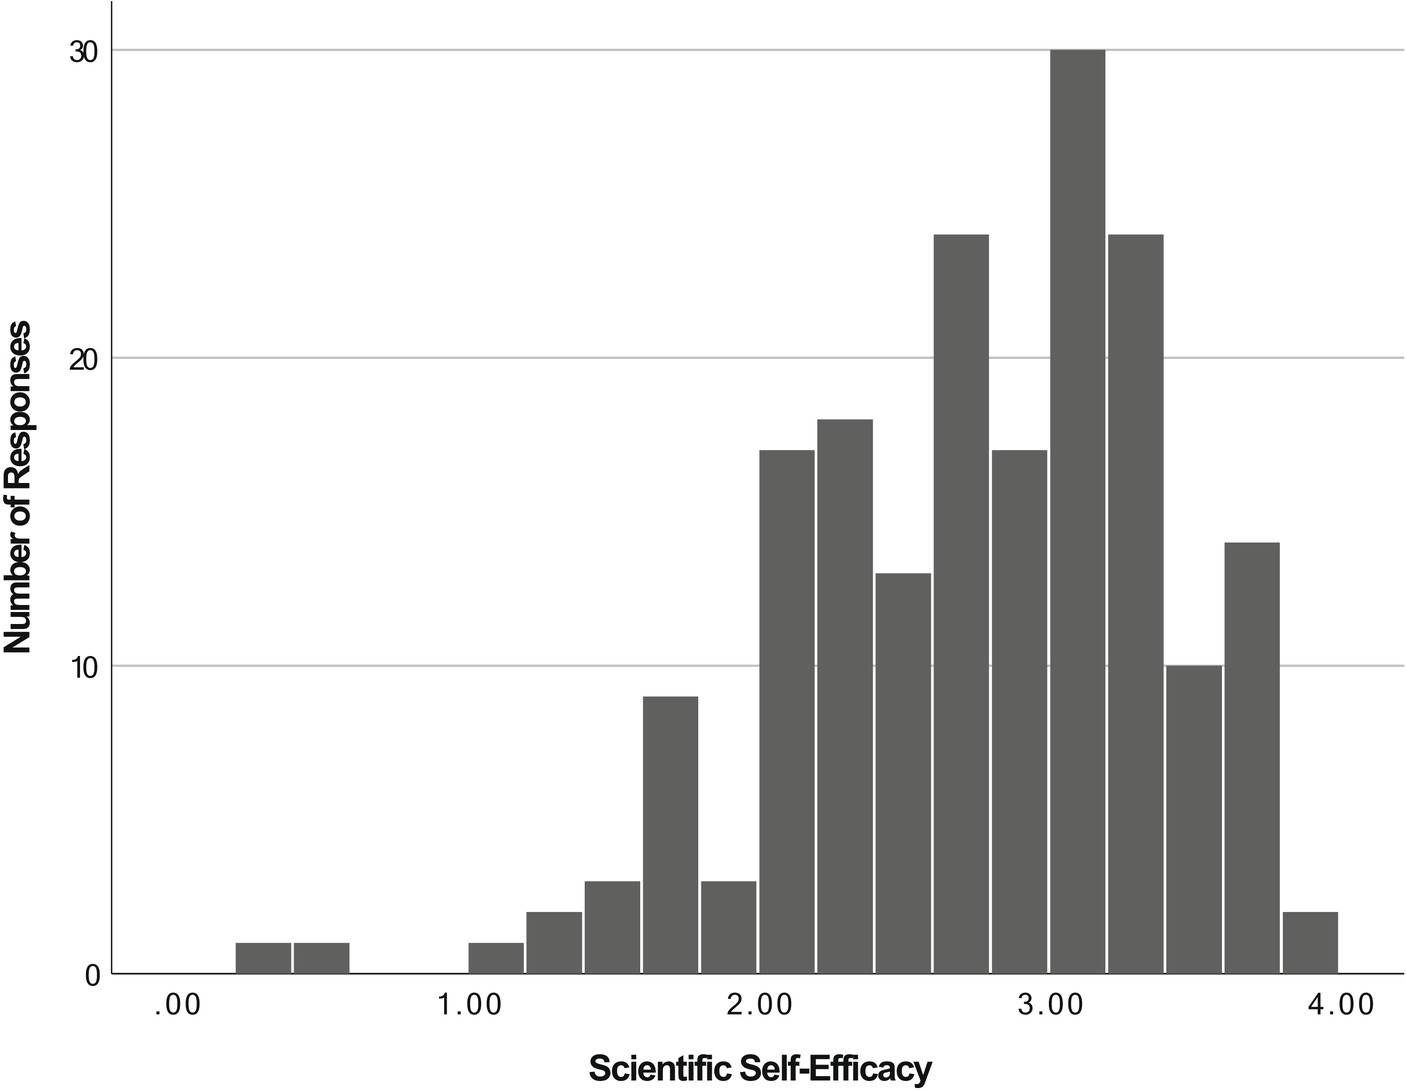
Figure 1. Distribution of science self-efficacy scores.
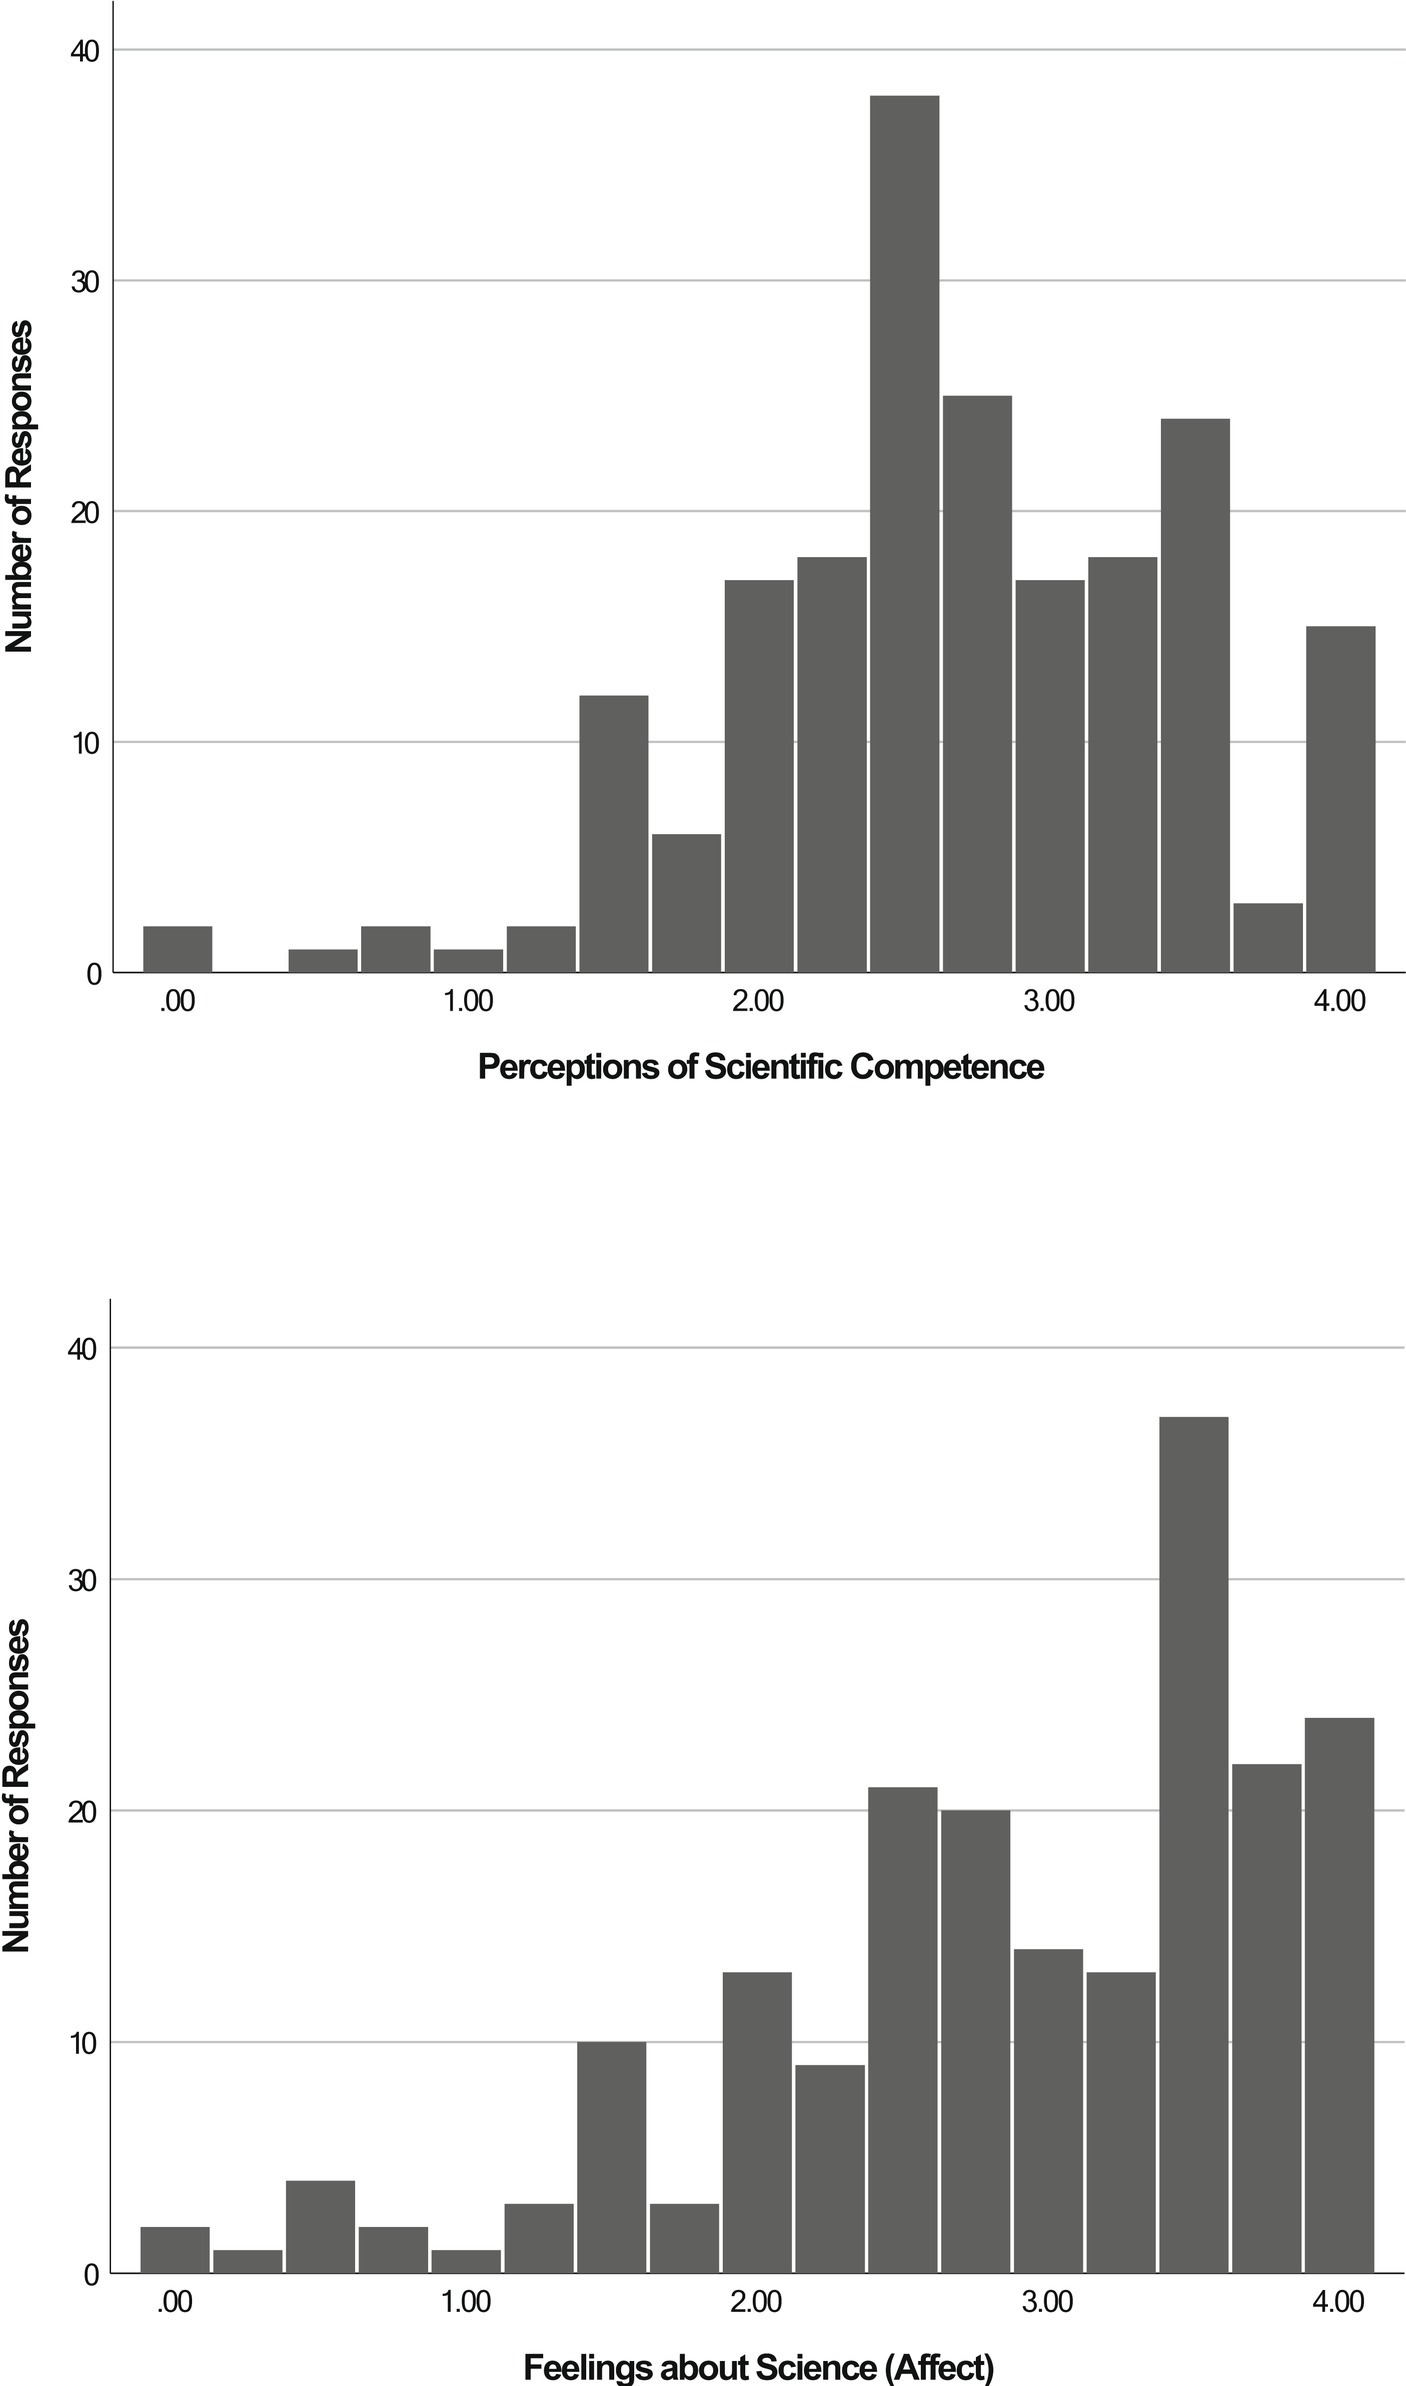
Figure 2. Distribution of science self-concept scores by sub-scale.
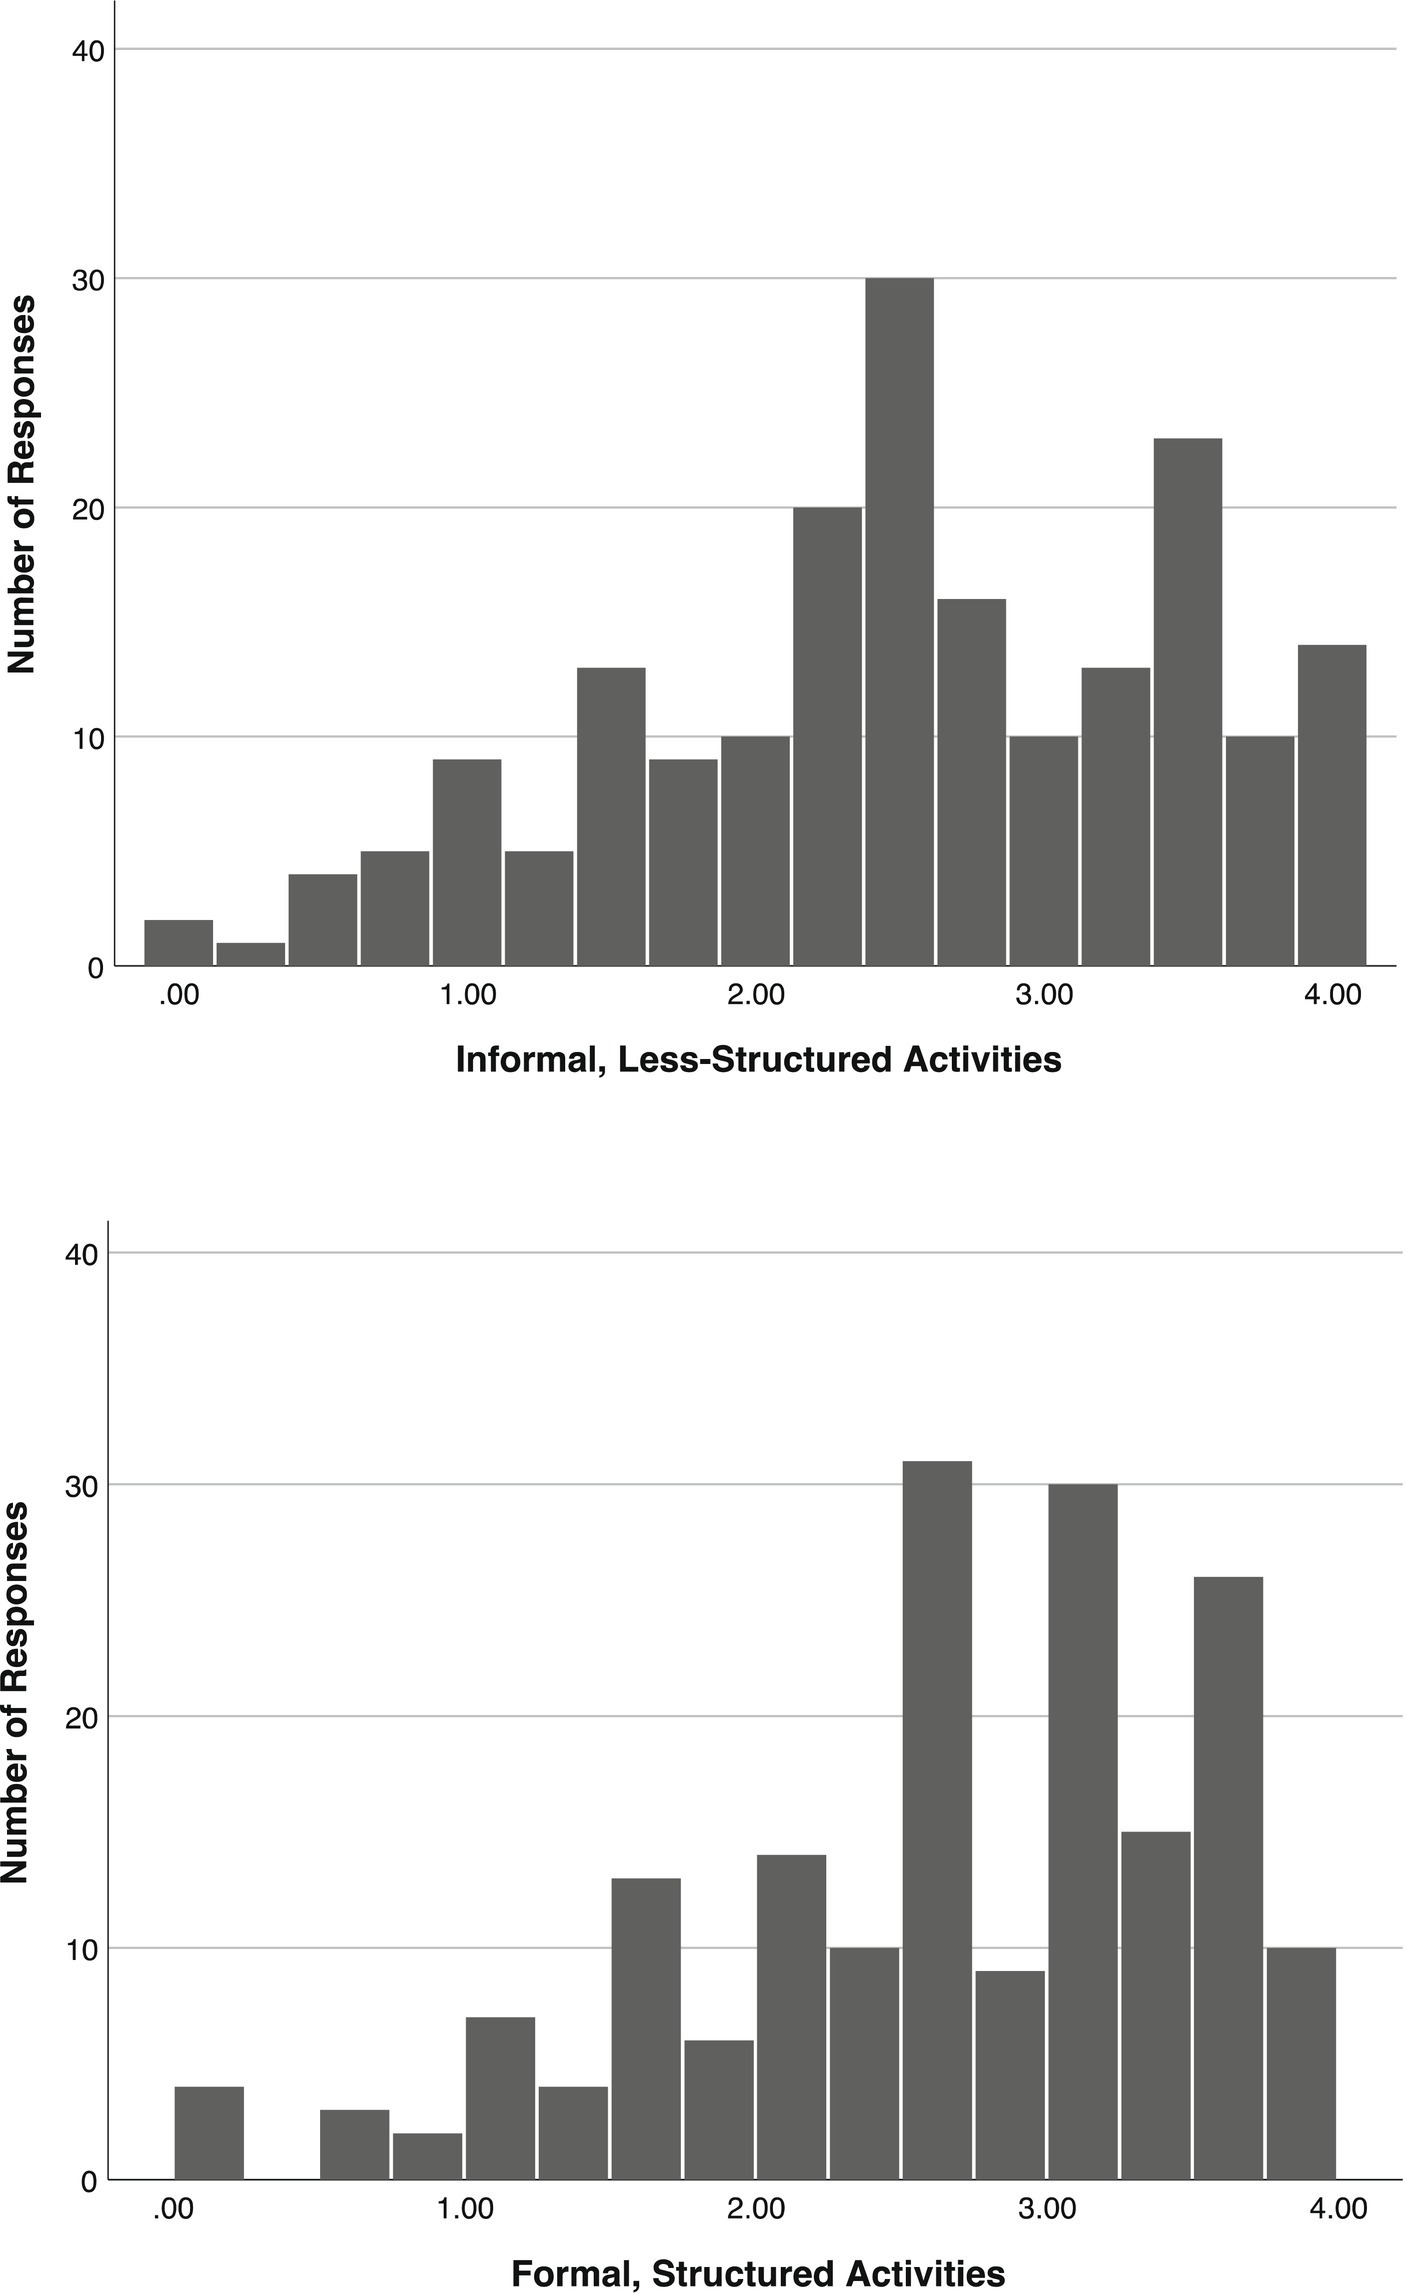
Figure 3. Distribution of student interest in science activities (middle childhood) by sub-scale.
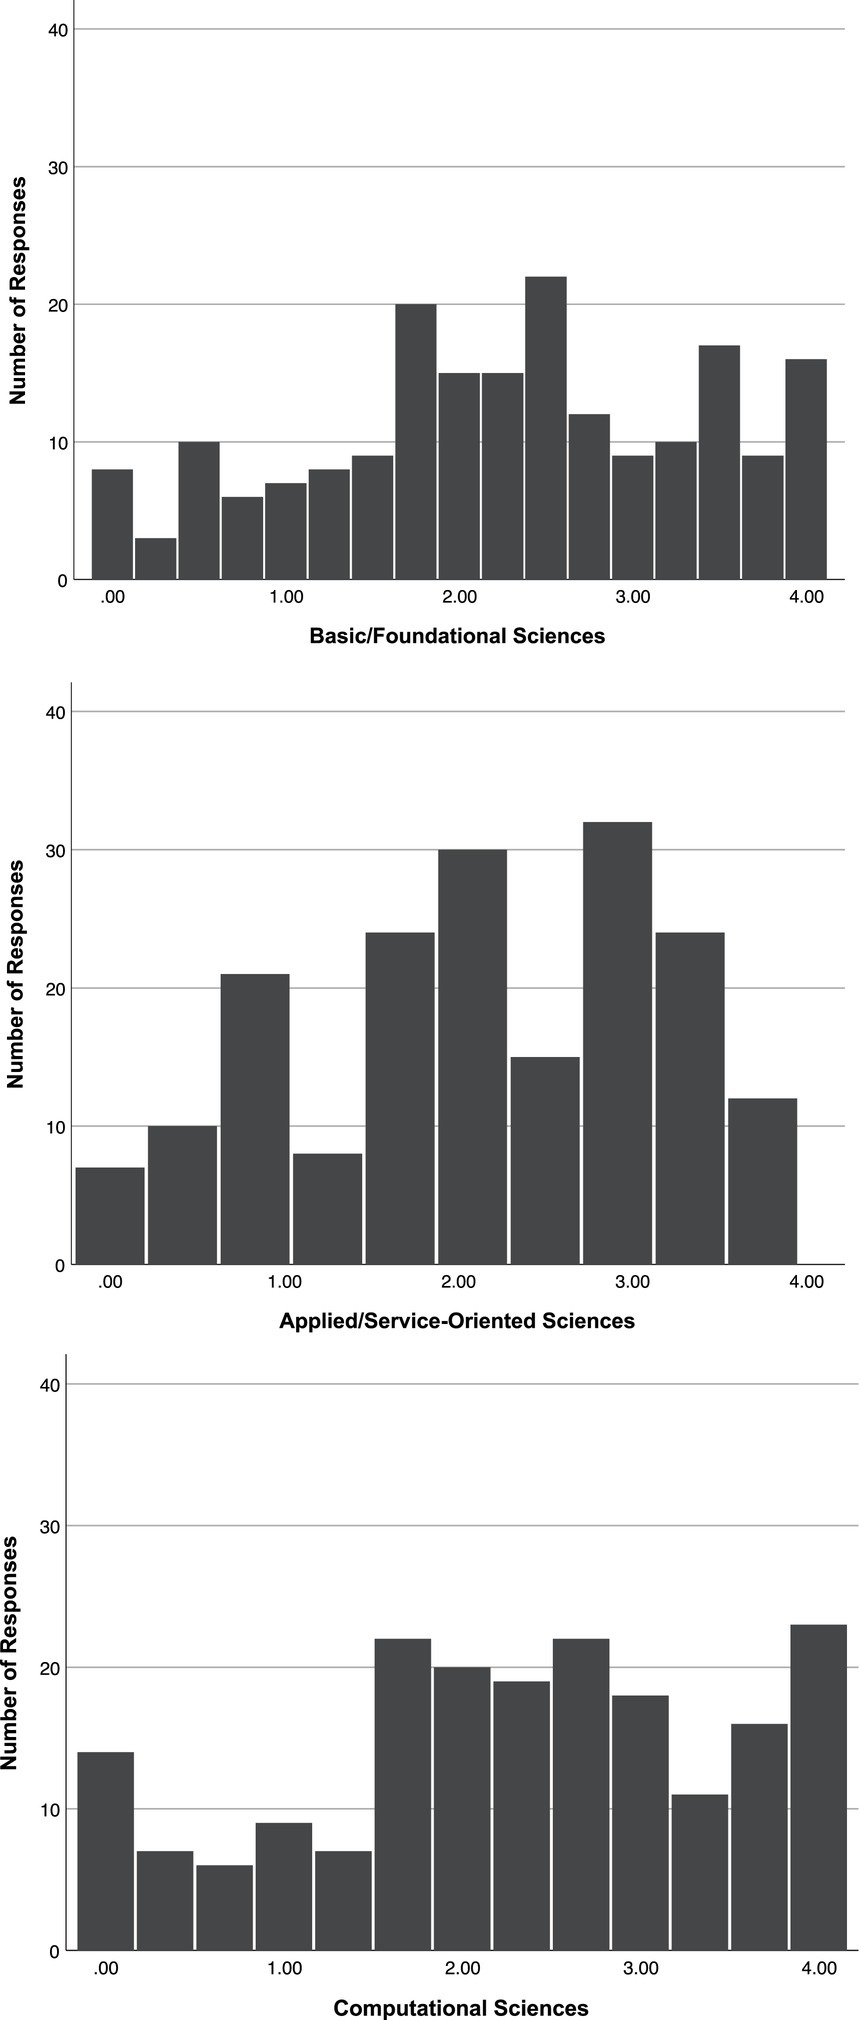
Figure 4. Distribution of student attitudes toward STEM careers by sub-scale.
3.3 Do these measures demonstrate convergent validity?
When one is developing a measure, it is important to understand how performance on the measure relates to performance on other measures that assess the same or similar construct. This idea, known as convergent validity, explores whether two measures that should be related to each other, are related. For example, we hypothesize that measures of height and weight should be related to each other because as one grows taller one also gains more mass. This is also true of psychological constructs. As self-efficacy and self-concept both “measure” one’s perceptions of self, we hypothesize that performance on one will be closely related to performance on another.
While a larger sample is needed to examine this question for these measures, we can examine this question preliminarily. Thus, we explored the correlations (i.e., associations) among the scales and sub-scales for each measure, using scale and sub-scale scores calculated based on the factor loadings for each confirmatory model. For example, our final confirmatory factor model indicated that our measure of science Self-concept displayed a two-factor structure (rather than a single-factor structure): (1) Perceptions of Competence and (2) Feelings about Science (Affect). For each student we calculated a Perceptions of Competence sub-scale score and a Feelings about Science (Affect) sub-scale score as the mean of the items that loaded on each factor. These scores are reported in Table 11, while the correlations among scales and sub-scales are reported in Table 11.
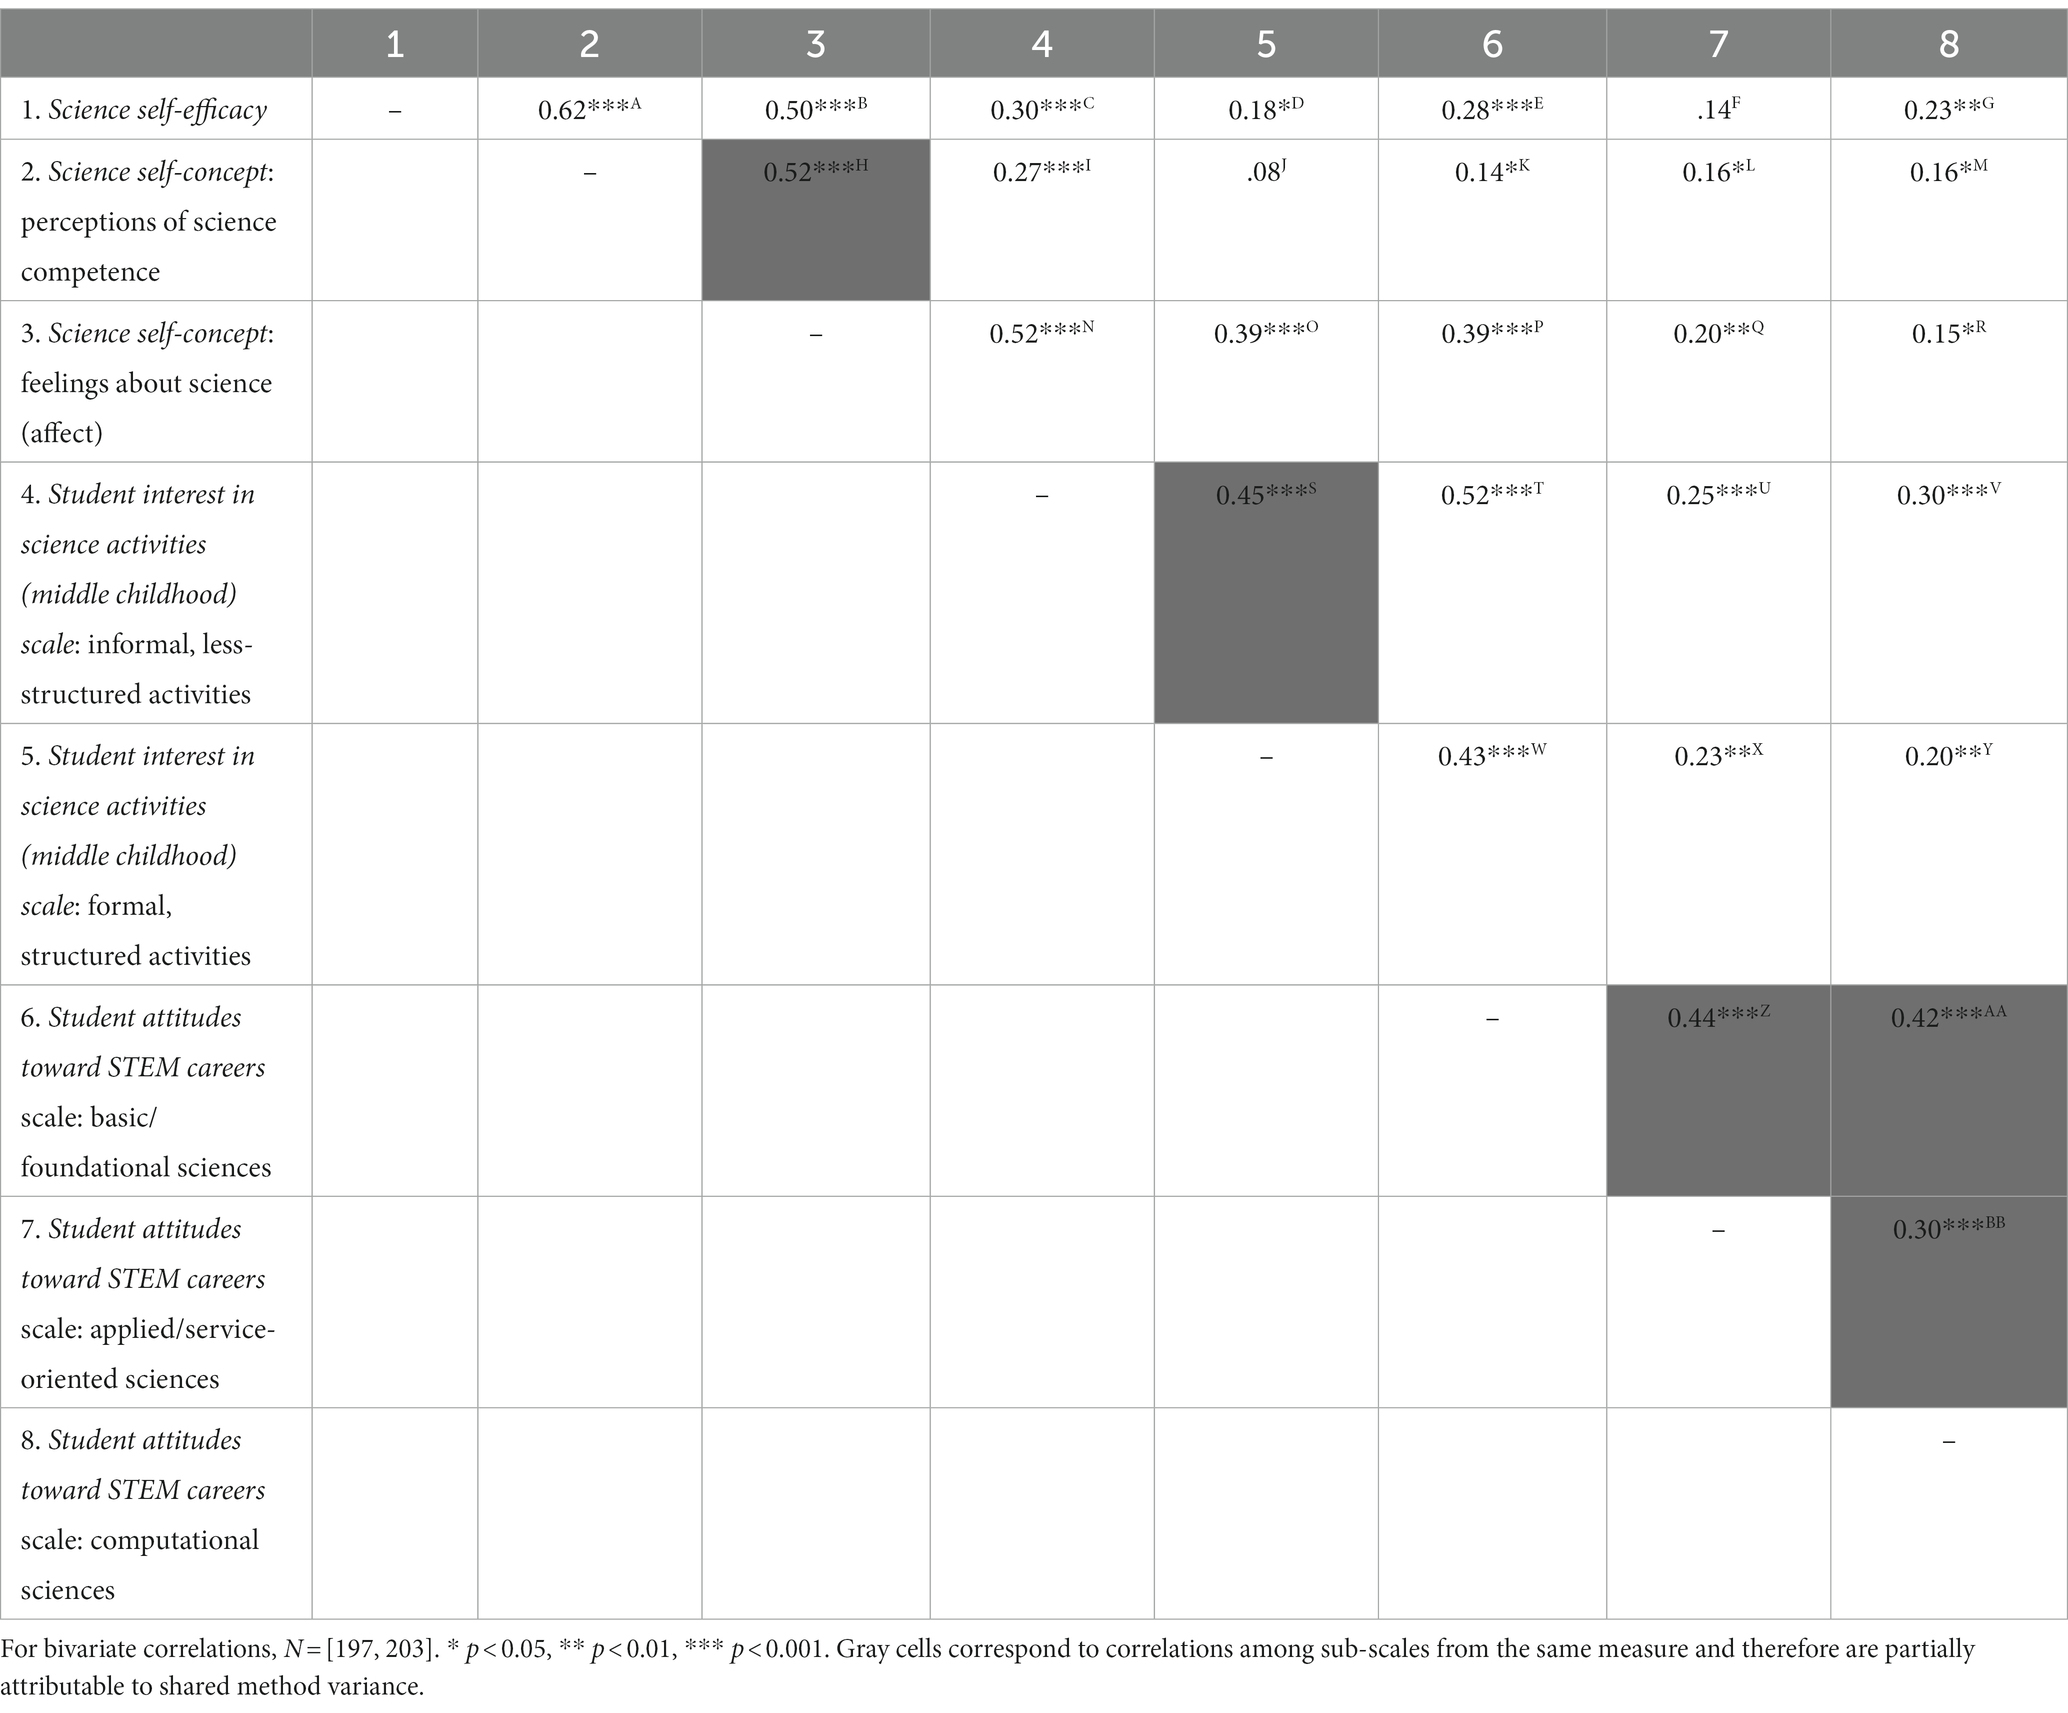
Table 11. Correlations among scales and subscales.
The five correlations shaded in gray in Table 11 correspond to the correlations between subscales taken from the same measure. As they come from the same measure, we predict that these correlations would be strong and positive. In all cases, the correlations are positive, but they are not all strong. For example, the correlation between the Science Self-Concept Competence subscale (e.g., I get good grades in science) and the Affect subscale (e.g., I look forward to science) is 0.52 (see the gray box from row “2. Science Self-Concept: Competence” and column 3). The relation between these two subscales is not very strong, suggesting that while they both measure a form of science self-concept, the subscales comprising this measure appear to assess related but distinct aspects of self-concept, which also confirm our factor analysis. An inspection of Table 11 reveals this is true for all cases – indicating that sub-scales taken from the same measure appear to assess related but also distinct constructs in all cases.
The remaining correlation coefficients reported in Table 11 correspond to the associations between scales and subscales from different measures, and in each case, the values for these coefficients are also positive. This is perhaps to be expected, given that all the measures administered in this study were designed to assess the same over-arching domain: students’ attitudes about STEM. However, it is also apparent that the strength of these positive associations varies widely, ranging from r = 0.08 to 0.62, reflecting differing degrees of relatedness among measure scales and subscales. For example, the correlation between Science Self-Concept: Competence and Interest towards Basic/Foundational Science Careers (Row 2 and Column 6) is 0.14, suggesting that students’ perceptions of their science competence is not strongly related to their attitudes toward basic/foundational sciences careers.
4 Discussion
Self-perceptions play a critical role in driving academic participation and achievement (Bandura, 1977, 1982; Schunk, 1989, 1995; Usher and Pajares, 2008), and many contemporary interventions focus on increasing students’ interest, confidence, efficacy, and engagement as essential catalysts of achievement. However, without reliable and valid measures to assess young learners’ self-perceptions and interests in science, we cannot determine what programs are effective and for whom. The goal of the current study was to provide initial evidence for the reliability and validity of a novel set of four measures designed to assess elementary students’ self-perceptions and interest in science within a diverse sample of 3rd-grade students (94% identified as either Black or Hispanic).
4.1 Initial evidence for reliability and validity
Our results revealed that the Science Self-Efficacy Scale displayed a single-factor structure, which suggests that a single score can be calculated from this measure to indicate elementary students’ science self-efficacy. This single-factor structure is consistent with measurement work on the structure of self-efficacy (Bandura, 2006), as well as the suggestion that self-efficacy can be divided broad domains (academic and non-academic) and that academic self-efficacy can be further divided into sub-domains (e.g., science self-efficacy, math self-efficacy) that function as single subject-specific constructs. In contrast, the Science Self-Concept Scale displayed a 2-factor structure that included Perceptions of Science Competence and Feelings about Science (Affect). This division replicates and extends previous work that established the multidimensional nature of academic self-concept in elementary school children. For example, Arens et al. (2011) administered Marsh’s academic self-concept questionnaire to 3rd – 6th graders in Germany and found that the self-concept domain was separated into competence and affect components. Here, we parallel these findings and extend them to the domain of science. While previous work has established that academic self-concept can be divided into domain-specific concepts such as verbal and mathematical self-concept (Marsh, 1990; Skaalvik and Rankin, 1990) and that academic self-concept includes both affective and competency-related self-perceptions, to our knowledge, our results are the first to demonstrate that this distinction holds for science among elementary school students.
The Student Interest in Science Activities (Middle Childhood) Scale was designed to examine students’ current interest in science activities in middle childhood. The data collected using this measure yielded 2 underlying factors representing two broad types of science-related activities common in middle childhood. The first factor reflected informal, less structured, self-guided activities, with the exception of item 1 (“Doing science activities in school”). The fact that “Doing science activities in school” loaded on this first factor was surprising, but may be explained, in part, by the way in which students engage in science in the elementary grades in this school district, in which there is greater emphasis on hands-on, exploratory and investigative science activities. This instructional approach may be perceived by students as more self-directed in nature. The second factor reflected more formal, structured activities that are guided by an adult, such as science clubs after school, science camps, and science fairs. To our knowledge, this represents the first measure that explores students’ interest in age-appropriate, science activities commonly associated with middle childhood.
Our analyzes revealed that Student Attitudes Towards STEM Careers Scale displayed a 3-factor structure; Factor 1Basic/Foundational Sciences, Factor II, Applied/Service-Oriented Sciences, and Factor III Computational Sciences. This measure was originally developed by the Friday Institute for upper elementary students, ages 4-5th grade, and the measure codebook does not articulate the number of factors probed by these statements. Therefore, the present study is the first to examine the factor structure of this measure in a diverse sample of 3rd-grade students.
4.1.1 Convergent validity
The pattern of positive correlations among the scales and subscales that comprised our measures suggest that those measures are assessing related constructs, and thus our results provide preliminary evidence of these measures’ convergent validity. For example, the robust, positive correlation between the Science Self-Efficacy Scale and the Science Self-Concept: Science Competence Subscale indicates that both scales/subscales are measuring beliefs about one’s competency in science but that these beliefs are distinct. This finding replicates recent work by Marsh et al. (2019b) in two ways. First, it is consistent with Marsh’s overall finding of a strong, positive association between self-efficacy and self-concept measures. Second, the fact that our observed associations among the self-efficacy and self-concept scales/subscales were smaller than those reported by Marsh et al. (2019b) may be explained, in part, by the fact that our self-efficacy measure was deliberately designed to include items referencing the future. While speculative, this interpretation provides initial empirical support for Marsh’s conceptual distinction between self-efficacy and self-concept.
Similarly, our results show that Student Interest in Science (Middle Childhood), Student Attitudes Toward STEM Careers Scale, and Science Self-Concept have subscales that assess different aspects of broadly similar beliefs and feelings. For example, the two subscales of the Student Interest in Science Activities Scale are moderately correlated, indicating that interest in formal and informal activities is related but is not the same. The same is true for the three subscales of the Student Attitudes Toward STEM Careers Scale. Scores on the Basic/Foundational Science careers subscale are moderately correlated with interest in Applied/Service-Oriented Science careers, while scores on the interest in Applied/Service-Oriented Science careers and Computational Science careers subscales are highly correlated. Finally, the fact that some subscales are not correlated with each other (e.g., Science Self-Concept: Science Competence subscale and the Student Interest in Science Activities Scale: Formal, Structured Activities) provides some preliminary evidence for the divergent validity of these measures, although additional research is clearly needed to further examine the convergent and divergent validity of these measures.
4.2 Implications for research and practice
Our results have implications for research in measurement development and offer guidance for using these measures to evaluate program effectiveness.
4.2.1 Going beyond internal consistency
It is common practice, particularly in the field of program evaluation, to assume that a measure is unidimensional if its internal consistency is high. However, this is not always the case, as illustrated by our results. For all four measures, we may have assumed unidimensionality based on the values of Cronbach’s alpha and the item-total correlations. The exploratory and confirmatory factor analyzes suggested that three of the four of these measures were not unidimensional, and, therefore, we calculated subscale scores for each factor.
Had we instead calculated a single score, it may have had serious implications in the context of a program evaluation. Imagine a situation in which researchers used the Science Self-Concept Scale to examine the effectiveness of an out-of-school time program designed to help students from underrepresented backgrounds develop positive science perceptions and competence. In one scenario, the researchers calculate a single score for the scale based on Cronbach’s alpha and item-total correlations, and, based on comparisons of these scores pre- and post-program, they conclude that there is no evidence that the program builds students’ science perceptions or sense of competence, and, based on this conclusion the program’s funder decides that they would prefer to support a new initiative.
In an alternate scenario, researchers conducted a factor analysis that leads them to calculate the same subscale scores reported above. Using these subscales, they find that while there is no evidence that the program builds students’ feelings of science competency, there is evidence that the program improves students’ ratings on the Feelings about Science (Affect) subscale. Based on these results, the program developers adjust the program to continue to support students’ affective experiences while continuing to dedicate more time to developing their feelings of competence, which ultimately leads to continued support for the program by funders, and, thereby, further opportunities for students to participate in the program. As this example illustrates, a seemingly minor analytic decision can, in fact, have serious practical consequences: it is entirely possible for program effects to go unobserved if researchers incorrectly assume a unidimensional measure structure and calculate overall scale scores to use in their program evaluations.
4.2.2 Importance of measurement development work in diverse populations
Understanding and improving STEM outcomes for students underrepresented in STEM fields requires sensitive measurement tools, developed with diverse populations. However, it is often assumed that the measures assess the same underlying constructs across populations. This is problematic, as there is evidence that a measure may not perform the same across groups and can be assessing different constructs for different populations (measurement noninvariance; Knight and Hill, 1998). Indeed, recent education research has shown that measurement noninvariance can impact the estimates of treatment effects even in randomized control trials, the “gold standard” for educational programs and interventions (Soland, 2021). For example, Dong and Dumas (2020) examined whether well-established personality measures are invariant across cultures, gender, and age. The reported evidence that several personality measures are not invariant across groups, indicates that the same measure appears to be measuring different constructs for different populations. This underscores the importance of conducting measurement development work with diverse populations to determine measurement invariance (equivalence). The current study takes the first step in develop reliable and valid measures of young students’ self-perceptions in science with a diverse sample of students. The measures can be used in future research to advance our theoretical understanding of STEM beliefs and identify promising programs that work well for underrepresented students.
4.3 Limitations and future directions
This paper establishes preliminary evidence for the reliability and validity of our measures and additional work should attempt to replicate their factor structure. While our analyzes indicate these measures are promising, psychometrically, future research should address the limitations of this preliminary pilot study and expand on this work in several ways.
First, our study was conducted with a sample of 204 3rd graders (8–9 years old) attending a public elementary school in a large, urban district. The size of our sample imposed certain limitations on our analyzes, which were most evident when attempting to fit higher-dimensional models to certain measures (e.g., the Student Interest in Science Activities (Middle Childhood) Scale). Therefore, our results should be replicated in future research employing larger samples. This research will also serve to inform the ongoing debate regarding the conceptual and empirical distinctions between self-efficacy and self-concept constructs at the general and domain-specific levels. For instance, Marsh et al. (2019b) explored the distinctions between self-efficacy and self-concept with a large sample of 11- to 12-year-old German students using 5 established and well-validated measures. They found generalized math self-efficacy and math outcome expectancies were statistically indistinguishable from math self-concept, suggesting that they may represent a single construct, but that these measures were empirically distinct from test-related and functional measures of self-efficacy. Given that understanding elementary school children’s science self-efficacy and self-concept is a burgeoning area of research with clear implications for workforce development, more research is clearly needed to further explore the conceptual and empirical distinctions between these constructs. Our newly devised measures could serve as a springboard for more extensive studies featuring larger samples that would allow fitting models with alternative factor structures, including those in which science self-efficacy and self-concept items loaded on a single factor. These studies could also seek to systematically vary items according to their temporal frame of reference (past/future) to investigate whether this difference in frame of reference accounts for much of the distinction between self-efficacy and self-concept, as proposed by Marsh et al. (2019b).
A second limitation to this work arises from a potentially unique educational experience within our sample. The pilot study was conducted in a school district that prioritizes science education, even in elementary school. This district hosts yearly science fairs and includes a variety of science opportunities for their students. This may partially explain the distributions for each measure’s scale and subscale (shown in Figures 1–4); distributions that suggest a population of students who are interested and moderately confident in their science skills. Additional work should replicate this in other districts to examine the variability in student self-perceptions and interests in this age range from districts that may not have a similar focus on science.
Future research should also expand upon this work with additional student populations (e.g., students from other racial/ethnic backgrounds, across rural and suburban populations, and across older and younger elementary populations). One point of particular interest would be the extent to which older students’ responses to the items that comprised certain sub-scales might be more internally consistent than the responses provided by their younger counterparts. The internal consistency values for the items that comprised each factor of the Student Interest in Science Activities (Middle Childhood) measure were marginal, as was the value for the items that corresponded to the third factor (Computational Sciences) of the Student Attitudes About STEM Careers measure. This may reflect, in part, 3rd grade students’ relative unfamiliarity with the outlined science activities or STEM-related careers (e.g., computer science). For instance, while the science activities described in the Student Interest in Science Activities measure were developmentally appropriate, not all children have access to these activities, which would likely lead to uncertainty about their interest level. Future research with students representing a wider range of ages and background experiences would allow this hypothesis to be tested.
Relatedly, future research should also explore whether students’ demographic characteristics (e.g., gender identity, race/ethnicity) are associated with different responses on the scales and subscales that comprise the measures featured in this study. However, this should only be done after establishing that these scales and sub-scales display properties of measurement invariance across these demographically-defined groups. This will allow us to assess whether our measures are assessing the same constructs and on the same scales for students with different gender identities and from different racial and ethnic backgrounds. Conducting measurement development work with diverse populations necessitates ensuring that the developed measures are assessing the same constructs for all populations.
A third limitation of our study is that our capacity to establish convergent and divergent validity is limited. While we can glean some evidence of these from the sub-scales of each measure, additional work should include additional measures that should and should not theoretically be related to these measures to provide additional evidence of convergent and divergent validity. Finally, a natural question that arises from this work relates to the predictive capacity of these measures to determine how they relate to and predict students’ performance in science and mathematics at school. Our work is limited in that it does not allow us to answer this question. However, the measurement development work presented here paves the way for others to answer such questions.
Lastly, another critical line of research should elucidate how science self-efficacy, self-concept, and interest develop over time, beginning in the elementary years when students start to engage in formal and informal science activities. This work should examine how different types of learning experiences influence the developmental trajectory, and whether students’ science self-perceptions and interest predict academic achievement, higher education fields of study, and entrance into STEM fields. Information from this line of research will be critical to the development and expansion of evidence-based programs and practices aimed at growing the STEM workforce.
5 Conclusion
In addition to offering a path for additional measurement development work, our findings contribute to theory and practice in three ways. First, these measures pave the way for advances in understanding the nature of elementary students’ science self-perceptions and interests. These measures can be used in future research to generate insights into how self-perceptions and interests in STEM develop over time and be used to study their impact on academic and behavioral achievement throughout students’ tenure in school. Second, our findings offer direct guidance to researchers on how to examine student responses within subscales of these measures. Three of the four measures had multi-factor structures, suggesting a more nuanced analytic approach will be important for future work. Third, understanding and improving STEM outcomes for underrepresented students requires psychometrically sound measures for diverse student populations. These measures are available for use by researchers and practitioners to determine what types of programs and practices are most effective in fostering STEM achievement and for whom. The work presented here is a first step towards developing measures that can be used to inform and refine programs intended to support diversity and representation in science.
Data availability statement
The raw data supporting the conclusions of this article will be made available by the authors, without undue reservation.
Ethics statement
The studies involving humans were approved by Heartland Institutional Review Board. The studies were conducted in accordance with the local legislation and institutional requirements. The ethics committee/institutional review board waived the requirement of written informed consent for participation from the participants or the participants' legal guardians/next of kin because Our district partners co-developed this study. According to their internal guidelines, this project falls under typical school curriculum development and field testing practices and data is collected to inform the future refinement of instructional practices in the district. Additionally, the requirement for informed consent is outside the normal operating protocols for the district, and would place a greater burden on district staff to obtain consent for common educational practices.
Author contributions
KG led the literature review, data collection, and manuscript development. KF led development and adaptation of measures and contributed to the literature review and manuscript preparation. SH led data analytic plan, conducted statistical analyses, and contributed to manuscript preparation. MC contributed to the literature review. All authors provided critical feedback and helped shape the research design, measurement development/adaptation, analytic plan, and manuscript preparation. All authors approved the submitted version of this article.
Funding
The author(s) declare financial support was received for the research, authorship, and/or publication of this article. This was funded by a grant from the Institute of Education Sciences to PI Gagnier, R305A200523.
Conflict of interest
KG and KF were employed by AnLar LLC.
The remaining authors declare that the research was conducted in the absence of any commercial or financial relationships that could be construed as a potential conflict of interest.
Publisher’s note
All claims expressed in this article are solely those of the authors and do not necessarily represent those of their affiliated organizations, or those of the publisher, the editors and the reviewers. Any product that may be evaluated in this article, or claim that may be made by its manufacturer, is not guaranteed or endorsed by the publisher.
Supplementary material
The Supplementary material for this article can be found online at: https://www.frontiersin.org/articles/10.3389/feduc.2023.1242876/full#supplementary-material
Footnotes
1. ^“Unstructured activities” in the developmental literature often include self-directed activities that do, indeed, contain some level of structure (e.g., reading a book or playing a video game may be self-initiated and directed by the student, but the overall structure was created by an adult) and may still require some adult supervision. Thus, we refer to this set of activities as “less-structured.”
2. ^Model fit is often assessed using a series of statistics including the Root Mean Square Error of Approximation (RMSEA), the Standardized Root Mean Square Residual (SRMR), the confirmatory fit index (CFI), and the Tucker-Lewis index (TLI). Although the thresholds used to qualify a model’s fit as “acceptable” or “good” vary somewhat, those suggested by Hu et al. (2022) are widely employed and specify an RMSEA and SRMR below 0.08 and CFI and TLI values above 0.95 as indicative of acceptable model fit. To determine whether the addition of another factor significantly improves model fit (in which case the concomitant loss of parsimony might be deemed acceptable), a likelihood ratio test (LRT) based on the chi-squared (X2) values associated with each model is often used.
References
Andrew, S. (1998). Self-efficacy as a predictor of academic performance in science. J. Adv. Nurs. 27, 596–603. doi: 10.1046/j.1365-2648.1998.00550.x
Arens, A. K., Yeung, A. S., Craven, R. G., and Hasselhorn, M. (2011). The twofold multidimensionality of academic self-concept: Domain specificity and separation between competence and affect components. J. Educ. Psychol. 103:970.
Bandura, A. (1977). Self-efficacy: toward a unifying theory of behavioral change. Psychol. Rev. 84:191. doi: 10.1037/0033-295X.84.2.191
Bandura, A. (1982). Self-efficacy mechanism in human agency. Am. Psychol. 37:122. doi: 10.1037/0003-066X.37.2.122
Bandura, A. (2006). “Guide for constructing self-efficacy scales” in Self-efficacy beliefs of adolescents. eds. F. Pajares and T. Urdan (Greenwich, CT: Information Age Publishing)
Beier, M., and Rittmayer, A. (2008). Literature overview: motivational factors in STEM: interest and self-concept. Assessing Women and Men in Engineering.
Bong, M., and Clark, R. E. (1999). Comparison between self-concept and self-efficacy in academic motivation research. Educ. Psychol. 34, 139–153. doi: 10.1207/s15326985ep3403_1
Bong, M., and Skaalvik, E. M. (2003). Academic self-concept and self-efficacy: how different are they really? Educ. Psychol. Rev. 15, 1–40. doi: 10.1023/A:1021302408382
Britner, S. L., and Pajares, F. (2001). Self-efficacy beliefs, motivation, race, and gender in middle school science. J. Women Minor. Sci. Eng. 7, 271–285. doi: 10.1615/JWomenMinorScienEng.v7.i4.10
Britner, S. L., and Pajares, F. (2006). Sources of science self-efficacy beliefs of middle school students. J. Res. Sci. Teach. 43, 485–499. doi: 10.1002/tea.20131
Bureau of Labor Statistics (2014). John I. Jones, “an overview of employment and wages in science, technology, engineering, and math (STEM) groups,” beyond the numbers: Employment & Unemployment, (U.S. Bureau of Labor Statistics, April 2014). Available at: http://www.bls.gov/opub/btn/volume-3/an-overview-of-employment.htm
Byars-Winston, A., Estrada, Y., Howard, C., Davis, D., and Zalapa, J. (2010). Influence of social cognitive and ethnic variables on academic goals of underrepresented students in science and engineering: a multiple-groups analysis. J. Couns. Psychol. 57:205. doi: 10.1037/a0018608
Bybee, R., and McCrae, B. (2011). Scientific literacy and student attitudes: perspectives from PISA 2006 science. Int. J. Sci. Educ. 33, 7–26. doi: 10.1080/09500693.2010.518644
Chen, S. K., Yeh, Y. C., Hwang, F. M., and Lin, S. S. (2013). The relationship between academic self-concept and achievement: a multicohort–multioccasion study. Learn. Individ. Differ. 23, 172–178. doi: 10.1016/j.lindif.2012.07.021
Chittum, J. R., Jones, B. D., Akalin, S., and Schram, A. B. (2017). The effects of an afterschool STEM program on students’ motivation and engagement. Int. J. STEM Educ. 4:11. doi: 10.1186/s40594-017-0065-4
Choi, N. (2005). Self-efficacy and self-concept as predictors of college students' academic performance. Psychol. Sch. 42, 197–205. doi: 10.1002/pits.20048
DiStefano, C., and Hess, B. (2005). Using confirmatory factor analysis for construct validation: an empirical review. J. Psychoeduc. Assess. 23, 225–241. doi: 10.1177/073428290502300303
Dong, Y., and Dumas, D. (2020). Are personality measures valid for different populations? A systematic review of measurement invariance across cultures, gender, and age. Pers. Individ. Differ. 160:109956.
Eccles, J. S. (2005). “Subjective task value and the Eccles et al. model of achievement-related choices,” in Handbook of competence and motivation. 105:121.
Farenga, S. J., and Joyce, B. A. (1998). Science-related attitudes and science course selection: a study of high-ability boys and girls. Roeper Rev. 20, 247–251. doi: 10.1080/02783199809553901
Ferla, J., Valcke, M., and Cai, Y. (2009). Academic self-efficacy and academic self-concept: reconsidering structural relationships. Learn. Individ. Differ. 19, 499–505. doi: 10.1016/j.lindif.2009.05.004
Fisher, K. (2009). How play works: understanding the elements of early learning. Mind, Brain, and Education Society conference, Philadelphia, PA.
Fisher, K., Hirsh-Pasek, K., Golinkoff, R. M., and Glick Gryfe, S. (2008). Conceptual split? Parents' and experts' perceptions of play in the 21st century. J. Appl. Dev. Psychol. 29, 305–316. doi: 10.1016/j.appdev.2008.04.006
Fletcher, A. C., Nickerson, P., and Wright, K. L. (2003). Structured leisure activities in middle childhood: links to well-being. J. Community Psychol. 31, 641–659. doi: 10.1002/jcop.10075
Friday Institute for Educational Innovation (2012). Student attitudes toward STEM survey- upper elementary school students, Raleigh, NC: Friday Institute for Educational Innovation.
Fry, R., Kennedy, B., and Funk, C. (2021). STEM jobs see uneven progress in increasing gender, racial and ethnic diversity. Pew Research Center, Washington, DC.
Gist, M. E., and Mitchell, T. R. (1992). Self-efficacy: a theoretical analysis of its determinants and malleability. Acad. Manage. Rev. 17, 183–211. doi: 10.2307/258770
Guay, F., Larose, S., and Boivin, M. (2004). Academic self-concept and educational attainment level: a ten-year longitudinal study. Self Identity 3, 53–68. doi: 10.1080/13576500342000040
Hanauer, D. I., Graham, M. J., and Hatfull, G. F. (2016). A measure of college student persistence in the sciences (PITS). CBE—life sciences. Education 15:ar54. doi: 10.1187/cbe.15-09-0185
Harackiewicz, J. M., Barron, K. E., Tauer, J. M., and Elliot, A. J. (2002). Predicting success in college: a longitudinal study of achievement goals and ability measures as predictors of interest and performance from freshman year through graduation. J. Educ. Psychol. 94:562. doi: 10.1037/0022-0663.94.3.562
Heilbronner, N. N. (2011). Stepping onto the STEM pathway: factors affecting talented students’ declaration of STEM majors in college. J. Educ. Gift. 34, 876–899. doi: 10.1177/0162353211425100
Hidi, S., and Renninger, K. A. (2006). The four-phase model of interest development. Educ. Psychol. 41, 111–127. doi: 10.1207/s15326985ep4102_4
Hu, X., Jiang, Y., and Bi, H. (2022). Measuring science self-efficacy with a focus on the perceived competence dimension: using mixed methods to develop and instrument and explore changes through cross-sectional and longitudinal analyses in high school. Int. J. STEM Educ. 9:47. doi: 10.1186/s40594-022-00363-x
Huang, C. (2011). Self-concept and academic achievement: a meta-analysis of longitudinal relations. J. Sch. Psychol. 49, 505–528. doi: 10.1016/j.jsp.2011.07.001
Hurtado, S., Newman, C. B., Tran, M. C., and Chang, M. J. (2010). Improving the rate of success for underrepresented racial minorities in STEM fields: insights from a national project. New Direct. Inst. Res. 2010, 5–15. doi: 10.1002/ir.357
Jansen, M., Scherer, R., and Schroeders, U. (2015b). Students' self-concept and self-efficacy in the sciences: differential relations to antecedents and educational outcomes. Contemp. Educ. Psychol. 41, 13–24. doi: 10.1016/j.cedpsych.2014.11.002
Jansen, M., Schroeders, U., and Lüdtke, O. (2014). Academic self-concept in science: multidimensionality, relations to achievement measures, and gender differences. Learn. Individ. Differ. 30, 11–21. doi: 10.1016/j.lindif.2013.12.003
Jansen, M., Schroeders, U., Lüdtke, O., and Marsh, H. W. (2015a). Contrast and assimilation effects of dimensional comparisons in five subjects: an extension of the I/E model. Learn. Individ. Differ. 107:1086. doi: 10.1037/edu0000021
Jansen, M., Schroeders, U., Lüdtke, O., and Marsh, H. W. (2019). The dimensional structure of students’ self-concept and interest in science depends on course composition. Learn. Instr. 60, 20–28. doi: 10.1016/j.learninstruc.2018.11.001
Knight, G. P., and Hill, N. E. (1998). “Measurement equivalence in research involving minority adolescents” in Studying minority adolescents. eds. V. C. McLoyd and L. Steinberg (London: Psychology Press), 197–224.
Köller, O., Baumert, J., and Schnabel, K. (2001). Does interest matter? The relationship between academic interest and achievement in mathematics. J. Res. Math. Educ. 32, 448–470. doi: 10.2307/749801
Lent, R. W., Brown, S. D., and Larkin, K. C. (1984). Relation of self-efficacy expectations to academic achievement and persistence. J. Couns. Psychol. 31:356. doi: 10.1037/0022-0167.31.3.356
Lichtenberger, E., and George-Jackson, C. (2013). Predicting high school Students' interest in majoring in a STEM field: insight into high school Students' postsecondary plans. J. Career Tech. Edu. 28, 19–38. doi: 10.21061/jcte.v28i1.571
Maltese, A. V., and Tai, R. H. (2011). Pipeline persistence: examining the association of educational experiences with earned degrees in STEM among US students. Sci. Educ. 95, 877–907. doi: 10.1002/sce.20441
Marsh, H. W. (1990). The structure of academic self-concept: The Marsh/Shavelson model. J. Educ. Psychol. 82:623.
Marsh, H. W., Abduljabbar, A. S., Parker, P. D., Morin, A. J., Abdelfattah, F., Nagengast, B., et al. (2015). The internal/external frame of reference model of self-concept and achievement relations: age-cohort and cross-cultural differences. Am. Educ. Res. J. 52, 168–202. doi: 10.3102/0002831214549453
Marsh, H. W., and Craven, R. G. (2006). Reciprocal effects of self-concept and performance from a multidimensional perspective: beyond seductive pleasure and unidimensional perspectives. Perspect. Psychol. Sci. 1, 133–163. doi: 10.1111/j.1745-6916.2006.00010.x
Marsh, H. W., and Martin, A. J. (2011). Academic self-concept and academic achievement: relations and causal ordering. Br. J. Educ. Psychol. 81, 59–77. doi: 10.1348/000709910X503501
Marsh, H. W., and O'Mara, A. (2008). Reciprocal effects between academic self-concept, self-esteem, achievement, and attainment over seven adolescent years: unidimensional and multidimensional perspectives of self-concept. Pers. Soc. Psychol. Bull. 34, 542–552. doi: 10.1177/0146167207312313
Marsh, H. W., Pekrun, R., Parker, P. D., Murayama, K., Guo, J., Dicke, T., et al. (2019a). The murky distinction between self-concept and self-efficacy: beware of lurking jingle-jangle fallacies. J. Educ. Psychol. 111:331. doi: 10.1037/edu0000281
Marsh, H. W., and Scalas, L. F. (2011). Self-concept in learning: reciprocal effects model between academic self-concept and academic achievement. Social and emotional aspects of learning. Pers. Soc. Psychol. Bull. 1, 191–198. doi: 10.1016/B978-0-08-044894-7.00619-9
Marsh, H. W., Seaton, M., Dicke, T., Parker, P., and Horwood, M. S. (2019b). The centrality of academic self-concept to motivation and learning (pp. 36–62). In Renninger, A. K., and Hidi, S. E.. (Eds), The Cambridge handbook of motivation and learning. Cambridge University Press. Cambridge.
Midgley, C., Maehr, M. L., Hruda, L. Z., Anderman, E., Anderman, L., Freeman, K. E., et al. (2000). Manual for the patterns of adaptive learning scales. Ann Arbor: University of Michigan, 734–763.
Nagengast, B., and Marsh, H. W. (2014). Motivation and engagement in science around the globe: testing measurement invariance with multigroup structural equation models across 57 countries using PISA 2006. Handbook of international large-scale assessment. Background, technical issues, and methods of data analysis, 317–334. L. Rutkowski, M. Daviervon, and D. Rutkowski. Routledge. London
National Academies of Sciences, Engineering, and Medicine (2015). Science Teachers' learning: Enhancing opportunities, creating supportive contexts. Washington, DC: The National Academies Press.
National Research Council, Division of Behavioral, Social Sciences, Board on Science Education, and Committee on Guidance on Implementing the Next Generation Science Standards . (2015). Guide to implementing the next generation science standards.
National Science and Technology Committee (NSTC) (2018). Charting a course for success: America’s strategy for STEM education. Available at: https://www.whitehouse.gov/wp-content/uploads/2018/12/STEM-Education-Strategic-Plan-2018.pdf
National Student Clearing House Research Center (2021). Current term enrollment estimates report series. Fall 2021 Enrollment Estimates. Available at: https://nscresearchcenter.org/wp-content/uploads/CTEE_Report_Fall_2021.pdf
National Student Clearing House Research Center (2022). Current term enrollment estimates. Spring 2022. Available at: https://nscresearchcenter.org/current-term-enrollment-estimates/
Office of Innovation and Improvement (OII) (2016). STEM 2026: A vision for innovation in STEM education. Available at: https://www.air.org/system/files/downloads/report/STEM-2026-Vision-for-Innovation-September-2016.pdf
Organization for Economic Co-operation and Development (2007). OECD insights human capital how what you know shapes your life: How what you know shapes your life. OECD Publishing. Paris
Organization for Economic Co-operation and Development , (2018), Education at a glance 2018: OECD indicators, OECD Publishing, Paris.
Osborne, J., Simon, S., and Collins, S. (2003). Attitudes towards science: a review of the literature and its implications. Int. J. Sci. Educ. 25, 1049–1079. doi: 10.1080/0950069032000032199
Pinxten, M., De Fraine, B., Van Damme, J., and D'Haenens, E. (2010). Causal ordering of academic self-concept and achievement: effects of type of achievement measure. Br. J. Educ. Psychol. 80, 689–709. doi: 10.1348/000709910X493071
Reardon, S. F. (2011). The widening academic achievement gap between the rich and the poor: new evidence and possible explanations. Whither opportunity, 91–116. Russell Sage Foundation Manhattan, NY
Rotgans, J. I., and Schmidt, H. G. (2011). Situational interest and academic achievement in the active-learning classroom. Learning and Instruction 21, 58–67. doi: 10.1016/j.learninstruc.2009.11.001
Sainz, M., Fabregues, S., Romano, M., and Lopez, B. (2022). Interventions to increase young people’s interest in STEM: a scoping review. Front. Psychol. 13:954996. doi: 10.3389/fpsyg.2022.954996
Schiefele, U., Krapp, A., and Winteler, A. (1992). “Interest as a predictor of academic achievement: A meta-analysis of research” in The role of interest in learning and development. eds. K. A. Renninger, S. Hidi, and A. Krapp (Mahwah, NJ: Lawrence Erlbaum)
Schunk, D. H. (1989). Self-efficacy and achievement behaviors. Educ. Psychol. Rev. 1, 173–208. doi: 10.1007/BF01320134
Schunk, D. H. (1991). Self-efficacy and academic motivation. Educ. Psychol. 26, 207–231. doi: 10.1080/00461520.1991.9653133
Schunk, D. H. (1995). “Self-efficacy and education and instruction” in Self-efficacy, adaptation, and adjustment: Theory, research, and application. ed. J. E. Maddux (New York, NY: Springer), 281–303.
Schunk, D. H., and Pajares, F. (2002). “The development of academic self-efficacy” in Development of achievement motivation. eds. A. Wigfield and S. E. Jacquelynne (Cambridge, MA: Academic Press), 15–31.
Shavelson, R. J., Hubner, J. J., and Stanton, G. C. (1976). Self-concept: Validation of construct interpretations. Rev. Educ. Res. 46, 407–441.
Shaw, E. J., and Barbuti, S. (2010). Patterns of persistence in intended college major with a focus on STEM majors. NACADA J. 30, 19–34. doi: 10.12930/0271-9517-30.2.19
Skaalvik, E. M., and Rankin, R. J. (1990). Math, verbal, and general academic self-concept: The internal/external frame of reference model and gender differences in self-concept structure. J. Educ. Psychol. 82:546.
Soland, J. (2021). Is measurement noninvariance a threat to inferences drawn from randomized control trials? Evidence from empirical and simulation studies. Appl. Psychol. Meas. 45, 346–360. doi: 10.1177/01466216211013102
Stewart, A. L., Thrasher, A. D., Goldberg, J., and Shea, J. A. (2012). A framework for understanding modifications to measures for diverse populations. J. Aging Health 24, 992–1017. doi: 10.1177/0898264312440321
Taskinen, P. H., Schütte, K., and Prenzel, M. (2013). Adolescents' motivation to select an academic science-related career: the role of school factors, individual interest, and science self-concept. Educ. Res. Eval. 19, 717–733. doi: 10.1080/13803611.2013.853620
The President’s Council of Advisors on Science and Technology (PCAST) (2010). Prepare and inspire: K-12 education in science, technology, engineering, and math (STEM) for America’s future. Executive Office of the President of the U.S.A. Available at: https://nsf.gov/attachments/117803/public/2a%2D%2DPrepare_and_Inspire%2D%2DPCAST.pdf
Trautwein, U., and Möller, J. (2016). “Self-concept: determinants and consequences of academic self-concept in school contexts” in Psychosocial skills and school systems in the 21st century: Theory, research, and practice. eds. A. A. Lipnevich, F. Preckel, and R. D. Roberts (Cham: Springer), 187–214.
U.S. Department of Education (2022). U.S. Department of Education launches new initiative to enhance STEM education for all students. Available at: https://www.ed.gov/news/press-releases/us-department-education-launches-new-initiative-enhance-stem-education-all-students
U.S. Department of Education, Institute of Education Sciences, National Center for Education Statistics, National Assessment of Educational Progress (NAEP) (2019). Various years, 2009–2019 science assessments. Available at: https://www.nationsreportcard.gov/science/supporting_files/2019_infographic_science.pdf
U.S. Department of Education, Institute of Education Sciences, National Center for Education Statistics, National Assessment of Educational Progress (NAEP) (2022). Reading. Available at: https://www.nationsreportcard.gov/highlights/reading/2022/
Usher, E. L., and Pajares, F. (2008). Sources of self-efficacy in school: critical review of the literature and future directions. Rev. Educ. Res. 78, 751–796. doi: 10.3102/0034654308321456
Valentine, J. C., DuBois, D. L., and Cooper, H. (2004). The relation between self-beliefs and academic achievement: A meta-analytic review. Educ. Psychol. 39, 111–133.
Wigfield, A., and Eccles, J. S. (2000). Expectancy–value theory of achievement motivation. Contemp. Educ. Psychol. 25, 68–81. doi: 10.1006/ceps.1999.1015
Keywords: self-efficacy, measurement development, science education, self-concept, self-perceptions, elementary school
Citation: Gagnier KM, Holochwost SJ, Ceren M and Fisher KR (2024) Filling a gap: initial evidence for reliable and valid measures of students’ self-concept, self-efficacy, and interest in science with elementary students traditionally underrepresented in STEM. Front. Educ. 8:1242876. doi: 10.3389/feduc.2023.1242876
Edited by:
André Bresges, University of Cologne, GermanyReviewed by:
Michael D. Broda, Virginia Commonwealth University, United StatesKathleen Falconer, University of Cologne, Germany
Copyright © 2024 Gagnier, Holochwost, Ceren and Fisher. This is an open-access article distributed under the terms of the Creative Commons Attribution License (CC BY). The use, distribution or reproduction in other forums is permitted, provided the original author(s) and the copyright owner(s) are credited and that the original publication in this journal is cited, in accordance with accepted academic practice. No use, distribution or reproduction is permitted which does not comply with these terms.
*Correspondence: Kristin Michod Gagnier, a2dhZ25pZXJAYW5sYXIuY29t
†These authors share first authorship