 Kelly Anne Young
 Elizabeth Archer
- 1Institute for Open Distance Learning, University of South Africa, Pretoria, South Africa
- 2Institutional Research, University of the Western Cape, Cape Town, South Africa
Grit has been associated with student success in a plethora of higher education (HE) studies. In order to measure and evaluate the predictive validity of grit in student success in a particular context, an appropriate, reliable and valid instrument is required. This paper examines the short grit scale’s (Grit-S) psychometric properties among a sample of 837 postgraduate students enrolled at the University of South Africa (UNISA). This appears to be the first study to explore the psychometric rigour of the scale among postgraduates within a South African distance education (DE) setting. An exploratory factor analysis (EFA) followed by partial confirmatory factor analysis (PCFA) revealed that the same two factors commonly reported in the grit literature could be detected in the items tested (i.e. ‘passion’ and ‘perseverance’ for long-term goals), and in combination explained 57.22% of the variance. Model fit indices for the two-factor solution were satisfactory (NFI = 0.984; TLI = 0.981; CFI = 0.991; RMSEA = 0.038). Further results from the item analysis indicated that both factors (passion and perseverance) were soundly reliable, as was the overall Grit-S scale, yielding Cronbach Alpha values of ≥0.77. Overall, the study provides promising evidence that the Grit-S scale can validly and reliably be used to operationalise grit (and the separate dimensions of perseverance and passion) among postgraduates pursuing their DE studies. Further theoretical and practical implications are discussed.
1. Introduction
Psychological grit has garnered much attention over the last 15 years and has widely been touted as the panacea to predicting student retention and success among traditional tertiary students (Duckworth et al., 2007; Wu et al., 2012; Cross, 2014; Salles et al., 2014; Reraki et al., 2015; Beyhan, 2016; Akos and Kretchmar, 2017; Broghammer, 2017; Lee and Sohn, 2017; Muenks et al., 2017; Pate et al., 2017; Salles et al., 2017; Mason, 2018; Rogalski, 2018; Terry and Peck, 2020; Sulla et al., 2022). In addition to this body of predictive validity, the Grit-S scale has demonstrated accepted construct validity and reliability levels among these student populations. Although noteworthy, the focus on traditional students precludes the generalizability of the psychometric properties of the Grit-S scale to other student populations (Xu et al., 2020). With the majority of the psychometric reports emanating from traditional, full-time students, or those enrolled in atypical educational settings (such as Ivy-League institutions or military academies), the importance of examining grit’s factorial stability in distance education (DE) cohorts cannot be overstated, especially considering the online impetus driven by COVID-19 (Karaman et al., 2019). Moreover, as Xu et al. (2020) rightly allude to, little is known about grit in DE and whether it can be reliably measured across culturally, ethnically and linguistically diverse student populations – characteristic of the South African DE student population. It is against this brief introduction that the current paper explores whether the Grit-S scale exhibits reasonable construct validity and reliability among postgraduate students in a diverse South African DE environment.
2. Defining and measuring psychological grit
It is essential to first define grit in the context of this paper and then outline how the conceptualization of grit can be measured. The following section deals with both the definition and measurement of grit.
2.1. Definition
Psychological grit was first coined by Duckworth et al. (2007) and is typically operationalised as a higher-order construct with two lower-order facets: consistency of interest (also referred to as passion) and perseverance (of effort). The first dimension, passion, measures an individual’s self-reported tendency to pursue (and remain invested in) the same goal over a long period. In contrast, perseverance refers to an individual’s propensity to maintain the energy and time needed to achieve this goal, despite potential distractions and setbacks (Mullen and Crowe, 2018).
2.2. Developing a measure of grit
Prompted by the absence of an adequate measure for grit, Duckworth and colleagues initially tested a pool of 27 Likert-scale items (believed to tap into the construct of grit) among 1,545 adults to explore hidden dimensions and reliability coefficients (Duckworth et al., 2007). Owing to poor item-total correlations, redundancy and complex vocabulary, these 27 items were reduced to 17. Next, using half of the sample chosen randomly (n = 772), an exploratory factor analysis (EFA) was conducted on these 17 items to explore the underlying factor structure. While this analysis suggested removing five items, two dimensions emerged and were deemed valid and likely to produce consistent results over time. The resulting two-factor, correlated model (r = 0.45) was retained and comprised the passion dimension (or consistency of interest; six items) and the perseverance (of effort) dimension (6 items).
To test the integrity of this two-factor solution, Duckworth and colleagues performed a confirmatory factor analysis (CFA) with the remaining 773 participants in the sample. Although the results demonstrated a relatively poor fit for the two-factor structure (Comparative Fit Index, CFI = 0.83; Root mean square error of approximation, RMSEA = 0.11), the overall scale demonstrated high internal consistency (α = 0.85) and thus became known as the Grit-O scale.
A couple of years later, Duckworth and Quinn (2009) examined the performance of the Grit-O scale in four different samples. Owing to low item-level correlations, four items (i.e. two from each dimension) were removed from the Grit-O scale. The resulting 8-item survey1 was labelled the Grit-S scale and exhibited more robust psychometric properties and better indices of fit when compared to its 12-item counterpart (Duckworth and Quinn, 2009). These findings, along with others from around the globe, are discussed next.
3. Scale validation from across the globe
The two-factor structure of grit is commonly cited in educational research (Duckworth and Quinn, 2009; Arslan et al., 2013; Christensen and Knezek, 2014; Meriac et al., 2015; Reraki et al., 2015; Rojas, 2015; Stewart, 2015; Datu et al., 2016; Broghammer, 2017; Pate et al., 2017; Arco-tirado et al., 2018; Collaço, 2018; Rojas and Tyler, 2018). In the earliest and perhaps most seminal of these studies, Duckworth and Quinn (2009) showed that the two-factor structure of the Grit-S scale held an acceptable level of model fit among two cohorts of West Point cadets2 (CFI ≥ 0.950, RMSEA < 0.07). More importantly, these results revealed that the two-factor model fit the data significantly better (when compared to a single-factor solution) as indicated by a significant chi-square difference, Δχ2(1) = 191.93, p < 0.001.
Within a HE setting, the two-factor solution exhibited good levels of fit among both traditional (CFI > 0.98, RMSEA < 0.05; Pate et al., 2017; Rojas and Tyler, 2018) and non-traditional students in the United States (CFI = 0.98, RMSEA = 0.06; Meriac et al., 2015), as well as among Filipino students enrolled in a private higher education institution (CFI = 0.97, TLI = 96, RMSEA = 0.05; Datu et al., 2016). Further studies conducted in various countries including Spain, Turkey, Italy, Poland, and the Netherlands have also shown that the two-factor model demonstrates acceptable levels of fit in translated versions of the Grit-S scale among tertiary students. These studies have reported CFI indices of at least 0.920, RMSEA of no more than 0.08, and SRMR indices of less than 0.08 (Arslan et al., 2013; Reraki et al., 2015; Saricam et al., 2016; Wyszyńska et al., 2017; Arco-tirado et al., 2018; Sulla et al., 2018; Xu et al., 2020).
Although limited, there is some support for the two-factor grit structure among DE students. Xu et al. (2020) compared one and two-factor solutions (for both the Grit-O and Grit-S scales) among DE students in the Netherlands using an item response theory (IRT) CFA (n = 2,027). The first model assumed uni-dimensionality, whereas the second tested the two-factor structure with passion and perseverance as separate dimensions. Concurrent with other findings in the field, the two-factor model of grit fit the data significantly better than a one-factor solution for both scales (Xu et al., 2020). Moreover, the two-factor Grit-S model fitted the data better than the earlier two-factor Grit-O model.
There are however more recent studies which have favoured a unidimensional structure of grit (Gonzalez et al., 2020; Postigo et al., 2021). These studies have reported model fit indices ranging between 0.89 and 0.98 (CFI) and RMSEA values between 0.12 and 0.05, respectively. Regardless of whether commonly-accepted thresholds have been met (CFI > 0.95 and RMSEA < 0. 06; Hu and Bentler, 1999), the findings by Gonzalez et al. (2020) emanate from samples outside of a HE setting (as do those by Postigo et al., 2021). Moreover, Postigo et al. (2021) developed a new measure of grit (i.e. the Oviedo Grit Scale / escala grit de Oviedo; EGO) and did not validate either of the grit scales by Duckworth et al. (2007) and Duckworth and Quinn (2009). As such, although these results highlight a lack of clarity which still exists on the dimensional aspect of the construct, their applicability in the current paper is limited.
3.1. A notable (validity) gap
While worthy of comparison, particularly due to the shared tertiary setting, most of the studies mentioned above focused on undergraduate students in traditional, face-to-face HEIs abroad, thus limiting the generalisability to other contexts. In addition, although grit has been explored among postgraduate students (Burkhart et al., 2014; Salles et al., 2014; Aswini and Deb, 2017; Palisoc et al., 2017; Kannangara et al., 2018) and South African students (Urban and Pendame, 2015; Mason, 2018), the psychometric analyses in these studies are either non-existent or focus only on the reliability of the scale. More importantly, although reported among DE students (Xu et al., 2020), the psychometric properties relate solely to a sample of students in the Netherlands (whose grit scales were translated into Dutch). As such, the absence of comparable findings suggests that this paper is one of the first to explore the factor structure of the English version of the Grit-S scale using a sample of South African postgraduate DE students.
4. Reliability indices from across the globe
Spanning over a decade, grit and its dimensions have shown to be reliable across a range of student populations. In the earliest of these studies, Duckworth and Quinn (2009) reported an overall reliability estimate of 0.83 for the Grit-S scale among Ivy League undergraduates in the United States (n = 139). Further analyses revealed reliability coefficients of 0.79 and 0.78 for the passion and perseverance domains, respectively. Additional research emanating from contact-based institutions in the United States has attested to the reliability of the Grit-S scale among undergraduates, with Cronbach’s alpha coefficients ranging from 0.73 to 0.84 (Akos and Kretchmar, 2017; Rojas and Tyler, 2018; Luthans et al., 2019).
Reraki et al. (2015) conducted a study with undergraduate students in Turkey and found similar results, reporting an overall Cronbach’s alpha of 0.88 for the Grit-S scale. More recently, Arco-tirado et al. (2018) and Sulla et al. (2018) conducted studies with undergraduate students in Spain and Italy, respectively, and found that the Grit-S scale also produced reliable results, with Cronbach’s alpha coefficients of 0.75 and 0.76. In addition to these European statistics, research emanating from Korea has attested to the reliability of the Grit-O scale among a sample of undergraduates (α = 0.75; Hwang et al., 2017).
From a global south perspective, the Grit-S and Grit-O scales have also shown to produce reliable results among undergraduate students in contact-based universities in South Africa (Urban and Pendame, 2015; Mason, 2018). In the most recent of these South African studies, Mason (2018) revealed that the Grit-O scale, along with its subscales of passion and perseverance, exhibited good reliability among first-year students in undergraduate programmes at a university of technology (α = 0.81, α = 0.80, and α = 0.78, respectively). The Grit-S scale, by similar token, demonstrated acceptable levels of reliability among final-year undergraduates enrolled in a traditional university in South Africa, producing a reliability coefficient of 0.71 (Urban and Pendame, 2015). Clearly, there is substantial evidence to support the reliability of the grit scales among various undergraduate cohorts (see Table 1 for a chronological record of the reliability coefficients derived from previous research in the higher education sector).
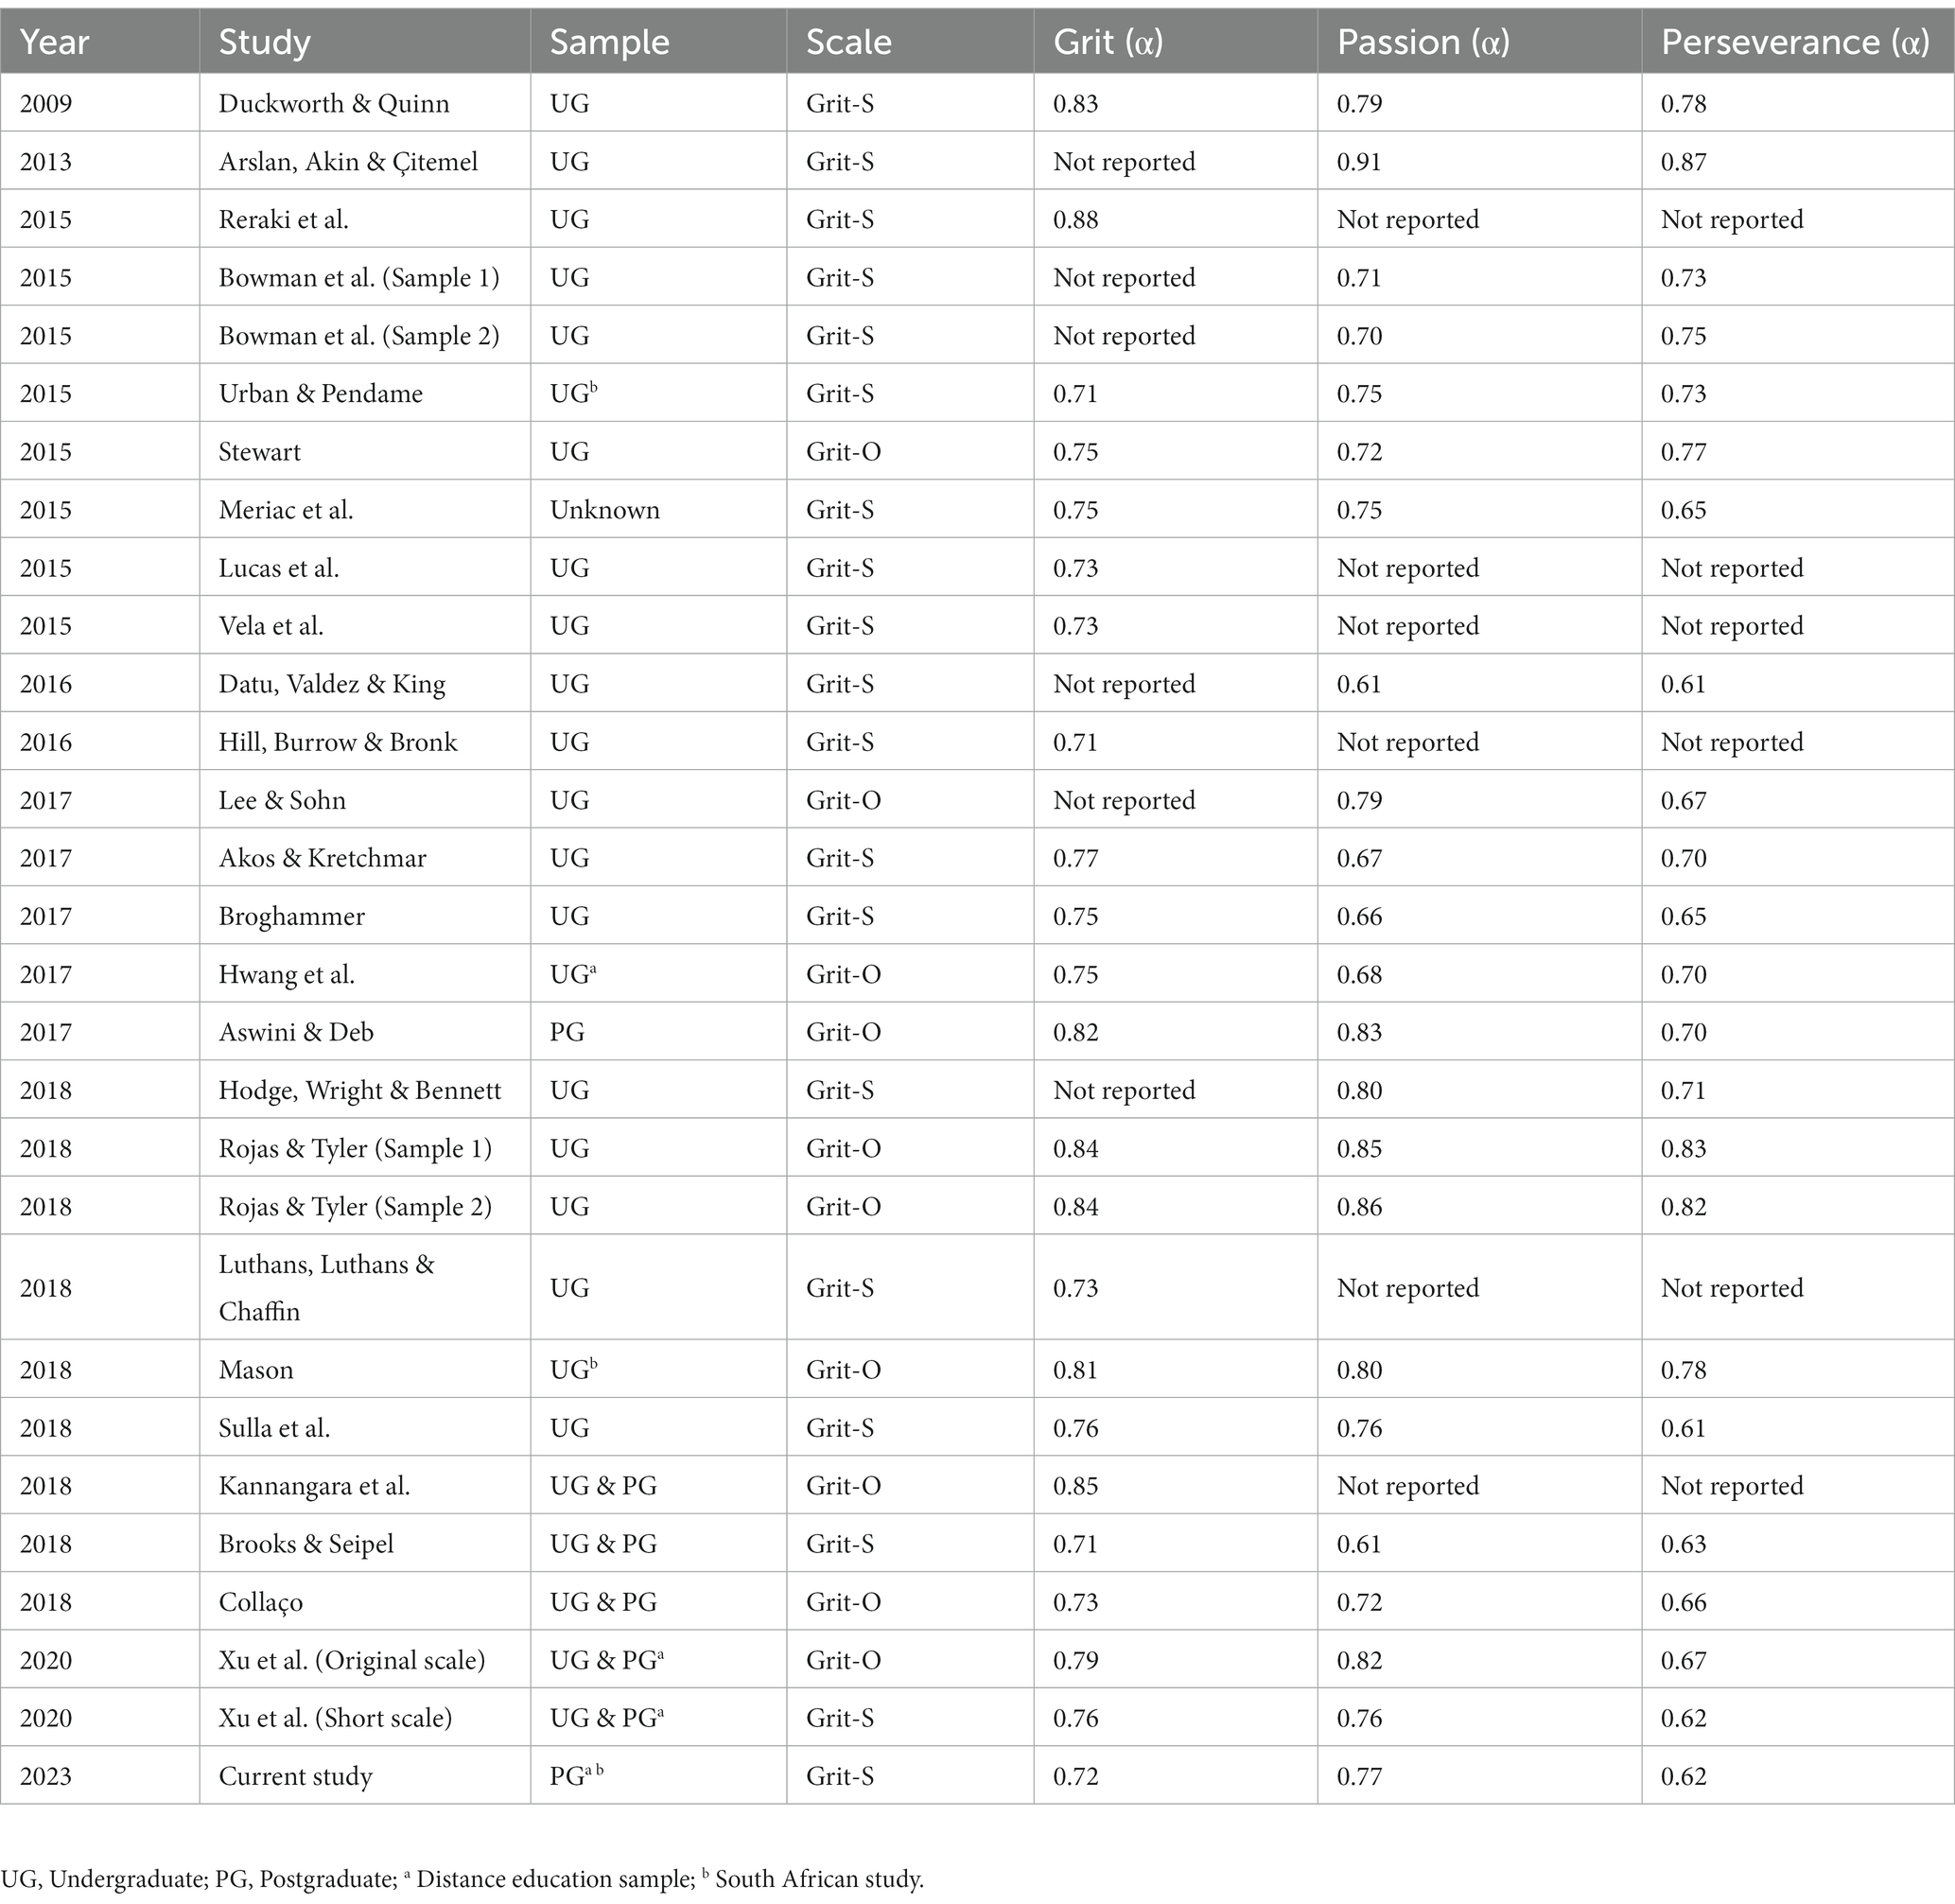
Table 1. Reliability coefficients derived from a decade of research in higher education (2009–2022; Young, 2020).
4.1. A notable (reliability) gap
Lamentably though, there is a paucity of research on the topic among postgraduate students. Only a handful of studies have examined the reliability of the grit scales among postgraduates, and these remain confined to contact-based settings. For instance, Aswini and Deb (2017) found that the Grit-O scale (and each of its dimensions) produced reliable results among 101 master’s and doctoral students in India, with Cronbach’s alpha coefficients ranging from 0.70 to 0.83. Most recently, Kannangara et al. (2018) revealed that the same scale exhibited high levels of reliability among 39 postgraduate students in the United Kingdom, with an overall coefficient of 0.85.
To date, the absence of psychometric analyses to directly compare findings is apparent. Although South African studies have explored certain psychometric properties of the grit scales (Urban and Pendame, 2015; Mason, 2018), the research findings are limited to contact-based undergraduate samples. And while assessed among distance learning students (Hwang et al., 2017; Xu et al., 2020), the findings relate specifically to Korean and Dutch versions of the scale, respectively. Against this deficit, the current paper aims to contribute by reporting on the psychometric properties of the English version of the Grit-S scale among a South African sample of DE students. This aim, along with the research questions, is outlined below.
5. Aims and research questions
Given the paucity highlighted above, the need to investigate the psychometric rigour among distance learning students is evident. The current paper aims to psychometrically evaluate the Grit-S scale among a sample of postgraduate distance learning students in South Africa by examining the inherent factor structure and the derived reliability coefficients. The following question prompted the current analysis;
1. To what extent is the Grit-S scale valid and reliable among postgraduate students in a DE institution?
2. To what extent is the two-factor solution proposed by Duckworth et al. (2007) an acceptable fit to the data?
6. Materials and methods
An English survey consisting of two sections (i.e. the Grit-S scale and a demographic section) was administered online during the 2017 academic year. Of the 8,689 potential participants in the target population (i.e. postgraduate students who enrolled for their qualification for the first time in 2017), 837 students submitted complete responses. A final response rate of 9.63% was calculated.
The majority of the research participants were female (n = 587; 70.1%) and between the ages of 25–29 years (n = 203; 24.3%). This was followed by 18.6% of the sample who indicated that they were between the ages of 30–34 years (n = 156). Regarding the ethnicities of the research sample, over half was African (n = 495; 59.1%), while over a quarter was white (n = 228; 27.2%). A fair majority of the research participants were first-language English-speakers (n = 237; 28.3%).3 Afrikaans and isiZulu were also prominent among the sample, comprising 14.9% (n = 125) and 14.5% (n = 121), respectively. These were followed by Setswana- (n = 62) and Northern Sotho-speaking participants (n = 59). A detailed description of the sample can be found in Young (2020).
Subsequent to analysing the demographic attributes, the Grit-S scale’s factorability was assessed (using the KMO statistic and Bartlett’s test of sphericity) followed by an exploration of the underlying dimensions in the scale (using exploratory factor analysis; EFA). This underlying structure was then supplemented using a partial confirmatory factor analysis (PCFA; Gignac, 2009) and the factors tested for internal consistency using Cronbach’s alpha coefficients. All analyses were performed in SPSS (version 28) and are presented below.
7. Analysis and results
7.1. Pre-validity testing
As mentioned, prior to performing any factor analyses, the scale’s factorability was assessed. The analysis yielded a KMO value of 0.78, attesting to the appropriateness of a factor analysis. In addition to the sampling adequacy, the chi-square derived from Bartlett’s sphericity test indicated that there was a significantly strong enough relationship among the items to conduct a factor analysis, χ2(28) = 1758.98, p < 0.001. Based on these indices, factor analysis was deemed suitable and likely to produce satisfactory results.
7.2. Validity testing
7.2.1. Exploratory factor analysis (EFA)
After conducting factorability tests and obtaining satisfactory results, an EFA with an oblique rotation (i.e. oblimin) was performed and eigenvalues obtained. According to Kaiser’s rule, which suggests retaining components with eigenvalues greater than one (Kaiser, 1960), two factors were retained. In addition to Kaiser’s criterion, a parallel analysis was conducted (Patil et al., 2017) which verified the retention of two factors.4 These two factors accounted for a total of 57.22% of the variance in the data, as shown in Table 2.
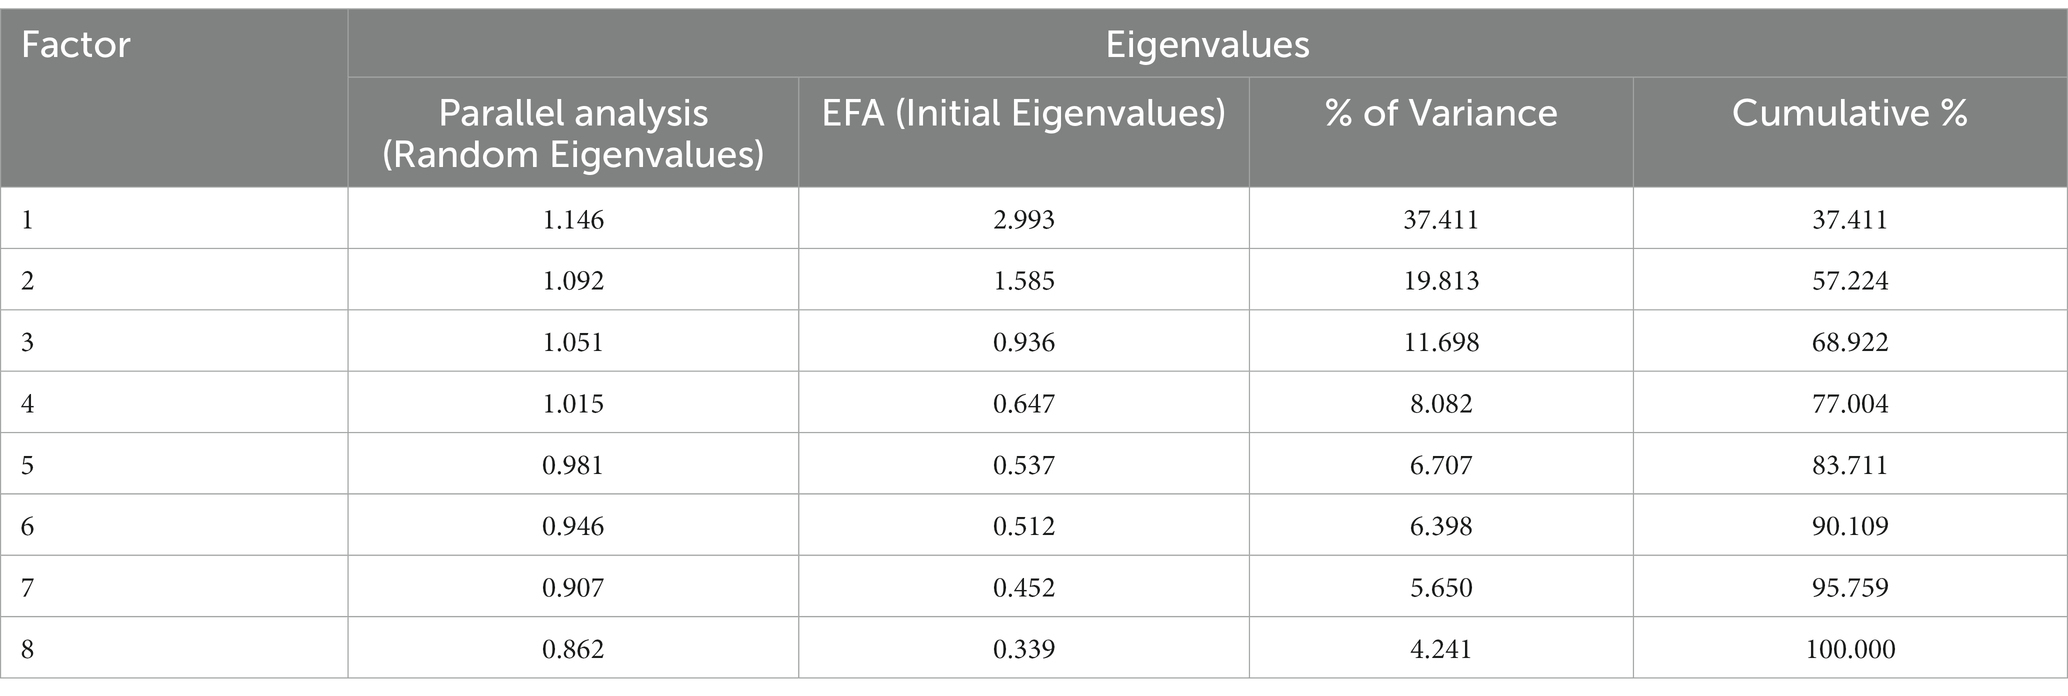
Table 2. Total variance explained by the components.
Upon reviewing the eigenvalues and variance explained by the two factors, the factor loadings were analysed in the pattern matrix. The analysis showed that questions 1, 3, 5, and 6 were associated with component 1 and produced factor loadings that ranged from 0.73 to 0.78 and, while questions 2, 4, 7, and 8 were linked with component 2 and exhibited factor loadings that ranged from 0.41 to 0.83. Further scrutiny of these loadings indicated that factor 1 represented the passion subscale, while factor 2 reflected the perseverance subscale. This is shown in Table 3.
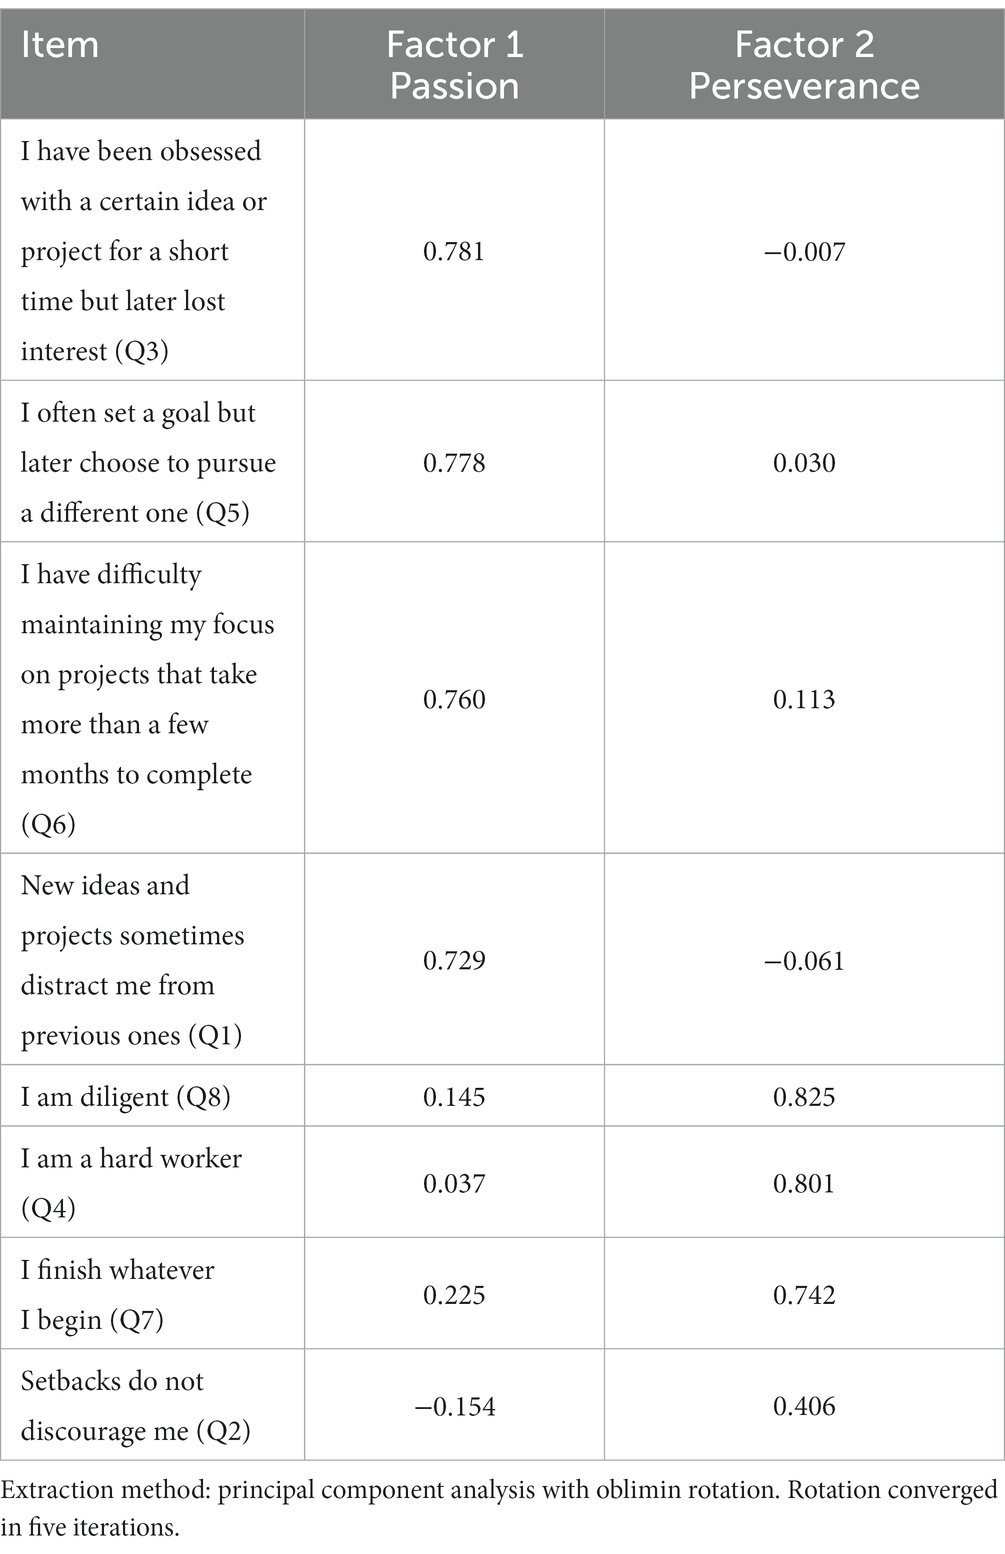
Table 3. Pattern matrix from EFA.
7.2.2. Partial confirmatory factor analysis (PCFA)
In order to verify the two-factor structure of the Grit-S scale as proposed by Duckworth et al. (2007) and supplement the findings from the EFA, a PCFA was conducted using the approach described by Gignac (2009). It must be noted that, although a CFA appears most conventional at this stage, Gignac (2009, p. 40) argues that ‘the recommendation of CFA would be more justifiable if the EFA were (first) supplemented with more relevant information as to whether the exploratively-derived factor solution is associated with a reasonable chance of being confirmed via CFA’. As such, Gignac (2009) suggests first conducting a PCFA.
Since the factorability of the Grit-S scale had already been established, a maximum likelihood estimation (MLE) with an oblimin rotation was utilised in the PCFA. The initial outcomes from the pattern matrix indicated that the results were consistent with those reported from the EFA above. See Table 4.
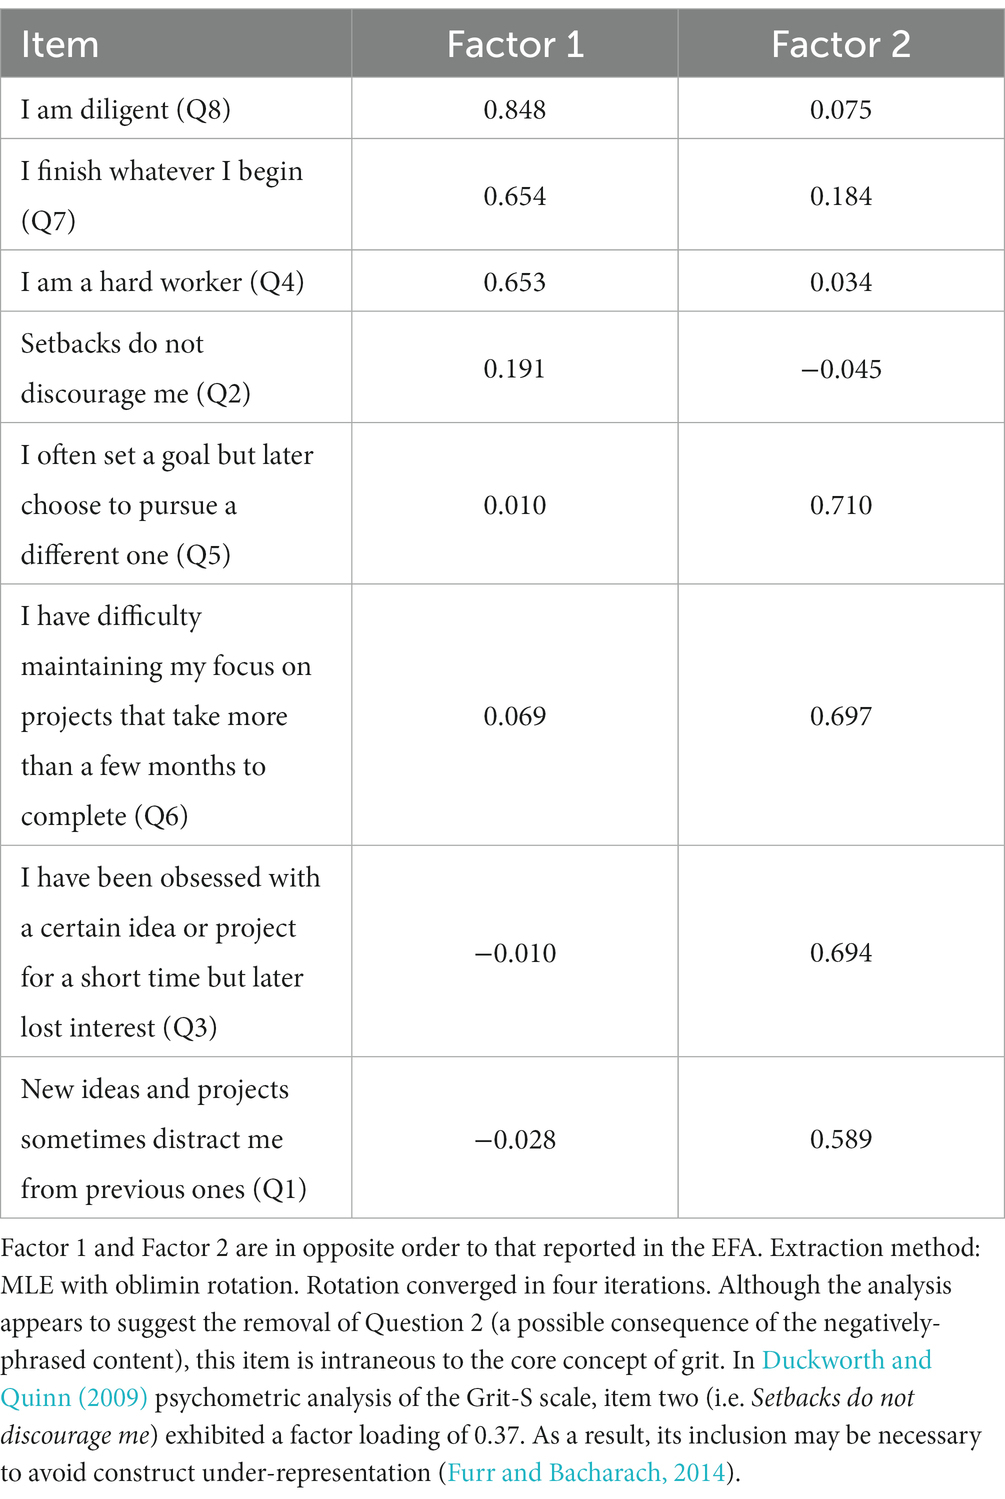
Table 4. Pattern matrix from PCFA.
Next, the null model chi-square and the implied model chi-square were calculated using Bartlett’s test of sphericity and the goodness-of-fit test, respectively (Gignac, 2009). Results from the current analysis revealed a null model chi-square of χ2(28) = 1758.98, p < 0.001; and an implied model chi-square of χ2(13) = 28.42, p < 0.01. Although the goodness-of-fit test (i.e. the implied model chi-square) is the most commonly used test to determine model accuracy, this test is highly sensitive to the sample size, with large samples generally giving rise to results that lead to the rejection of the null hypothesis, when in fact, the factor solution is appropriate (DeCoster, 1998; Gignac, 2009). As a result of the large sample size, this statistic has been abandoned in PCFA in favour of examining multiple fit indices together with the pattern matrix. As a result, in addition to assessing the pattern matrix, five close-fit indices were calculated using the null model chi-square, the implied model chi-square, and in some instances, the sample size (Gignac, 2009). These indices included the RMSEA; standardised root mean residual (SRMR); normed fit index (NFI); Tucker–Lewis Index (TLI); and the CFI.
Based on the preceding two chi-square values, the close-fit indices were calculated. These calculations revealed an NFI of 0.984, a TLI of 0.981, a CFI of 0.991, and an RMSEA of 0.038. Based on the corresponding residual correlation matrix, SRMR was calculated at 0.020. As reported by Hooper et al. (2008) and Kline (2016), the NFI and TLI should exhibit an index value ≥0.950 (for good fit), while the cut-off for the CFI is slightly lower, suggested at 0.900. As for the other two close-fit indices, the index value for both RMSEA and SRMR should be smaller than 0.08, with values closer to 0 indicative of a progressively better-fitting model (Hu and Bentler, 1999; Hooper et al., 2008; Kline, 2016). Thus, if one were to consider the close-fit indexes collectively, as commonly recommended by Hu and Bentler (1999), and the other outputs from the PCFA and the former EFA, the two-factor solution would be considered an acceptable fit to the data in the current paper.
7.3. Reliability testing
To evaluate the reliability of the two dimensions in the Grit-S scale, an item analysis was conducted, and Cronbach’s alpha coefficients were calculated. As a general rule of thumb, a Cronbach’s alpha value above 0.80 is considered good; a value between 0.60 and 0.80 is acceptable; and a value below 0.60 is considered unacceptable (Field, 2009). The item analyses yielded acceptable Cronbach alpha values: 0.77 for consistency of interest (four items), 0.62 for perseverance of effort (four items), and 0.72 for the Grit-S scale.
8. Discussion
The findings of the EFA showed that the same two factors (i.e. passion and perseverance), previously identified by Duckworth and colleagues (Duckworth et al., 2007; Duckworth and Quinn 2009), were evident in the Grit-S scale when applied to a sample of postgraduate, DE students in South Africa. These two factors, consistency of interest and perseverance of effort, collectively explained 57.2% of the variance. Although typical of social science research where extracted factors usually explain between 50 and 60% (Peterson, 2000), these results are slightly higher than those reported in the current discourse. Alhadabi et al. (2019) indicated that 47.7 and 51.0% of the total variance in the data could be explained by the same two-factor structure among Omani and American students, respectively. Collaço (2018) results, on the other hand, indicated that the two-factor solution explained only 42.84% of the total variance among a sample of college students, almost 15% less than that reported in the current paper. Overall, the higher percentage of total variance explained in the current paper may suggest that the two factors are more meaningful and useful in explaining the relationships among the variables among a sample of postgraduate, DE students in South Africa.
Results further revealed that the two-factor solution proposed by Duckworth et al. (2007) and Duckworth and Quinn (2009) demonstrated good levels of fit among the postgraduate DE sample. Index calculations revealed an NFI of 0.98, a TLI of 0.98, a CFI of 0.99, and an RMSEA of 0.04. Based on the corresponding residual correlation matrix, SRMR was calculated at 0.02. Support for this two-factor solution among tertiary students is not novel, with concurrent results emanating from around the globe. Most recently, Schmidt et al. (2021) reported adequate fit of the two-factor solution5 among university students in the Czech Republic; CFI = 0.94, TLI = 0.91, RMSEA = 0.08, SRMR = 0.05. Broghammer (2017); Karaman et al. (2019); and Meriac et al. (2015) also reported satisfactory indices for the two-factor solution among undergraduate students in the United States: GFI ≥ 0.96; CFI ≥ 0.96; TLI ≥ 0.94; RMSEA = 0.06; SRMR = 0.04. Interestingly, Fosnacht et al. (2018) only achieved adequate fit for the two-factor model when Item 2 (Setbacks do not discourage me; CFI = 0.97, TLI = 0.95, RMSEA = 0.06) was removed, somewhat consonant with that discussed next.
The reliability analysis indicated that the two dimensions as well as the Grit-S scale in its entirety demonstrated acceptable levels of reliability among the sample (α > 0.62). However, as seen in Table 5 above, the analysis suggested the removal of Question 2 (Setbacks do not discourage me), resulting in a Cronbach’s Alpha coefficient of 0.79 for the perseverance domain and an overall Cronbach’s Alpha of 0.77. Interestingly, this finding is not isolated; a number of studies have noted concerns with this item among different student populations (Tyumeneva et al., 2014; Bowman et al., 2015; Li, 2015; Broghammer, 2017; Wyszyńska et al., 2017; Arco-tirado et al., 2018; Fosnacht et al., 2018). In the earliest of these studies, Bowman et al. (2015) revealed that ‘Setbacks do not discourage me’ reduces the internal consistency of the perseverance domain among a population of undergraduates in the United States (n = 417). According to these authors (preliminary) analyses showed that the removal of this item does not affect subsequent results. Broghammer (2017) also reported a reduction in reliability with the inclusion of this item among first-time entering students in the United States (n = 544).
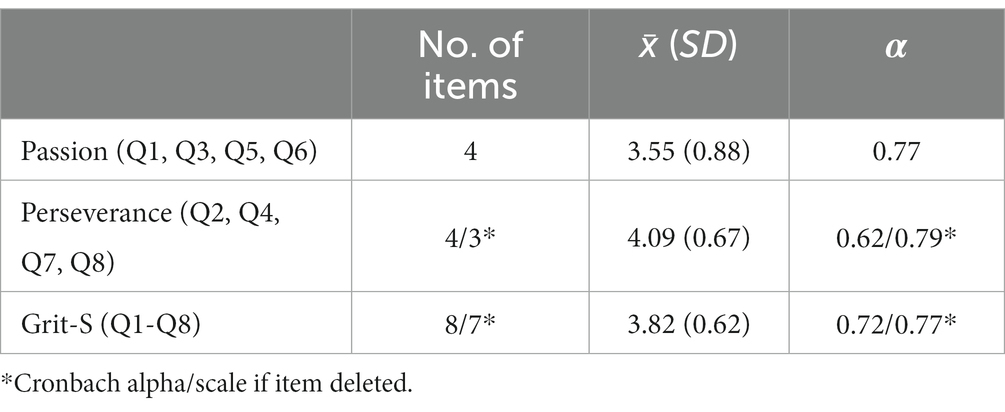
Table 5. Reliability of the Grit-S scale.
Although it is unclear whether the lower reliability coefficient is an artefact of the negatively-phrased item, the substantial gain in reliability cannot be ignored. This may be due, in part, to the cognitively laborious nature of these types of items which require additional mental resources to process, often cause confusion, and do not perform as intended (Chyung et al., 2018). There also remains the possibility that this item is irrelevant to the construct being measured (i.e. perseverance of effort) among the South African sample of postgraduate DE students, despite its face validity. Resultantly, regardless of the suggestions by Furr and Bacharach (2014) to retain items that are intraneous to the core construct (so as to avoid construct under-representation), its exclusion could be warranted in this setting and others which explore grit among postgraduate students studying at a distance in South Africa. However, this is stated tentatively and requires further exploration.
9. Implications, limitations and future directions
A number of implications, limitations and future directions are inherent in the findings above. Firstly, the results imply that grit (and its two inherent dimensions) can be measured accurately within DE settings, across a diverse population of postgraduate students in South Africa (i.e. in terms of ethnicities, home languages and cultures). However, the measure has yet to be validated among an undergraduate DE population in South Africa. Considering the sheer size of the undergraduate population at UNISA which accounts for approximately 30% of the entire student body in the public HE system (i.e. 316,000 students; Department of Higher Education and Training, 2023), results from such a study may yield fruitful insights into the scale (and the construct) from a national perspective. Secondly, the survey was administered and validated in English, undoubtedly adding to the plethora of psychometric evidence on the English Grit-S scale. However, considering that English is only the sixth most common home language spoken inside South African households, future studies should explore the psychometric rigour of translated versions of the Grit-S scale - paying particular attention to the official languages of the country. Moreover, the measurement invariance across these languages should be explored. With so few studies reporting the measurement invariance of grit across different language and cultural groups (Li et al., 2023), future endeavours in this regard may suggest (or refute the idea) that the theoretical understanding of grit is limited to a single culture. Thirdly, having partially established the construct validity of the scale among postgraduate DE students in the country, future research endeavours should seek to confirm this two-factor solution using a confirmatory approach (i.e. using CFA), as suggested by Gignac (2009). And lastly, educational practitioners should explore grit’s predictive validity in the same domain. Initiatives in this area may yield interesting findings into grit’s role in determining retention and success among DE students in the country.
10. Conclusion
Although there is much debate regarding the factor structure of grit – a critique recognised by the developers themselves (Duckworth et al., 2021) – the current paper provided novel insight into how the Grit-S scale and its intraneous dimensions perform among a sample of postgraduate distance education students in South Africa. Following the suggested criteria (Hu and Bentler, 1999) and acceptable thresholds (Field, 2009), it seems reasonable to conclude that the Grit-S scale is a valid tool and can reliably measure passion and perseverance among postgraduate students at a South African DE institution.
Data availability statement
The raw data supporting the conclusions of this article will be made available by the authors, without undue reservation.
Ethics statement
This study, involving humans, was approved by the University of South Africa’s (UNISA) Research Permission Sub-committee (RPSC) and the Department of Psychology’s Ethics Review Committee. The study was conducted in accordance with the local legislation and institutional requirements. The participants provided their informed consent to participate in this study.
Author contributions
All authors listed have made a substantial, direct, and intellectual contribution to the work and approved it for publication.
Funding
This work was supported by the University of South Africa’s (UNISA) Masters and Doctoral Support Programme (MDSP).
Conflict of interest
The authors declare that the research was conducted in the absence of any commercial or financial relationships that could be construed as a potential conflict of interest.
Publisher’s note
All claims expressed in this article are solely those of the authors and do not necessarily represent those of their affiliated organizations, or those of the publisher, the editors and the reviewers. Any product that may be evaluated in this article, or claim that may be made by its manufacturer, is not guaranteed or endorsed by the publisher.
Footnotes
1. ^Although the responses to the eight items are Likert-scale in nature and thus categorical (ranging from Very much like me to Not like me at all), Duckworth and Quinn (2009) recommend calculating an average of these items to ascertain an individual’s level of grit. To do so, the categorical responses of each item are assigned a corresponding value (from 1 to 5). These scores are then used to calculate an average grit score ranging from 1.00 (not at all gritty) to 5.00 (extremely gritty).
2. ^The United States Military Academy (USMA), commonly known as West Point, is a renowned institution for educating and training future military officers of the United States Army.
3. ^The most commonly-spoken language in South Africa is isiZulu (25%). English is the sixth most common language spoken inside of South African households (8.1%) and the second-most prevalent language spoken outside of the household (16.6%; Statistics South Africa, 2020).
4. ^1,000 random correlation matrices generated; 95th percentile of eigenvalues.
5. ^However, to achieve adequate fit, the authors had to make provision for a correlation between item residuals of two items. Without such, the two-factor model did not exhibit acceptable fit; CFI = 0.89, TLI = 0.84, RMSEA = 0.10, SRMR = 0.06.
References
Akos, P., and Kretchmar, J. (2017). Investigating grit at a non-cognitive predictor of college success. Rev Higher Educ 40, 163–186. doi: 10.1353/rhe.2017.0000
Alhadabi, A., Aldhafri, S., Alkharusi, H., Al-Harthy, I., AlBarashdi, H., and Alrajhi, M. (2019). Psychometric assessment and Cross-cultural adaptation of the grit-S scale among Omani and American universities’ students. Eurasian J. Educ. Res. 8, 1175–1191. doi: 10.12973/eu-jer.8.4.1175
Arco-tirado, J. L., Fernández-martín, F. D., and Hoyle, R. H. (2018). Development and validation of a Spanish version of the grit-S scale. Front. Psychol. 9, 1–7. doi: 10.3389/fpsyg.2018.00096
Arslan, S., Akin, A., and Çitemel, N. (2013). The predictive role of grit on metacognition in Turkish university students. Stud. Psychol. 55, 311–320. doi: 10.21909/sp.2013.04.645
Aswini, S., and Deb, A. (2017). Flourishing among postgraduate students: the role of resilience, meaningfulness and grit. Indian J Community Psychol 13, 24–37.
Beyhan, Ö. (2016). University students grit level and grit achievement relation. Social Sci Educ Res Rev 2, 13–23.
Bowman, N. A., Hill, P. L., Denson, N., and Bronkema, R. (2015). Keep on Truckin’ or stay the course? Exploring grit dimensions as differential predictors of educational achievement, satisfaction, and intentions. Soc. Psychol. Personal. Sci. 6, 639–645. doi: 10.1177/1948550615574300
Broghammer, Sean M. (2017). “Grit as a predictor of academic success for first-time undergraduate students.” University of Northern Colorado: United States.
Brooks, N. G., and Seipel, S. J. (2018). Grit and the information systems student: A discipline-specific examination of perseverance and passion for long term goals. Information Systems Educ J 16, 21–32.
Burkhart, R. A., Tholey, R. M., Guinto, D., Yeo, C. J., and Chojnacki, K. A. (2014). Grit: A marker of residents at risk for attrition? Surgery 155, 1014–1022. doi: 10.1016/j.surg.2014.01.015
Christensen, R., and Knezek, G. (2014). Comparative measures of grit, tenacity and perseverance. Int J Learning, Teach Educ Res 8, 16–30.
Chyung, S. Y., Yonnie, J. R., Barkin, J. R., and Shamsy, J. A. (2018). Evidence-based survey design: the use of negatively worded items in surveys. Perform. Improv. 57, 16–25. doi: 10.1002/pfi.21749
Collaço, C. M. (2018). “What do we really know about grit? A multivariate statistical analysis investigation on the construct validity of grit.” University of San Francisco: United States.
Cross, T. M. (2014). The gritty: grit and non-traditional doctoral student success. J Educ Online 11, 1–31. doi: 10.9743/JEO.2014.3.4
Datu, J. A., Valdez, J. P. M., and King, R. B. (2016). Perseverance counts but consistency does not! Validating the short grit scale in a collectivist setting. Curr. Psychol. 35, 121–130. doi: 10.1007/s12144-015-9374-2
DeCoster, Jamie. (1998). “Overview of Factor Analysis.” Available at: http://www.stat-help.com/notes.html.
Department of Higher Education and Training (2023). Statistics on post-school education and training in South Africa: 2021. Pretoria: Department of Higher Education and Training (DHET).
Duckworth, A., Peterson, C., Matthews, M. D., and Kelly, D. R. (2007). Grit: perseverance and passion for long-term goals. J. Pers. Soc. Psychol. 92, 1087–1101. doi: 10.1037/0022-3514.92.6.1087
Duckworth, A., and Quinn, P. D. (2009). Development and validation of the short grit scale (grit-S). J. Pers. Assess. 91, 166–174. doi: 10.1080/00223890802634290
Duckworth, A., Quinn, P. D., and Tsukayama, E. (2021). Revisiting the factor structure of grit: A commentary on Duckworth and Quinn (2009). J. Pers. Assess. 103, 573–575. doi: 10.1080/00223891.2021.1942022
Fosnacht, K., Copridge, K., and Sarraf, S. A. (2018). How valid is grit in the postsecondary context? A construct and concurrent validity analysis. Res Higher Educ 60, 803–822. doi: 10.1007/s11162-018-9524-0
Furr, R. M., and Bacharach, V. R. (2014). Psychometrics: An introduction. 2nd ed. Thousand Oaks, CA: SAGE.
Gignac, G. E. (2009). Partial confirmatory factor analysis: described and illustrated on the NEO-PI-R. J. Pers. Assess. 91, 40–47. doi: 10.1080/00223890802484126
Gonzalez, O., Canning, J. R., Smyth, H., and MacKinnon, D. P. (2020). A psychometric evaluation of the short grit scale: A closer look at its factor structure and scale functioning. European J Psychol Assess 36, 646–657. doi: 10.1027/1015-5759/a000535
Hill, P. L., Burrow, A. L., and Bronk, K. C. (2016). Persevering with positivity and purpose: an examination of purpose commitment and positive affect as predictors of grit. J. Happiness Stud. 17, 257–269. doi: 10.1007/s10902-014-9593-5
Hodge, B., Wright, B., and Bennett, P. (2018). The role of grit in determining engagement and academic outcomes for university students. Res Higher Educ 59, 448–460. doi: 10.1007/s11162-017-9474-y
Hooper, D., Coughlan, J., and Mullen, M. R. (2008). Structural equation modelling: guidelines for determining model fit. Electron. J. Bus. Res. Methods 6, 53–60. doi: 10.1037/1082-989X.12.1.58
Hu, L., and Bentler, P. M. (1999). Cutoff criteria for fit indexes in covariance structure analysis: conventional criteria versus new alternatives. Struct. Equ. Model. Multidiscip. J. 6, 1–55. doi: 10.1080/10705519909540118
Hwang, M. H., Lim, H. J., and Ha, H. S. (2017). Effects of grit on the academic success of adult female students at Korean Open University. Psychol. Rep. 121, 705–725. doi: 10.1177/0033294117734834
Kaiser, H. F. (1960). The application of electronic computers to factor analysis. Educ. Psychol. Meas. 20, 141–151. doi: 10.1177/001316446002000116
Kannangara, C. S., Allen, R. E., Waugh, G., Nahar, N., Khan, S. Z. N., Rogerson, S., et al. (2018). All that glitters is not grit: three studies of grit in university students. Front. Psychol. 9, 1–15. doi: 10.3389/fpsyg.2018.01539
Karaman, M. A., Vela, J. C., Aguilar, A. A., Saldana, K., and Montenegro, M. C. (2019). Psychometric properties of U.S.-Spanish versions of the grit and resilience scales with a Latinx population. Int J Advanc Counsel 41, 125–136. doi: 10.1007/s10447-018-9350-2
Kline, R. B. (2016). Principles and practice of structural equation. Fourth, New York, NY: The Guilford Press.
Lee, S., and Sohn, Y. W. (2017). Effects of grit on academic achievement and career-related attitudes of college students in Korea. Social Behav Personality: Int J 45, 1629–1642. doi: 10.2224/sbp.6400
Li, Caihong. (2015). “The short grit scale: A dimensionality analysis.” United States: University of Kentucky.
Li, M., Fan, W., and Leong, F. T. L. (2023). Psychometric assessment of the grit scale: Evidence from US and Chinese samples. J. Pac. Rim Psychol. 17, 1–18. doi: 10.1177/18344909221147108
Lucas, G. M., Gratch, J., Cheng, L., and Marsella, S. (2015). When the going gets tough: grit predicts costly perseverance. J. Res. Pers. 59, 15–22. doi: 10.1016/j.jrp.2015.08.004
Luthans, K. W., Luthans, B. C., and Daniel Chaffin, T. (2019). Refining grit in academic performance: the mediational role of psychological capital. J. Manag. Educ. 43, 35–61. doi: 10.1177/1052562918804282
Mason, H. D. (2018). Grit and academic performance among first-year university students: A brief report. J Psychol Africa 28, 66–68. doi: 10.1080/14330237.2017.1409478
Meriac, J. P., Slifka, J. S., and LaBat, L. R. (2015). Work ethic and grit: an examination of empirical redundancy. Personal. Individ. Differ. 86, 401–405. doi: 10.1016/j.paid.2015.07.009
Muenks, K., Wigfield, A., Yang, J. S., and O’Neal, C. R. (2017). How true is grit? Assessing its relations to high school and college students’ personality characteristics, self-regulation, engagement, and achievement. J. Educ. Psychol. 109, 599–620. doi: 10.1037/edu0000153
Mullen, P. R., and Crowe, A. (2018). A psychometric investigation of the short grit scale with a sample of school Counselors. Measurement Evaluation Counsel Develop 51, 151–162. doi: 10.1080/07481756.2018.1435194
Palisoc, A. J., Matsumoto, R. R., Ho, J., Perry, P. J., Tang, T. T., and Ip, E. J. (2017). Relationship between grit with academic performance and attainment of postgraduate training in pharmacy students. Am. J. Pharm. Educ. 81, 67–10. doi: 10.5688/ajpe81467
Pate, A. N., Payakachat, N., and Harrell, T. K. (2017). Measurement of grit and correlation to student pharmacist academic performance. Am. J. Pharm. Educ. 81:6105. doi: 10.5688/ajpe816105
Patil, V. H., Surendra, N. S., Sanjay, M., and Todd, D. (2017). “Parallel Analysis Engine to Aid in Determining Number of Factors to Retain Using R.” 2017. Available at: https://analytics.gonzaga.edu/parallelengine/.
Peterson, R. A. (2000). A Meta-analysis of variance accounted for and factor loadings in exploratory factor analysis. Mark. Lett. 11, 261–275. doi: 10.1023/A:1008191211004
Postigo, Á., Cuesta, M., García-Cueto, E., Menéndez-Aller, Á., González-Nuevo, C., and Muñiz, J. (2021). Grit assessment: is one dimension enough? J. Pers. Assess. 103, 786–796. doi: 10.1080/00223891.2020.1848853
Reraki, M., Celik, I., and Saricam, H. (2015). Grit as a mediator of the relationship between motivation and academic achievement. Ozean J Social Sci 8, 19–32.
Rogalski, K. (2018). “Grit as a predictor of success and persistence for community college students.” Northern Illinois University, Illinois.
Rojas, JP. (2015). “The relationships among creativity, grit, academic motivation and academic success in college students.” United States: University of Kentucky.
Rojas, J. P., and Tyler, K. M. (2018). Measuring the creative process: A psychometric examination of creative ideation and grit. Creat. Res. J. 30, 29–40. doi: 10.1080/10400419.2018.1411546
Salles, A., Cohen, G. L., and Mueller, C. M. (2014). The relationship between grit and resident well-being. Am. J. Surg. 207, 251–254. doi: 10.1016/j.amjsurg.2013.09.006
Salles, A., Lin, D., Liebert, C., Esquivel, M., Lau, J. N., Greco, R. S., et al. (2017). Grit as a predictor of risk of attrition in surgical residency. American J Surgery 213, 288–291. doi: 10.1016/j.amjsurg.2016.10.012
Saricam, Hakan, Celik, I., and Oguz, A. (2016). “Turkish Adaptation of the Short Grit Scale (Grit-S): Validity and Reliability Study.” In The 3rd International Congress on Curriculum and Instruction. Adana, Turkey.
Schmidt, F. T. C., Sudzina, F., and Botek, M. (2021). Psychometric assessment of the short grit scale among Czech young adults. J. Psychoeduc. Assess. 39, 508–513. doi: 10.1177/0734282920974817
Statistics South Africa. (2020). “General household survey 2018.” Pretoria: Statistics South Africa (StatsSA).
Stewart, Stacyann B. (2015). “Grit and self-control as predictors of first-year student success.” United States: University of Southern Maine.
Sulla, F., Aquino, A., and Rollo, D. (2022). University students’ online learning during COVID-19: the role of grit in academic performance. Front. Psychol. 13, 1–6. doi: 10.3389/fpsyg.2022.825047
Sulla, Francesco, Renati, Roberta, Bonfiglio, Salvo, and Rollo, Dolores. (2018). “Italian Students and the Grit-S: A Self-Report Questionnaire for Measuring Perseverance and Passion for Long-Term Goals.” In 2018 IEEE International Symposium on Medical Measurements and Applications.
Terry, D., and Peck, B. (2020). Academic and clinical performance among nursing students: What’s grit go to do with it? Nurse Educ. Today 88, 1–6. doi: 10.1016/j.nedt.2020.104371
Tyumeneva, Y., Kuzmina, J., and Kardanova, E. (2014). “IRT analysis and validation of the grit scale: A Russian investigation.” Moscow: National Research University Higher School of Economics.
Urban, B., and Pendame, R. (2015). Perseverance among university students as an Indicator of entrepreneurial intent. South African J Higher Educ 29, 263–278. doi: 10.20853/29-5-528
Vela, J. C., Lu, M. P., Lenz, A. S., and Hinojosa, K. (2015). Positive psychology and familial factors as predictors of Latina/o students’ psychological grit. Hispanic J Behav Sci 37, 287–303. doi: 10.1177/0739986315588917
Wu, P. H., Hwang, G. J., Liang Hao, S., and Huang, Y. M. (2012). A context-aware Mobile learning system for supporting cognitive apprenticeships in nursing skills training. Educ. Technol. Soc. 15, 223–236.
Wyszyńska, P., Ponikiewska, K., Karaś, D., Najderska, M., and Rogoza, R. (2017). Psychometric properties of the polish version of the short grit scale. Polish Psychol Bulletin 48, 229–236. doi: 10.1515/ppb-2017-0026
Xu, K. M., Meijs, C., Gijselaers, H. J. M., Neroni, J., and de Groot, R. H. M. (2020). Measuring perseverance and passion in distance education students: psychometric properties of the grit questionnaire and associations with academic performance. Front. Psychol. 11, 1–12. doi: 10.3389/fpsyg.2020.563585
Keywords: psychological grit, psychometric properties, distance learning, postgraduates, South Africa
Citation: Young KA and Archer E (2023) Validating the Grit-S scale among postgraduate students in a South African distance education institution. Front. Educ. 8:1229433. doi: 10.3389/feduc.2023.1229433
Edited by:
Robbert Smit, St. Gallen University of Teacher Education, SwitzerlandReviewed by:
Francesco Sulla, University of Foggia, ItalyPatrick Charles Kyllonen, Educational Testing Service, United States
Copyright © 2023 Young and Archer. This is an open-access article distributed under the terms of the Creative Commons Attribution License (CC BY). The use, distribution or reproduction in other forums is permitted, provided the original author(s) and the copyright owner(s) are credited and that the original publication in this journal is cited, in accordance with accepted academic practice. No use, distribution or reproduction is permitted which does not comply with these terms.
*Correspondence: Kelly Anne Young, eW91bmdrYUB1bmlzYS5hYy56YQ==