 Margot Chauliac
 Jonas Willems
 David Gijbels
 Vincent Donche
95% of researchers rate our articles as excellent or good
Learn more about the work of our research integrity team to safeguard the quality of each article we publish.
Find out more
ORIGINAL RESEARCH article
Front. Educ. , 14 September 2023
Sec. Assessment, Testing and Applied Measurement
Volume 8 - 2023 | https://doi.org/10.3389/feduc.2023.1197324
This article is part of the Research Topic Insights in Assessment, Testing, and Applied Measurement: 2022 View all 21 articles
Introduction: Self-report questionnaires are widely used in high schools and universities to gain insights into students’ learning strategies and enhance the quality of their education. However, it is important to acknowledge the possibility of respondents being inattentive when completing these questionnaires. While reliability analyses are typically performed at the group level, when providing individual feedback, it is crucial that each respondent’s results are reliable. This study aimed to evaluate the prevalence of careless response behaviour in a questionnaire concerning student learning.
Methods: Data analysis encompassed a substantial sample of 12,000+ students in their final two years of secondary education, averaging around 17 years of age. Employing five complementary detection techniques, the study identified instances of careless responding present in the questionnaire data.
Results: Our results underscore a notable prevalence of careless response behaviour among the surveyed students. Application of the five detection techniques revealed a substantial number of instances indicating inattentive responding. Furthermore, the questionnaire’s measurement scales were evaluated for reliability. The study noted the presence of carelessness but observed minimal impact on group-level results.
Discussion: The outcomes of this study hold important implications for using self-report questionnaires in education. The prevalence of careless responding emphasizes the need for scrutinizing individual responses. Despite careless responses, their influence on overall group-level data integrity seems restricted. Nonetheless, the study underscores the importance of cautiously interpreting individual-level outcomes, particularly when using these results for individual feedback.
One of the most important aims of educational research is to understand and enhance the quality of learning (Lonka et al., 2004; Kendeou and Trevors, 2012; Gijbels et al., 2014; Dinsmore, 2017). Therefore, gaining insights into how students engage in the learning process is crucial. To date, empirical research has predominantly relied on self-report questionnaires for this (Catrysse et al., 2016; Fryer and Dinsmore, 2020). These questionnaires offer a practical means to survey large groups of respondents in a short period of time and, importantly, provide unique information about many critical aspects of students’ learning processes (Fryer and Dinsmore, 2020).
Despite the advantages and widespread use of questionnaires, there have been negative critiques from scholars regarding their reliability (Veenman et al., 2006). Some criticisms highlight respondents’ hesitance to accurately report on their processing strategies (Schellings, 2011; Veenman, 2011), leading to a response behaviour that can be labelled as careless (Huang et al., 2012; Meade and Craig, 2012). Careless respondents may disregard survey instructions, misinterpret content or not take the survey seriously, resulting in inaccurate and unusable data (Marasi et al., 2019).
The presence of careless respondents can have a significant impact on data quality, increasing the likelihood of observing relationships between variables that are not actually correlated (Huang et al., 2015). Furthermore, including careless respondents in study results can create disruptions at the individual level. In educational settings such as high schools and universities, where self-report questionnaires on student learning are often used to provide students with feedback, careless respondents may receive inappropriate advice. On an individual level, respondents who are aware of their careless completion of the questionnaire may not attach significance to the feedback provided. However, carelessness can lead to other issues. The outcomes of a questionnaire are sometimes used by educators to evaluate and adjust their teaching methods. Therefore, it is crucial to be able to identify careless respondents so that practitioners are aware of which results should be handled with extra caution. In what follows, we further detail the phenomenon of careless response behaviour, its implications for data quality, and psychometric analysis techniques that can be employed to detect careless response behaviour.
The phenomenon of respondents failing to read and pay attention to the content of a survey is not a new occurrence, and it has been addressed by previous studies using various terms (Huang et al., 2012; Goldammer et al., 2020). The term random respondents has the longest history and refers to respondents whose responses demonstrate a pattern of inattention or negligence (Thompson, 1975; Johnson, 2005). However, even seemingly random respondents may exhibit a non-random pattern in their response behaviour (Neuringer, 1986; Meade and Craig, 2012). As a result, more recent literature tends to refer to these respondents as inattentive (Bowling et al., 2016; McGonagle et al., 2016) or careless (Meade and Craig, 2012). In what follows we will consistently use the latter term.
Careless responding can manifest in various ways, including socially desirable answering and acquiescence bias. Due to social desirability bias, respondents show the tendency to answer questions in such a way that their answers look favourably towards others (Krumpal, 2013). Acquiescence bias refers to a response behaviour where respondents have a tendency to select positive responses to the questions posed (Krosnick, 1999), also referred to as yeah saying (Lechner and Rammstedt, 2015). While these behaviours are often categorised as forms of careless responding, this is by definition not the case. Respondents must, after all, invest effort in processing questionnaire items to respond to them in a biased manner. There are two common types of typical careless response behaviour: straightlining and random responding (DeSimone et al., 2018). Both types involve respondents not giving sufficient attention to questions, but they have distinct characteristics. Straightlining occurs when respondents consistently provide identical or nearly identical answers to a set of questions, irrespective of the positive or negative wording of the items (Herzog and Bachman, 1981; Kim et al., 2019). It is important to note that the intensity of straightlining can vary, with some respondents consistently choosing the same response option and others alternating between similar answers (e.g., often and very often) (Dunn et al., 2018). Random responding (DeSimone et al., 2018; Arias et al., 2020) is more difficult to detect than straightlining. Random respondents choose their answers arbitrarily and intentionally use all available response categories to appear credible (DeSimone et al., 2018).
Various indicators have been developed and employed to identify careless respondents and extract their responses from datasets (Curran, 2016). These indicators can be proactive or reactive. Proactive indicators include specific items or scales that are incorporated in a questionnaire before administration. Reactive indicators refer to a wide range of post hoc statistical analyses aimed at identifying careless respondents. Providing an extensive overview of all possible detection indicators and their corresponding cut-off values is beyond the scope of this study. We refer to Curran (2016) for an extensive review of various methods that can be used to identify careless respondents. However, we will highlight five indicators that are often employed in other fields to detect carelessness in self-report questionnaires (Huang et al., 2012; Meade and Craig, 2012).
Control items, also known as directed response or instructed response items, serve as proactive indicators for detecting careless response behaviour. These items instruct respondents to provide a specific response, such as ‘mark Strongly disagree to this item’ (Lavrakas, 2008; Dunn et al., 2018). As these questions have only one correct answer, it becomes possible to identify careless response behaviour (Huang et al., 2012; Meade and Craig, 2012; Huang et al., 2015). To mask their presence, control items are often scattered throughout a survey (Marasi et al., 2019). These items are considered a sensitive approach for detecting carelessness because it is unlikely that the instructed response will be given without reading the question (Niessen et al., 2016).
When using control items, researchers must establish on a criterion for identifying and eliminating respondents based on apparent careless response behaviour. One first approach is to use a cut-off score based on the number of control items that respondents answer incorrectly. Those who answer more control items incorrectly are more likely to have responded carelessly (Dunn et al., 2018). Respondents whose scores on incorrectly answering control items exceed a predetermined threshold are then classified as careless (Maniaci and Rogge, 2014; Bowling et al., 2016). This approach is lenient in detecting carelessness. Alternatively, a stricter approach is to require correct answers to all control items (Hauser and Schwarz, 2016). A single incorrect answer to a control item would result in a respondent being classified as careless.
A reactive indicator commonly used to detect carelessness is response time. The underlying assumption is that there is a minimum amount of time required to read a question and choose a response option that aligns with one’s opinions and beliefs (Huang et al., 2012). When response time falls below this minimum threshold, it is unlikely that the respondent read and answered the item seriously, compromising the reliability of the response.
However, the use of response time as an indicator of carelessness presents several methodological challenges. A review by Matjašic et al. (2018) examined 28 studies that employ response time as an indicator of carelessness and found a lack of consensus on how to measure response time. Should it be analysed on a per-item, per-page, or per-questionnaire basis? There is no agreement on what exactly constitutes answering too quickly. Multiple factors, such as perceived questionnaire difficulty, reading speed, decision-making speed, fatigue, and distraction, can introduce significant variations in response times within a sample (Dunn et al., 2018). Response times are likely to differ across different surveys, making it challenging to establish concrete guidelines for using response time as an indicator of careless response behaviour (Huang et al., 2012).
Additionally, it is important to note that response time analyses for detecting carelessness are typically carried out as one-tail analyses; flagging only respondents who answer too quickly. Huang et al. (2012) and Meade and Craig (2012) investigated short response times as a potential indicator of carelessness. In their study, Huang et al. (2012) set a cut-off score based on an educated guess, considering it highly improbable for a respondent to answer a question in less than two seconds. Meade and Craig (2012) took a different approach by examining outliers in the distribution of response times.
Long-string analysis is a reactive indicator that examines the invariability of respondents’ response patterns. It detects extreme straightlining by observing how frequently a respondent consecutively chooses the same response option (Herzog and Bachman, 1981; Niessen et al., 2016; DeSimone et al., 2018; Kim et al., 2019). The underlying rationale is that careful respondents are expected to choose different response options for different items. Thus, a response pattern that shows minimal or no variability can suggest careless responding. Long-string analysis is particularly suited for questionnaires that include different scales measuring distinct constructs, especially when they include reverse-coded items and when the items from different scales are randomly dispersed throughout the survey (Dunn et al., 2018). However, establishing a clear-cut cut-off value for long-string analysis is challenging (Johnson, 2005), because there is no specific point at which a string of identical responses can be considered excessively long.
The even-odd index involves dividing the items of a questionnaire’s scale into two subscales based on even and odd numbers. Each subscale is then scored separately, and then the correlations between the subscales are calculated to assess the respondent’s consistency (Meade and Craig, 2012). For reliable results, it is necessary to reverse possibly negatively worded items before analysis. The even-odd index requires scales with sufficient items to form the two subscales (Curran, 2016). Typically, scales with at least four items measuring the same construct are needed to calculate a correlation. This analysis assumes that responses to items within the same scale should be similar. Therefore, a high correlation suggests more careful completion of the questionnaire, while a low correlation suggests more inconsistent response behaviour. Jackson (1977) argued that even-odd index scores lower than 0.30 may indicate careless response behaviour. However, other scholars consider response behaviour to be careless if the even-odd index deviates from the mean by more than two standard deviations (Iaconelli and Wolters, 2020).
Mahalanobis distance is a multivariate outlier statistic (Mahalanobis, 1936) that measures the distance between observations and the centre of the data, accounting for the correlational structure between the items. The distance is smallest when the vector of a person’s responses is similar to the vector of the sample means. Conversely, a larger Mahalanobis distance may indicate carelessness (Ward and Meade, 2018). The underlying assumption is that response patterns deviating significantly from the sample norm could be indicative of careless response behaviour (Meade and Craig, 2012; DeSimone et al., 2015). This technique has shown some promise as an indicator of careless response behaviour (Ehlers et al., 2009; Meade and Craig, 2012; Maniaci and Rogge, 2014).
Multiple studies have highlighted the substantial impact of including careless respondents in a dataset, leading to significant alterations in variable correlations, statistical power, and effect sizes (Woods, 2006; Rammstedt et al., 2013; Wood et al., 2017; DeSimone and Harms, 2018). The prevalence of careless responding can vary widely depending on the indicators used to detect carelessness. Previous research has reported estimates ranging from as low as 1% (Gough and Bradley, 1996) to as high as 46% of respondents (Oppenheimer et al., 2009). Despite these large variations, there is some consensus among scholars that it is reasonable to expect approximately 10 to 15% of respondents to exhibit careless behaviour (Meade and Craig, 2012; Curran, 2016). Even a low percentage of careless responses can have a significant impact on data quality (Oppenheimer et al., 2009; Huang et al., 2015). However, to the best of our knowledge, there is a scarcity of studies in the field of student learning that specifically examine the relationship between carelessness and data quality (Iaconelli and Wolters, 2020).
High schools and universities commonly use online self-assessment instruments to gain insights into learners’ needs and assess the quality of student learning in order to provide feedback (Ruohoniemi et al., 2017; Vermunt and Donche, 2017; Demulder et al., 2019). Questionnaires serve as institutional tools to monitor learning quality and as instruments to provide individual feedback to students. While completion of these questionnaires may be voluntary in some cases, they can also be mandatory, particularly when included in coaching trajectories or used as online self-assessment instruments for students transitioning into higher education. Irrespective of the specific goal, it is of utmost importance that the collected data accurately represent the respondents’ genuine thoughts and beliefs (Tourangeau et al., 2000; Schwarz, 2007). This validity becomes even more critical when the questionnaire results are used to provide individual feedback or guidance for future learning endeavours.
The number of respondents that are classified as careless depends not only on the method used for detection but also on the specific cut-off value applied. Different studies employ different cut-off values for carelessness indicators. Researchers may choose a particular cut-off value based on intuition or through statistical analysis. For instance, Huang et al. (2012) used an intuitive cut-off value of two seconds per item for response time, while Iaconelli and Wolters (2020) derived their cut-off value from the average completion time of their survey. Cut-off values used in measures like long-string analysis and even-odd index also vary across studies (Jackson, 1977; Meade and Craig, 2012; Iaconelli and Wolters, 2020). Additionally, some studies employ multiple cut-off values, allowing researchers to adopt both lenient and strict approaches (McGonagle et al., 2016; Silber et al. 2019). This cautious approach provides flexibility in investigating carelessness.
In the field of student learning, research on the prevalence of careless response behaviour is scarce. Therefore, we aim to address this gap by conducting a study using a large dataset of students in their final years of secondary education. These students completed a self-report questionnaire on their cognitive processing strategies. Our study has three main research goals. Firstly, we seek to estimate the proportion of careless respondents within the dataset. To accomplish this, we will employ five carelessness indicators identified in previous research (Meade and Craig, 2012; Maniaci and Rogge, 2014; DeRight and Jorgensen, 2015). We will use different cut-off values for each indicator, adopting both a strict and more lenient approach to identify respondents whose responses should be treated with more caution. Secondly, we will examine the results of the different indicators and assess their coherence with one another. By comparing the outcomes of each indicator, we aim to gain insights into the consistency of the identified careless respondents across multiple measures. Lastly, we will investigate how the inclusion or exclusion of careless respondents from the dataset impacts the reliability of the data. By analysing the relationship between careless response behaviour and reliability estimates, we aim to assess the influence of carelessness on the overall quality and trustworthiness of the collected data.
To study carelessness in online self-report questionnaires, we used data derived from the Columbus project, a substantial research initiative undertaken by the Flemish Department of Education and Training. The data Columbus refers to both the name of the exploration tool developed to enhance the career decision-making processes of students nearing the completion of secondary education and the overall project itself (Demulder et al., 2021). Data were collected by means of an online exploration instrument. Students can complete this questionnaire during their final 2 years in secondary education. The instrument aims to aid students in their study choice process and to facilitate their transition into higher education by measuring their key competencies while also providing them with feedback on their learning (Demulder et al., 2021).
The total sample for this study comprised of 18,386 respondents from four different educational streams: general (60.29%), technical (34.04%), vocational secondary education (3.69%) and arts (1.98%). However, our analysis focused specifically on the students in the general and technical education streams as they constituted the majority of the sample population. Thus, our analysis was conducted on a subset of the total sample, specifically on 13,628 students who completed the section on cognitive processing strategies.
To ensure data quality, the total response time for each respondent was automatically recorded by the survey software. This measure encompassed the time from when the first question was displayed to when the last question was answered, including periods when the survey was open, but respondents were not actively engaged. An outlier analysis was conducted to identify extreme response times that could potentially distort the mean. Consequently, respondents whose response times fell outside the range identified in the box-and-whisker plot were excluded from the analysis. This resulted in the exclusion of 1,050 respondents, leaving a final sample of 12,578 respondents for further analysis. The age range of the respondents varied from 15 to 21 years, with a mean age of 17.01 years. Of the respondents, 56.5% identified as female.
The questionnaire used in this study consisted of five scales, which were selected from two already validated questionnaires on student learning. Three scales were taken from the short version of the Inventory of Learning Patterns of Students (ILS-SV) (Donche and Van Petegem, 2008; Vermunt and Donche, 2017), while the other two scales stemmed from the Learning and Study Strategies Inventory (LASSI) (Weinstein et al., 1988). In total, the questionnaire included 26 items, with 24 items tapping 5 different cognitive processing strategies and two additional control items aimed at detecting the prevalence of carelessness (Table 1). Both control items followed a uniform format: “Choose the first response option.” One control item was placed after the questions from the ILS scales, and the other was inserted after the questions from the LASSI scales. For all five scales, respondents provided their answers using a five-point Likert scale. The response options for the ILS-scales ranged from I rarely or never do this to I almost always do this while the response options for the LASSI-scales ranged from Not applicable to me at all to Very applicable to me. In order to check the expected dimensional structure of the selected scales, two CFA analyses were carried out on the total sample (N = 12.578), showing adequate model fit for, respectively, the three ILS-SV scales (12 items; CFI = 0.945, RMSEA = 0.060, SRMR = 0.043) and two LASSI-scales (12 items; CFI = 0.945, RMSEA = 0.067, SRMR = 0.071). To assess the internal consistency of each scale, Cronbach’s alpha coefficient was calculated (Table 1).
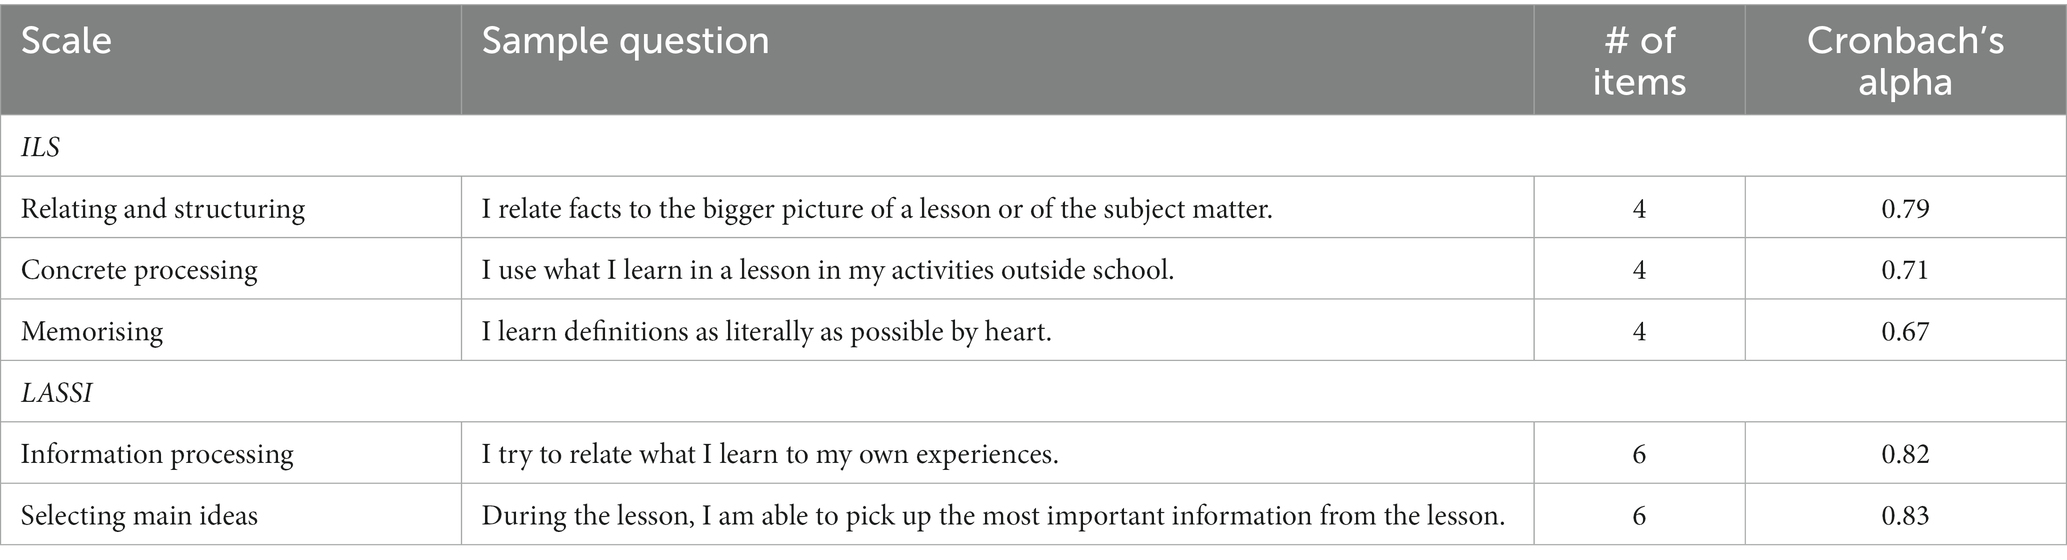
Table 1. Scales, item examples, number of items and reliability (internal consistency).
To investigate the prevalence of carelessness, we employed a combination of proactive and reactive indicators. Careless response behaviour was identified using five different, yet complementary, indicators: control items, response time, long-string analysis, even-odd index and Mahalanobis distance. For each of these indicators, both strict and lenient cut-off values were established. In the case of the control items, the lenient approach classified respondents as careless if they answered both items incorrectly. The strict approach required only one incorrect response to classify a respondent as careless. For the reactive indicators, the strict approach classified respondents as careless if their results on the respective indicator deviated from the mean by one standard deviation. In the lenient approach, the cut-off values were set at two standard deviations from the mean. By employing these different indicators and cut-off values, we aimed to adopt a cautious approach to identify and capture various degrees of careless response behaviour among the respondents. This comprehensive approach allowed us to assess the prevalence of carelessness in a robust manner.
To examine the relationship between the various indicators of carelessness, we adopted a two-pronged approach. Firstly, we assessed the number of indicators that categorised respondents as careless. Secondly, we compared the results of the proactive and reactive indicators to each other. To analyse the relationship between the different indicators, we employed Silber et al. (2019) procedure, which involved dividing the respondents into three distinct groups. The first group comprised respondents who correctly answered both control items and were categorised as high attentive. The second group, labelled as the medium attentive group, consisted of respondents who answered one of the two control items correctly. The third group, classified as the low attentive group, failed to answer either of the control items correctly. Subsequently, a one-way ANOVA analysis was conducted to investigate how differently these three groups scored on the four reactive detection techniques. To further explore the variations among the groups, Games-Howell post hoc comparisons were performed. Effect sizes were calculated using omega squared, providing an estimation of the magnitude of the observed differences.
To address our third research goal, which focused on how the inclusion or exclusion of careless respondents affected the reliability of the measured scales, we conducted a reliability analysis. Cronbach’s alpha was chosen as the measure of internal consistency for the scales. To assess the impact of including or excluding careless respondents on the internal consistency levels of the scales, we performed Feldt’s tests. These tests allowed us to determine whether there were significant differences in the internal consistency levels among different subsamples, including the careful respondents, the careless respondents, and the full sample (Diedenhofen and Musch, 2016).
Figure 1 illustrates how many respondents were categorised as careless by the lenient and strict approach for each of the five different carelessness indicators: control items, response time, long-string analysis, the even-odd index and Mahalanobis distance.
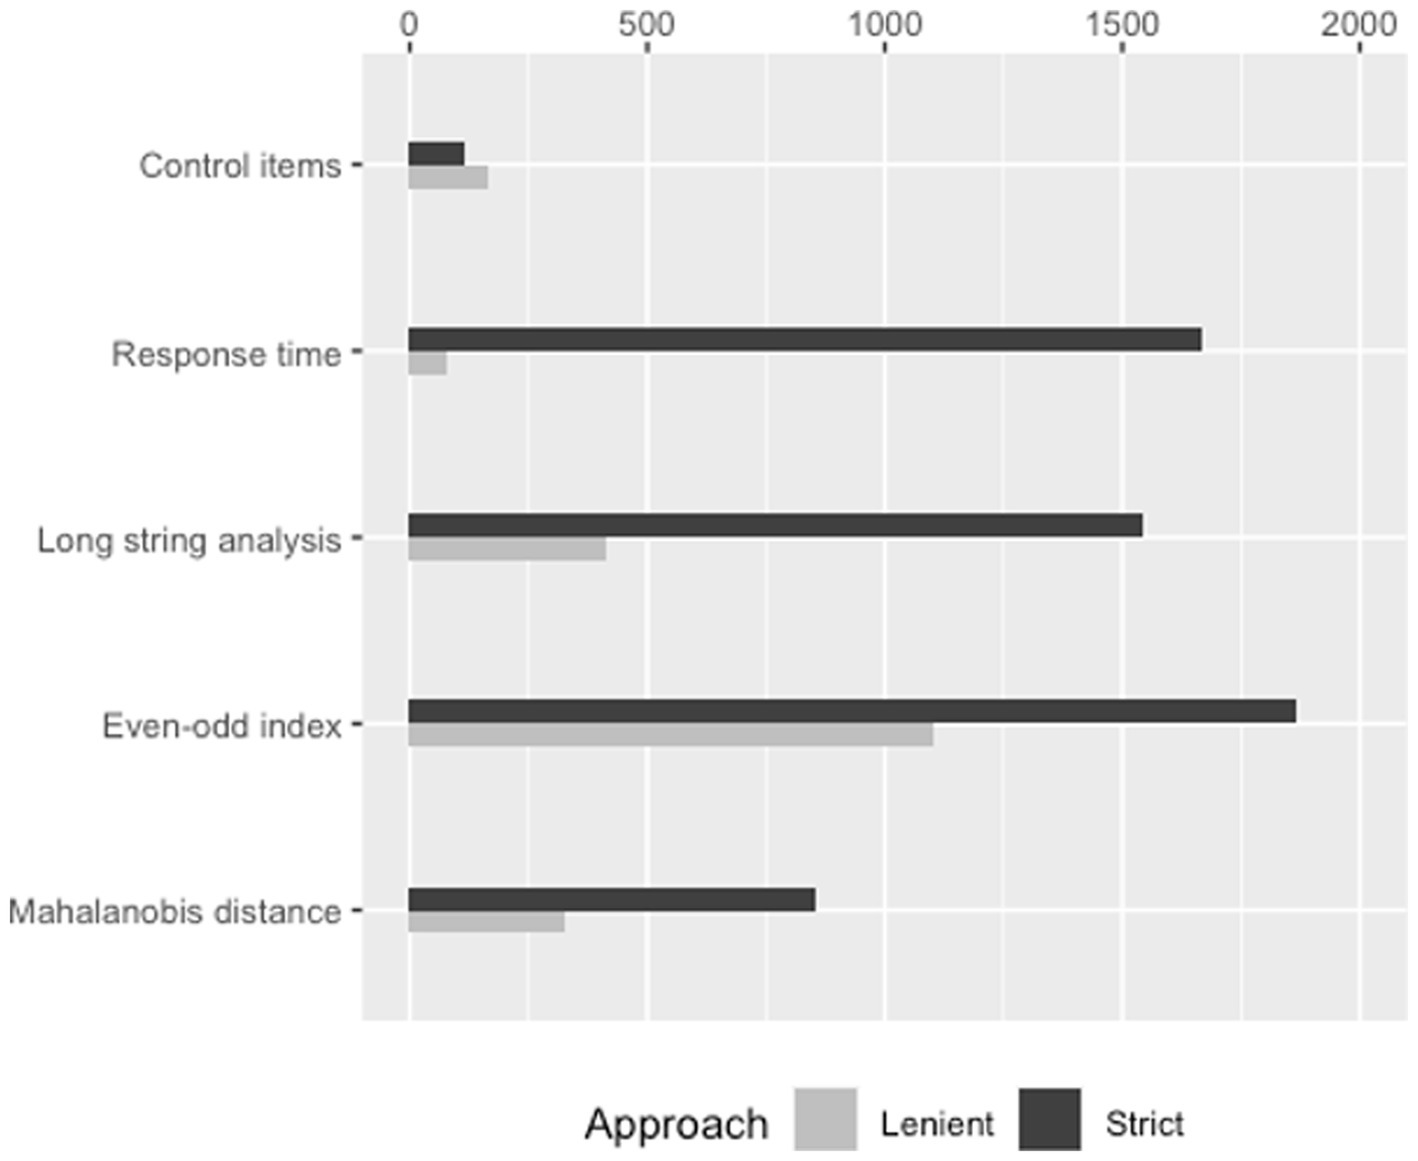
Figure 1. Number of careless respondents according to strict and lenient approaches to five separate indicators.
Table 2 details the descriptive statistics on the presence of careless respondents according to the five indicators.
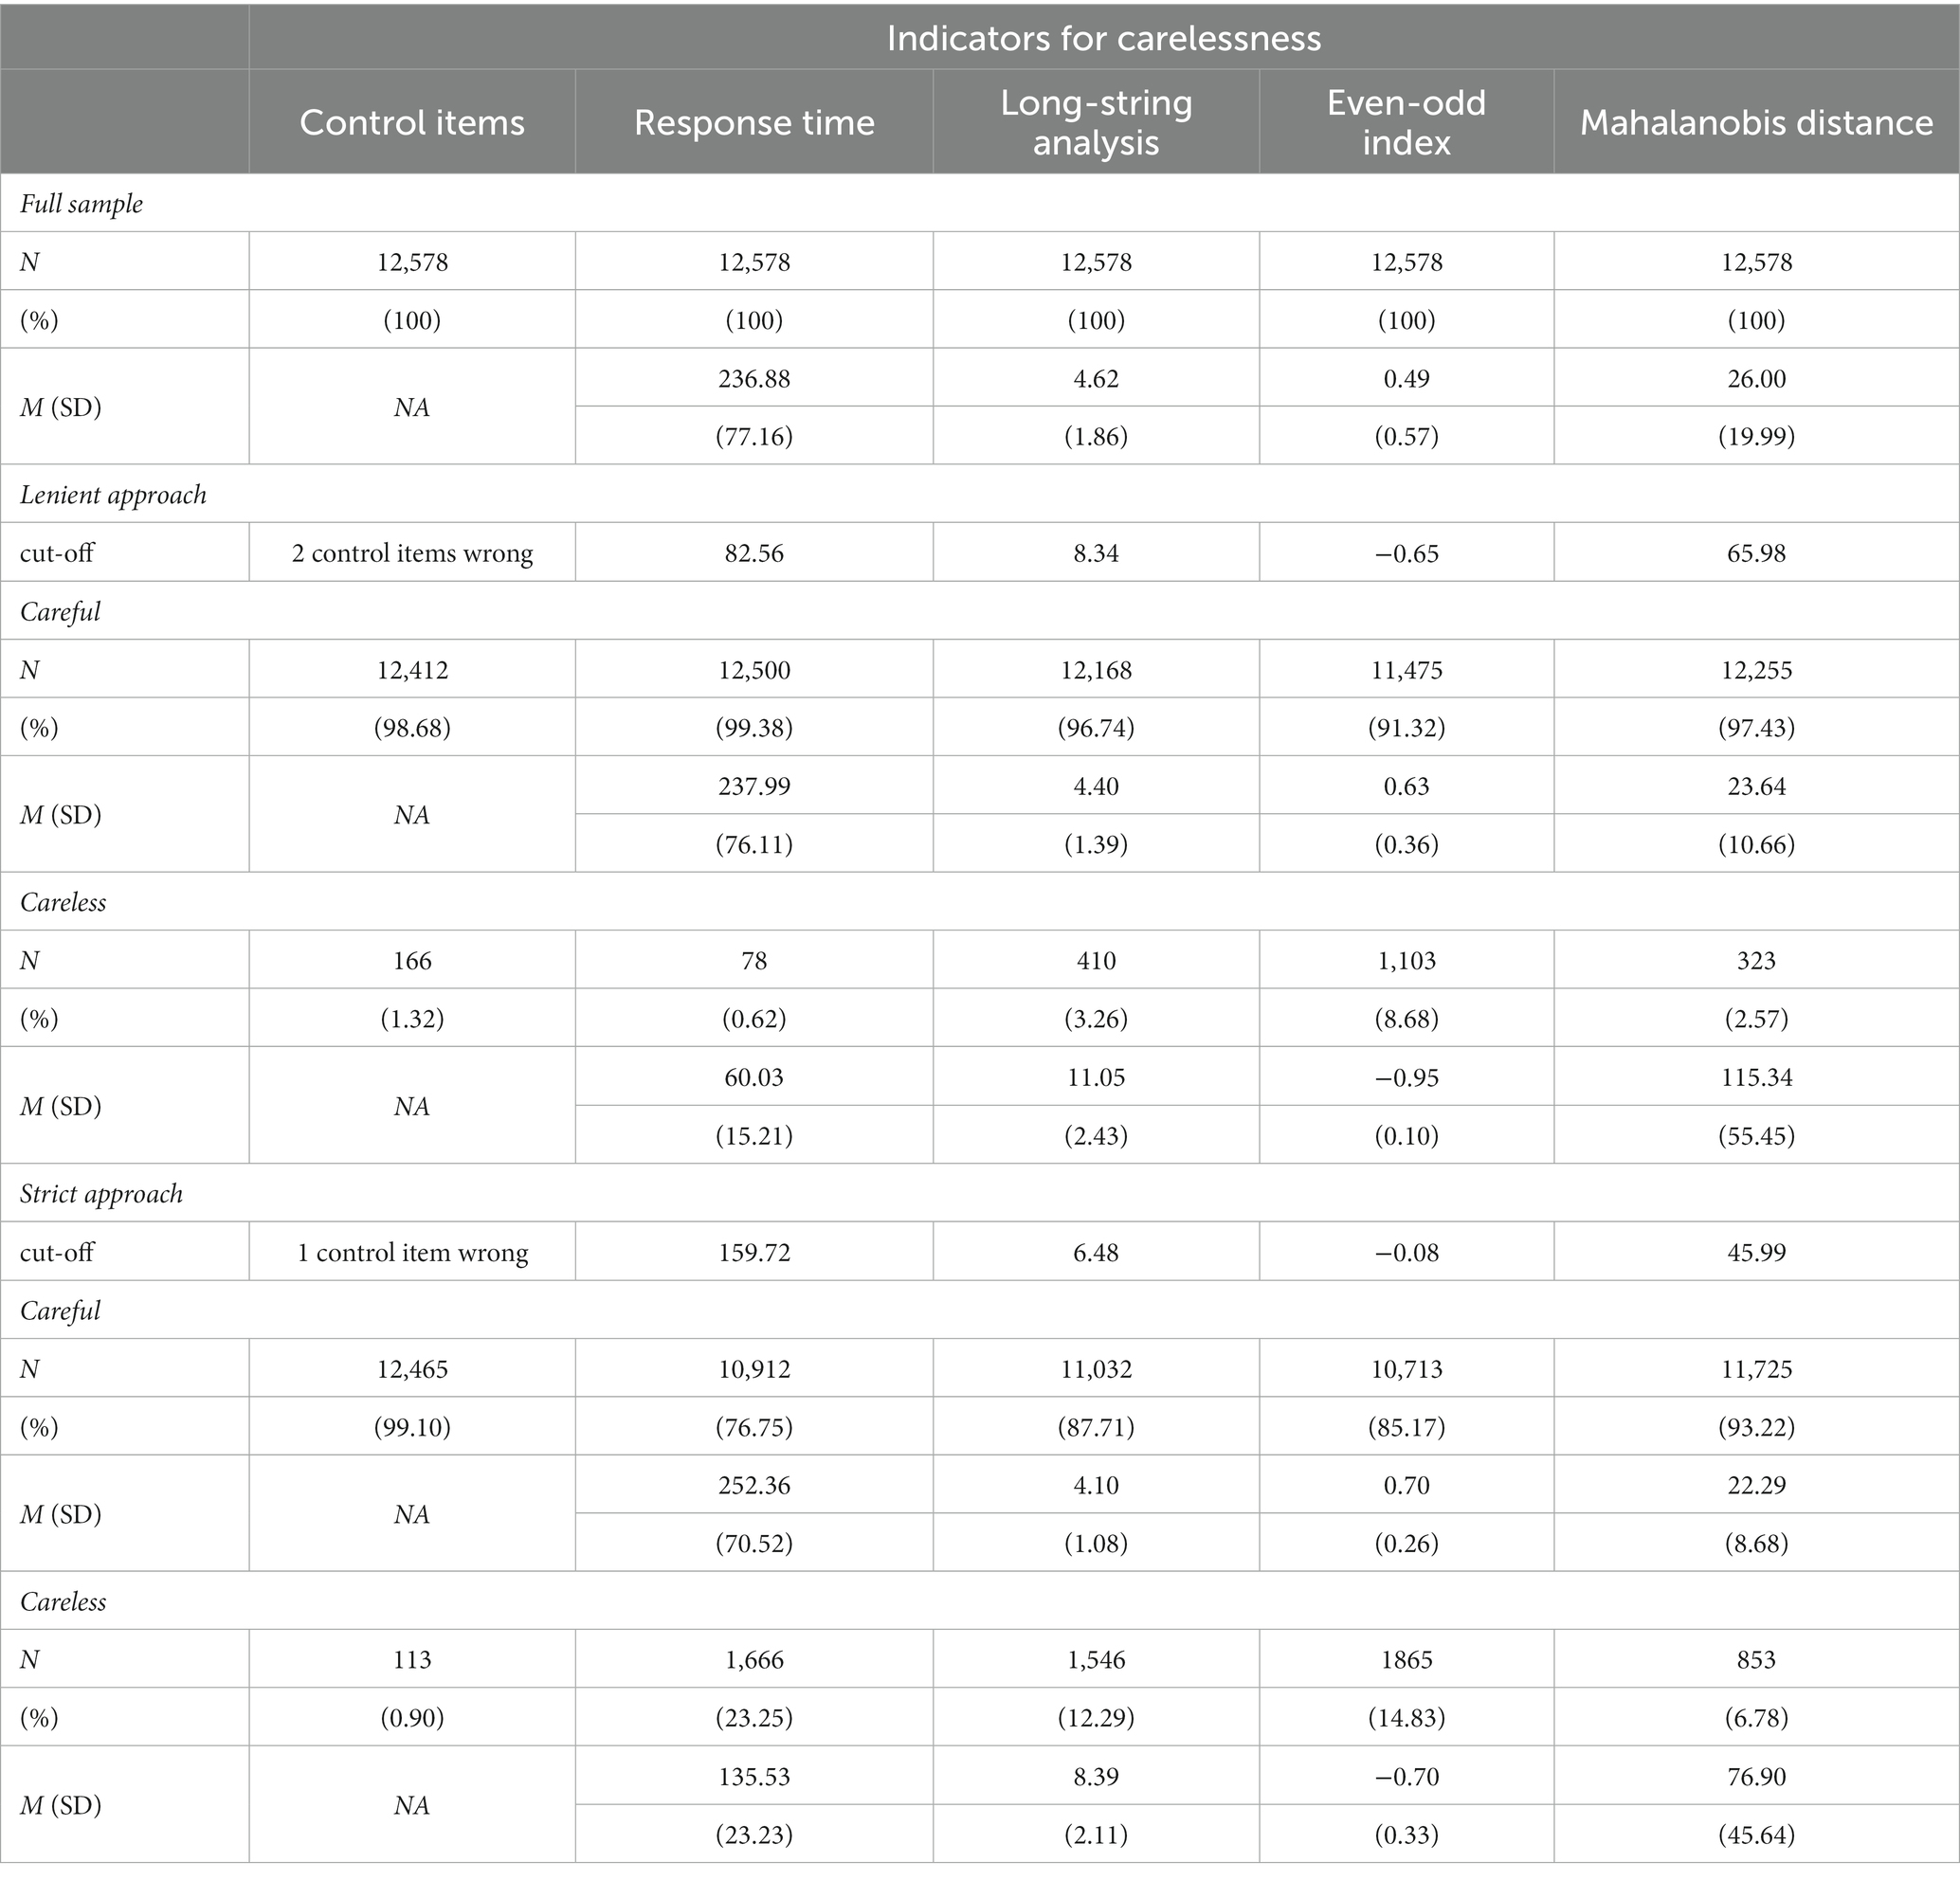
Table 2. Descriptive statistics of the careful and careless groups using lenient versus strict cut-off values.
In relation to the lenient cut-off values, the percentage of respondents identified as careless varied from 0.62 to 8.68%, depending on the specific indicator used. Among the indicators, the even-odd index categorised the highest number of respondents as careless, while the response time indicator yielded the fewest careless respondents. On the other hand, when employing strict cut-off values, the range of careless respondents extended from 0.90% (for control items) to 23.25% (for response time). It follows logically that employing stricter criteria for identifying careless responses allows for the identification of a larger number of respondents. However, the counterintuitive finding emerges in relation to the control items indicator. Notably, more respondents were found to answer two control items incorrectly rather than answering incorrectly only once. As a result, the lenient approach yields a higher number of identified careless respondents in this specific case.
The relationship between the different indicators was examined in two phases. In the first phase, we assessed the level of agreement among the indicators and investigated whether they identified the same respondents, despite their complementary nature. In the second phase, an ANOVA analysis was conducted to explore the relationship between the proactive and reactive indicators.
Given the use of five distinct carelessness indicators, we conducted an additional analysis to determine the number of respondents identified as careless by one, two, three, four, or all five indicators. This investigation aimed to enhance our understanding of the complementarity of these various techniques. The findings are presented in Table 3.
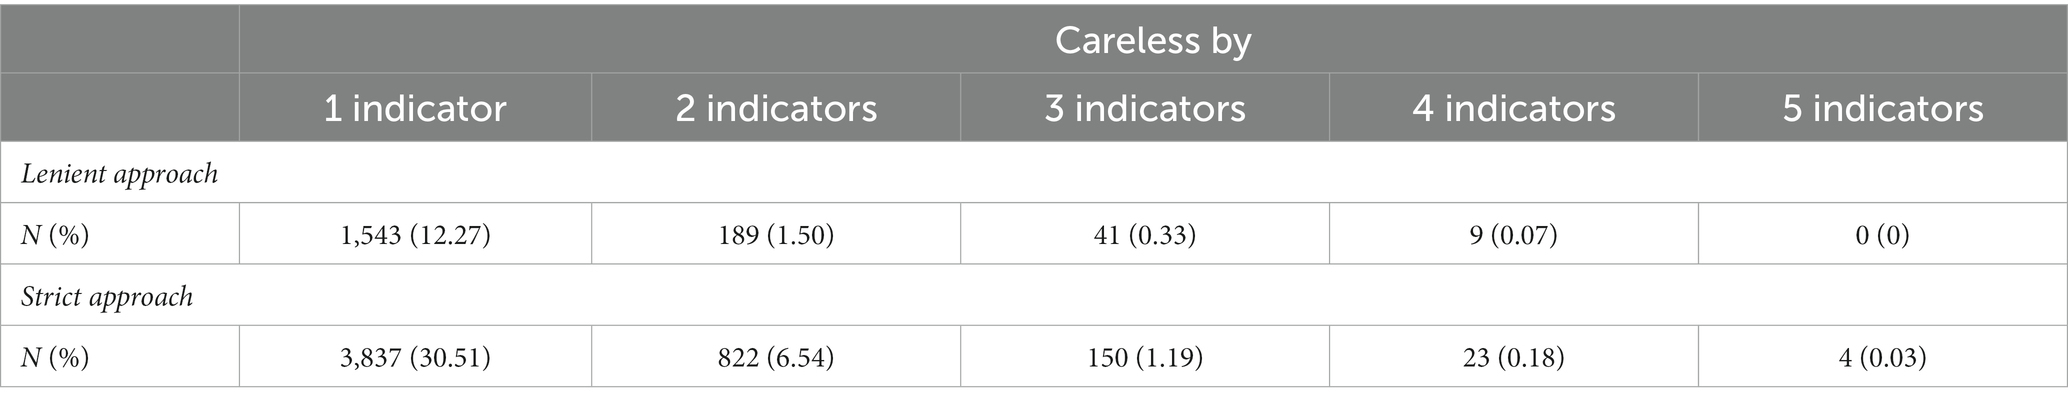
Table 3. Overview of the number of respondents considered careless by different indicators.
Under both the lenient and strict cut-off values, the majority of respondents identified as careless were flagged by only one indicator. When applying lenient cut-off values, approximately 12.27% of respondents were categorised as careless based on a single indicator, while with strict cut-off values, this percentage increased to 30.51%. Relatively fewer respondents were classified as careless by two or more indicators. When lenient cut-off values were used, around 1.50% of respondents were flagged by two indicators, whereas with strict cut-off values, this percentage rose to 6.54%. The number of respondents labelled as careless by three or more indicators was negligible, with the percentage not exceeding 1.19% in both lenient and strict approaches.
Specifically, 189 respondents were identified as careless by two lenient indicators, while 822 respondents were classified as careless by two strict indicators. A summary of these indicator combinations is presented in Table 4.
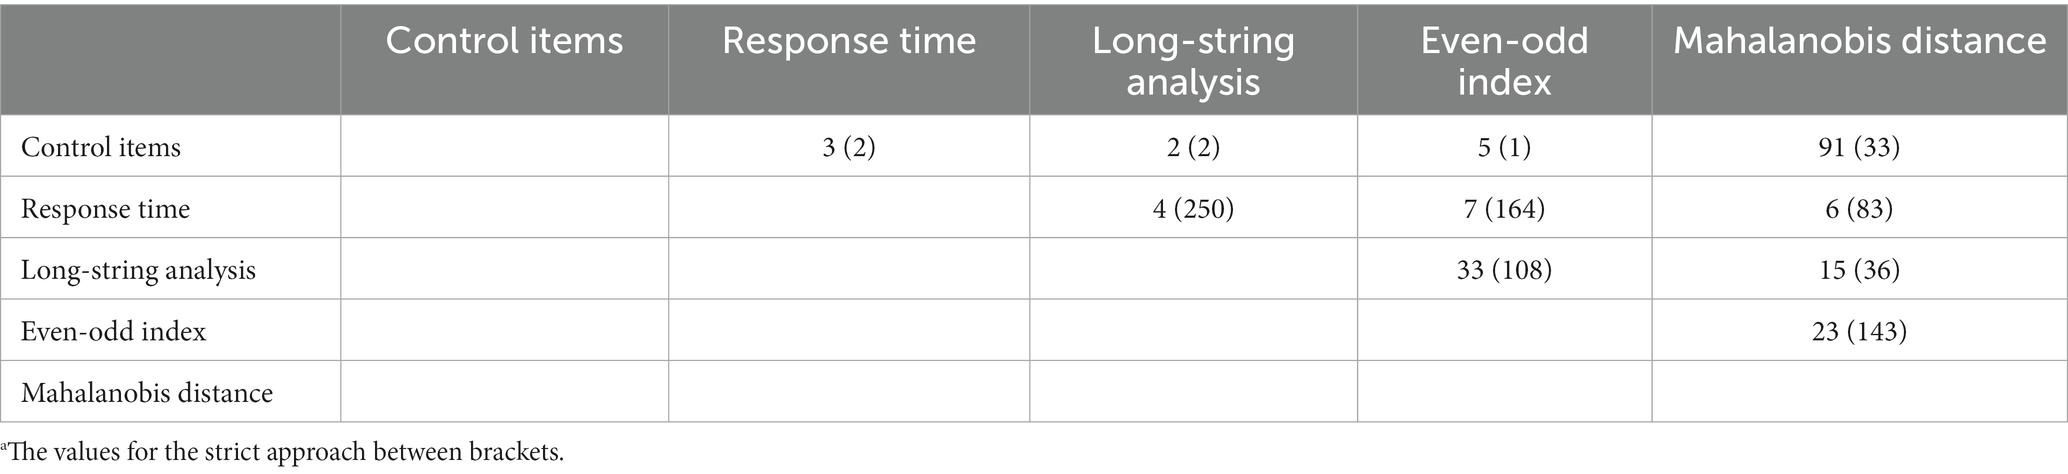
Table 4. Respondents categorised as careless by two indicators for both lenient and strict approachesa.
The use of lenient or strict cut-off values leads to significant discrepancies in the number of respondents categorised as careless. For instance, only four respondents were identified as careless by both the lenient cut-off value for response time and the lenient cut-off value for long-string analysis. However, when employing strict cut-off values, the number of respondents labelled as careless by both response time and long-string analysis increased to 250. Similar substantial differences can be observed for other combinations of indicators, as shown in Table 4. When lenient cut-off values were used, the combination of control items and Mahalanobis distance classified the highest number of respondents as careless, totalling 91 individuals. On the other hand, when employing strict criteria, the combination of response time and long-string analysis identified the largest number of respondents as careless, with a total of 250 individuals.
To investigate the relationship between proactive and reactive carelessness indicators, the respondents were initially divided into three attentiveness groups: high, medium, and low. This categorisation was based on the calculation of the number of correct and incorrect responses to control items. Subsequently, the relationship between these attentiveness groups and each reactive indicator (response time, long-string analysis, even-odd index, and Mahalanobis distance) was examined using ANOVA. Effect sizes (such as omega squared) and multiple pairwise comparisons (Games-Howell Post-hoc Tests) were calculated to further analyse the differences in scores across the various reactive indicators. The results of these analyses, showcasing how the attentiveness groups performed on the different reactive indicators, are summarised in Table 5.
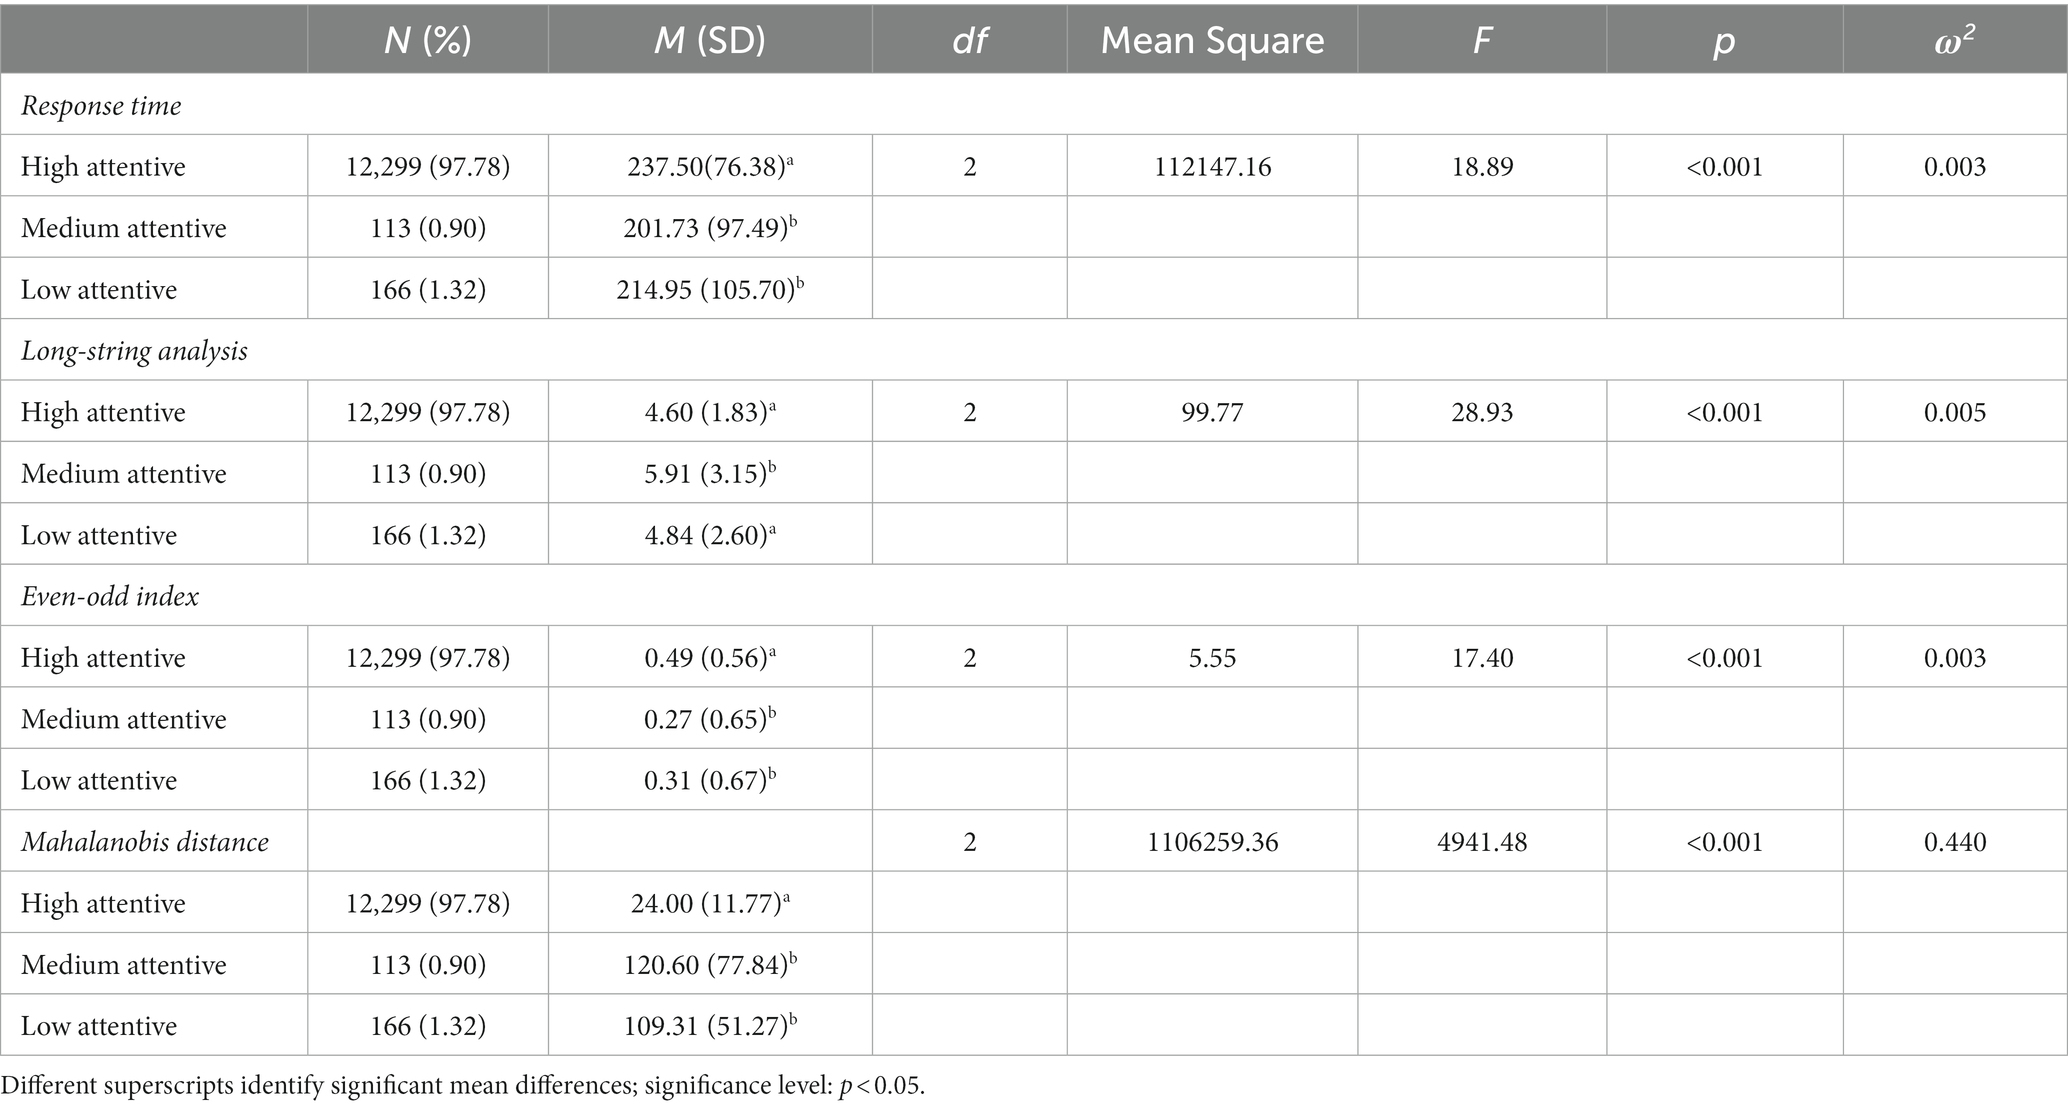
Table 5. Results of the ANOVA analysis.
Attentiveness had a significant effect on response time [F (2, 12,575) = 18.89, p = <0.001], indicating that high attentive respondents took longer to complete the survey compared to low and medium attentive groups. The average response time for high attentive respondents was 237.50 s, while it was 214.95 s for low attentive respondents. Post hoc comparisons indicated that the mean score for the medium attentive (M = 201.73, SD = 97.49) and low attentive (M = 214.95, SD = 105.70) groups did not differ significantly from each other.
The three groups differed significantly in their scores on the long-string careless response indicator [F (2, 12,575) = 28.93, p = <0.001]. High attentive respondents tended to choose the same response option consecutively an average of 4.60, while the medium and low attentive groups had values of 5.91 and 4.84, respectively. The mean score of the high attentive group (M = 4.60, SD = 1.83) did not significantly differ from the mean score of the low attentive group (M = 4.84, SD = 2.60).
Even-odd index was also sensitive to differences in attentiveness [F (2, 12,575) = 17.40, p = <0.001]. The responses of high attentive respondents exhibited a higher correlation (0.49) between the even and odd items of a scale compared to the low attentive group (0.31). There was no significant difference in the mean score between the medium attentive group (M = 0.27, SD = 0.65) and the low attentive group (M = 0.31, SD = 0.67).
The attentiveness groups differed significantly on the Mahalanobis distance indicator [F (2, 12,575) = 4941.48, p = <0.001]. The Mahalanobis distance index of the high attentive group (M = 24.00, SD = 11.77) was lower than that of the low attentive group (M = 109.31, SD = 51.27). Post hoc comparisons revealed significant differences between the different groups, except for the difference between the medium and the low attentive group.
In this stage of the analysis, we examined the relationship between careless response behaviour and data quality. Specifically, we explored the impact of including or excluding careless respondents on the reliability of the measured scales. Reliability estimates for the scales were calculated for each subgroup, allowing for a comparison of the reliability estimates, particularly in terms of internal consistency (Cronbach’s Alpha) with those of the complete dataset. The results of these reliability estimates are presented in Table 6.
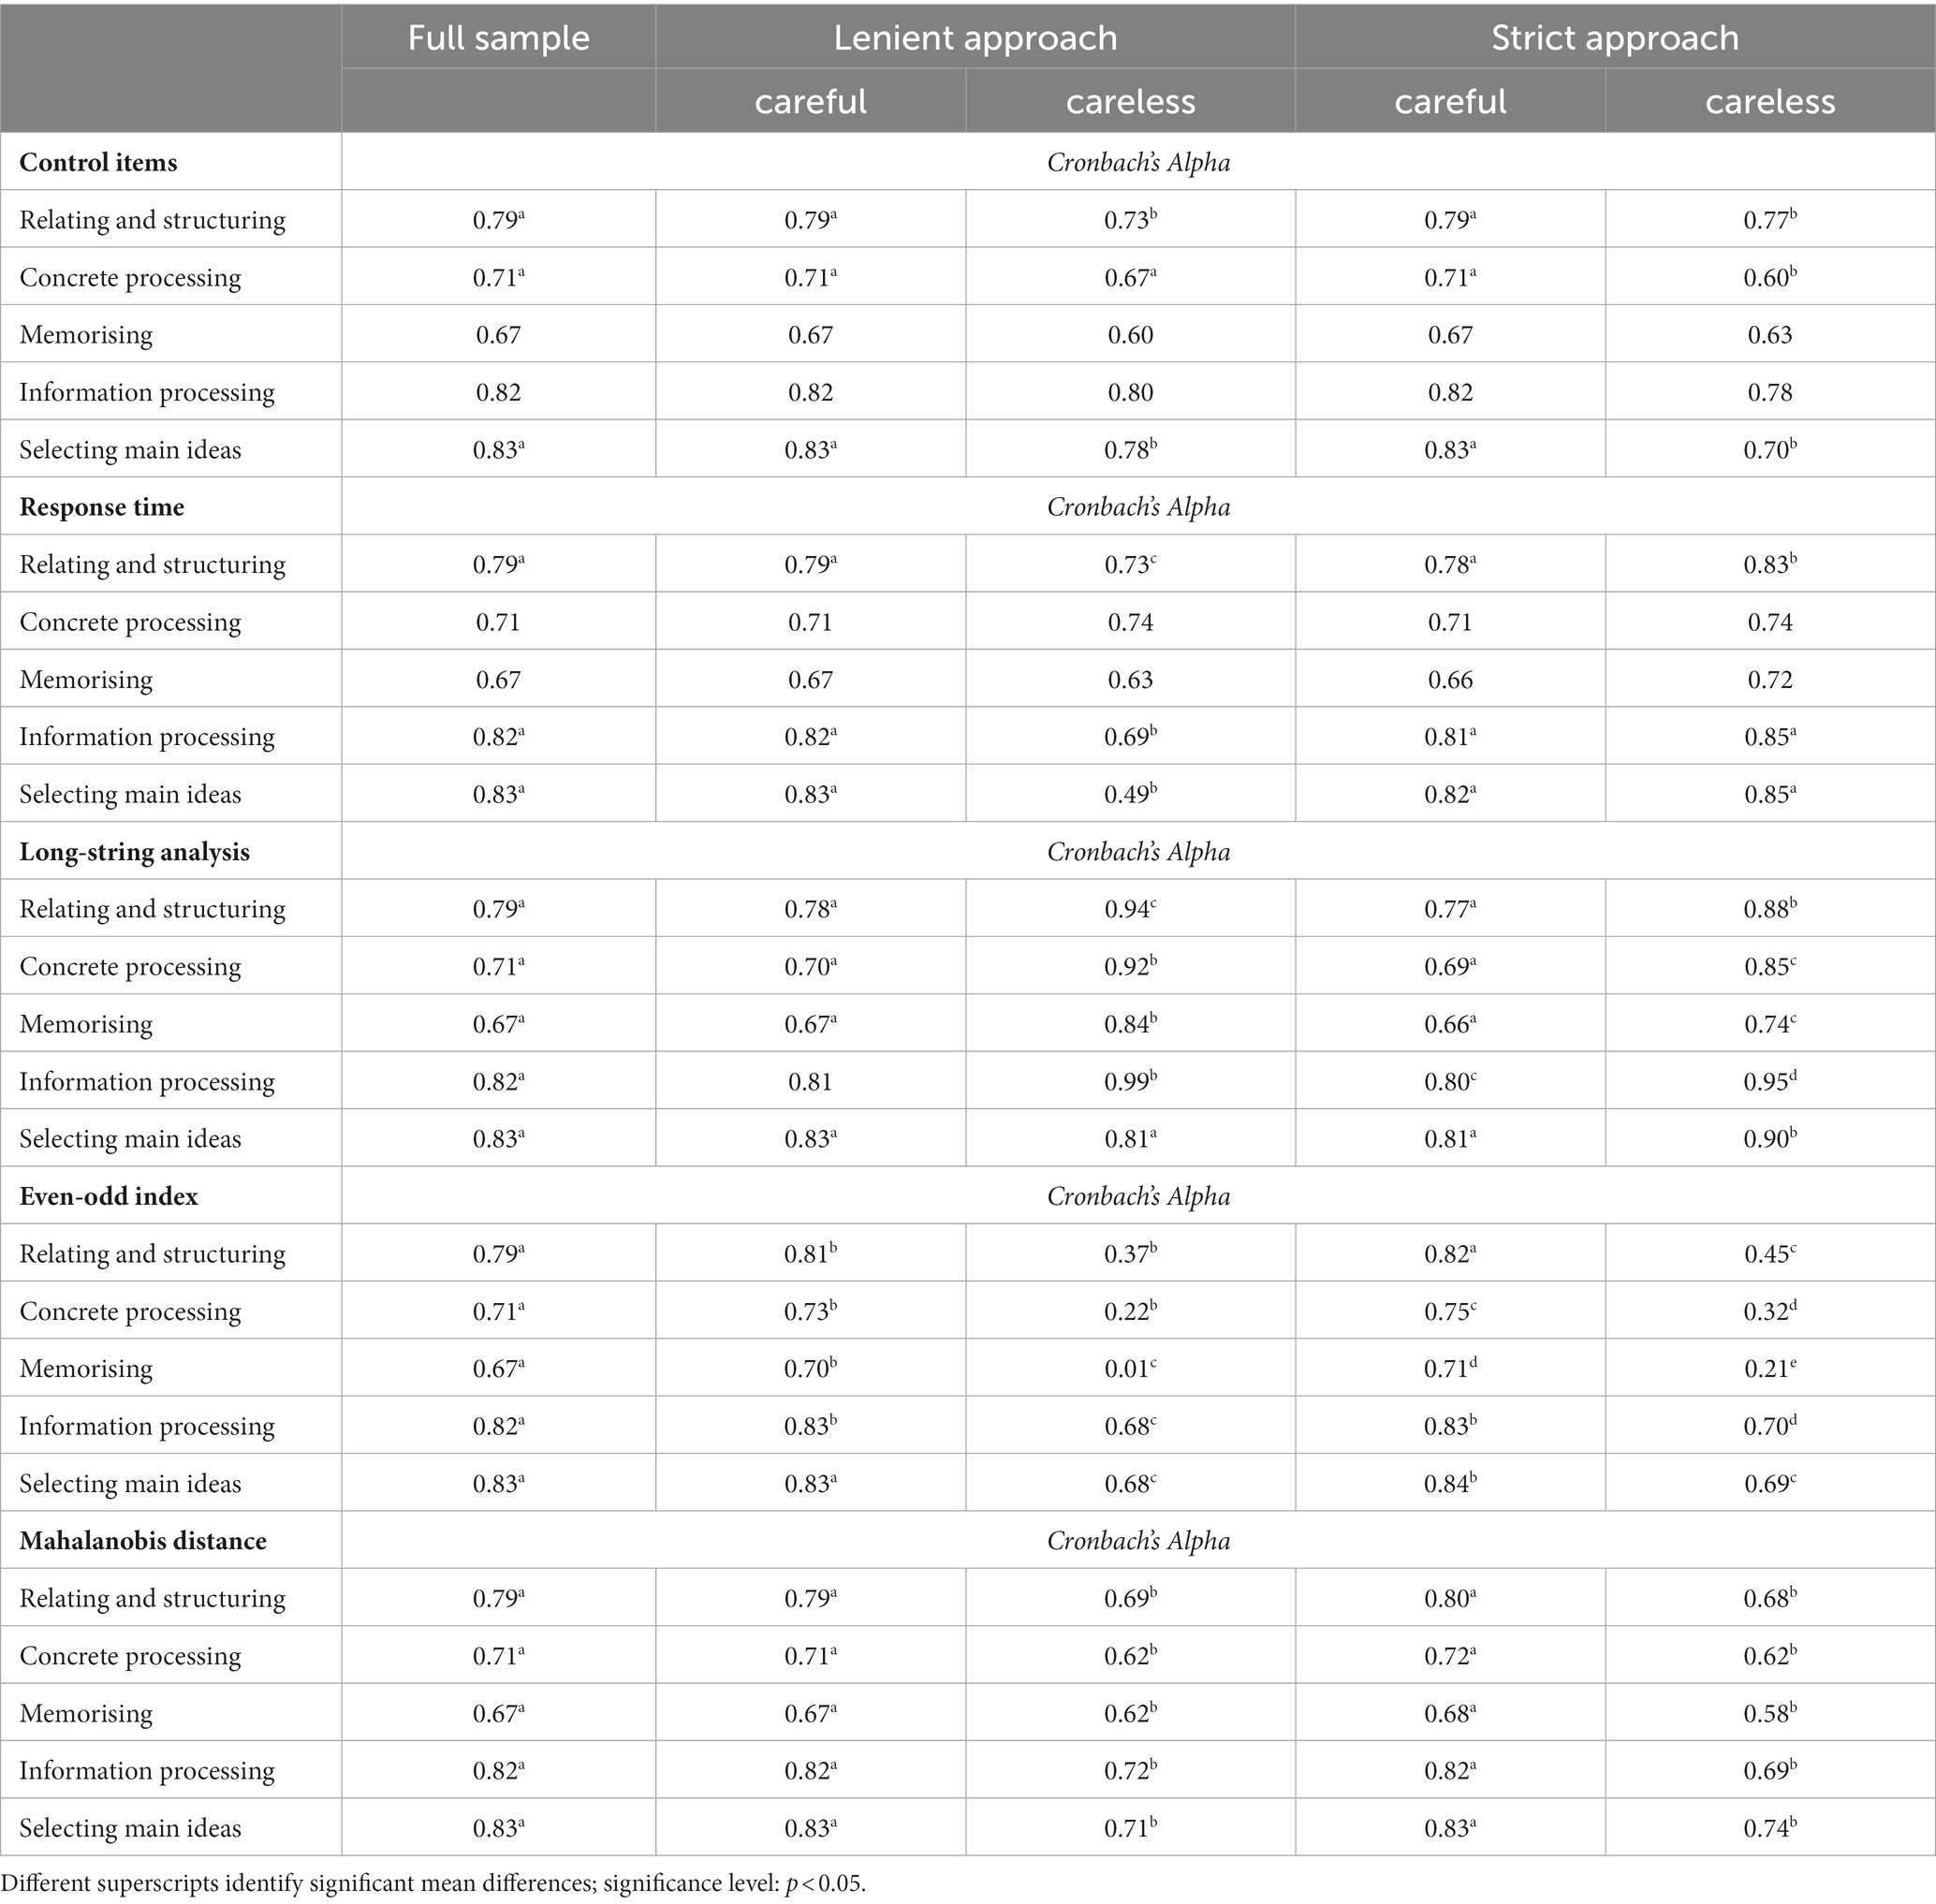
Table 6. Comparison of the scales’ internal consistencies for both lenient and strict cut-off approaches.
The analysis of the relationship between careless response behaviour and data quality revealed different trends among the five detection indicators. Depending on the specific carelessness indicator used, the reliability scores either increased or decreased compared to the reliability scores of the complete sample. This pattern was observed for both the lenient and strict approaches.
When using the control items as indicators of carelessness, the reliability of the careless group was lower than that of the careful group, while the reliability of the careful group remained comparable to the reliability of the full sample. In the case of the lenient approach for response time, the reliability score of the careless group was significantly lower than that of the full sample. However, with the strict approach, the reliability of the careless group increased for certain scales, while the reliability of the careful group remained comparable to the full sample. The analysis of long-string analysis revealed higher reliability scores for the careless group compared to the full sample and the overall group of careless respondents. Additionally, the lenient approach yielded higher reliability scores than the strict approach. However, for both cut-off values, the reliability score of the careful group decreased. In contrast, the even-odd index exhibited an opposite pattern. The careless group identified using the lenient approach had the lowest reliability score, while the reliability score of the careful group increased considerably. The Mahalanobis distance indicator demonstrated similar patterns to the even-odd index, but the even-odd index appeared to be more strongly associated with lower reliabilities in the group of careless responders.
Furthermore, when considering a significant number of respondents identified as careless by at least one indicator using the lenient or strict approach, the relationship with reliability estimates was examined within these subgroups as opposed to the full sample. Both careful responder subgroups showed significantly higher levels of internal consistency on all scales compared to the careless responder subgroups. Grouping responders using the lenient approach as careless resulted in the lowest levels of reliabilities compared to the strict approach. These findings highlight how the inclusion of careless respondents in samples can considerably affect the reliability estimates of scales (see Table 7).
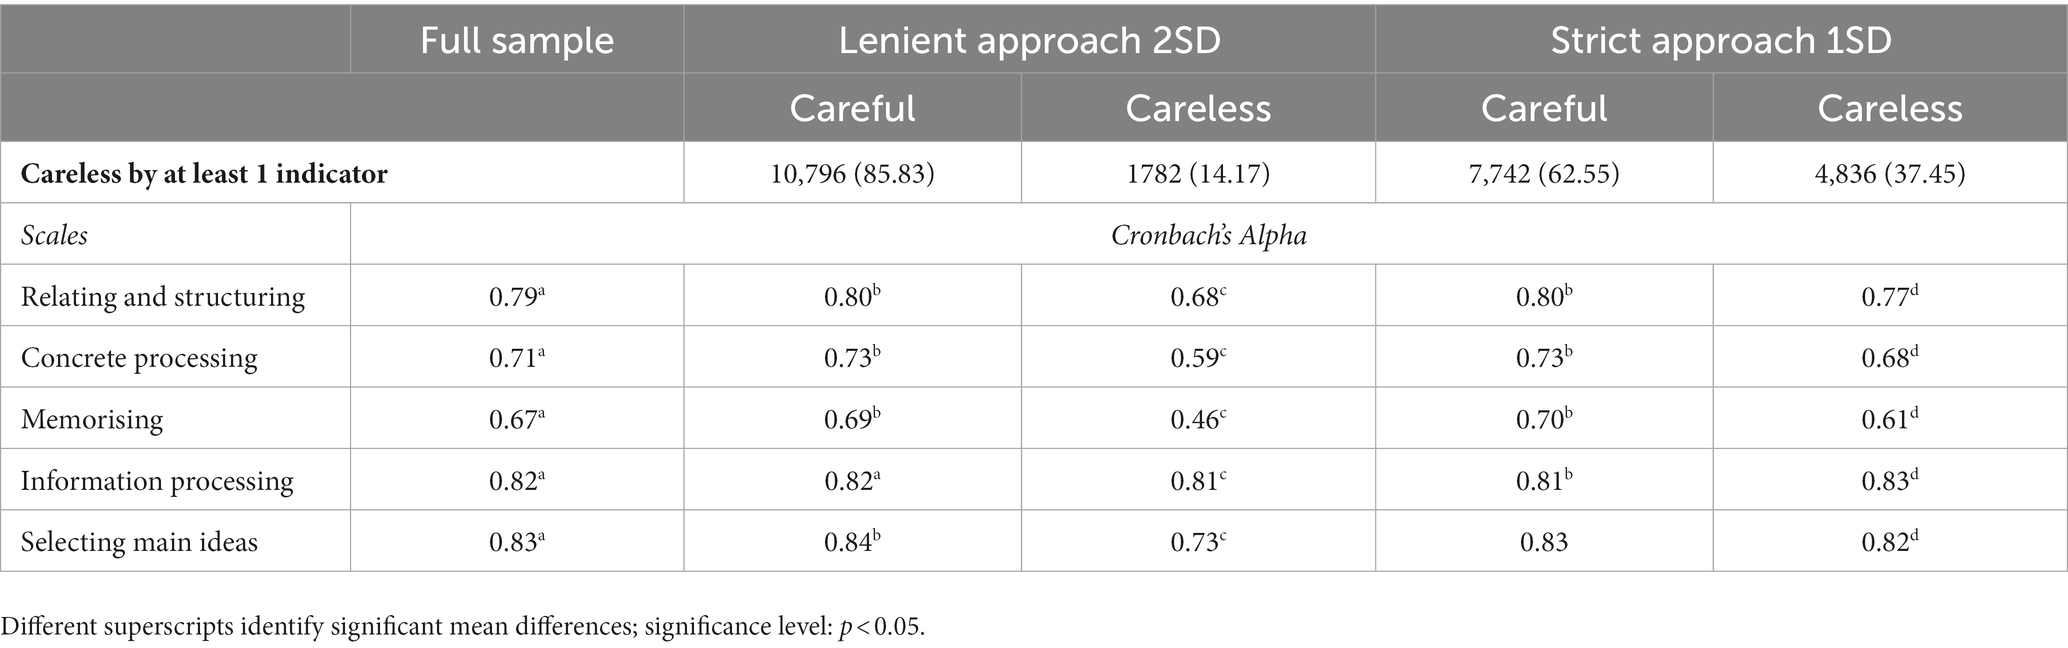
Table 7. Comparison of reliability estimates of the scales for the full sample (N = 12.578) and for the subsamples based on lenient and strict cut-off approaches.
The assumption is often made that completing questionnaires is a simple and uncomplicated task. It is commonly believed that respondents merely read the questions, provide their answers, and proceed to the next question until the questionnaire is finished. Nonetheless, this perception can deceive us into thinking that this process is effortlessly manageable for every respondent. In reality, the completion of a questionnaire is a complex endeavour that engages various cognitive processes. Unfortunately, not all respondents invest the necessary effort in these processes, whether intentionally or unintentionally (Tourangeau, 1984; Karabenick et al., 2007). Respondents who complete questionnaires carelessly are a concern for researchers as even a low percentage of carelessness can significantly alter the data (Oppenheimer et al., 2009; Huang et al., 2015) in ways that change the correlations between variables, statistical power, and effect sizes they observe in their studies (Woods, 2006; Rammstedt et al., 2013; Wood et al., 2017; DeSimone and Harms, 2018). Consequently, the study aims to achieve two primary objectives: first, to investigate the prevalence of careless response behaviour, and second, to explore its potential consequences on data quality. To illustrate these aspects, a large dataset is employed for analysis in this study.
The first objective of the study was to detect the presence of careless response behaviour by examining pro-active and reactive indicators. The identification of careless respondents varied depending on the specific indicator used and whether a lenient or strict approach was taken The outcomes obtained from different indicators were influenced by the particular type of careless response behaviour exhibited by the respondents (DeSimone and Harms, 2018). By employing multiple complementary detection techniques, various types of careless response behaviour were identified in the dataset, consistent with previous research findings (Curran, 2016). Our study expanded on these results by examining the differences between employing a lenient or strict cut-off approach when identifying careless responders. When lenient criteria were used, between 0.62 and 8.68% of respondents were classified as careless. Among the indicators, response time flagged the fewest respondents, while the even-odd index flagged the largest number. However, when strict cut-off values were applied, significantly higher percentages of respondents were categorised as careless. The control items identified 0.90% of respondents, whereas response time flagged 23.25% of respondents. Comparing the percentages of careless respondents reported in other studies reveals similarly diverse findings: Gough and Bradley (1996) identified 1% of their respondents as careless while Oppenheimer et al. (2009) identified 46% of their respondents as careless.
To gain deeper insights into the effectiveness of these indicators in detecting careless response behaviour, we also examined their individual contributions to the selection process. Results indicate that, with both lenient and strict cut-off values, the majority of respondents were classified as careless based on just one indicator. A smaller number of respondents were labelled as careless by two indicators and even fewer were identified as such by three indicators. Very few respondents were labelled as careless by four or five indicators. This suggests that the indicators used are highly complementary and allow researchers to discern different types of careless respondents. Overall, 14.17% of respondents were considered careless by at least one of the five indicators when employing the lenient approach, while the strict criteria considered 37.45% of respondents as careless. These percentages are lower than the 49% reported by Oppenheimer et al. (2009). Additionally, the lenient approach’s result falls within the range of 10 to 15%, which is considered a reasonable percentage of careless respondents according to scholarly consensus (Meade and Craig, 2012; Curran, 2016). Despite the substantial difference between the two approaches and the fact that the results of the lenient approach fall within the expected range, the questionnaire responses alone do not provide sufficient information to determine if any of the strict cut-off values were excessively stringent. The study further demonstrated that identification of careless respondents is not solely dependent on the selection of pro-active and reactive indicators, but is also influenced by decisions made regarding the choice of cut-off values.
The second objective of the study was to investigate the relationship between careless response behaviour and data quality, specifically focusing on the internal consistency of the scales. The analyses revealed significant differences in the alpha coefficients of the scales when examined within different subsamples. Among respondents identified as careless by the long-string analysis, their responses still demonstrated internal consistency. In contrast, respondents flagged by the even-odd index showed inconsistent responses. This finding is expected since the long-string analysis detects identical answers, which typically yield consistent results, whereas the even-odd index identifies random answering patterns. The impact on reliability scores appears to depend on the specific carelessness indicator used, as well as the number of respondents labelled as careless. In a larger sample like ours, these differences may go unnoticed, emphasising the importance of examining careless behaviour at the individual level as well. By considering careless responding on an individual basis, researchers can gain a more comprehensive understanding of how it affects data quality and the internal consistency of scales.
The findings of the study also revealed that the inclusion or exclusion of careless respondents in different sample groups had an impact on the reliability estimates of the data samples. Specifically, we examined whether different groups of respondents, classified based on their attentiveness as determined by their responses to the control items, differed in terms of reactive indicators of carelessness. The analyses demonstrated that response time, long-string analysis, even-odd index, and Mahalanobis distance were closely associated with the level of attentiveness. The group classified as highly attentive exhibited longer response times compared to both the medium and low attentive groups, who completed the questionnaire more quickly. Moreover, the high attentive group provided shorter strings of consecutive identical answers compared to the medium and low attentive groups. The high attentive group also scored higher on the even-odd index and Mahalanobis distance compared to the other two groups. Regarding the relationship between attentiveness and scale reliability, the internal consistency of the scales was higher for the high attentive group compared to the medium and low attentive groups. Irrespective of the specific scale being measured, the reliability was consistently lowest for the medium or low attentive group. These findings suggest that the inclusion of careless respondents can significantly impact the reliability estimates in different sample groups and highlights the importance of considering attentiveness levels and the presence of careless responding when assessing the reliability of scales and interpreting the data obtained from different respondent groups.
Our study successfully demonstrated the prevalence of careless responding in a large database using student surveys, leading to several important observations for research practice. Firstly, employing different and complementary detection methods, both proactive and reactive, proves to be a fruitful approach for identifying careless respondents with diverse answering patterns beyond simple straightlining behaviour (Huang et al., 2012; Curran, 2016). Secondly, the results further underscore the significance of considering careless responders when examining data quality concerns in student surveys, as their presence can also impact the accuracy of subsequent analyses and results (also see Ward and Mead, 2023). Thirdly, incorporating multiple indicators of carelessness in the analyses is valuable, but it is equally important to inspect the cut-off values, as indicated by the presented results. These discussed indicators allow researchers to detect careless response behaviour at an initial level. However, more in-depth techniques are needed to gain deeper insights into this matter. Future research should shed light on the actual process of completing questionnaires to understand why respondents exhibit specific answering behaviours. Conducting post-questionnaire interviews could be an initial step towards uncovering the reasons behind certain response patterns. Additionally, employing eye-tracking studies could provide an unobtrusive means for investigating the completion process of the questionnaire (Chauliac et al., 2020, 2022). This would enable a better understanding of individual differences in cognitive processing during questionnaire completion, and the findings could then be incorporated into reliability analyses.
Despite the limitations of the current research, it highlights that the detection techniques examined can serve as an initial step in identifying respondents whose answering patterns careless response behaviour, which is crucial for researchers using self-report questionnaires. It is important to note that the presence of careless respondents in a dataset is not inherently negative. When researchers are aware of the existence of careless response behaviour, they can perform analyses that consider its influence without immediately excluding careless respondents from the dataset. For researchers aiming to detect carelessness and enhance data quality in survey research, it is like walking a tightrope, where one must tread with exceptional care. On one hand, researchers should avoid being overly strict in identifying carelessness to prevent the exclusion of reliable respondents from the dataset. On the other hand, being too lenient may result in including respondents who genuinely exhibited careless behaviour. While using these indicators to detect carelessness can be a useful starting point for identifying potential suspect cases, it should not be the sole endpoint or final determination. Further research and methodologies are necessary to delve deeper into understanding and addressing careless response behaviour in survey research. Researchers should continuously refine and improve detection techniques, considering additional factors such as respondent interviews and eye-tracking studies, to enhance understanding of the underlying reasons for careless responses and incorporate this knowledge into reliability analyses.
The datasets presented in this article are not readily available given the confidential nature of the data. Requests to access the datasets should be directed to bWFyZ290LmNoYXVsaWFjQG9kaXNlZS5iZQ==.
In accordance with local legislation and institutional requirements, this study involving human participants did not necessitate ethical review and approval. The datasets used in this study are derived from the Columbus project, commissioned by the Flemish Ministry of Education and Training. All participants provided written informed consent. During the registration process, students agreed to the terms and conditions developed in collaboration with the Data Protection Officer of the Ministry of Education and Training, aligning with the General Data Protection Regulation (GDPR). The Ministry strictly adheres to GDPR principles when handling personal data. The sharing of personal data follows a designated protocol, outlined in the Columbus protocol (January 27, 2021), which is accessible at https://data-onderwijs.vlaanderen.be/documenten/bestand.ashx?id=13051.
MC, JW, DG, and VD contributed to the design and implementation of the research, to the analysis of the results and to the writing of the manuscript. All authors contributed to the article and approved the submitted version.
This research was funded by BOF (UA/FFB170229) and the Flanders Research Foundation (FWO/K801922N).
The authors declare that the research was conducted in the absence of any commercial or financial relationships that could be construed as a potential conflict of interest.
All claims expressed in this article are solely those of the authors and do not necessarily represent those of their affiliated organizations, or those of the publisher, the editors and the reviewers. Any product that may be evaluated in this article, or claim that may be made by its manufacturer, is not guaranteed or endorsed by the publisher.
Arias, V. B., Garrido, L. E., Jenaro, C., Martínez-Molina, A., and Arias, B. (2020). A little garbage in, lots of garbage out: assessing the impact of careless responding in personality survey data. Behav. Res. Methods 52, 2489–2505. doi: 10.3758/s13428-020-01401-8
Bowling, N. A., Huang, J. L., Bragg, C. B., Khazon, S., Liu, M., and Blackmore, C. E. (2016). Who cares and who is careless? Insufficient effort responding as a reflection of respondent personality. J. Pers. Soc. Psychol. 111, 218–229. doi: 10.1037/pspp0000085
Catrysse, L., Gijbels, D., Donche, V., De Maeyer, S., Van den Bossche, P., and Gommers, L. (2016). Mapping processing strategies in learning from expository text: An exploratory eye tracking study followed by a cued recall. Frontline learning research 4, 1–16. doi: 10.14786/flr.v4i1.192
Chauliac, M., Catrysse, L., Gijbels, D., and Donche, V. (2020). It is all in the “surv-eye”: can eye tracking data shed light on the internal consistency in self-report questionnaires on cognitive processing strategies?. Frontline Res. Educ. 8, 26–39.
Chauliac, M., Catrysse, L., Gijbels, D., De Maeyer, S., and Donche, V. (2022). Self-report questionnaires scrutinised: Do eye movements reveal individual differences in cognitive processes while completing a questionnaire? Int. J. Soc. Res. Methodol. 26, 391–407.
Curran, P. G. (2016). Methods for the detection of carelessly invalid responses in survey data. J. Exp. Soc. Psychol. 66, 4–19. doi: 10.1016/j.jesp.2015.07.006
Demulder, L., Lacante, M., and Donche, V. (2021). “Large scale measurements to support students in their transition to higher education. The importance of including a non-cognitive perspective” in Research on teaching and learning in higher education. ed. E. Braun (Waxman), 11–20.
Demulder, L., Willems, J., Verschueren, K., Lacante, M., and Donche, V. (2019). Het studiekeuzeproces voor hoger onderwijs in kaart: validering van de Verkorte Vragenlijst Studiekeuzetaken (VVST). Pedagogische Studiën 96, 312–328.
DeRight, J., and Jorgensen, R. S. (2015). I just want my research credit: frequency of suboptimal effort in a non-clinical healthy undergraduate sample. Clin. Neuropsychol. 29, 101–117. doi: 10.1080/13854046.2014.989267
DeSimone, J. A., DeSimone, A. J., Harms, P. D., and Wood, D. (2018). The differential impacts of two forms of insufficient effort responding. Appl. Psychol. 67, 309–338. doi: 10.1111/apps.12117
DeSimone, J. A., and Harms, P. D. (2018). Dirty data: the effects of screening respondents who provide low-quality data in survey research. J. Bus. Psychol. 33, 559–577. doi: 10.1007/s10869-017-9514-9
DeSimone, J. A., Harms, P. D., and DeSimone, A. J. (2015). Best practice recommendations for data screening. J. Organ. Behav. 36, 171–181. doi: 10.1002/job.1962
Diedenhofen, B., and Musch, J. (2016). Cocron: a web Interface and R package for the statistical comparison of Cronbach's alpha coefficients. Int. J. Internet Sci. 11, 51–60.
Dinsmore, D. L. (2017). Toward a dynamic, multidimensional research framework for strategic processing. Educ. Psychol. Rev. 29, 235–268. doi: 10.1007/s10648-017-9407-5
Donche, V., and Van Petegem, P. (2008). The validity and reliability of the short inventory of learning patterns. in Style and cultural differences: how can organisations, regions and countries take advantage of style differences. eds. E. Cools, H. van den Broeck, and T. Redmond (Leuven University Press), 49–59.
Dunn, A. M., Heggestad, E. D., Shanock, L. R., and Theilgard, N. (2018). Intra-individual response variability as an indicator of insufficient effort responding: comparison to other indicators and relationships with individual differences. J. Bus. Psychol. 33, 105–121. doi: 10.1007/s10869-016-9479-0
Ehlers, C., Greene-Shortridge, T. M., Weekley, J., and Zajack, M. D. (2009). The exploration of statistical methods in detecting random responding. Atlanta, GA: Paper presented at the annual meeting of the Society for Industrial/Organizational Psychology.
Fryer, L. K., and Dinsmore, D. L. (2020). The promise and pitfalls of self-report: development, research design and analysis issues, and multiple methods. Frontline Learn. Res. 8, 1–9. doi: 10.14786/flr.v8i3.623
Gijbels, D., Donche, V., Richardson, J. T. E., and Vermunt, J. D. H. M. (2014). Learning patterns in higher education. Dimensions and research perspectives: Routledge.
Goldammer, P., Annen, H., Stöckli, P. L., and Jonas, K. (2020). Careless responding in questionnaire measures: detection, impact, and remedies. Leadersh. Q. 31:101384. doi: 10.1016/j.leaqua.2020.101384
Gough, H. G., and Bradley, P. (1996). Manual for the California psychological inventory. 3rd edn. Palo Alto, CA: Consulting Psychologists Press.
Hauser, D. J., and Schwarz, N. (2016). Semantic prosody and judgment. J. Exp. Psychol. Gen. 145, 882–896. doi: 10.1037/xge0000178
Herzog, A. R., and Bachman, J. G. (1981). Effects of questionnaire length on response quality. Public Opin. Q. 45, 549–559. doi: 10.1086/268687
Huang, J., Curran, P., Keeney, J., Poposki, E., and DeShon, R. (2012). Detecting and deterring insufficient effort responding to surveys. J. Bus. Psychol. 27, 99–114. doi: 10.1007/s10869-011-9231-8
Huang, J. L., Liu, M., and Bowling, N. A. (2015). Insufficient effort responding: examining an insidious confound in survey data. J. Appl. Psychol. 100, 828–845. doi: 10.1037/a0038510
Iaconelli, R., and Wolters, C. A. (2020). Insufficient effort responding in surveys assessing self-regulated learning: nuisance or fatal flaw? Frontline Learn. Res. 8, 104–125. doi: 10.14786/flr.v8i3.521
Jackson, D. N. (1977). Reliability of the Jackson personality inventory. Psychol. Rep. 40, 613–614. doi: 10.2466/pr0.1977.40.2.613
Johnson, J. A. (2005). Ascertaining the validity of individual protocols from web-based personality inventories. J. Res. Pers. 39, 103–129. doi: 10.1016/j.jrp.2004.09.009
Karabenick, S. A., Woolley, M. E., Friedel, J. M., Ammon, B. V., Blazevski, J., Bonney, C. R., et al. (2007). Cognitive processing of self-report items in educational research: do they think what we mean? Educ. Psychol. 42, 139–151. doi: 10.1080/00461520701416231
Kendeou, P., and Trevors, G. (2012). “Quality learning from texts we read: what does it take?” in Enhancing the quality of learning: Dispositions, instruction, and learning processes. eds. J. R. Kirby and M. J. Lawson (Cambridge University Press), 251–275.
Kim, Y., Dykema, J., Stevenson, J., Black, P., and Moberg, D. P. (2019). Straightlining: overview of measurement, comparison of indicators, and effects in mail–web mixed-mode surveys. Soc. Sci. Comput. Rev. 37, 214–233. doi: 10.1177/0894439317752406
Krosnick, J. A. (1999). Survey research. Annu. Rev. Psychol. 50, 537–567. doi: 10.1146/annurev.psych.50.1.537
Krumpal, I. (2013). Determinants of social desirability bias in sensitive surveys: a literature review. Qual. Quant. 47, 2025–2047. doi: 10.1007/s11135-011-9640-9
Lavrakas, P. J. (Ed.) (2008). Encyclopedia of survey research methods. Vols. 1-10. Sage Publications. doi: 10.4135/9781412963947
Lechner, C. M., and Rammstedt, B. (2015). Cognitive ability, acquiescence, and the structure of personality in a sample of older adults. Psychol. Assess. 27, 1301–1311. doi: 10.1037/pas0000151
Lonka, K., Olkinuora, E., and Mäkinen, J. (2004). Aspects and prospects of measuring studying and learning in higher education. Educ. Psychol. Rev. 16, 301–323. doi: 10.1007/s10648-004-0002-1
Mahalanobis, P. C. (1936). On the generalized distance in statistics. Proc. Natl. Acad. Sci. India 2, 49–55.
Maniaci, M. R., and Rogge, R. D. (2014). Caring about carelessness: participant inattention and its effects on research. J. Res. Pers. 48, 61–83. doi: 10.1016/j.jrp.2013.09.008
Marasi, S., Wall, A., and Brewer, K. (2019). Participant carelessness: is it a substantial problem with survey data? Electron. J. Bus. Res. Methods 17, 1–16. Available at: https://academic-publishing.org/index.php/ejbrm/article/view/1385/1348
Matjašic, M., Vehovar, V., and Manfreda, K. L. (2018). Web survey paradata on response time outliers: a systematic literature review. Adv. Methodol. Stat. 15, 23–41. doi: 10.51936/yoqn3590
McGonagle, A. K., Huang, J. L., and Walsh, B. M. (2016). Insufficient effort survey responding: an under-appreciated problem in work and organisational health psychology research. Appl. Psychol. 65, 287–321. doi: 10.1111/apps.12058
Meade, A. W., and Craig, S. B. (2012). Identifying careless responses in survey data. Psychol. Methods 17, 437–455. doi: 10.1037/a0028085
Neuringer, A. (1986). Can people behave "randomly?": the role of feedback. J. Exp. Psychol. Gen. 115, 62–75. doi: 10.1037/0096-3445.115.1.62
Niessen, A. S. M., Meijer, R. R., and Tendeiro, J. N. (2016). Detecting careless respondents in web-based questionnaires: which method to use? J. Res. Pers. 63, 1–11. doi: 10.1016/j.jrp.2016.04.010
Oppenheimer, D. M., Meyvis, T., and Davidenko, N. (2009). Instructional manipulation checks: detecting satisficing to increase statistical power. J. Exp. Soc. Psychol. 45, 867–872. doi: 10.1016/j.jesp.2009.03.009
Rammstedt, B., Kemper, C. J., and Borg, I. (2013). Correcting big five personality measurements for acquiescence: an 18-country cross-cultural study. Eur. J. Personal. 27, 71–81. doi: 10.1002/per.1894
Ruohoniemi, M., Forni, M., Mikkonen, J., and Parpala, A. (2017). Enhancing quality with a research-based student feedback instrument: a comparison of veterinary students’ learning experiences in two culturally different European universities. Qual. High. Educ. 23, 249–263. doi: 10.1080/13538322.2017.1407401
Schellings, G. (2011). Applying learning strategy questionnaires: problems and possibilities. Metacogn. Learn. 6, 91–109. doi: 10.1007/s11409-011-9069-5
Schwarz, N. (2007). Cognitive aspects of survey methodology. Appl. Cogn. Psychol. 21, 277–287. doi: 10.1002/acp.1340
Silber, H., Danner, D., and Rammstedt, B. (2019). The impact of respondent attentiveness on reliability and validity. Int. J. Soc. Res. Methodol. 22, 153–164. doi: 10.1080/13645579.2018.1507378
Thompson, A. H. (1975). Random responding and the questionnaire measurement of psychoticism. Soc. Behav. Personal. Int. J. 3, 111–115. doi: 10.2224/sbp.1975.3.2.111
Tourangeau, R. (1984). “Cognitive sciences and survey methods” in Cognitive aspects of survey methodology: building a bridge between disciplines. eds. T. B. Jabine, M. L. Straf, J. M. Tanur, and R. Tourangeau (Washington, DC: National Academy Press), 73–100.
Tourangeau, R., Rips, L. J., and Rasinski, K. (2000). The psychology of survey response Cambridge University Press.
Veenman, M. V. J. (2011). Alternative assessment of strategy use with self-report instruments: a discussion. Metacogn. Learn. 6, 205–211. doi: 10.1007/s11409-011-9080-x
Veenman, M. V. J., Van Hout-Wolters, B. H. A. M., and Afflerbach, P. (2006). Metacognition and learning: conceptual and methodological considerations. Metacogn. Learn. 1, 3–14. doi: 10.1007/s11409-006-6893-0
Vermunt, J. D. H. M., and Donche, V. (2017). A learning patterns perspective on student learning in higher education: State of the art and moving forward. Educ. Psychol. Rev. 29, 269–299. doi: 10.1007/s10648-017-9414-6
Ward, M. K., and Meade, A. W. (2018). Applying social psychology to prevent careless responding during online surveys. Appl. Psychol. 67, 231–263. doi: 10.1111/apps.12118
Ward, M. K., and Meade, A. W. (2023). Dealing with careless responding in survey data: prevention, identification, and recommended best practices. Annu. Rev. Psychol. 74, 577–596. doi: 10.1146/annurev-psych-040422-045007
Weinstein, C. E., Zimmermann, S. A., and Palmer, D. R. (1988). “Assessing learning strategies: the design and development of the LASSI” in Learning and study strategies: Issues in assessment, instruction, and evaluation. eds. C. E. Weinstein, E. T. Goetz, and P. A. Alexander (San Diego, California: Academic Press), 25–40.
Wood, D., Harms, P. D., Lowman, G. H., and DeSimone, J. A. (2017). Response speed and response consistency as mutually validating indicators of data quality in online samples. Soc. Psychol. Personal. Sci. 8, 454–464. doi: 10.1177/1948550617703168
Keywords: careless responding, data quality, self-report questionnaires, detection, processing strategies
Citation: Chauliac M, Willems J, Gijbels D and Donche V (2023) The prevalence of careless response behaviour and its consequences on data quality in self-report questionnaires on student learning. Front. Educ. 8:1197324. doi: 10.3389/feduc.2023.1197324
Edited by:
Gavin T. L. Brown, The University of Auckland, New ZealandReviewed by:
Reza Kafipour, Shiraz University of Medical Sciences, IranCopyright © 2023 Chauliac, Willems, Gijbels and Donche. This is an open-access article distributed under the terms of the Creative Commons Attribution License (CC BY). The use, distribution or reproduction in other forums is permitted, provided the original author(s) and the copyright owner(s) are credited and that the original publication in this journal is cited, in accordance with accepted academic practice. No use, distribution or reproduction is permitted which does not comply with these terms.
*Correspondence: Margot Chauliac, bWFyZ290LmNoYXVsaWFjQG9kaXNlZS5iZQ==
Disclaimer: All claims expressed in this article are solely those of the authors and do not necessarily represent those of their affiliated organizations, or those of the publisher, the editors and the reviewers. Any product that may be evaluated in this article or claim that may be made by its manufacturer is not guaranteed or endorsed by the publisher.
Research integrity at Frontiers
Learn more about the work of our research integrity team to safeguard the quality of each article we publish.