 Manargul Mukasheva
 Zukhra Kalkabayeva
 Nurbek Pussyrmanov
94% of researchers rate our articles as excellent or good
Learn more about the work of our research integrity team to safeguard the quality of each article we publish.
Find out more
ORIGINAL RESEARCH article
Front. Educ., 09 August 2023
Sec. Higher Education
Volume 8 - 2023 | https://doi.org/10.3389/feduc.2023.1195200
This article is part of the Research TopicMetaverse in Education: Opportunities and ChallengesView all 13 articles
This study examines the use of virtual reality (VR) in programming, specifically in visualization of sorting methods. Addressing students’ needs to better understand and implement sorting methods, “VR sorting” application was developed to visualize the bubble sorting and selection sorting abstract methods in the VR environment. The effects of visualization were evaluated drawing on an extended taxonomy, specifically developed by the authors of this study. The results indicate that VR might significantly enhance students’ understanding of sorting tasks, further allowing them to employ these skills in practice. Specifically, 76.9% of students, who studied sorting methods in virtual environment drawing on “VR sorting” application, demonstrated higher outcomes in implementing sorting tasks. VR visualization of sorting methods, differs from existing ways of visualizing learning in the context of constructivism. Since VR allows the student to construct the algorithm himself directly interacting machine memory in the form of cells where the data is stored and managing the progress of sorting. These results shed some light to future research avenues on VR enabled constructive visualization.
Sorting is a basic concept in data analysis since arranging data in a certain order allows to optimize data processing. In Kazakhstan, the most easy-to-implement bubble sorting and selection sorting methods are generally taught at the undergraduate level within the “Algorithms and data structures” and “Programming” courses. However, the abstract nature of the sorting task and the simultaneous presence of several actions with unordered data make it difficult for students to fully comprehend the sorting methods. Thus, teachers apply various methods and tools: drawing sorting steps on paper; presentations and flowcharts, handouts, animation applications on a computer, dance videos, and mobile applications to visualize sorting algorithm (Bernát, 2014; Faria, 2017). The rise of modern digital technology has given unprecedented opportunities to visualize learning materials in augmented and virtual reality (Huang et al., 2017; Lim et al., 2022; Patil et al., 2022). Hence, learning effects of visualization using virtual reality has become subject of new research.
This study aims to test the effectiveness of visualization in VR for studying abstract concepts, specifically bubble and selection sorting methods. It is led by theoretical and empirical hypothesis.
Theoretical hypothesis of the research supposes that evolution of visualization as a teaching method is happening under the influence of global trends in education, initiated by the emergence of new technologies to implement the visualization effects.
The empirical hypothesis assumes that high level of visualization and direct interaction of students with objects in the VR environment provide better understanding of the sorting methods and develop their hard skills of solving practical problems in real life. In general, 150 undergraduate students in their first and second year of study of one of the regional universities of Kazakhstan participated in the study.
The students of the control group studied sorting algorithms in an ordinary way by viewing presentations and drawing sorting steps on paper while solving practical tasks. The students of the experimental group were given an opportunity to solve tasks in the VR environment using the “VR sorting” application and the VR headset Oculus Quest 2. To evaluate students’ learning outcomes five practical tasks were specifically designed.
The studies on visualization of sorting methods draw on animation, game, and constructive approaches along with traditional approaches such as using paper and pencil for tracing. The application of each of these approaches to study sorting methods is informed by general trends in education as digitalization of content and teaching methods. It should be noted that an increasing interest among students in understanding and applying sorting algorithms has been influenced by the widespread study of algorithmization and programming courses within the educational programs of universities in computer science. At the beginning, students learnt about the implementation of sorting algorithms through traditional lectures, tracking the sorting process by drawing each step on the board (or paper, or presentation). In programming workshops, students were encouraged to visualize an outcome of each sorting step in accordance with the execution code and preferably with comments to better understand the realization of the sorting algorithm in fact (Mukasheva, 2013). The Table 1 presents an example of a step-by-step implementation of the sorting algorithm in descending order by the selection sorting method in C ++.
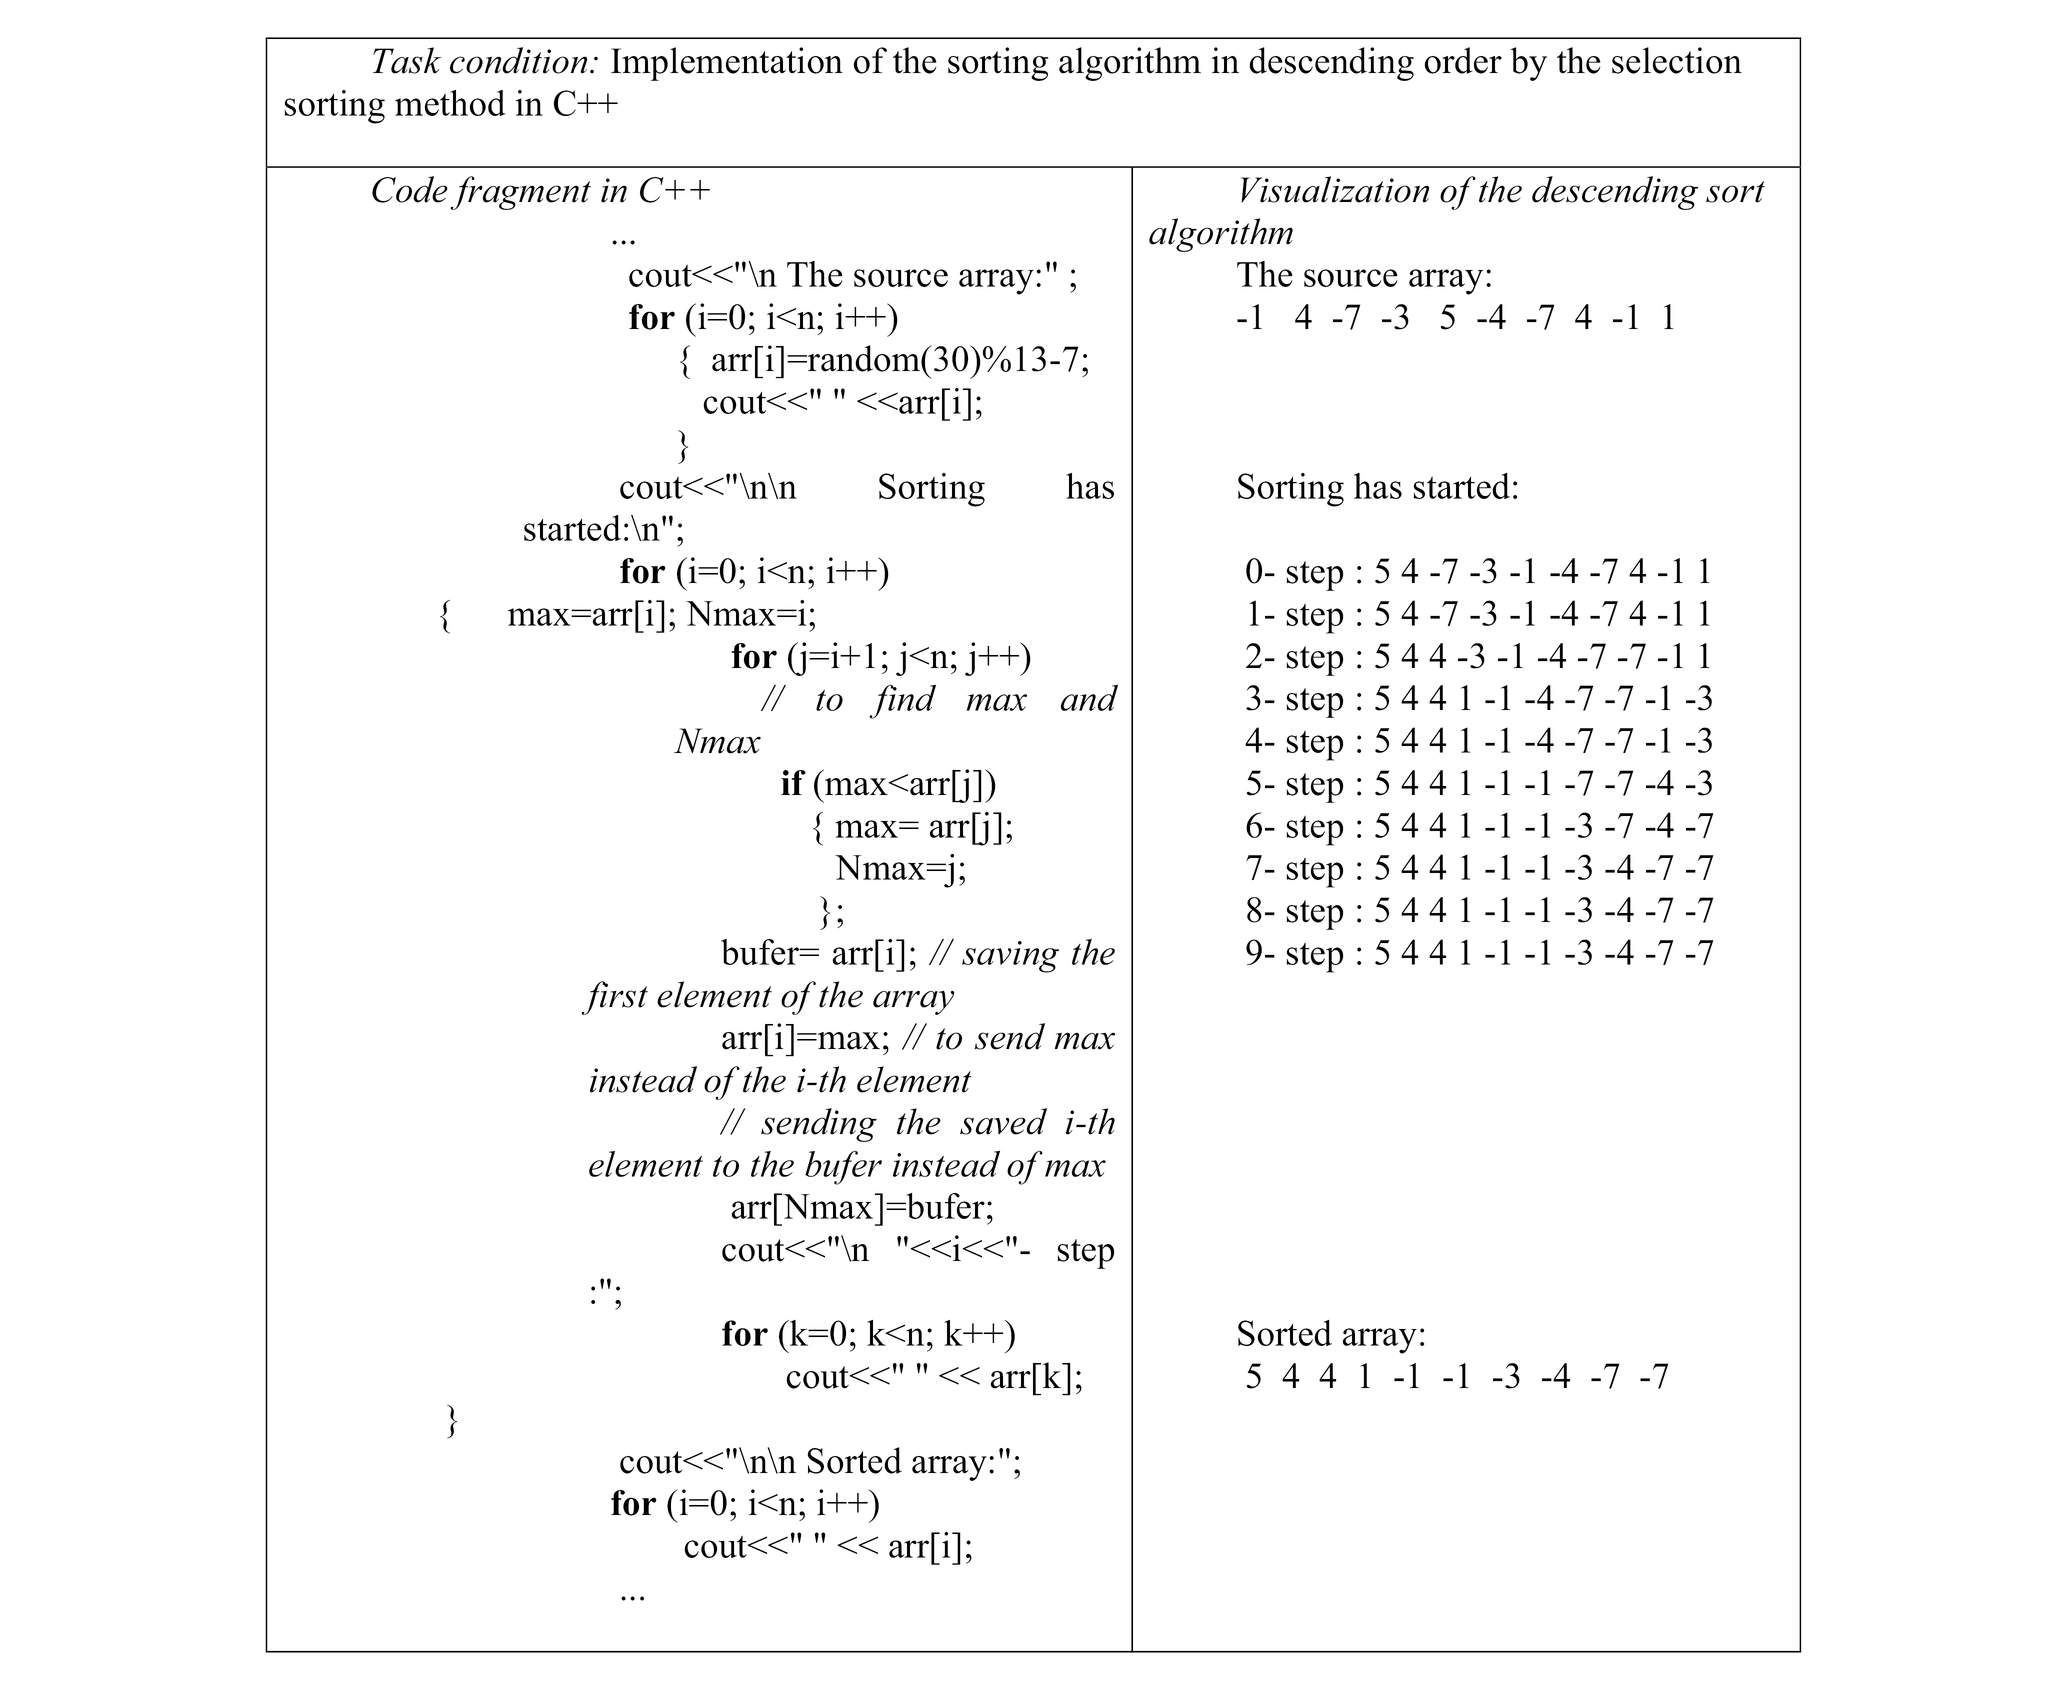
Table 1. The results of visualization of selection sorting methods when solving problems in the course “Programming in C ++.”
One of the visualization methods for learning sorting algorithms is by computer application, which visualizes the progress of sorting with animation effects (Visualization of Sorting Algorithms, 2013; Scanu et al., 2022). Animation displays the current and subsequent state of the algorithm in the form of different graphic images while accompanying it with sound. It is assumed that animation allows to better understand an inner process of the algorithm, such as moving an element in the right direction in sorting algorithms. In their study, Kerren and Stasko (2002) divide between two important aspects of algorithm visualization using animation: the connection of animation with the internal behavior of the algorithm and the visualization technique. The connection with internal behavior refers to the extent to which the animation of the algorithm credibly represents the abstractions and step-by-step operations (state) included in the content of the algorithm. In this regard, researchers of the study point to 3D animation of algorithms, auralization, and web deployment as the most promising areas in visualization technology. The studies note the positive impact of animation on understanding of sorting algorithms, however, there are also studies which state that animation application does not demonstrate a significant advantage in studying this topic (Faria, 2017). The disadvantage of this visualization is that the animation shows the movement of data but unable to explain why the movement occurs. The study maintained by Faria (2017) presents the preferences and wishes of students in the visualization of sorting algorithms. It was revealed that while visualizing sorting, students deemed it important to control the speed of animation, clearly separate sorting steps, change the color of elements when sorting conditions are maintained. The visualization with animation videos involving participation of humans demonstrates the use of play or active movement in learning sorting algorithms (Zoltán and László, 2011; Bubble Sort Dance, 2020). Perhaps this visualization approach would contribute to raise learning interest and motivation, as students would be able to independently replicate and test these movements and algorithms practically (Harvard, 2017).
Due to the widespread use of mobile technologies, mobile applications, which visually demonstrate sorting algorithms with animation effects, have emerged. These sorting apps generate a sequence of random numbers that can be sorted using touch interactions. The study by Boticki et al. (2012) note that a skillful combination of learning aims with game elements and a reward system (accumulation of points for correctly solved tasks) in mobile applications has a positive effect on motivation to study these methods independently without any teacher assistance at a convenient time for the student. The dynamic visualization with animation effects provides direct participation of students in the sorting process, which enables them to understand the implementation of the algorithm and draw conclusions about the sorting results.
The virtual reality (VR), which is one of the latest achievements in the field of digital technologies, provides completely different, new opportunities for visualizing real and abstract phenomena/processes in the form of a natural experience with the effect of immersion into a simulative environment. Rapidly developing and becoming more accessible, VR technology offers great opportunities to achieve visual experiences in both cost-effective and compelling ways. The developers draw significant attention to using holoportation and holographic techniques in VR in order to enhance the effects of reality (Park and Lee, 2022), which can initiate unprecedented opportunities for constructive visualization, as well as data visualization using VR for deeper understanding and information analysis (Lee et al., 2021). In fact, there are huge differences between the physical world and fuzzy abstract phenomena, but in the case of VR, the gap between “real” and mediated experience is getting smaller and smaller every year. “These two are not exactly alike, but VR is far more psychologically powerful than any media ever invented and poised to revolutionize our lives,” wrote (Bailenson, 2019), one of the leading experts on the use of VR in education.
The “constructive visualization” paradigm proposed by Huron et al. (2014) suggests creating an easy-to-use dynamic visualization that can interact with its components (tokens—blocks), adjust and design new visualizations. The idea of constructive visualization based on ideas of Piaget (1967) and Papert and Harel (1991) applies constructionist concepts to the design of information visualization and includes components such as token, grammar, environment, assembly model, accompanied by the processes of initialization, assembly, display, and updating of the visualization necessary for this approach. The authors of the study emphasize that one of the strengths of constructive visualization is its focus on the direct manipulation of tokens as primitives. This advantage of constructive visualization takes on a new character in learning using VR, since the high level of simulation and interaction in the VR environment allows students to feel the surrounding virtual world with various objects as in real world (Di Natale et al., 2020; Feyzi and Yasrebi, 2020). For example, the VR application “VR sorting” developed by us allows one to hold cubes with numbers in your hands, swap them in ascending or descending order. Research is increasingly showing that experiential learning with VR enhances students’ interests, motivation, and creativity (Dede, 1995; Dalgarno and Lee, 2009; Chan et al., 2011; Allcoat and Mühlenen, 2018; Huang et al., 2020; Cicek et al., 2021; Triana et al., 2021; Cassola et al., 2022; Sanzana et al., 2022; Shi et al., 2022; Yeh et al., 2022) used VR to teach dance, which recognizes movements. Learning by experience implies that new knowledge and hard skills are obtained experimentally, and first-hand acquaintance with phenomena and facts is the most viable and effective way of knowing and understanding the world. In this context, as well as in connection with the rapid spread of immersive technologies, constructive visualization may well become the leading paradigm in improving the quality and access to education.
All visualization methods (tracing, animation, and constructive VR visualization) are aimed at improving the understanding of sorting algorithms. Using the example of visualization of sorting methods, one can imagine the evolution of methods for visualizing educational material as a promising teaching method. The approaches to the visualization of sorting methods that we have considered allow us to distinguish three main types of visualization: static, dynamic, and constructive (Figure 1).
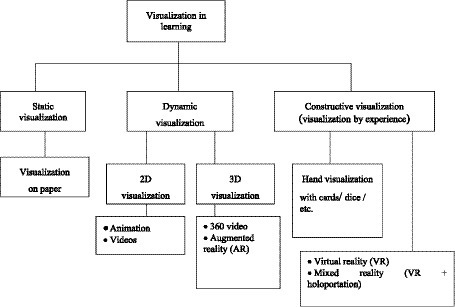
Figure 1. Evolution of the main approaches to the visualization of learning material.
The static visualization implies a visual representation of one or more completed/intermediate states of a process or object. For static visualization, paper facilities, presentations, and mockups/frameworks of objects are generally used. The visualization of step-by-step selection sorting method as C++ code is an example of static visualization of sorting algorithm (Table 1).
Dynamic visualization of learning materials for training allows learners to visually track temporal and spatial changes in processes/phenomena and objects (Rolfes et al., 2020). Widely used nowadays, 2D and 3D animated videos, 360 video and augmented reality (AR) contribute to the visualization of many processes and phenomena difficult to realize in reality (Daher and Sleem, 2021; Abdul Hanid et al., 2022; Bobrovnikov et al., 2022; Paredes-Velasco et al., 2023).
The constructive approach is used in a variety of contexts in education. In programming education, a whole stage of design (development) is devoted to assembling or constructing modules of software and verifying their consistency with one another. Some elements of constructive visualization were mentioned in earlier studies by Vygotsky (1934), Piaget (1967), Papert and Harel (1991), and Wilson (1996). With the advancement of new learning tools, constructive visualization has got reinvigorated interest. Visualization of learning with VR or full immersion in the learning environment, which allows immediate participation in the processes and interactions with objects, differs from other ways of visualization as it facilitates the acquisition of new knowledge and develops practical skills drawing on one’s own experience (Jonassen, 1991).
The outcomes of an evaluation of non-digital and digital learning games for teaching sorting algorithms presented in the studies suggest that non-digital games are more likely to focus on lower levels of learning taxonomy (remembering and understanding), while digital games with good visualization mostly get to the application level of learning process (Battistella et al., 2017). In evaluating the effectiveness of visualization, the impact of learning visualization on other types of learning activities, such as motivation, involvement and cooperation, plays a significant role (Hundhausen, 2002; Naps T. et al., 2003; Naps T. L. et al., 2003; Myller et al., 2009; Hayashia et al., 2013). The extended taxonomy by Myller et al. (2009), developed on the basis of the relationship between engagement and visualization, distinguishes the following levels of learning activities that can be an outcome of visualization exposure: No viewing, Viewing, Controlled viewing, Entering input, Responding, Changing, Modifying, Constructing, Presenting, and Reviewing. Another taxonomy developed by Ihantola et al. (2005) to evaluate the visualization of algorithms is aimed at defining various aspects of using audiovisual systems in education with less effort than the hardware and software details of the application system. The taxonomy of Ihantola et al. (2005) for evaluating the visualization of algorithms differs from learning style taxonomies in that it focuses on software rather than the learning process itself (Bloom, 1956; Kolb, 1984; Felder, 1996). These taxonomies can be applied together to deepen the understanding of which systems facilitate learning. To evaluate the effectiveness of visualization in “VR sorting,” an extended taxonomy was used, which includes components of the learning engagement taxonomy (Myller et al., 2009), the effective creation of visualization algorithms (Ihantola et al., 2005) and copyright components (Table 2).
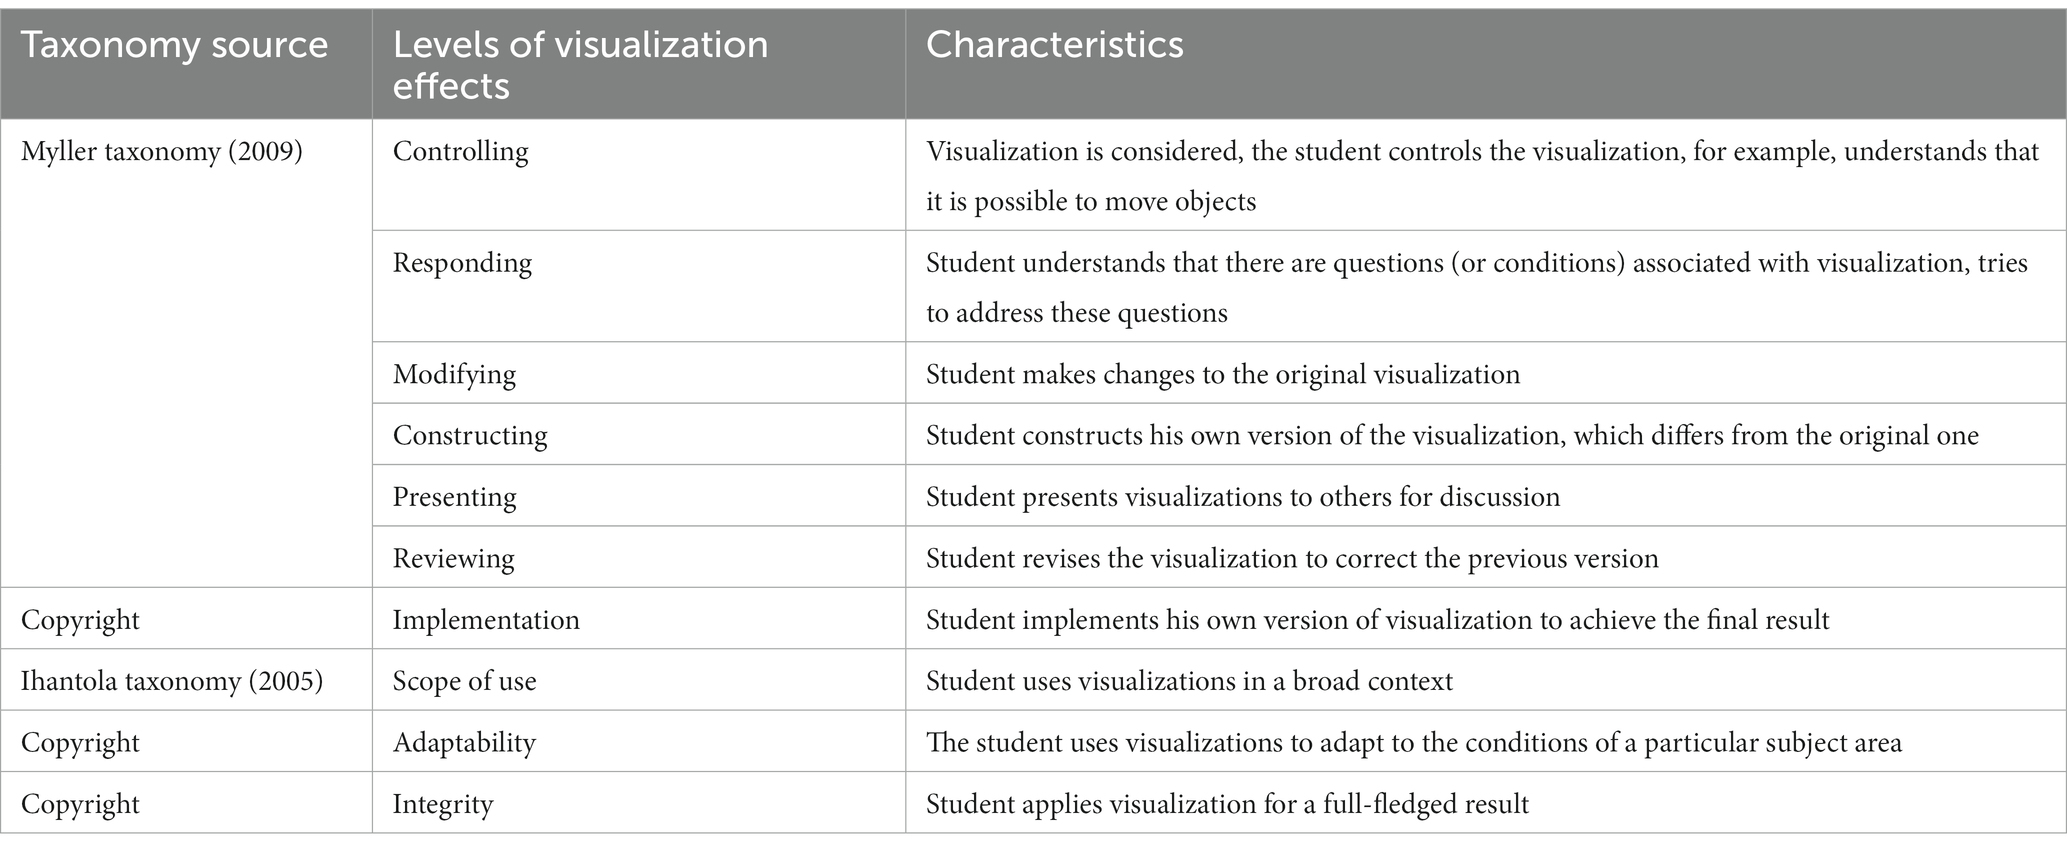
Table 2. An extended taxonomy of evaluating the effects of visualizations with VR.
The levels of visualization effects of the extended taxonomy and their characteristics in accordance with Likert scale scores were used to evaluate learning outcomes using the “VR sorting” application (Appendix 1).
As a tool, we have developed a virtual reality application—“VR sorting.” With VR sorting, students can sort the elements of a 10-element array using two methods. The bubble sorting and selection sorting methods are explained on the VR board. At the beginning of training, a menu appears on the VR board and a sorting method can be selected (Figure 2). After choosing a method, for example, selection sorting, each step of the sorting process is displayed on the board, if necessary, the review is repeated.
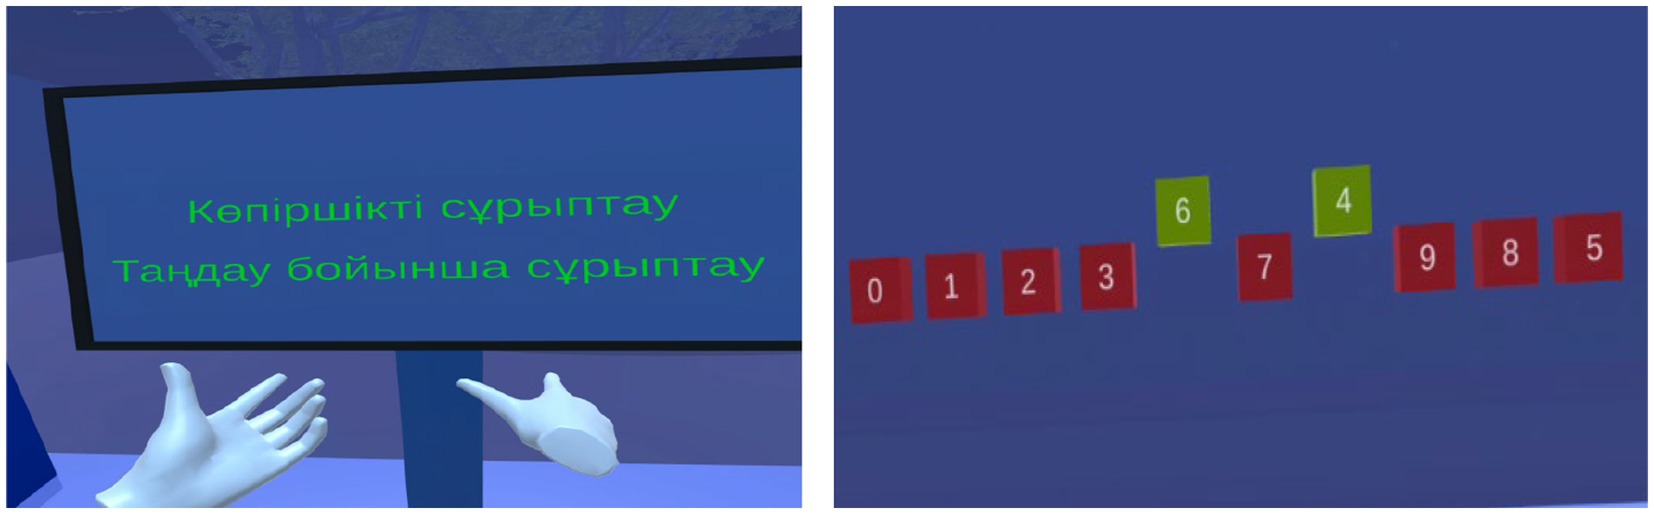
Figure 2. Selection sorting method on VR board.
Next, students can use virtual hands to sort in the virtual environment. At each step, the student can pick up the cubes with numbers with one or two hands and swap them according to the sorting condition. Manual sorting in VR can be repeated multiple times, as the execution time and the number of repetitions are chosen by the student (Figure 3). If an error occurs, the sorting process restarts.
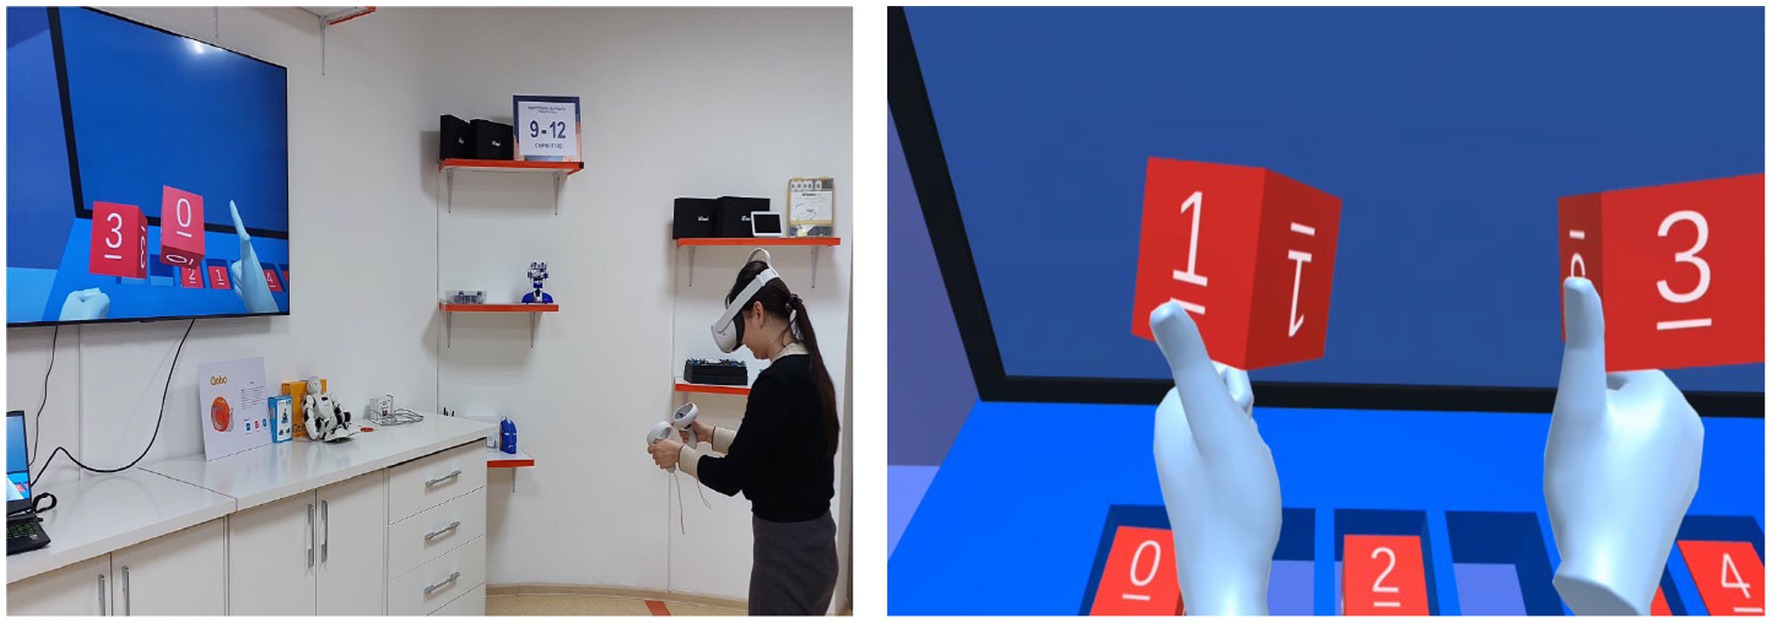
Figure 3. Sorting process.
The Oculus Quest 2 headset was used to immerse into the VR. The “VR sorting” application was developed on the Unity 3D platform using the Oculus Integration package, the Visual Studio integrated development environment, the C # programming language and 3D models. 3D models are created using Blender 3D. The finished content is saved in apk. format file and downloaded to the headset. SideQuest app and USB cable used to download content to VR headset.
To test the empirical hypothesis of the study, two groups of students were selected. To study sorting methods, the VR sorting application was used in the experimental group of 78 students, and presentations and flowcharts were used in the control group of 72 students. The participants of the study are undergraduate students of the educational program “Informatics” of one of the regional universities of Kazakhstan at the age of 17–20 years. This study was reviewed and approved by the Institutional Ethics Committee of the K. Zhubanov ARU. This is a case study of one regional university that does not apply to students at other universities. Students who participated in the research received additional points in the course “Algorithms and Data Structures” and “Programming” in the semester ranking.
To determine the level of understanding of sorting methods and appropriate application skills, five tasks were developed (Appendix 2). Decisions Task 1 and 2 define two main indicators of the study of sorting methods. The first is related to how the student understands the conditions of the bubble sorting and selection sorting methods, the second indicator is whether the student correctly fulfills this condition for each new position (shift) or the current sort element. The key condition when using bubble sorting (Task 1, item 1.1) is to swap two elements that are next to each other in the sort direction. The condition of the selection sorting method is to find the smallest element of the list and swap the current and smallest element (Task 1, p.1.2). Difference Task 2 from Task 1, the sorting steps are not in order, the student matches the serial numbers to the corresponding sorting step (Figure 4).
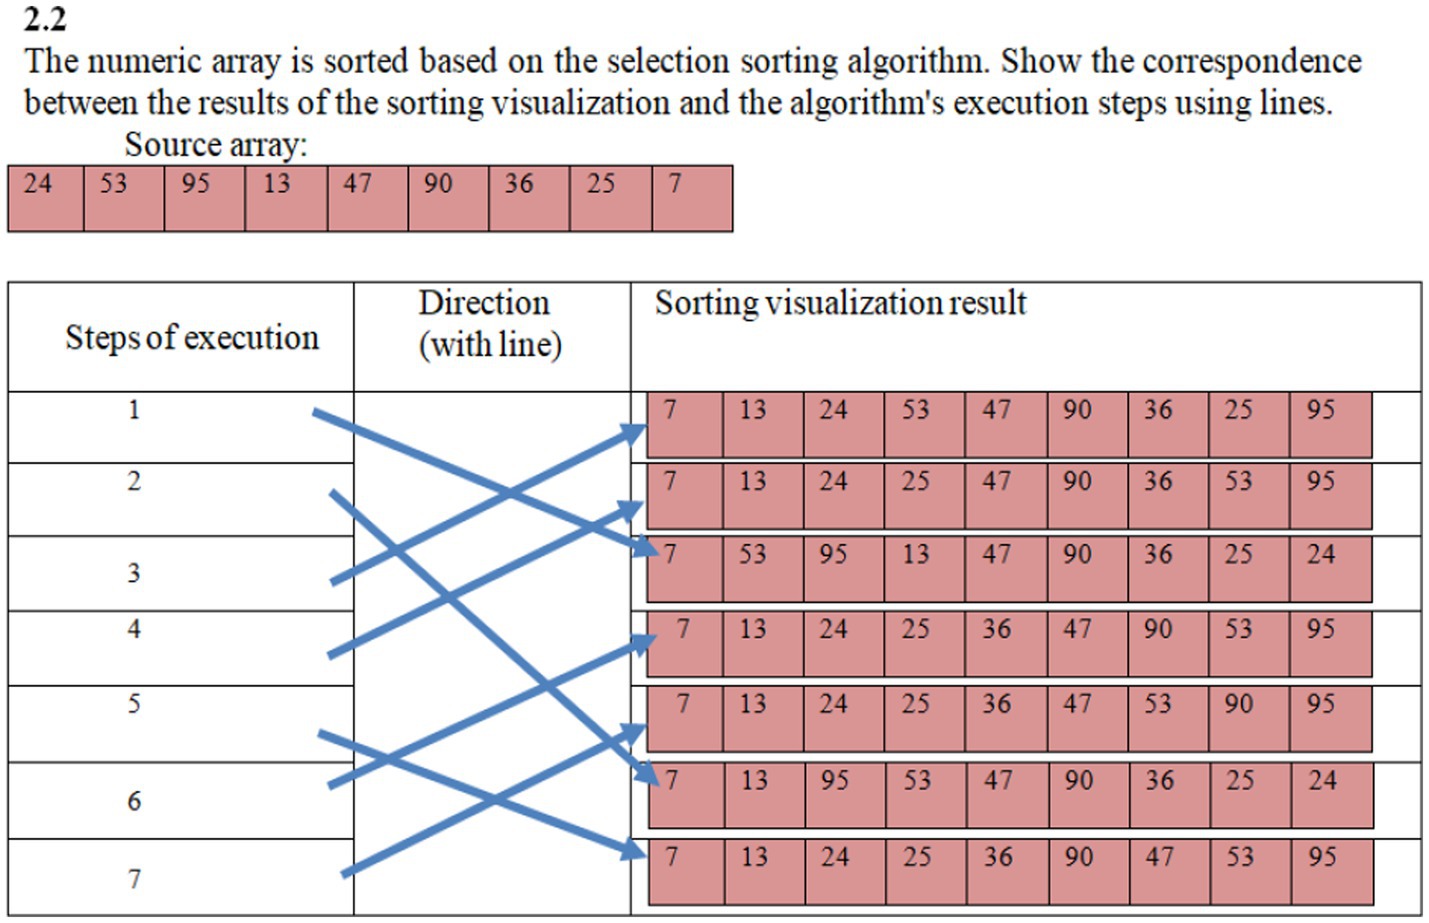
Figure 4. Example of solving Task 2.
Solutions of the following problems 3, 4, 5 (Appendix 2) also show the skills of using the learned sorting methods in practice. In particular, students completed tasks on the location of lakes, the areas of which began to change due to global climate change (In Wikipedia, 2021): sorting lakes by area size (Task 3); visual comparison to each of the lakes in the sorted list of the picture corresponding to it (Task 4); and visual matching to each of the area in the sorted list of the corresponding pattern of lakes (Task 5).
Responses were scored on a seven-point Likert scale, since it was required to define the correct responses for each sorting step. Responses on a seven-point scale are divided into four levels in accordance with the extended taxonomy of assessing the effects of visualization with VR (Table 2): “low”—1 point; “medium “—2 or 3 points; “good”—4 or 5 points; “high”—6 or 7 points (Appendix 1).
The reliability and internal consistency of the tasks we developed were tested using Cronbach’s alpha. The value α = 0.816 confirms the reliability of test items. The inter-element correlation matrix (Table 3) shows the presence of a reliable correlation between tasks 1–5.
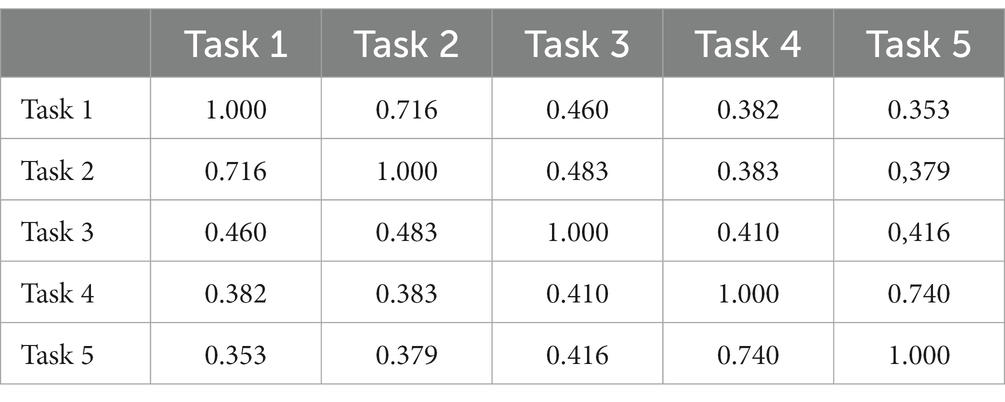
Table 3. Interelement correlation matrix according to Cronbach’s alpha.
Across all five tasks, an average score of the experimental group were higher than those of the control group (Table 4). Overall, Task 1 in the experimental group has the lowest standard deviation (M = 6.05, SD = 1.56), Task 2 in the control group has the highest standard deviation (M = 3.05, SD = 2.42).
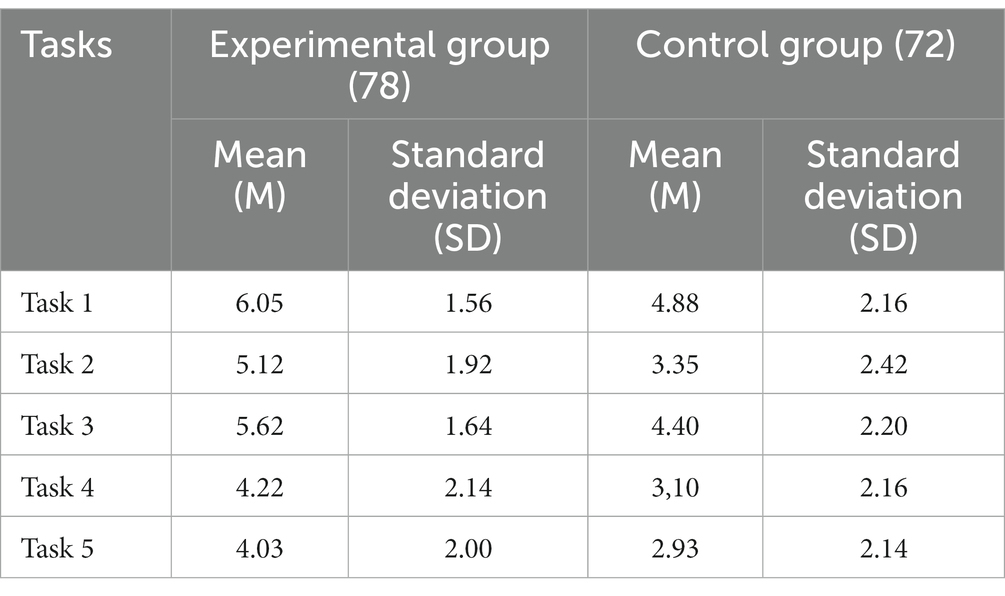
Table 4. Mean and standard deviation.
Table 5 shows the data of the experimental and control groups on the levels of educational effects of visualization. Analysis of the results of solving Task 1 and Task 2 shows that students of the experimental group who studied sorting methods using VR better understand the conditions of the bubble sorting and selection sorting methods and correctly perform sorting. Accordingly, the proportion of students in the experimental group with results that correspond to a high level of visualization effect (6–7 points) according to the solution of Task 1 was 76.9%, Task 2–51.3% (Table 5; Figure 5).
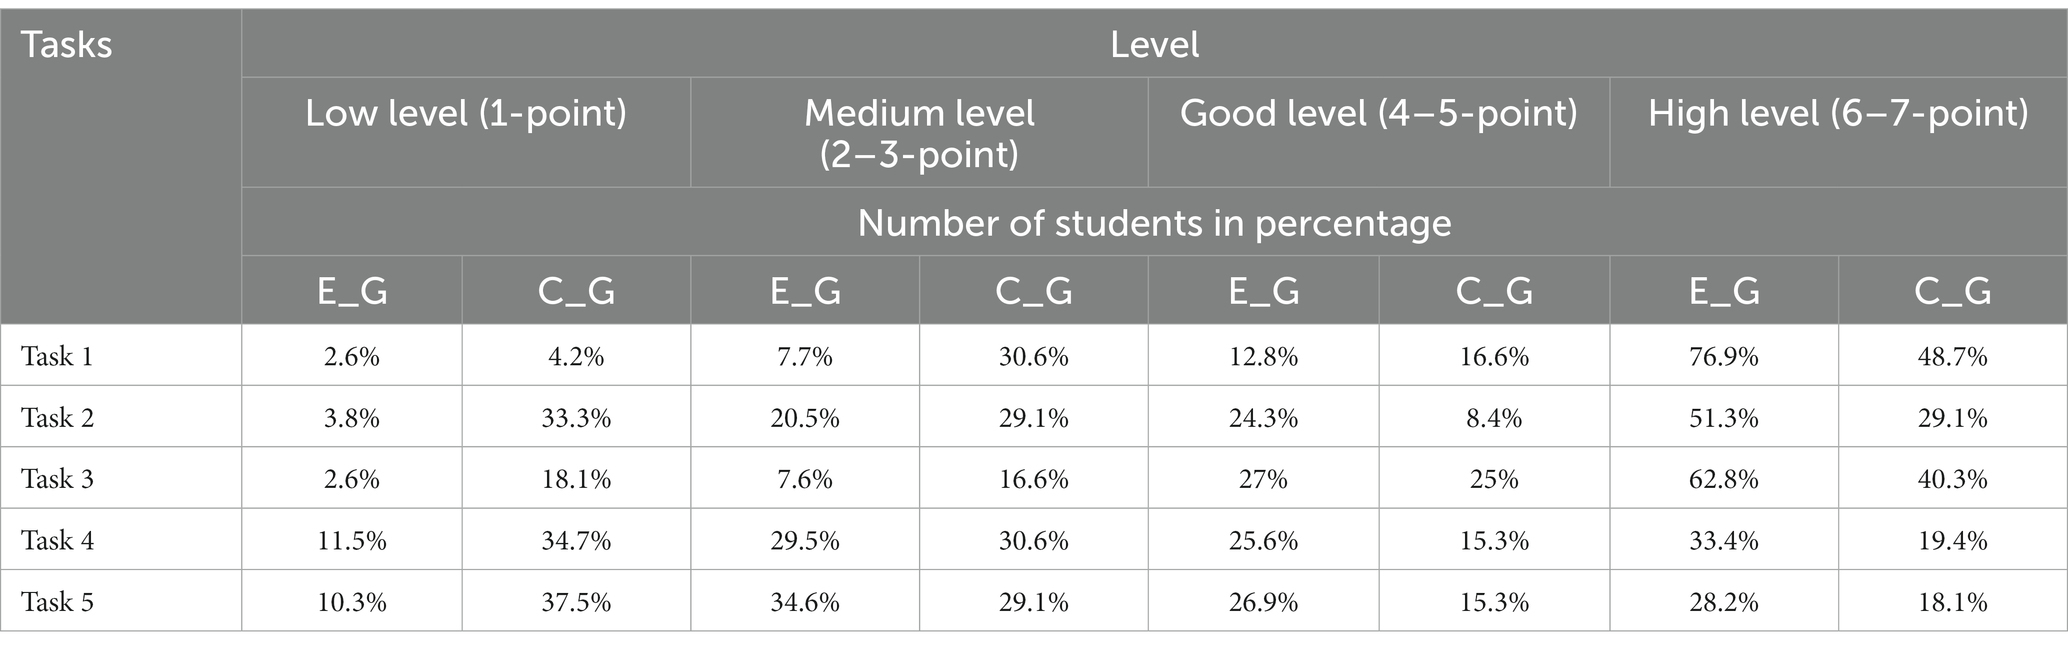
Table 5. Indicators of the experimental and control groups by levels of visualization effects (Appendix 1).
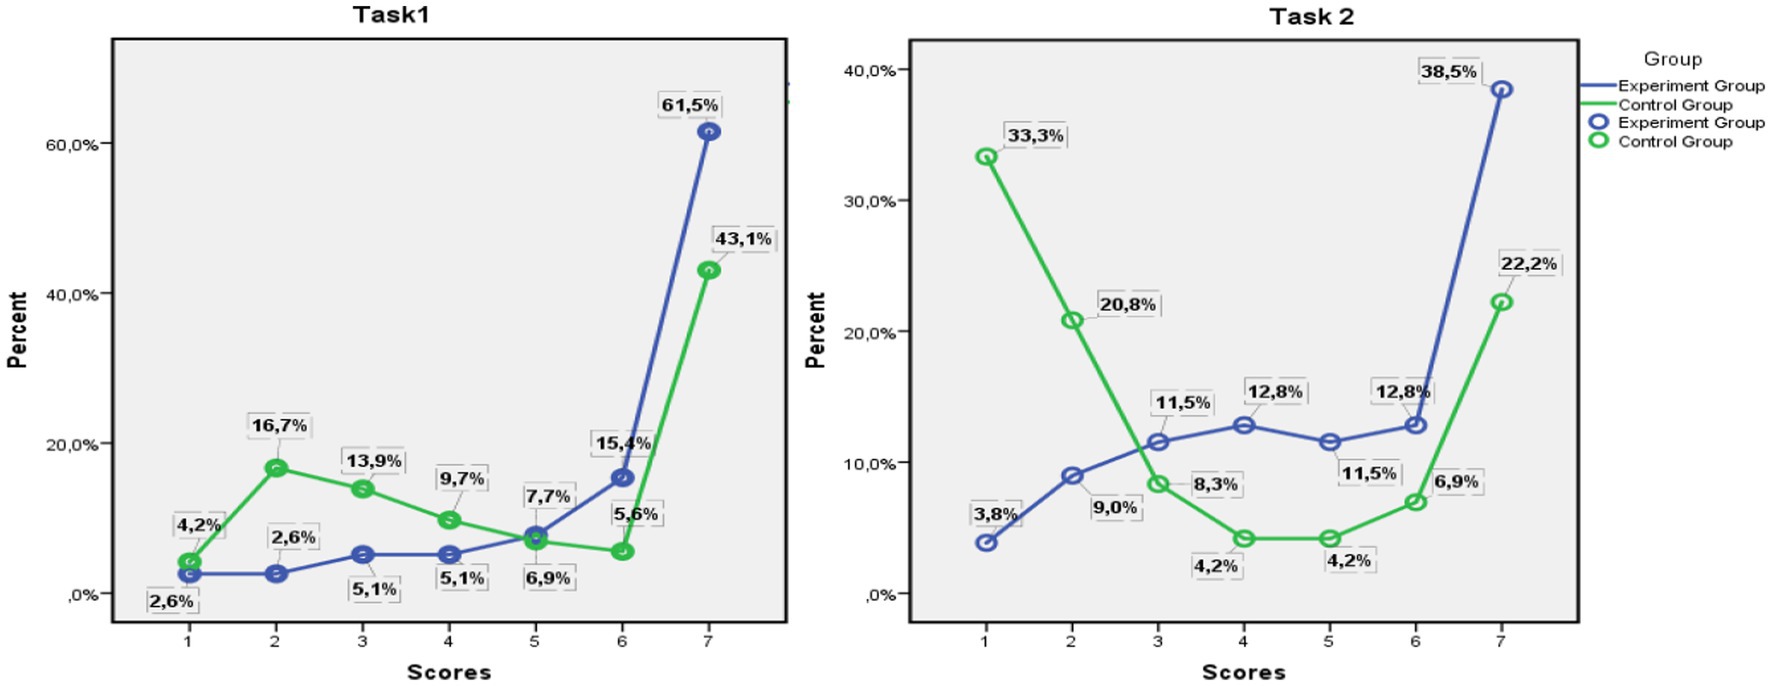
Figure 5. Results of implementation of Task 1 and Task 2.
The greatest contrast is observed in solving Task 2, as the difference in the results of students in the experimental and control groups who scored low (1 point) is 29.5%. At the same time, a significant portion of students in the control group (33.3%) had difficulty performing the sorting steps because Task 2 did not show the directions of transposition of elements according to the sorting condition, as in the answers to Task 1. In addition, students in the experimental group had the opportunity to repeatedly perform manual sorting in a highly visualized VR environment, which promoted not only a thorough understanding of the method, but also automaticity in sorting (Table 5; Figure 5).
In Task 3, the results of both groups demonstrated significant deviations in students’ responses, which correspond to low and high levels of effect visualization (Appendix 1; Table 5). In particular, the proportion of students in the experimental group, who scored 1 point in Task 3 is 2.6% while this indicator for the control group is 18.1%. The difference in responses of students in the experimental (62.8%) and control (40.3%) groups corresponding to 6–7 point (high level) was 22.5%. It is assumed that this contrast might be because of visualization on the visual attention of learners (Anderson et al., 2005; Johnson, 2013; Vecera et al., 2014). In the static visualization of sorting as a presentation, students in the control group primarily use cognitive resources to understand the abstract side of the task. In addition, visual resources are also used in parallel to compare numerical values of the data (lake area sizes). A manual analysis of the control group responses showed that, while sorting, students in the control group mostly paid attention to the first digits of a number, rather than its values.
The results for Task 4 and 5 showed that the number of students in both groups whose responses belong to the low (1 point) and medium (2–3 points) levels increased significantly (Table 5; Figure 6). Specifically, in Task 4, 41% of students in the experimental group, 65.3% in the control group scored 1–3 points. Similarly, in Task 5, 44.9% of students of the experimental group and 66.6% of students of the control group scored 1–3 points. Consequently, the proportion of students scored high (6–7 points) in Task 4 and 5 is significantly less than in the previous three tasks (Task 1–3; Table 5). This data show that students’ responses were influenced by other factors, such as knowledge from another field (e.g., geography) and the capacity to read visual information (e.g., drawings of lakes).
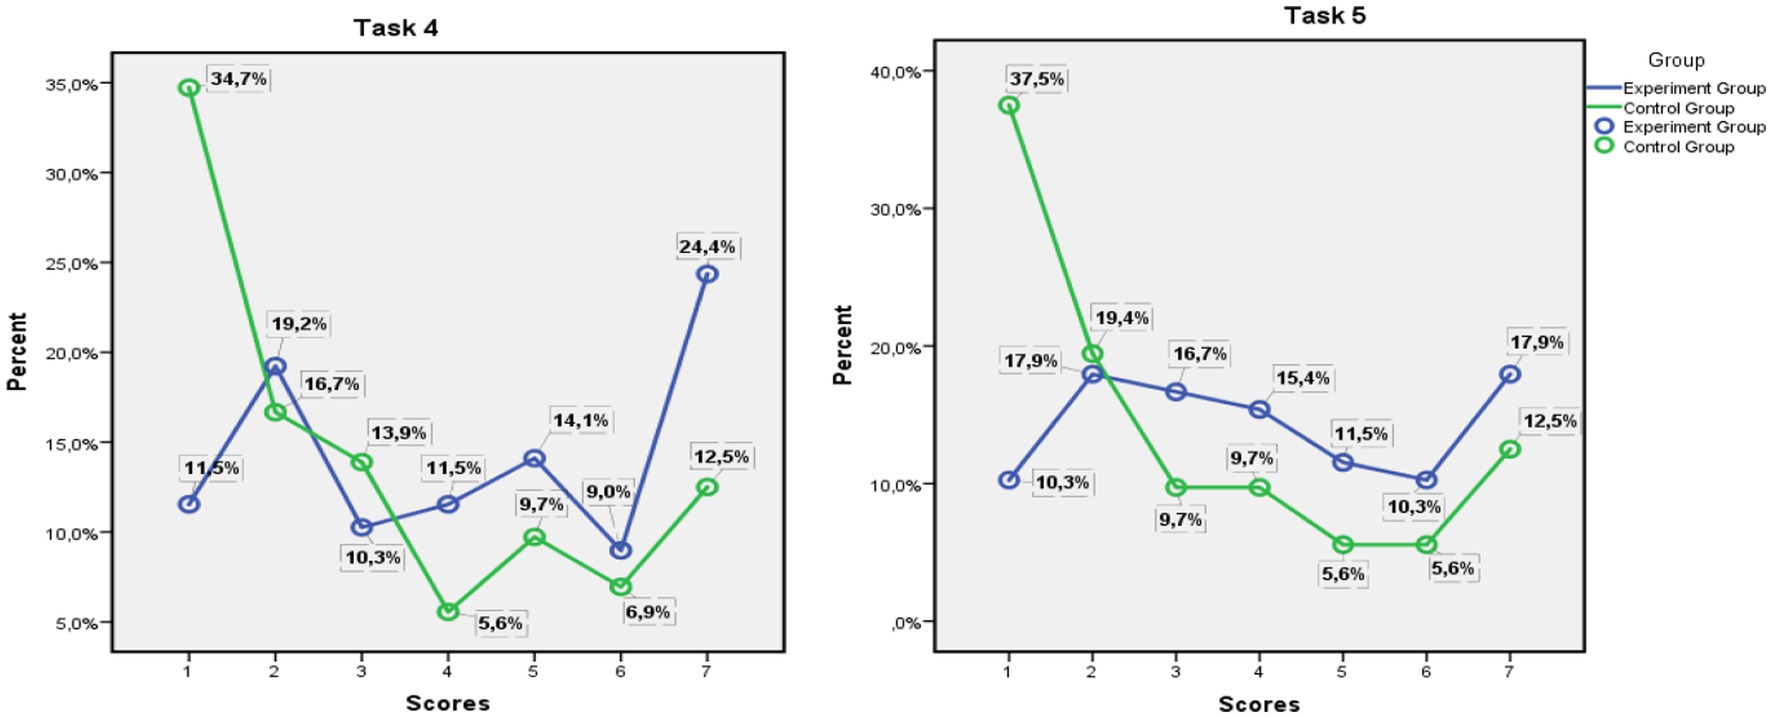
Figure 6. Results of implementation of Task 4 and Task 5.
Further, Pearson chi-square (χ2) was used to define the static values of differences in the results of the experimental and control groups, as well as to confirm the validity of the obtained results (Rusyn et al., 2021; Roša and Lobanova, 2022; Yan et al., 2023). Using Pearson’s Chi-square test (χ2) requires acceptance of one, of the two hypotheses H0 and H1.
H0: VR visualization does not improve students’ understanding of sorting methods.
Н1: A high level of visualization and direct interaction with objects in the VR environment can provide students with a better understanding of sorting methods and development of hard skills in solving practical problems.
The calculation of χ2 for each of the five tasks confirmed the following: for Task 1—χ2exp = 18.271, p = 0.006; Task 2—χ2exp = 32.351, p = 0.000; Task 3—χ2exp = 17.752, p = 0.007; Task 4—χ2exp = 14.585, p = 0.024; and Task 5—χ2exp = 17.562, p = 0.007. If the degree of freedom ν = 6, then p ≤ 0.05, χ2crit = 12.592. For the asymptotic significance of each problem for p ≤ 0.05, the condition χ2exp > χ2crit is maintained, accordingly, the null hypothesis (H0) is rejected and the alternative hypothesis (H1) is accepted for all problems.
The theoretical hypothesis of this study suggested that current trends in the educational space, new advances in technology, and other factors may have an impact on the evolution of visualization as a teaching method. Each of the three approaches to visualization of educational material we identified is directly related to specific period of time, for example, traditional paper-based visualization methods have been replaced over time by presentations, animations, and videos using various digital technologies (Figure 1). The evolution of the main approaches to visualization proposed by us is based on the analysis of various types of visualization of abstract sorting, represented by the bubble sorting and selection sorting methods. While this may represent the specific case of demonstrating the evolution of mainstream visualization approaches, the findings of a number of studies suggest that digital learning support has been increasingly initiating new approaches to visualization. In particular, Bishop and Lange (2005), Caserta and Zendra (2011), Hayek et al. (2016), Van Leeuwen et al. (2018), and Nasr-Azadani et al. (2022) noted that the combined use of effects such as 2D and 3D, 360 video and immersive VR could lead to new and more efficient ways of visualization. The prospects and emergence of new character of constructive visualization with the advent of VR has also been noted in the works of Di Natale et al. (2020), Feyzi and Yasrebi (2020), and Li et al. (2023).
One of the hard stages in pedagogical research is related to the assessment of the effects of technologies on learning (Sembayev et al., 2021). Visualization with VR provides more opportunities for learning than other types of visualization (Figure 1). Therefore, the taxonomies of Myller et al. (2009) and Ihantola et al. (2005) were expanded by including “Implementation,” “Adaptiveness,” and “Integrity” levels (Table 2). The inclusion of these levels in the assessment of visualization effects can be explained by the “constructive visualization” paradigm (Huron et al., 2014, 2016). The constructive visualization implies the active participation of the student in the visualization itself, accompanied by the processes of initialization of tokens (bricks with numbers), grammar (sorting conditions), assembly (sorting), visualization display, and updating (sorting steps) necessary for this approach. As in the taxonomy of Bloom (1956), Biggs and Collis (1982), and Bespalko (1989) and other more recent studies assessing the impact of digital technology on learning outcomes (Meyers and Nulty, 2009; Ryan, 2014; Mukasheva and Omirzakova, 2021), “Adaptability” and “Integrity” are also classified as high-level visualization effects with VR (Appendix 1).
In this study, extension of taxonomy allowed to gradually evaluate learning effects of visualization when solving 1–5 Tasks by students. Specifically, in performing the first three tasks, more than half of the students who studied sorting methods using VR showed results corresponding to a high level of visualization effects: Task 1–76.9%; Task 2–51.3%, and Task 3–62.8%. The correct definition of the sorting method and the clear performance of sorting steps without any errors by students of the experimental group demonstrate that visualization using VR contributed to a deeper understanding of sorting methods and confidently apply them in solving practical tasks. These results build on previous studies that have shown that VR helps improve student skills (Guzsvinecz et al., 2020; Li et al., 2022; Nugraha and Kosasih, 2022). However, the answers of the students of the experimental group to tasks 4–5 confirmed that in order to achieve a high level of effects that include Scope, Adaptability, Integrity, and visualization using VR for a wide range of tasks is required, rather than sorting methods. In this regard, this study aligns with the findings of the study conducted by Lee and Shvetsova (2019), which confirmed that VR contributes to developing a range of competencies.
Educators have always been attracted to the visualization of learning material since it is one of the effective teaching methods. In this regard, digital technologies have contributed to the improvement of visualization. The evolution of visualization in learning (Figure 1) mapped in this study is one of the initial attempts to interpret existing ways of visualizing learning materials. This interpretation is not ultimate since visualization as a teaching method has been continuously evolving. Hence, further research is required to expand to research areas as 2D, 3D, and VR visualization using artificial intelligence (Nisar et al., 2021; Sabir et al., 2021a,b), as well as gesture learning visualization in VR environments and its recognition prospects (Huang et al., 2017; Bayegizova et al., 2022).
In line with previous research (Dai et al., 2023; Huang et al., 2023; Wang et al., 2023), empirical results demonstrate that VR allows to create a multifunctional training environment with high visualization and interactivity and helps to visually present the learning materials with abstract content and processes/phenomena. Moreover, the results of the study confirmed that a high level of visualization and direct action with the operated objects in the VR environment have a significant impact on students’ understanding of abstract concepts and processes such as sorting methods and contribute to acquisition of practical skills. The extended taxonomy used in this study (Appendix 1) allowed to evaluate the impact of visualization effects in VR on students’ knowledge and practice skills. The future research might develop criteria and characterize the levels of influence of the effects of visualization in VR on the cognitive abilities of learners.
The original contributions presented in the study are included in the article/Supplementary material, further inquiries can be directed to the corresponding author.
The studies involving human participants were reviewed and approved by K. Zhubanov Aktobe regional university. Written informed consent from the participants’ legal guardian/next of kin was not required to participate in this study in accordance with the national legislation and the institutional requirements. Written informed consent was obtained from the individual(s) for the publication of any potentially identifiable images or data included in this article.
MM and ZK contributed to the concept and design of the study. MM wrote the methodology. ZK has developed the software and conducted statistical analysis and data processing. MM, ZK, and NP wrote separate sections of the manuscript. All authors contributed to the article and approved the submitted version.
This research has funded by the Science Committee of the Ministry of Education and Science of the Republic of Kazakhstan (Grant No. АР14870741).
The authors declare that the research was conducted in the absence of any commercial or financial relationships that could be construed as a potential conflict of interest.
All claims expressed in this article are solely those of the authors and do not necessarily represent those of their affiliated organizations, or those of the publisher, the editors and the reviewers. Any product that may be evaluated in this article, or claim that may be made by its manufacturer, is not guaranteed or endorsed by the publisher.
The Supplementary material for this article can be found online at: https://www.frontiersin.org/articles/10.3389/feduc.2023.1195200/full#supplementary-material
Abdul Hanid, M., Mohamad Said, M., Yahaya, N., and Abdullah, Z. (2022). Effects of augmented reality application integration with computational thinking in geometry topics. Educ. Inf. Technol. 27, 9485–9521. doi: 10.1007/s10639-022-10994-w
Allcoat, D., and Mühlenen, A. (2018). Learning in virtual reality: effects on performance, emotion and engagement. Res. Learn. Technol. 26, 2140–2150. doi: 10.25304/rlt.v26.2140
Anderson, C. H., Van Essen, D. C., and Olshausen, B. A. (2005). Directed visual attention and the dynamic control of information flow. Neurobiol. Attent. 11–17. doi: 10.1016/B978-012375731-9/50007-0
Bailenson, J. (2019). Experience on demand: what virtual reality is, how it works, and what it can do. Available at: https://stanfordvr.com/pubs/2018/experience-on-demand-what-virtual-reality-is-how-it-works-and-what-it-can-do/
Battistella, P. E., Wangenheim, C. G., Wangenheim, A., and Martina, J. E. (2017). Design and large-scale evaluation of educational games for teaching sorting algorithms. Inform. Educ. 16, 141–164. doi: 10.15388/infedu.2017.08
Bayegizova, A., Murzabekova, G., Ismailova, A., Aitimova, U., Mukhanova, A., Beldeubayeva, Z., et al. (2022). Effectiveness of the use of algorithms and methods of artificial Technologies for Sign Language Recognition for people with disabilities. East. Eur. J. Enterp. Technol. 4, 25–31. doi: 10.15587/1729-4061.2022.262509
Bernát, P. (2014). The methods and goals of teaching sorting algorithms in public education. Acta Didact. Napocensia 7, 1–9.
Bespalko, V. P. (1989). Slagaemye Pedagogicheskoj Tehnologii [Components of Pedagogical Technology]. Moskow, Russia: Pedagogika
Biggs, J. B., and Collis, K. F (1982). Evaluating the Quality of Learning: The Solo Taxonomy. New York: Taxonomy Academic Press
Bishop, I. D., and Lange, E. (2005). Visualization in landscape and environmental planning: technology and applications. London: Taylor & Francis. 320.
Bloom, B. S. (1956). Taxonomy of educational objectives, handbook 1: cognitive domain. Addison Wesley. Available at: https://eclass.uoa.gr/modules/document/file.php/PPP242/Benjamin%20S.%20Bloom%20-%20Taxonomy%20of%20Educational%20Objectives%2C%20Handbook%201_%20Cognitive%20Domain-Addison%20Wesley%20Publishing%20Company%20%281956%29.pdf
Bobrovnikov, M., Chai, J. T., and Dinov, I. D. (2022). Interactive visualization and computation of 2D and 3D probability distributions. SN Comput. Sci. 3, 1–42. doi: 10.1007/s42979-022-01206-w
Boticki, I., Barisic, A., Martin, S., and Drljevic, N. (2012). Teaching and learning computer science sorting algorithms with Mobile devices: a case study. Comput. Appl. Eng. Educ. 21, E41–E50. doi: 10.1002/cae.21561
Bubble Sort Dance Informatika Unpas (2020). Available at: https://www.youtube.com/watch?v=14La4BKNoqc
Caserta, P., and Zendra, O. (2011). Visualization of the static aspects of software: a survey. IEEE Trans. Vis. Comput. Graph. 17, 913–933. doi: 10.1109/TVCG.2010.110
Cassola, F., Mendes, D., Pinto, M., Morgado, L., Costa, S., and Anjos, L. (2022). Design and evaluation of a choreography-based virtual reality authoring tool for experiential learning in industrial training. IEEE Trans. Learn. Technol. 15, 526–539. doi: 10.1109/TLT.2022.3157065
Chan, J. C. P., Leung, H., Tang, J. K. T., and Komura, T. (2011). A virtual reality dance training system using motion capture technology. IEEE Trans. Learn. Technol. 4, 187–195. doi: 10.1109/TLT.2010.27
Cicek, I., Bernik, A., and Tomicic, I. (2021). Student thoughts on virtual reality in higher education—a survey questionnaire. Inform 12, 1–10. doi: 10.3390/info12040151
Daher, W., and Sleem, H. (2021). Middle school students’ learning of social studies in the video and 360-degree videos contexts. IEEE Access 9, 78774–78783. doi: 10.1109/ACCESS.2021.3083924
Dai, C.-P., Ke, F., Dai, Z., and Pachman, M. (2023). Improving teaching practices via virtual reality-supported simulation-based learning: scenario design and the duration of implementation. Br. J. Educ. Technol. 54, 836–856. doi: 10.1111/bjet.13296
Dalgarno, B., and Lee, M. J. (2009). What are the learning affordances of 3-D virtual environments? Br. J. Educ. Technol. 41, 10–32. doi: 10.1111/j.1467-8535.2009.01038.x
Dede, C. (1995). The evolution of constructivist learning environments: immersion in distributed, virtual worlds. Educ. Technol. 35, 46–52.
Di Natale, A. F., Repetto, C., Riva, G., and Villani, D. (2020). Immersive virtual reality in K-12 and higher education: a 10-year systematic review of empirical research. Br. J. Educ. Technol. 51, 2006–2033. doi: 10.1111/bjet.13030
Faria, B. (2017). “Visualizing sorting algorithms.” Rhode Island College, Computer Science. Available at: https://digitalcommons.ric.edu/cgi/viewcontent.cgi?article=1129&context=honors_projects
Feyzi, B. R., and Yasrebi, S. (2020). An examination of constructivist educational technologies: key affordances and conditions. Br. J. Educ. Technol. 51, 1907–1919. doi: 10.1111/bjet.13036
Guzsvinecz, T., Orbán-Mihálykó, É., Perge, E., and Sik-Lányi, C. (2020). Analyzing the spatial skills of university students with a virtual reality application using a desktop display and the gear VR. Acta Polytech. Hungar. 17, 35–56. doi: 10.12700/APH.17.2.2020.2.3
Harvard CS50. Quick sorting. (2017). Available at: https://www.youtube.com/watch?v=4s-aG6yGGLU
Hayashia, Y., Ogawaa, Y., and Nakanoa, Y. I. (2013). Visualization system for analyzing collaborative learning interaction. Proc. Comput. Sci. 22, 1379–1387. doi: 10.1016/j.procs.2013.09.227
Hayek, U. W., Waltisberg, D., Philipp, N., and Grêt-Regamey, A. (2016). Exploring issues of immersive virtual landscapes for the support of participatory spatial planning support. J. Digit. Landscape Architect. 1, 100–108. doi: 10.14627/537612012
Huang, C.-Y., Cheng, B.-Y., Lou, S.-J., and Chung, C.-C. (2023). Design and effectiveness evaluation of a smart greenhouse virtual reality curriculum based on STEAM education. Sustain. For. 15:7928. doi: 10.3390/su15107928
Huang, YJ, Fujiwara, T, Lin, YX, Lin, W-C, and Ma, KL. (2017). A Gesture System for Graph Visualization in Virtual Reality Environments. Seoul, Korea: IEEE Computer Society.
Huang, W., Roscoe, R. D., Johnson-Glenberg, M. C., and Craig, S. D. (2020). Motivation, engagement, and performance across multiple virtual reality sessions and levels of immersion. J. Comput. Assist. Learn. 37, 745–758. doi: 10.1111/jcal.12520
Hundhausen, C. D. (2002). Integrating algorithm visualization technology into an undergraduate algorithms course: ethnographic studies of a social constructivist approach. Comput. Educ. 39, 237–260. doi: 10.1016/S0360-1315(02)00044-1
Huron, S., Carpendale, S., Thudt, A., Tang, A., and Mauerer, M. (2014). “Constructive visualization” in Proceedings of the 14th International Symposium on Visual Information Communication and Interaction. 433–42.
Huron, S., Thudt, A., Aseniero, B.A., Tang, T., and Carpendale, Sh. (2016). “Constructive visualization: A new paradigm to empower people to author visualization.” Computer Science. Available at: http://hcitang.org/papers/2016-surfnet-constructive-visualization.pdf
Ihantola, P., Karavirta, V., Korhonen, A., and Nikander, (2005). “Taxonomy of effortless creation of algorithm visualizations” in Proceedings of the 2005 international workshop on computing education research-ICER‘05.
In Wikipedia (2021). “List of the Largest Lakes by area.” Available at: https://ru.wikipedia.org/wiki/%D0%A1%D0%BF%D0%B8%D1%81%D0%BE%D0%BA_%D0%BA%D1%80%D1%83%D0%BF%D0%BD%D0%B5%D0%B9%D1%88%D0%B8%D1%85_%D0%BF%D0%BE_%D0%BF%D0%BB%D0%BE%D1%89%D0%B0%D0%B4%D0%B8_%D0%BE%D0%B7%D1%91%D1%80
Johnson, S. P. (2013). Development of the visual system. Neural Circuit Dev. Function Brain 249–269. doi: 10.1016/B978-0-12-397267-5.00033-9
Kerren, A., and Stasko, J. T. (2002). Algorithm animation. Software visualization. Lecture notes in computer science, software visualization. Lect. Notes Comput. Sci 2269, 1–15. doi: 10.1007/3-540-45875-1_1
Kolb, D. A. (1984). Experiential Learning: Experience as the Source of Learning and Development. New Jersey: Prentice-Hall Inc.
Lee, B., Brown, D., Lee, B., Hurter, C., Drucker, S., and Dwyer, T. (2021). Data Visceralization: enabling deeper understanding of data using virtual reality. IEEE Trans. Vis. Comput. Graph. 27, 1095–1105. doi: 10.1109/tvcg.2020.3030435
Lee, J. H., and Shvetsova, O. A. (2019). The impact of VR application on Student’s competency development: a comparative study of regular and VR engineering classes with similar competency scopes. Sustain. For. 11:2221. doi: 10.3390/su11082221
Li, P., Fang, P., and Jiang, T. (2022). Research into improved distance learning using VR technology. Front. Educ. 7:757874. doi: 10.3389/feduc.2022.757874
Li, W., Xiaolin, L., Qifei, Z., Bin, Z., and Ben, W. (2023). VR-enhanced cognitive learning: method, framework, and application. Appl. Sci. 13:4756. doi: 10.3390/app13084756
Lim, W. H., Cai, Y., Yao, D., and Cao, Q. (2022). “Visualize and learn sorting algorithms in data structure subject in a game-based learning.” in 2022 IEEE International Symposium on Mixed and Augmented Reality Adjunct (ISMAR-Adjunct), Singapore, 384–388.
Meyers, N. M., and Nulty, D. D. (2009). How to use (five) curriculum design principles to align authentic learning environments, assessment, students’ approaches to thinking and learning outcomes. Assess. Eval. High. Educ. 34, 565–577. doi: 10.1080/02602930802226502
Mukasheva, M. (2013). Programming. C++ Builder 6. Astana: Foliant. Available at: https://www.foliantbooks.com/product/programmalau-c-builder-6-mukasheva-m
Mukasheva, M., and Omirzakova, A. (2021). Computational thinking assessment at primary School in the Context of learning programming. World J. Educ. Technol. 13, 336–353. doi: 10.18844/wjet.v13i3.5918
Myller, N., Bednarik, R., Sutinen, E., and Ben-Ari, M. (2009). Extending the engagement taxonomy. ACM Trans. Comput. Educ. 9, 1–27. doi: 10.1145/1513593.1513600
Naps, T., Cooper, S., Koldehofe, B., Leska, C., Rößling, G., Dann, W., et al. (2003). Evaluating the educational impact of visualization. ACM SIGCSE Bull. 35, 124–136. doi: 10.1145/960492.960540
Naps, T. L., Rößling, G., Almstrum, V., Dann, W., Fleischer, R., Hundhausen, C., et al. (2003). Exploring the role of visualization and engagement in computer science education. ACM SIGCSE Bull. 35, 131–152. doi: 10.1145/960568.782998
Nasr-Azadani, E., Wardrop, D., and Brooks, R. (2022). Is the rapid development of visualization techniques enhancing the quality of public participation in natural resource policy and management? A systematic review. Landsc. Urban Plan. 228:104586. doi: 10.1016/j.landurbplan.2022.104586
Nisar, K., Sabir, Z., M.A. Zahoor Raja, Ibrahim, A. A., Erdogan, F., Haque, M. R., et al. (2021). Design of Morlet Wavelet Neural Network for solving a class of singular pantograph nonlinear differential models. IEEE Access 9, 77845–77862. doi: 10.1109/ACCESS.2021.3072952
Nugraha, I. G. D., and Kosasih, D. (2022). Evaluation of computer engineering practicum based-on virtual reality application. Evergreen 9, 156–162. doi: 10.5109/4774234
Papert, S., and Harel, I. (1991). Situating constructionism. chapter 1. Norwood: Ablex Publishing Corporation.
Paredes-Velasco, M., Velázquez-Iturbide, J. Á., and Gómez-Ríos, M. (2023). Augmented reality with algorithm animation and their effect on students’ emotions. Multimed. Tools Appl. 82, 11819–11845. doi: 10.1007/s11042-022-13679-1
Park, J.-H., and Lee, B. (2022). Holographic techniques for augmented reality and virtual reality near-eye displays. Light Adv Manufact. 3, 137–150. doi: 10.37188/lam.2022.009
Patil, A. B., Khadse, A., Wankhade, S., Chake, S., and Arora, A. S. (2022). AR-based algorithm visualizer. Int. Res. J. Modern. Eng. Technol. Sci. 4, 4671–4678.
Piaget, J. (1967). Le Langage et La Pensée Du Point de Vue Génétique. Six Études de Psychologie. Paris: Denoël Gonthier
Rolfes, T., Roth, J., and Schnotz, W. (2020). Learning the concept of function with dynamic visualizations. Front. Psychol. 11:693. doi: 10.3389/fpsyg.2020.00693
Roša, A., and Lobanova, L. (2022). Ethical responsibility of a company in the context of digital transformation of work: conceptual model. Sustain. For. 14:11365. doi: 10.3390/su141811365
Rusyn, H. A., Stynska, V. V., Matsuk, L. O., Korostelova, Y. Y., and Stetsyk, S. P. (2021). Efficiency of the project method in the development of professional competencies in future teachers. Rev. Univ. Zulia 12, 303–321. doi: 10.46925//rdluz.35.18
Ryan, M. (2014). Framing student evaluations of university learning and teaching: discursive strategies and textual outcomes. Assess. Eval. High. Educ. 40, 1142–1158. doi: 10.1080/02602938.2014.974503
Sabir, Z., Nisar, K., M. A. Z. Raja, Ibrahim, A. A. B. A., Rodrigues, J. J. P. C., al-Basyouni, K. S., et al. (2021a). Heuristic computational Design of Morlet Wavelet for solving the higher order singular nonlinear differential equations. Alex. Eng. J. 60, 5935–5947. doi: 10.1016/j.aej.2021.04.001
Sabir, Z., Raja, M. A. Z., and Baleanu, D. (2021b). Fractional Mayer neuro-swarm heuristic solver for multi-fractional order doubly singular model based on lane-Emden equation. Fractals 29:2140017. doi: 10.1142/S0218348X2140017X
Sanzana, M. R., Abdulrazic, M. O. M., Wong, J. Y., Ng, K. H., and Ghazy, S. (2022). Lecture-based, virtual reality game-based and their combination: which is better for higher education? J. Appl. Res. High. Educ. 14, 1286–1302. doi: 10.1108/JARHE-09-2020-0302
Scanu, D., Tovoli, T., and Larsson, O. E. (2022). “Sort visualize.” Available at: https://www.sortvisualizer.com/bubblesort/
Sembayev, T., Nurbekova, Z., and Abildinova, G. (2021). The applicability of augmented reality technologies for evaluating learning activities. Int. J. Emerg. Technol. Learn. 16, 189–207. doi: 10.3991/ijet.v16i22.22987
Shi, A., Wang, Y., and Ding, N. (2022). The effect of game–based immersive virtual reality learning environment on learning outcomes: designing an intrinsic integrated educational game for pre–class learning. Interact. Learn. Environ. 30, 721–734. doi: 10.1080/10494820.2019.1681467
Triana, R., Ir, T., and Alam, N. (2021). The effect of virtual reality on learning outcomes mediated by interaction and learning experiences. Turkish J. Comput. Math. Educ. 12, 3743–3753.
Van Leeuwen, J. P., Hermans, K., Jylhä, A., Quanjer, A. J., and Nijman, H. (2018). Effectiveness of Virtual Reality in Participatory Urban Planning, vol. 128–36. New York: Association for Computing Machinery.
Vecera, S. P., Cosman, J. D., Vatterott, D. B., and Roper, Z. J. J. (2014). The control of visual attention: toward a unified account. Psychol. Learn. Motiv. 60, 303–347. doi: 10.1016/B978-0-12-800090-8.00008-1
Visualization of Sorting Algorithms (2013). Available at: https://www.youtube.com/watch?v=Gnp8G1_kO3I (Accessed April 11, 2022)
Vygotsky, L. S. (1934). Myshlenie i Rech. Psihologicheskie Issledovanija. Moskva—Leningrad, Russia: Gosudarstvennoe socialno jekonmicheskoe izdatelstvo. Available at: https://www.marxists.org/russkij/vygotsky/1934/thinking-speech.pdf
Wang, X., Young, G. W., Plechatá, A., Mc Guckin, C., and Makransky, G. (2023). Utilizing virtual reality to assist social competence education and social support for children from under-represented backgrounds. Comput. Educ. 201:104815. doi: 10.1016/j.compedu.2023.104815
Wilson, B. G. (1996). Constructivist Learning Environments: Case Studies in Instructional Design. Englewood Cliffs, New Jersey: Educational Technology.
Yan, T. D., Yuan, P. H., Saha, T., Lebel, K., Spalluto, L., and Yong-Hing, C. J. (2023). Female authorship trends among articles about artificial intelligence in north American radiology journals. Can. Assoc. Radiol. J. 74, 264–271. doi: 10.1177/08465371221122637
Yeh, H., Tseng, S., and Heng, L. (2022). Enhancing EFL students’ intracultural learning through virtual reality. Interact. Learn. Environ. 30, 1609–1618. doi: 10.1080/10494820.2020.1734625
Zoltán, K., and László, T. (2011). Bubble-Sort with Hungarian (“Csángó”) folk dance. Tirgu Mures (Marosvásárhely), Romania: Created at Sapientia University. Available at: https://www.youtube.com/watch?v=lyZQPjUT5B4
Keywords: visualization, sorting methods, virtual reality, constructive visualization, bubble sorting, selection sorting
Citation: Mukasheva M, Kalkabayeva Z and Pussyrmanov N (2023) Visualization of sorting algorithms in the virtual reality environment. Front. Educ. 8:1195200. doi: 10.3389/feduc.2023.1195200
Edited by:
Gulmira Abildinova, L.N. Gumilyov Eurasian National University, KazakhstanReviewed by:
Lili Abdullah, Putra Malaysia University, MalaysiaCopyright © 2023 Mukasheva, Kalkabayeva and Pussyrmanov. This is an open-access article distributed under the terms of the Creative Commons Attribution License (CC BY). The use, distribution or reproduction in other forums is permitted, provided the original author(s) and the copyright owner(s) are credited and that the original publication in this journal is cited, in accordance with accepted academic practice. No use, distribution or reproduction is permitted which does not comply with these terms.
*Correspondence: Zukhra Kalkabayeva, a2Fsa2FiYXlldmEuekBnbWFpbC5jb20=
Disclaimer: All claims expressed in this article are solely those of the authors and do not necessarily represent those of their affiliated organizations, or those of the publisher, the editors and the reviewers. Any product that may be evaluated in this article or claim that may be made by its manufacturer is not guaranteed or endorsed by the publisher.
Research integrity at Frontiers
Learn more about the work of our research integrity team to safeguard the quality of each article we publish.