
94% of researchers rate our articles as excellent or good
Learn more about the work of our research integrity team to safeguard the quality of each article we publish.
Find out more
ORIGINAL RESEARCH article
Front. Educ., 19 May 2023
Sec. Assessment, Testing and Applied Measurement
Volume 8 - 2023 | https://doi.org/10.3389/feduc.2023.1186535
This study aimed to investigate the perspectives of Jordanian university students toward the pass/fail grading system (PFGS) that was used during the COVID-19 pandemic. To achieve this goal, a questionnaire was prepared, consisting of 37 items in its final form; divided into four subscales: advantages, drawbacks of (PFGS), the reasons for its use by students, and their attitudes toward it. This questionnaire was applied to a sample of 6,404 male and female students from four Jordanian universities: Al al-Bayt University, Balqa Applied University, The Hashemite University, and The University of Jordan. Out of the 6,404 responses, we rejected 263 responses due to careless survey filling and/or incomplete answers. The results revealed that most students were satisfied with applying the PFGS to all courses, especially among the freshmen. They believed that the PFGS was the best choice for grading due to online exams and full distance learning lectures. The results showed significant differences at α = 0.05 in how students evaluated the PFGS; namely: its advantages, drawbacks, reasons, and their attitudes toward it, based on participants’ gender, school, and academic level. As for the relationship between GPA and students’ perspectives on the PFGS, it was clear that the correlation coefficients indicated weak but significant correlations.
For around 3 years, the COVID-19 pandemic caused by the SARS-CoV-2 virus has caused radical changes in many aspects of life at various levels around the world. Local communities in every country have been affected with regard to their ways of life. Health, social, economic, and cultural sectors, among many others, have also been affected.
Apart from the devastating health consequences of the COVID-19 pandemic, its impact on education, particularly on higher education and pedagogical issues, was immense. The regular functions of educational institutions were temporarily changed, and face-to-face classes were impeded. This, in turn, required quick intervention to maintain the continuity of the educational process and to ensure the quality of its outcomes. To cope with these unexpected, sudden repercussions, many governments switched to various types of online learning methods (synchronous, asynchronous, and hybrid). In Jordan, the case was not different; this, in turn, led the government to make decisions related to the teaching/learning processes and evaluation methodologies, including offering students the pass/fail grading system (PFGS) option, giving students the right to select either the PFGS or discretionary grading (DG). In a step aimed to have some control over the use of the PFGS option for graduate courses, some universities, such as The University of Jordan (JU), decided to limit the number of courses that a student is allowed to take using this option: no more than 50% of the total number of courses they attend can be under the PFGS. However, this number is left open for undergraduate students.
The academic achievement of the student is measured based on his performance on tests developed by faculty members or tasks given to them by their instructors. However, some of them use the (PFGS), while others do not use it, which makes the cumulative average of students from the same major, not comparable based on whether they use the option or not. Not to mention that the student’s transcript is viewed as a student’s bank statement. If this statement is inaccurate or invalid, then all decisions based on it will also be inaccurate. However, the students showed a degree of enthusiasm to use this option and even demanded it considering distance learning and assessment. As such, to come up with the best recommendations to improve the teaching/learning environment, the researchers selected to assess the PFGS evaluation method during the second semester of the 2020–2021 Academic Year (between 21 February 2021, and 1 June 2021).
The evaluation of students’ achievements in light of the COVID-19 pandemic opened new horizons for the assessment process. During the discussion with many teachers and students at (JU) and other local universities, many of them made observations regarding the use of the PFGS, ranging between agreement and disagreement. Some educators believe that the implementation of the PFGS option will reflect negatively on students because the appearance of this in students’ transcripts does not reflect the true academic level of their performance, which in turn affects them in obtaining job opportunities after graduation or enrolling in graduate studies, especially in countries that do not apply this option. This assessment option may confuse the teaching staff in calculating the GPA and ranking in light of the lack of knowledge of students’ real marks, which makes it difficult to differentiate between them and constitutes an imbalance in competition, as well as the inability to measure courses’ learning and teaching outcomes. On the other hand, the students acknowledge that the PFGS option comes due to the ineffectiveness of e-learning in its current form, where all lectures are delivered remotely. Students believe that their fair rights entail that they return to the university campus to receive a quality direct education and that they should be given the option of adopting the PFGS so that their cumulative average is not affected by the inadequate capabilities of universities to provide decent e-learning services, compounded with the lack of e-learning tools available to many students.
Therefore, this study aims to explore the perspectives of Jordanian university students regarding this (PFGS), their concerns and the motives behind their use of it, and the relationship of these perspectives to some demographic variables, such as gender, school type, and school year.
The importance of this study lies in two aspects: the first is theoretical, and the second is practical. On the level of theoretical importance, this study is expected to contribute to enriching the theoretical literature related to grade systems, specifically the binary system, pass/fail, promoting studies and research related to it, and advancing scientific research in this context.
At the level of practical importance, it is expected to provide the universities’ administration with a database that can help them to improve their practices.
The research questions tried to investigate the perspectives of bachelor’s degree students regarding the PFGS according to variables such as students’ gender (male and female), school category (humanities, sciences, and medicine), and academic level (freshmen, sophomore, junior, and senior) during the COVID-19 pandemic. Figure 1 presents the research question addressed in this research.
To the best of the authors’ knowledge, this type of comprehensive work has not been conducted elsewhere with the given details. The contribution of this work focuses on evaluating many students’ opinions about the optional PFGS, which is applied during the COVID-19 pandemic in higher education for public and private universities, from their own perspectives in terms of its advantages, its drawbacks, their reasons for using this option, and their attitudes toward it. The results of the study are expected to contribute to directing the attention of employees and decision-makers in Jordanian educational institutions toward reducing the defects of the PFGS and enhancing and improving its efficiency.
The rest of this work is organized as follows: section 2 presents good deal of literature review, section 3 presents the method that has been followed, section 4 covered the results interpretation, analysis, and discussion, section 5 introduced the discussion of limitations and recommendations, and finally the conclusion is drawn in section 6.
Two years ago, at the beginning of the COVID-19 pandemic, many universities were not ready to face the crises that occurred because of the SARS-CoV-2 virus, as educational systems were dependent on the physical presence of students and teachers. Moreover, students faced several issues, such as the postponement of exams, the cancelation of flights, and difficulty in conducting interviews for scholarships, among others (Quacquarelli Symonds, 2020). Therefore, to deal with the crisis and maintain a good quality of education, universities applied several quality assurance procedures. On the other hand, several universities changed their methods of grading and assessment, such as using the PFGS instead of a scaled grading system, changing the number of credits required to complete the qualification requirements, using various assessment formats such as open book exams, and in some cases changing the classification profiles and degree algorithms (Gamage et al., 2020). In several countries, decision-makers have tried to protect the high standards of academic and education quality by following certain procedures, and they have assessed the impact of these procedures on students’ performance based on academic achievement (Gallardo-Vázquez et al., 2019).
The outbreak of the COVID-19 pandemic illuminates daunting disparities in the equity and fairness of traditional grading systems. Initially, school districts around the nation offset these equity gaps by developing hold harmless policies designed to either freeze students grades in time or measure them as pass/fail (Maxwell, 2021).
Castro et al. (2020) mention that grading policies remained a local decision in California, for example, on April 2, 2020, California Department of Education released a set of frequently asked questions that outlined possible grading options. These options included the following:
• Assign final grades based on students’ third-quarter grades or their grades when the school shutdown occurred.
• Allow students to opt out of completing a course, thereby receiving an “incomplete” until they can finish the course.
• Allow students to choose whether they want to accept their current grade or continue with independent study.
• Assign students pass/no pass or credit/no credit.
• Assess students on essential standards using a rubric model instead of percentages.
At the core of the pass/fail debates, lies the issue of fairness, which in this context entails simply ensuring that all students have the same benefits and opportunities based on the grading system given their academic performance. In the pass/fail system, students who work harder and achieve more are not recognized, or distinguished by their performance. Not only does this undermine the fairness of the system, as students with radical differences in effort and performance receive the same grades, it further reduces the incentive for students to work hard and achieve their learning goals. However, it can also be used as an effective strategy in a time of crisis or in other disaster situations to help retain students (Cumming et al., 2020).
Educational measurements for evaluating students in higher education have been the biggest concern for a long time, and many studies in the literature have been conducted to measure the quality of each. PFGS is found to be beneficial by authors.
We presented the literature in chronological order first, then we wrapped our findings in a table that that summarized the advantages and disadvantages of adopting the PFGS.
The impact of the pass/fail system was researched by Gold et al. (1971). Participants in their study were Cortland College students from the State University of New York. Two groups participated in the study: one group expressed interest in taking all courses with pass/fail grading, while the other group expressed interest in taking just one pass/fail course. Furthermore, 28% of the freshmen wanted to take all their courses on a pass/fail grading, while 78% of the freshmen and 80% of the juniors wanted to take only one pass/fail course. The results of their study revealed that there were no improvements in the grades obtained in the non-pass/fail courses. On the other hand, when the data for the freshmen and the juniors were combined, the students taking one pass/fail course received lower grades in their pass/fail course than in their non-pass/fail courses. However, the PFGS has the advantage of relieving grading pressure for some courses in the students’ majors and could help develop students’ motivation to learn.
McLaughlin et al. (1972) explored how college, major, and academic year influenced eligibility and the decision of students to take pass/fail courses. The results of this research showed that not all students have the same opportunity of taking pass/fail credit. Students who utilized the pass/fail option took additional total hours and earned a better quarterly grade point average than the others. This research also suggested that students could take additional academic courses for a pass/fail grade with no expected adverse effects on their academic records. In addition, this research focused on two important points that need further study. The main one was related to the number and content of the academic courses that were taken when a pass/fail option was available. The second point concerned whether students would take more academic courses than required when the pass/fail option was available.
Wittich (1972) conducted a study utilizing statistical data to examine the effect of the PFGS on the academic performance of college students. She discovered, among other things, that PFGS shouldn’t be used if strong results for the D-passing level are anticipated from cumulative learning subjects. In addition, using the PFGS option was shown to have several advantages, such as reducing the stress and pressure of the traditional assessment, decreasing the fear of getting poor grades in unfamiliar academic areas, and increasing the level of students’ motivation to learn, in addition to instilling more intellectual curiosity. The investigation used data collected from 895 students who studied foreign language courses (French, German, Spanish, and Russian). Of the 895 students, 305 opted for the pass/fail system and received conventional grades, and it turned out that their grades were lower than those of the 570 students who chose to remain under the traditional system. The instructors who awarded these grades did not know which of the students chose the pass/fail option.
A literature survey on PFGS written between 1968 and 1971 is presented in Otto (1973). This survey formed the following conclusions: (1) students do not choose pass/fail to avoid evaluation, because it was found that their performance in all courses, regardless of the evaluation method, deteriorated; (2) students resort to a pass/fail option to make things easier for them in academic courses and not to expand into additional academic fields; (3) freshmen suffer academically more than others from taking pass/fail grades, thus they need special guidance before they are allowed to select this option; and (4) students who have been assessed on a pass/fail basis may face difficulties in the institutions they wish to transfer to or in the higher education stages.
Reddan (2013) conducted a study to illustrate the advantages of introducing the standard course grading method to work-integrated learning. The results of the study indicate that the students supported the change from a non-graded (pass/fail) system to a graded assessment system. The reason for this is that it presented tangible competition; this result helped students learn and encouraged weaker students to extend their efforts. On the other hand, this study also recommended that the teachers be mindful, since evaluation, in some cases, can cause excessive competition between students and produce conceivable negative discernment results (e.g., subjects focusing more on the students instead of on the learning outcomes). Lastly, the subjects considered that grading boosted their endeavors to prepare for their future careers through an emphasis on skills that were significant to employability.
Melrose (2017) highlighted the advantages and disadvantages of the PFGS and Discretionary Grading (DS) approaches, which are the two most commonly used educational measurements. In his paper, he stated that both approaches have benefits and can efficiently measure students’ achievements in nursing education programs. He said that although PFGS helps in intrinsic motivation and self-routing, it limits the possibility of spotting excelling students. On the other hand, DS helps extrinsic motivation and self-improvement even though it could promote unhealthy competition.
McMorran et al. (2017) analyzed what is called a “gradeless learning” policy at a large public university in Asia—the National University of Singapore (NUS). This policy was implemented in August 2014 and involved nearly 7,000 first-year students during their first semester. This paper found that most students affirmed that “gradeless learning,” such as pass/fail systems, can reduce stress and help students acclimate to university life. Additionally, it showed that gradeless studying might also introduce new sources of stress that undermine the system’s goals. Institutions have to be aware of these conceivable sources of stress and address them with ample planning, clear clarification, and cautious implementation of any gradeless learning policy.
Quality and standards concepts are highly related and interconnected. Quality is considered in a set of activities, such as teaching, assessment, research, curriculum, and students’ learning and experience (Thompson-Whiteside, 2013). On the other hand, the standard-based approach uses a set of pre-determined standards that are developed externally to appraise universities. For example, the minimum requirement approach evaluates whether or not universities are fulfilling a set of minimum requirements, while in fit-for-purpose approaches, performance is assessed by a set of predefined goals (Wang, 2014).
Some studies have indicated that the PFGS has benefits and advantages (Rohe et al., 2006; Strømme, 2019). However, other studies have indicated that the PFGS has some drawbacks and may have a negative impact by decreasing academic achievement (Gold et al., 1971). In addition, it has a negative effect on students competing for job positions (Dietrick et al., 1991; Guo and Muir, 2008).
Some researchers (Strømme, 2019) found that the PFGS has positive effects on students’ enjoyment and academic achievement. Others (McLaughlin et al., 1972) explored how college, major, and academic year influenced students’ eligibility and their decisions to take the PFGS courses.
In the past decade, a number of studies have focused on studying the effect of PFGS on the performance of medical students and physicians. For example, Dietrick et al. (1991) studied the effect of the PFGS on students’ competition for residency positions in general surgery compared to the non-pass/fail grading system. Their survey was completed by the general surgery residency program directors. The survey results revealed that the majority of respondents preferred non-pass/fail grading systems rather than the PFGS for student evaluation and that 89% of program directors preferred to review medical students’ transcripts using a non-pass/fail grading system. They also found that the PFGS has a disadvantage and does not have a good effect on competition for general surgery residency positions.
In a study by Joshi et al. (2018), the authors specified the following set of features for the PFGS: high standards to achieve the passing score, the need for a supplement of tools to guarantee these standards, and constructive feedback and room for reflection. They indicated that the PFGS decreases the level of competition among students, but it supports a collaborative learning environment. It also enhances the well-being, satisfaction with education, and mental health of students.
Rohe et al. (2006) studied the impact of PFGS on medical students in terms of psychological parameters, such as mood, group cohesion, and test anxiety. The participants in this study were medical school students in the graduating classes. Their results provided evidence of the advantages and benefits of the PFGS compared to the traditional grading system (non-pass/fail) during the basic science years of an undergraduate medical school curriculum with the 5-interval grading system (F gets a 1, D gets a 2, C gets a 3, B gets a 4, and A gets a 5). They found that PFGS can reduce stress, improve mood, and increase group cohesion for medical students compared with the traditional grading system. There were no statistically significant differences in all variables measured between the two systems.
Many review papers have discussed the literature assessing the impact of the use of PFGS in medical schools. Spring et al. (2011) performed a systematic search of research published between 1980 and 2010. They concluded from numerous papers that the PFGS enhanced student well-being, but academic performance was not affected by this system. However, it may affect some decisions regarding the choice of the residency program.
Another review made by Ramaswamy et al. (2020) discussed the benefits of PFGS in dental education. Their review covered numerous research papers that examined the use of the PFGS in North America. It demonstrated that using success can improve student well-being, facilitate self-stimulation, and promote competency-based learning compared to the letter grading system. Moreover, it may help dental educators achieve their elementary goals more effectively. However, the PFGS may face many challenges, such as a lack of clarity in setting pass/fail standards.
One of the researchers examined the effect of the PFGS on computer science majors (Strømme, 2019). The author described preferred practices that make the pass/fail course in computer science successful. He defined these practices by studying the results of one pass/fail course in Algorithms Engineering. A student is required to successfully pass 13 assignments, one for each week, in order to pass the course. They found that the PFGS has positive effects in terms of student enjoyment and academic achievement. They argued that pass/fail courses in computer science can be made successful by applying three practices: setting a high enough threshold for passing, providing clear course requirements, and using formative evaluation.
It is worth mentioning that, in a session held on 4 April 2020, the Jordanian Council of Higher Education Deans approved a pass/fail grading system as an optional principle for undergraduate and graduate degree students, without having any effect on the licensure-pursuing education in universities and their academic programs (Ministry of Higher Education and Scientific Research, 2020).
To wrap this section, we summarized the major advantages and disadvantages of the PFGS in Table 1.
Several medical schools changed their student assessment and evaluation from a discriminating grade scale, which includes four values (fail, pass, high pass, and honors), to a pass/fail grading scale. The effect of this transformation on the grades of a second-year class was studied by Dignath et al. (2008). The results showed that the statistical changes, such as performance, increased in all courses except two. Furthermore, students were very satisfied with the pass/fail grading scale for several reasons, including the enhanced collaboration between students, the decreased competition, the increased time for activities, and the “leveled playing field” for students with different backgrounds.
Again, it was found that some studies were in favor of the PFGS (pros), while some were against it (cons). Some of the previous studies focused on the categories of students (e.g., medical students), while others focused on the aspects of evaluation (e.g., stress and collaboration).
As can be seen from Table 1, there are many advantages and disadvantages related to adopting the PFGS. This forms a strong foundation for making this comprehensive detailed study to help both students and academic decision-makers address all the issues of such a system, especially after the COVID-19 pandemic.
This study is a descriptive survey that aims to describe the phenomenon as it occurs on the ground by shedding light on students’ perceptions and beliefs about the PFGS option in order to identify the advantages and disadvantages from their point of view, in addition to the reasons for activating and applying this option.
This section provides an overview of the research methods used in the study. It contains details about the participants and how they were sampled. It also covers the instrument used to collect data and the methods used to validate it.
This paper evaluates the opinions of 6,404 students about the PFGS. Their responses were collected through a survey distributed to them during the second semester of the Academic Year 2020/2021 at four Jordanian universities: Al al-Bayt University (AABU), Balqa Applied University (BAU), The Hashemite University (HU), and The University of Jordan (JU). The students’ schools were categorized into three main types: humanities, medicine, and sciences. They were invited to answer the survey optionally and at their convenience. After reviewing all responses, we rejected 263 invalid responses for the reasons listed below.
1. Answers were filled carelessly by selecting “strongly disagree”, “strongly agree” or “neutral” for the whole set of 40 questions.
2. The survey was partially filled out and many questions were left blank.
Figure 2 shows the participants’ profiles of the 6,141 validated responses. The participants’ profiles show that 34.4% are male and 65.6% are female (Figure 2A). Among them, 44.5% of the participants were from humanities schools, 34.4% were from science schools, and 21.1% were from medical schools (Figure 2B). The majority of them were freshmen (50.4%), while seniors comprised the lowest percentage of participants (13.0%) (Figure 2C). Also, the profile shows that 68.2% are from HU and 30.5% are from JU, while the other two universities have a minor number of participants (0.9% from BAU, and 0.5% from AABU). This was due to our late notice of including students from these two universities.
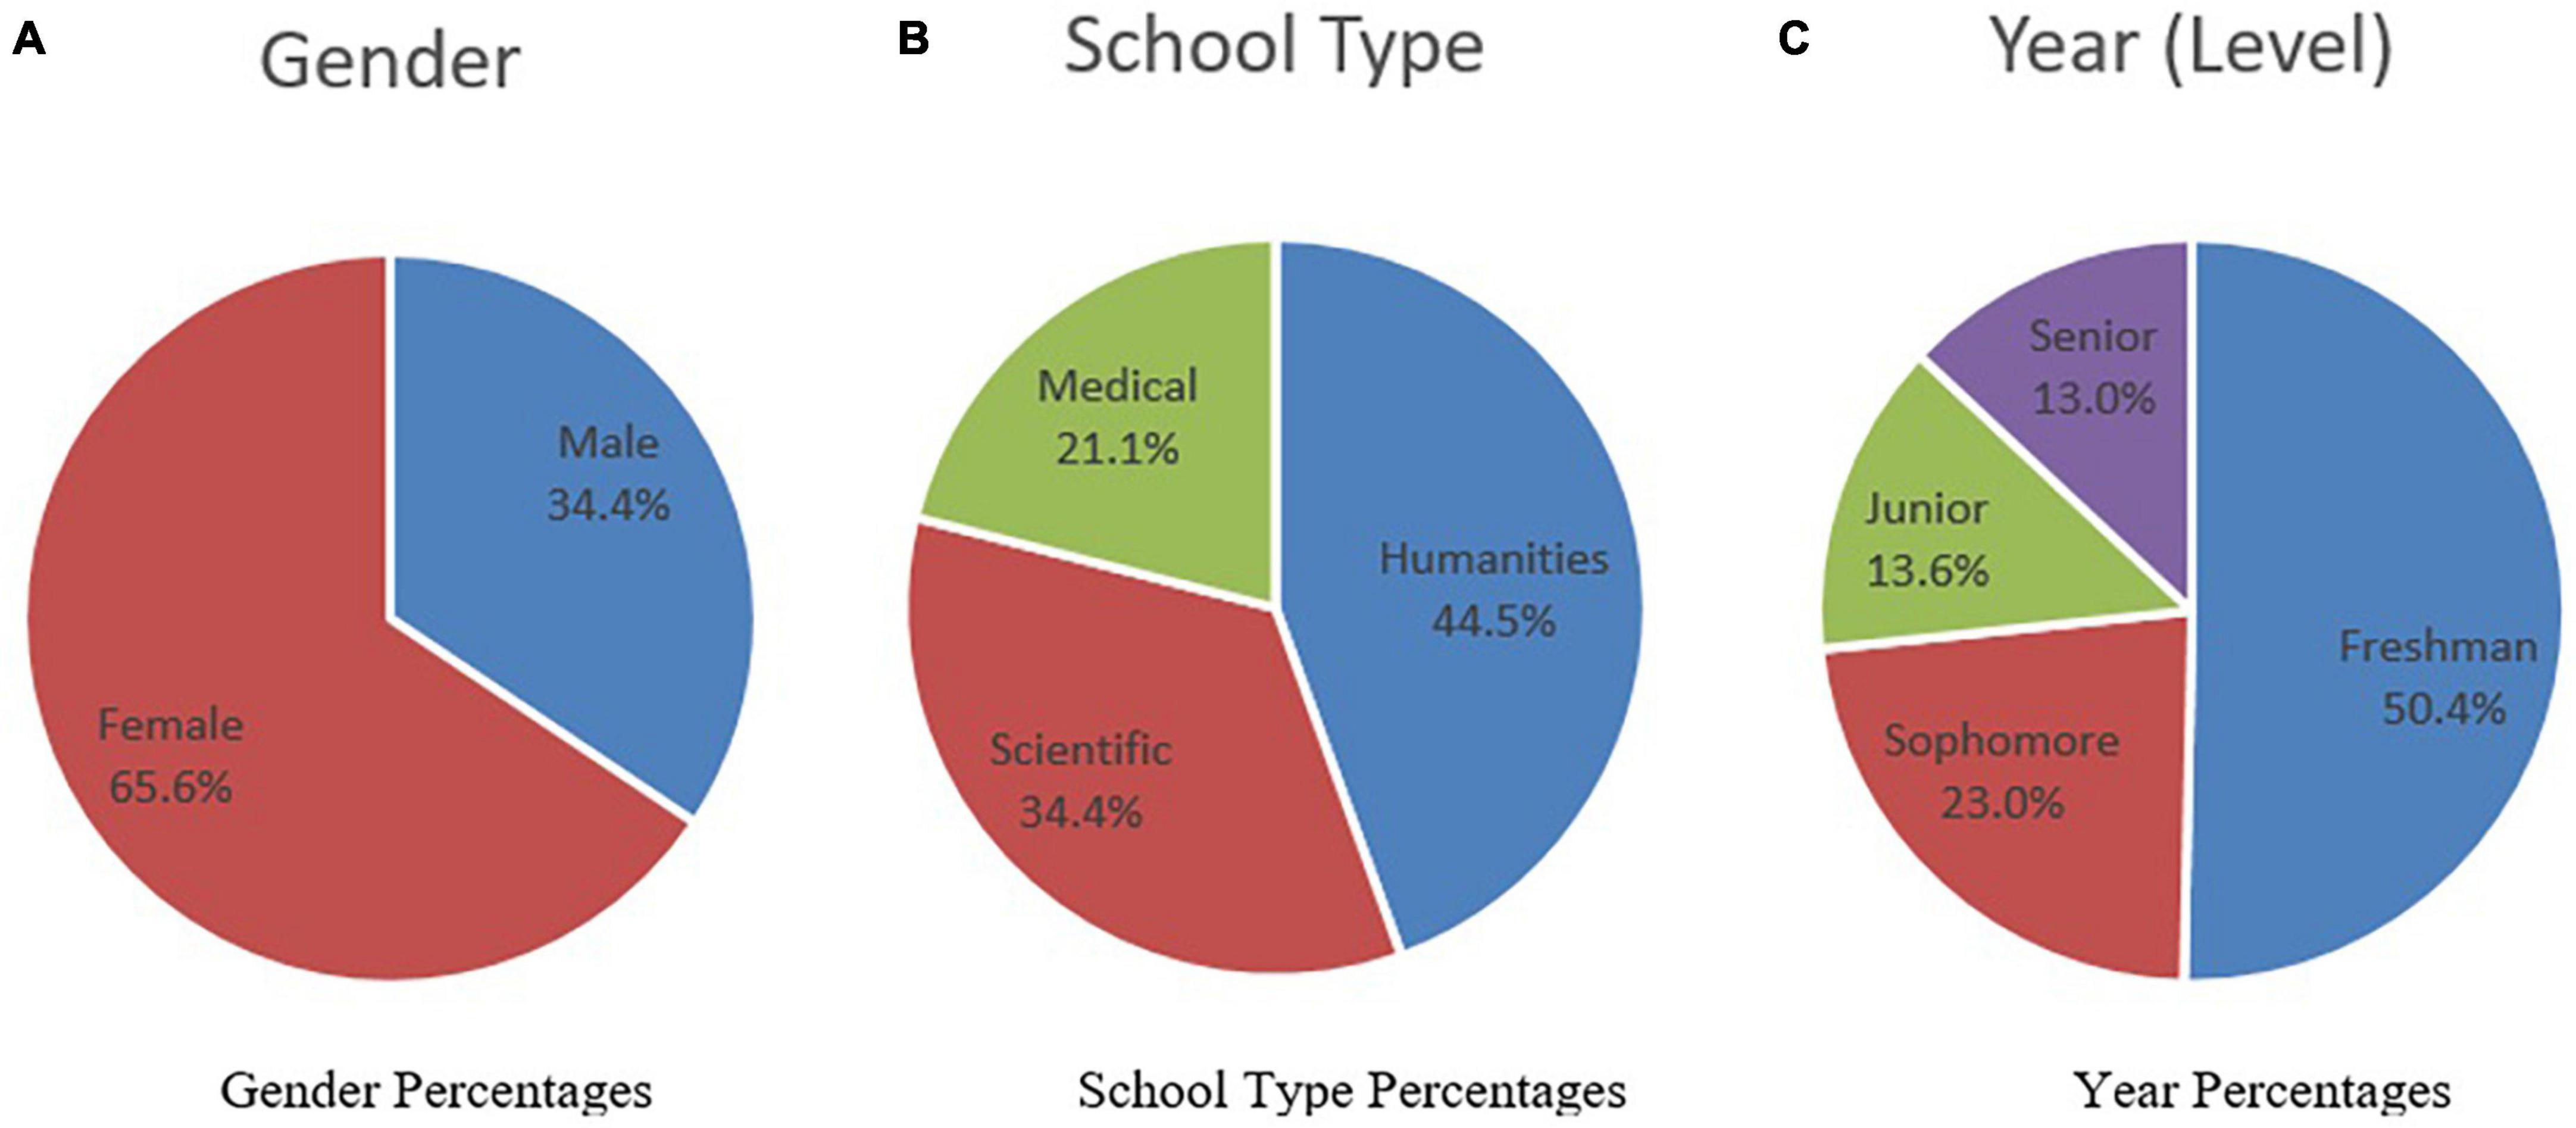
Figure 2. Participant distribution. (A) Gender percentages; (B) school type percentages; (C) year percentages.
To investigate the distribution of the study sample according to the demographic variables, cross tabulation was explored as shown in Table 2.
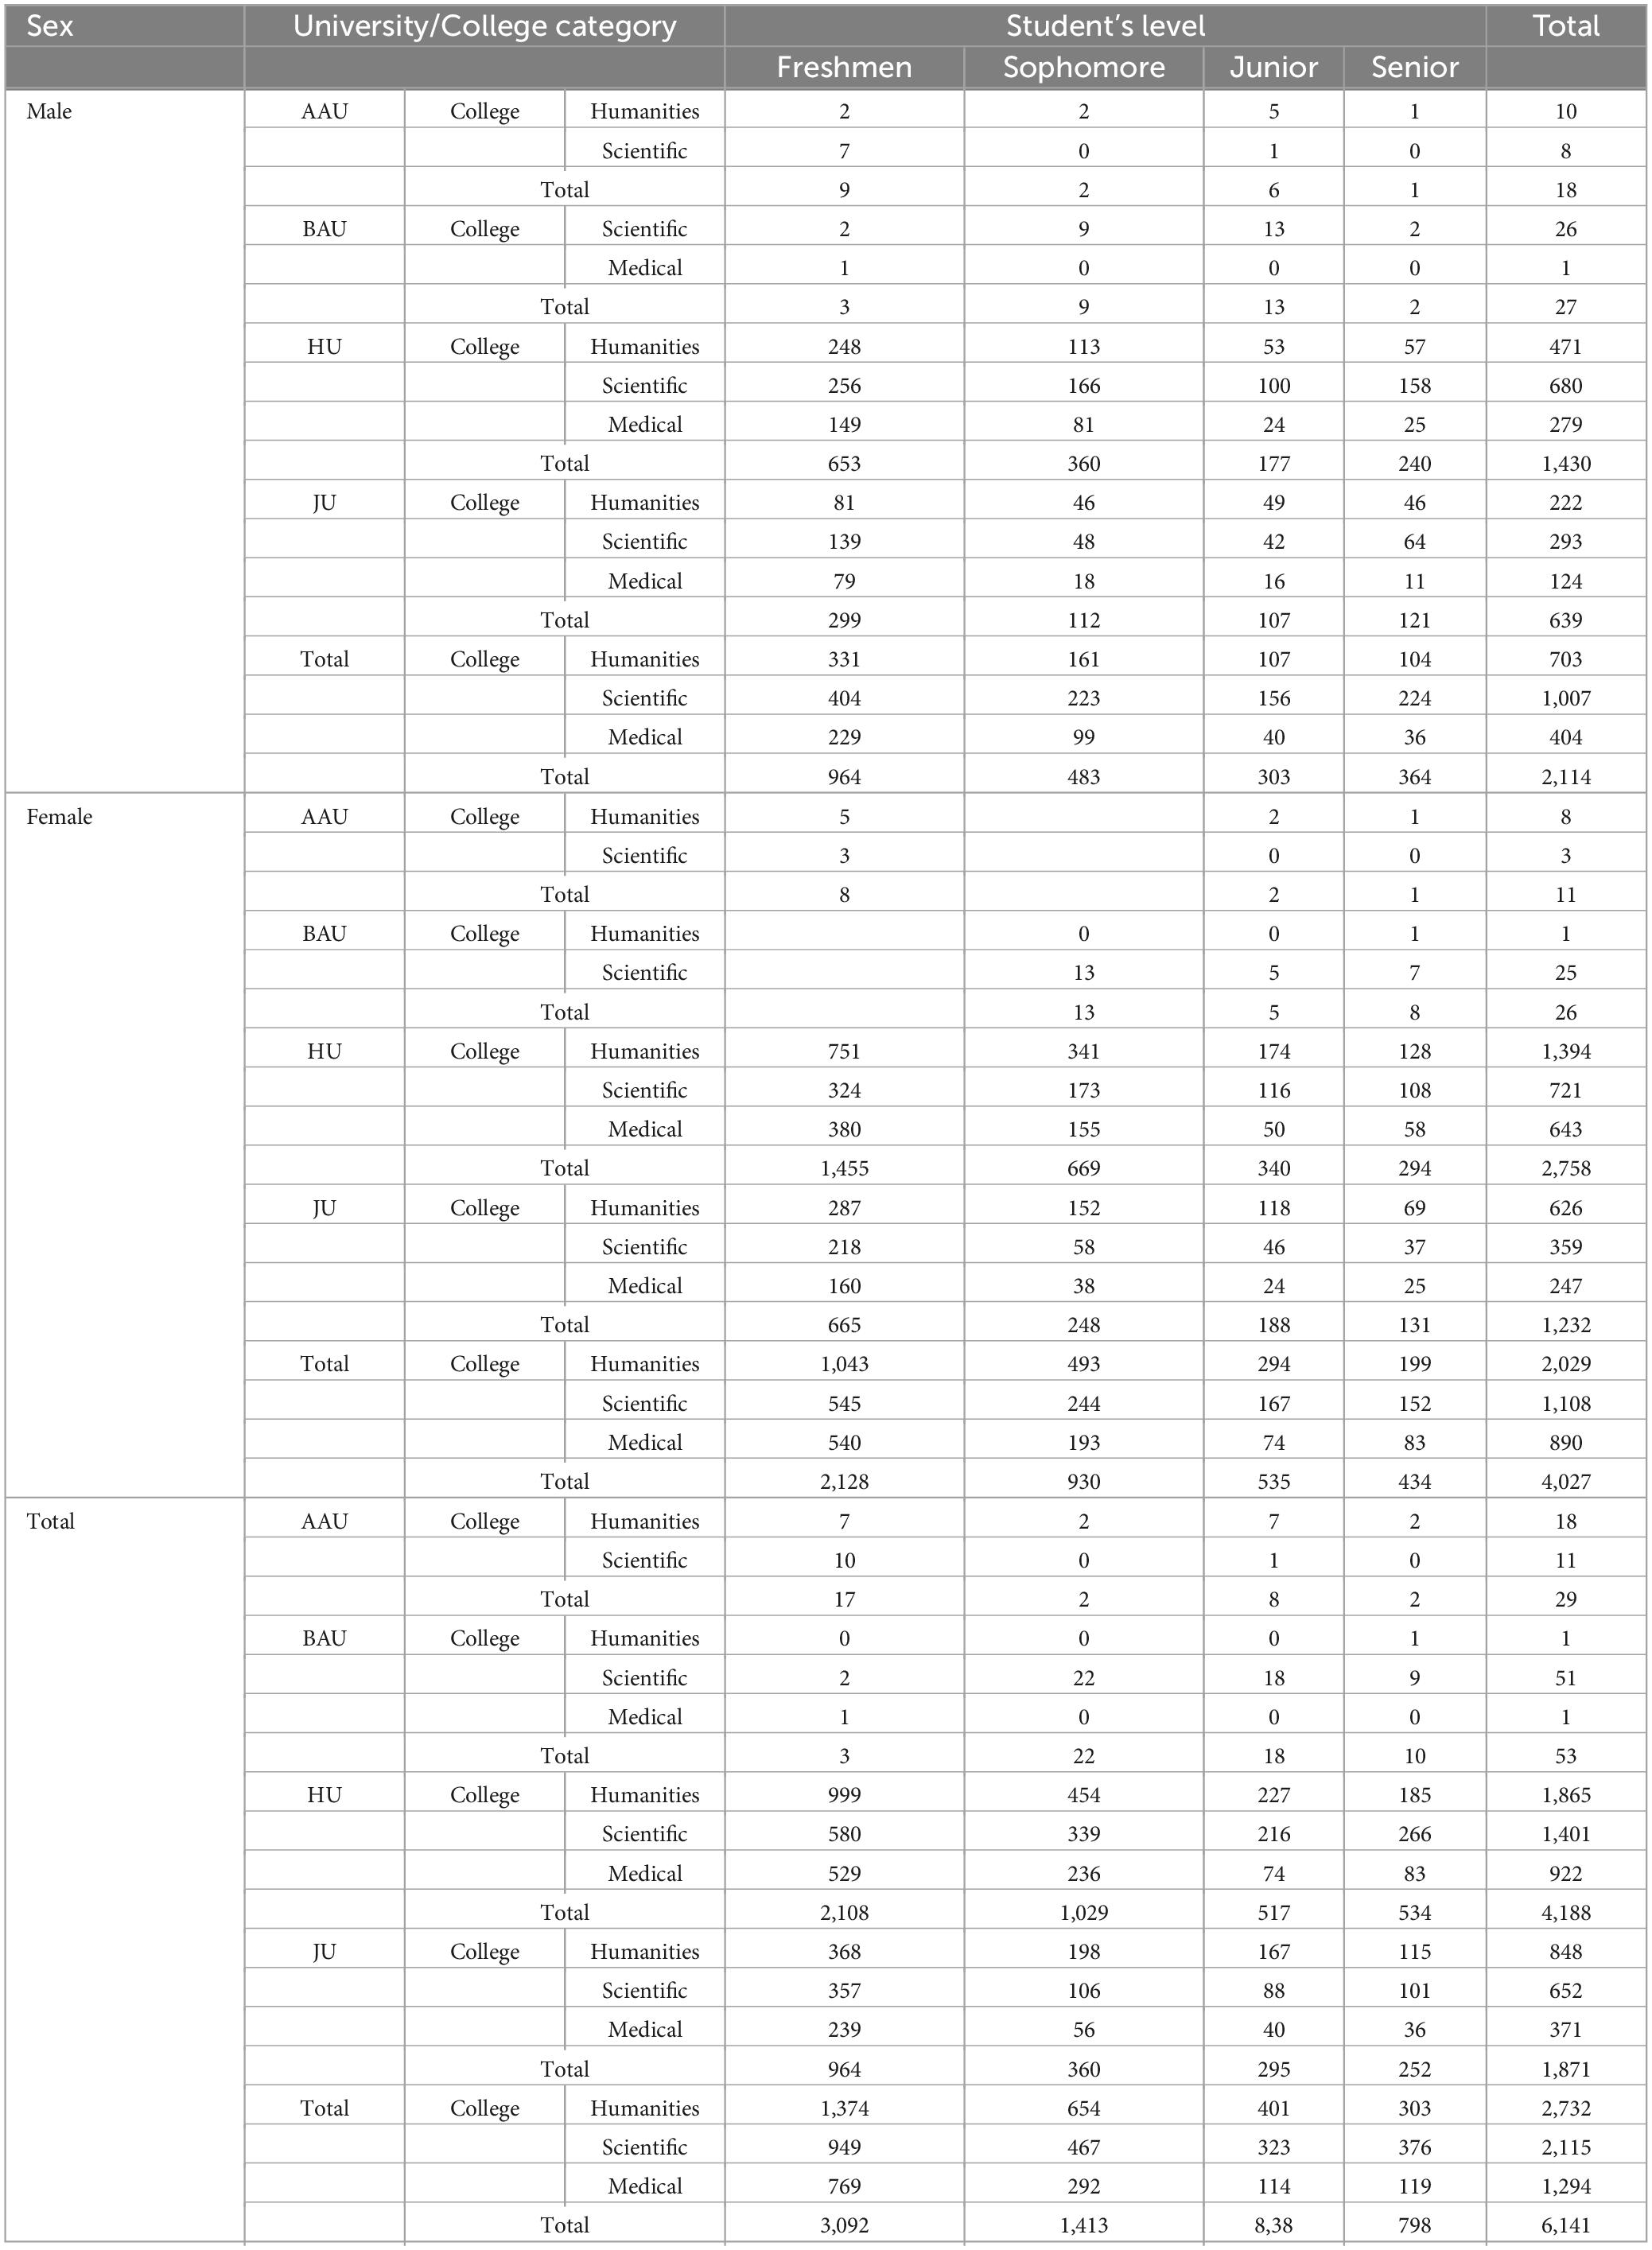
Table 2. Cross-tabulation of the universities, school types, and university levels of the participants.
Table 2 shows that some cells contain a sufficient number of students according to all categories of the variables, although other cells contain a very small number of participants, which may affect the homogeneity of the variance between groups.
A questionnaire was developed based on a literature search of articles in pass/fail grading systems databases, such as Quacquarelli Symonds (2020), Wang (2014), Wittich (1972), and Melrose (2017). The survey consisted of 37 questions, grouped into four major categories: PFGS advantages, PFGS drawbacks, students’ reasons for choosing PFGS, and students’ attitudes toward the PFGS. Each category comprised 10 questions, except the fourth one, which comprised only 7 questions. Supplementary Appendix A shows the survey content of the groups and their questions. As shown in the survey, some other factors influenced the students’ opinions, such as study year, gender, and their grade point average (GPA).
To incorporate many students to participate in the survey, the researchers did their best to avoid administering the survey during their exam period, and the survey was left activated for more than two weeks. In addition, students were encouraged to participate through social media. The sample space comprised students from different university levels and schools.
The items of the questionnaire were written and distributed to subscales after several brainstorming sessions involving researchers via the Microsoft Teams platform. These items were reformulated using language appropriate for the study population; it contains 40 items in its initial version distributed among four subscales. Table 3 shows the details.
The 5-point Likert scale is utilized to gauge the student’s opinions about the PFGS. Table 4 summarizes the answers and the weight of each one.
These weights were reversed for Questions 34, 36, and 40. These three questions were reversed in the fourth subscale to validate the students’ responses.
The Grand Average Weight (GAW) for all answers is 3.0; it is calculated as the summation of all weights divided by their count as follows:
When the GAW value is equal to or greater than 3, it indicates agreement by the students; however, when GAW is less than 3, it indicates that the students do not agree with the statement.
The validity and reliability of the questionnaire were verified using the following methods:
First, the content validity of the survey/questionnaire was verified by presenting it to five experienced and competent arbitrators in the fields of IT, education, and psychology. Their opinions were reviewed, studied, and made appropriate in terms of the accuracy of the formulation. The survey was then pilot-tested and applied using online Google Forms and Microsoft Forms. The discrimination indices (Di) of the items were investigated using item–total correlation (ITC) (Ebel and Frisbie, 1986; Hulin et al., 2001). Supplementary Appendices B–E shows these results for the four subscales: Advantages, Drawbacks, Reasons, and Attitude respectively.
As can be seen in Supplementary Appendix B, the discriminant index for the “Advantages” subscale is in the range of 0.28 to 0.61. For the “Drawbacks” subscale, it is in the range of 0.72 to 0.80 (Supplementary Appendix C). For the “Reasons” subscale, it ranges from 0.52 to 0.62 (Supplementary Appendix D), and it ranges from 0.12 to 0.52 for the “Attitudes” subscale (Supplementary Appendix E).
Ebel and Frisbie (1986) give the criteria for determining the quality of the items based on the discrimination index (Di): if the Di value is greater than 0.39, it is excellent; if the Di value is in the range 0.30 to 0.39, it is good; if the Di value is in the range of 0.20 to 0.29, it is moderate; and if the Di value is in the range of 0.00 to 0.20, it is poor. Therefore, it could be concluded that almost all questionnaire items (questions) are excellent, since the Di is greater than 0.39 for all questions, except for Questions 34 and 36, which were intentionally reversed to validate the questionnaire. Their Di values were 0.12 and 0.13, respectively. Actually, the third reversed question, Question 40, has a low Di value of 0.232, as expected. To identify Questions 34, 36, and 40, they were formatted in a bold and italicized font in Table 9. For the purpose of obtaining realistic statistics, however, these three questions were excluded from the analysis of the questionnaire, and the final version of the PFGS scale was composed of 37 questions.
Before analyzing the questionnaire, its internal consistency (or reliability) was validated. The questionnaire reliability was verified in two ways: Cronbach’s alpha equation and the Spearman-Brown equation (Ebel and Frisbie, 1986; Hulin et al., 2001).
• To measure the scale reliability using Cronbach’s alpha, we use Equation (2):
where k is the number of items, is the inter-item variance, and is the variance of the total score.
• Scale reliability can also be measured using the split-half Spearman-Brown Equation (3):
where P12 is the Pearson correlation between the split halves.
Table 5 shows the reliability coefficients using Cronbach’s alpha and split-half Spearman-Brown equations after removing the weak questions (Questions 34, 36, and 40).

Table 5. Reliability coefficients using the Cronbach’s alpha equation and the split-half using the Spearman-Brown equation.
It is noted from Table 5 that the reliability coefficients for the four subscales using Cronbach’s alpha are in the range of 0.77 to 0.94, and these coefficients using the split-half method are in the range of 0.67–0.87. According to Hulin et al. (2001) and Ursachi et al. (2015), a generally accepted rule is that when α is in the range of 0.6–0.7, there is an acceptable level of reliability, and when α is 0.8 or higher, there is a very good level of reliability. Based on this, it can be concluded that the questionnaire is reliable since all calculated α values are above 0.60. Most values are at a very good level, as their α values are above 0.8.
To achieve the goal of the study and answer its questions, the Statistical Packages for Social Sciences (SPSS V 23) from IBM was used to analyze the collected data. The percentages of frequencies, arithmetic means, and standard deviations of students’ responses were computed on each item of the questionnaire and its sub-scales. The results of the Mann–Whitney U test were also found to answer the question related to the effect of the student’s gender on his perspectives. The Kruskal–Wallis (K-W) test was used to answer the questions related to the effect of school category and academic level. The results of the Spearman correlation were computed to reveal the relationship between students’ perspectives and their academic achievement.
This section describes the obtained results and analysis for the research questions.
To answer the first research question: “What are the students’ perspectives about the PFGS at Jordanian universities during the COVID-19 pandemic?” the frequencies, mean scores, and standard deviations of the scores obtained from the questions answered by the study subjects were extracted. Tables 6–9 show these results.
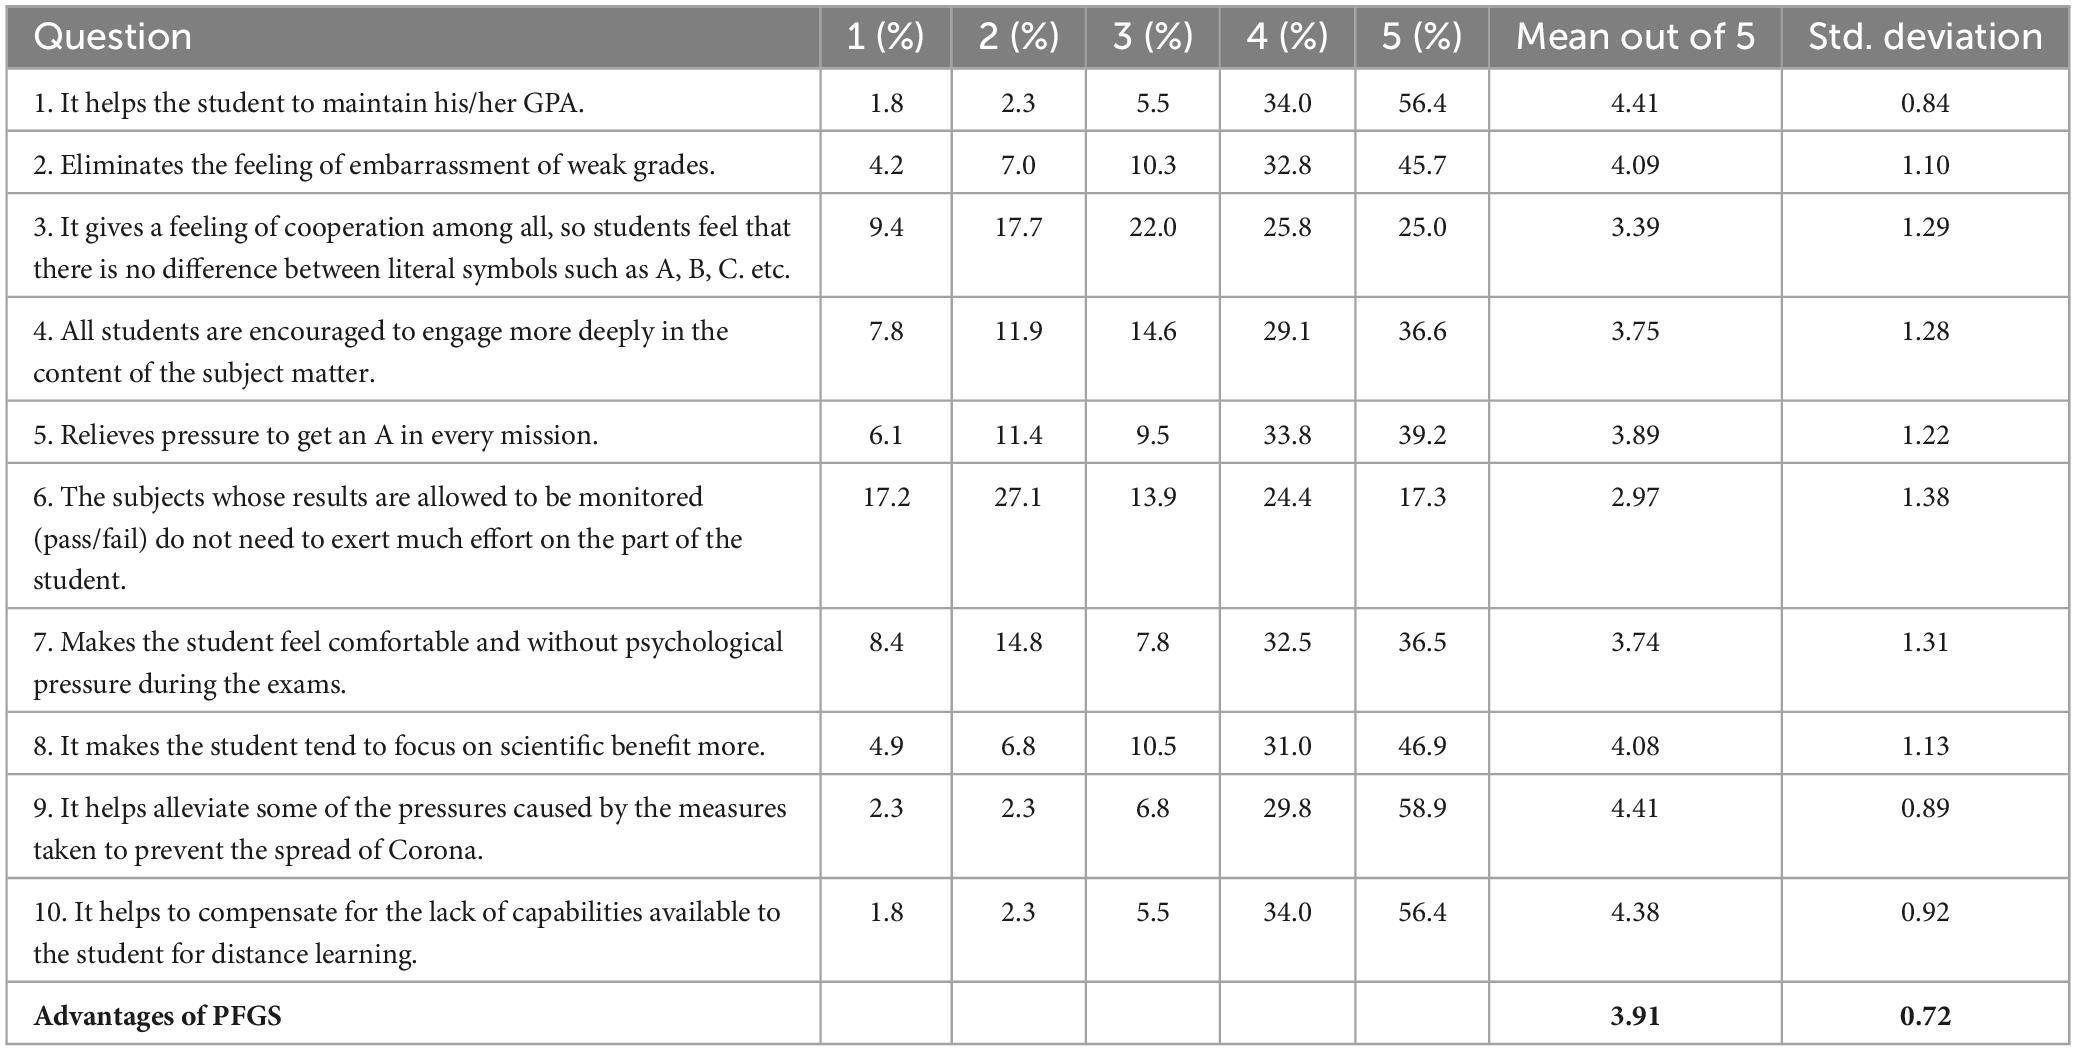
Table 6. The frequencies, means, and standard deviations of scores for questions under the Advantages subscale.
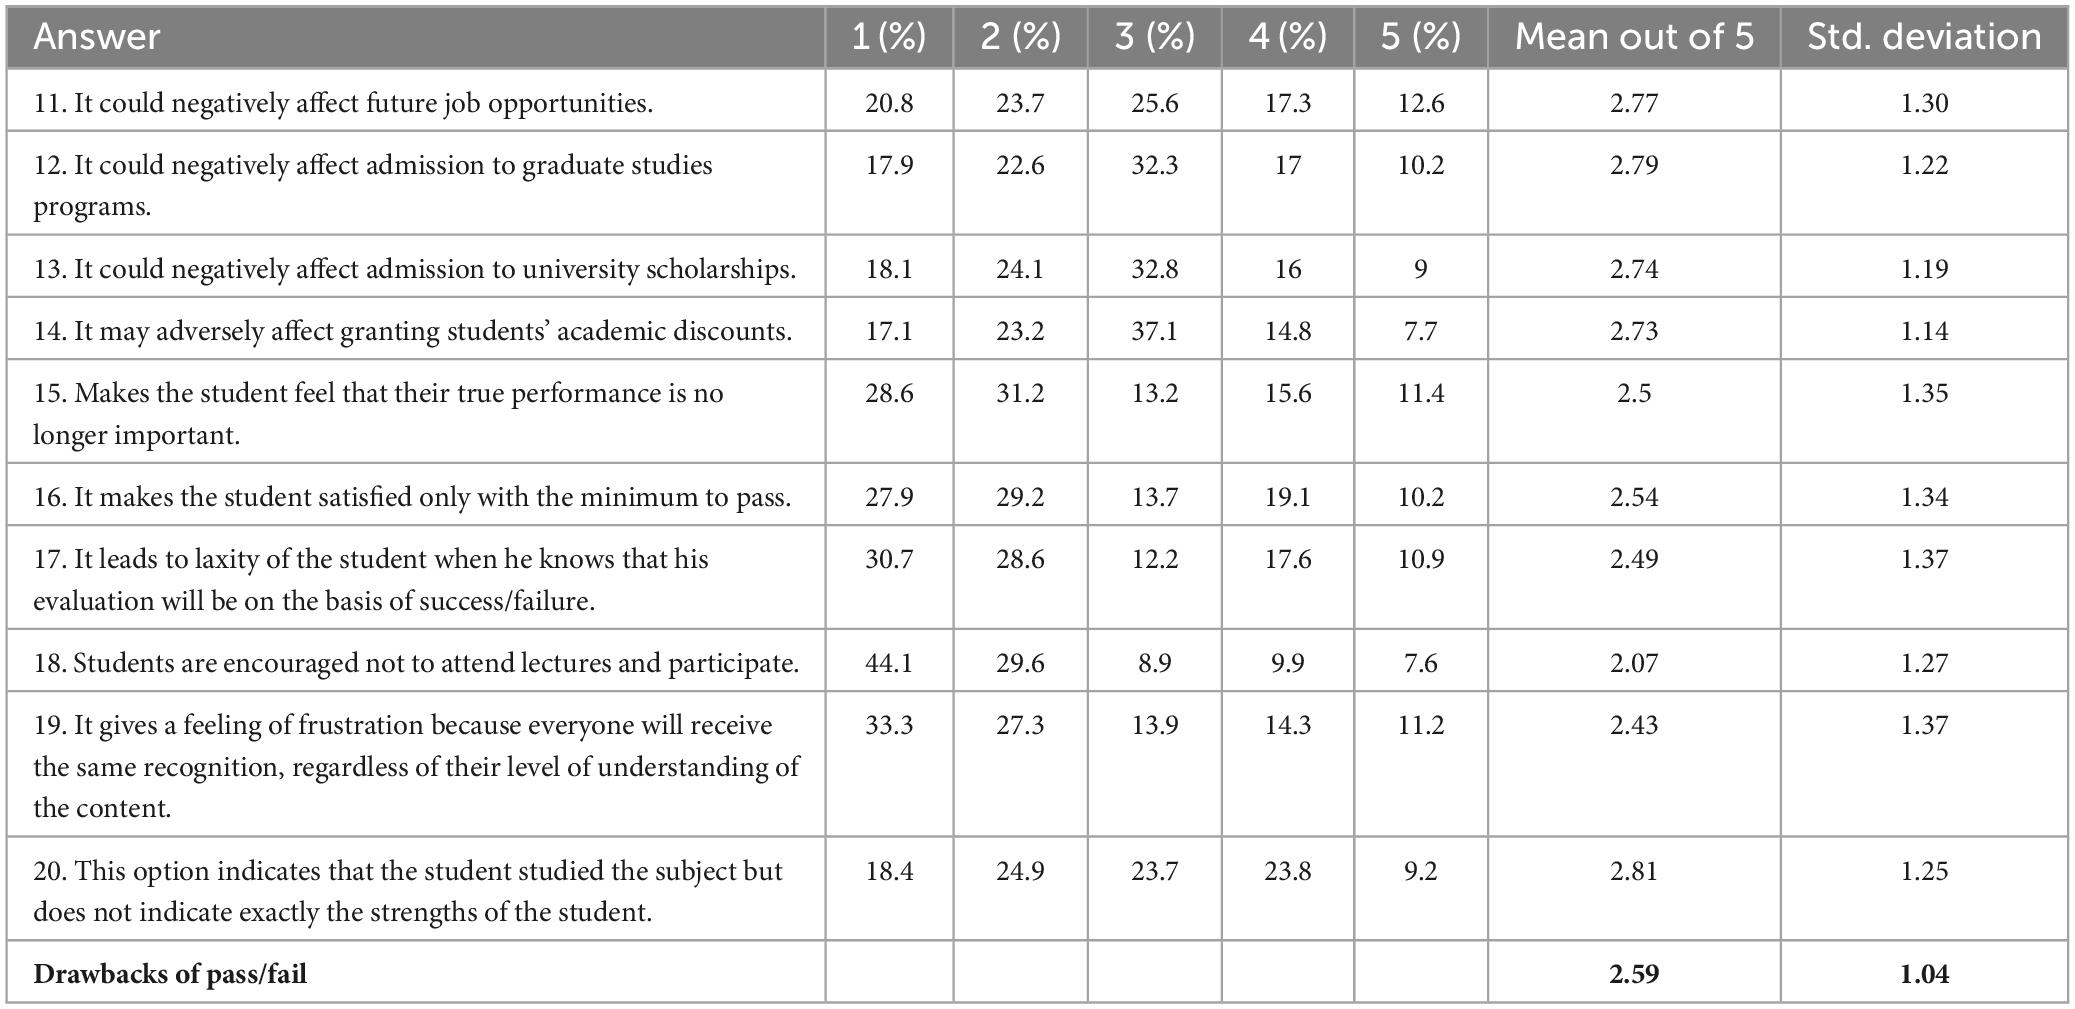
Table 7. The frequencies, means, and standard deviations of scores for questions under the “Drawbacks” subscale.
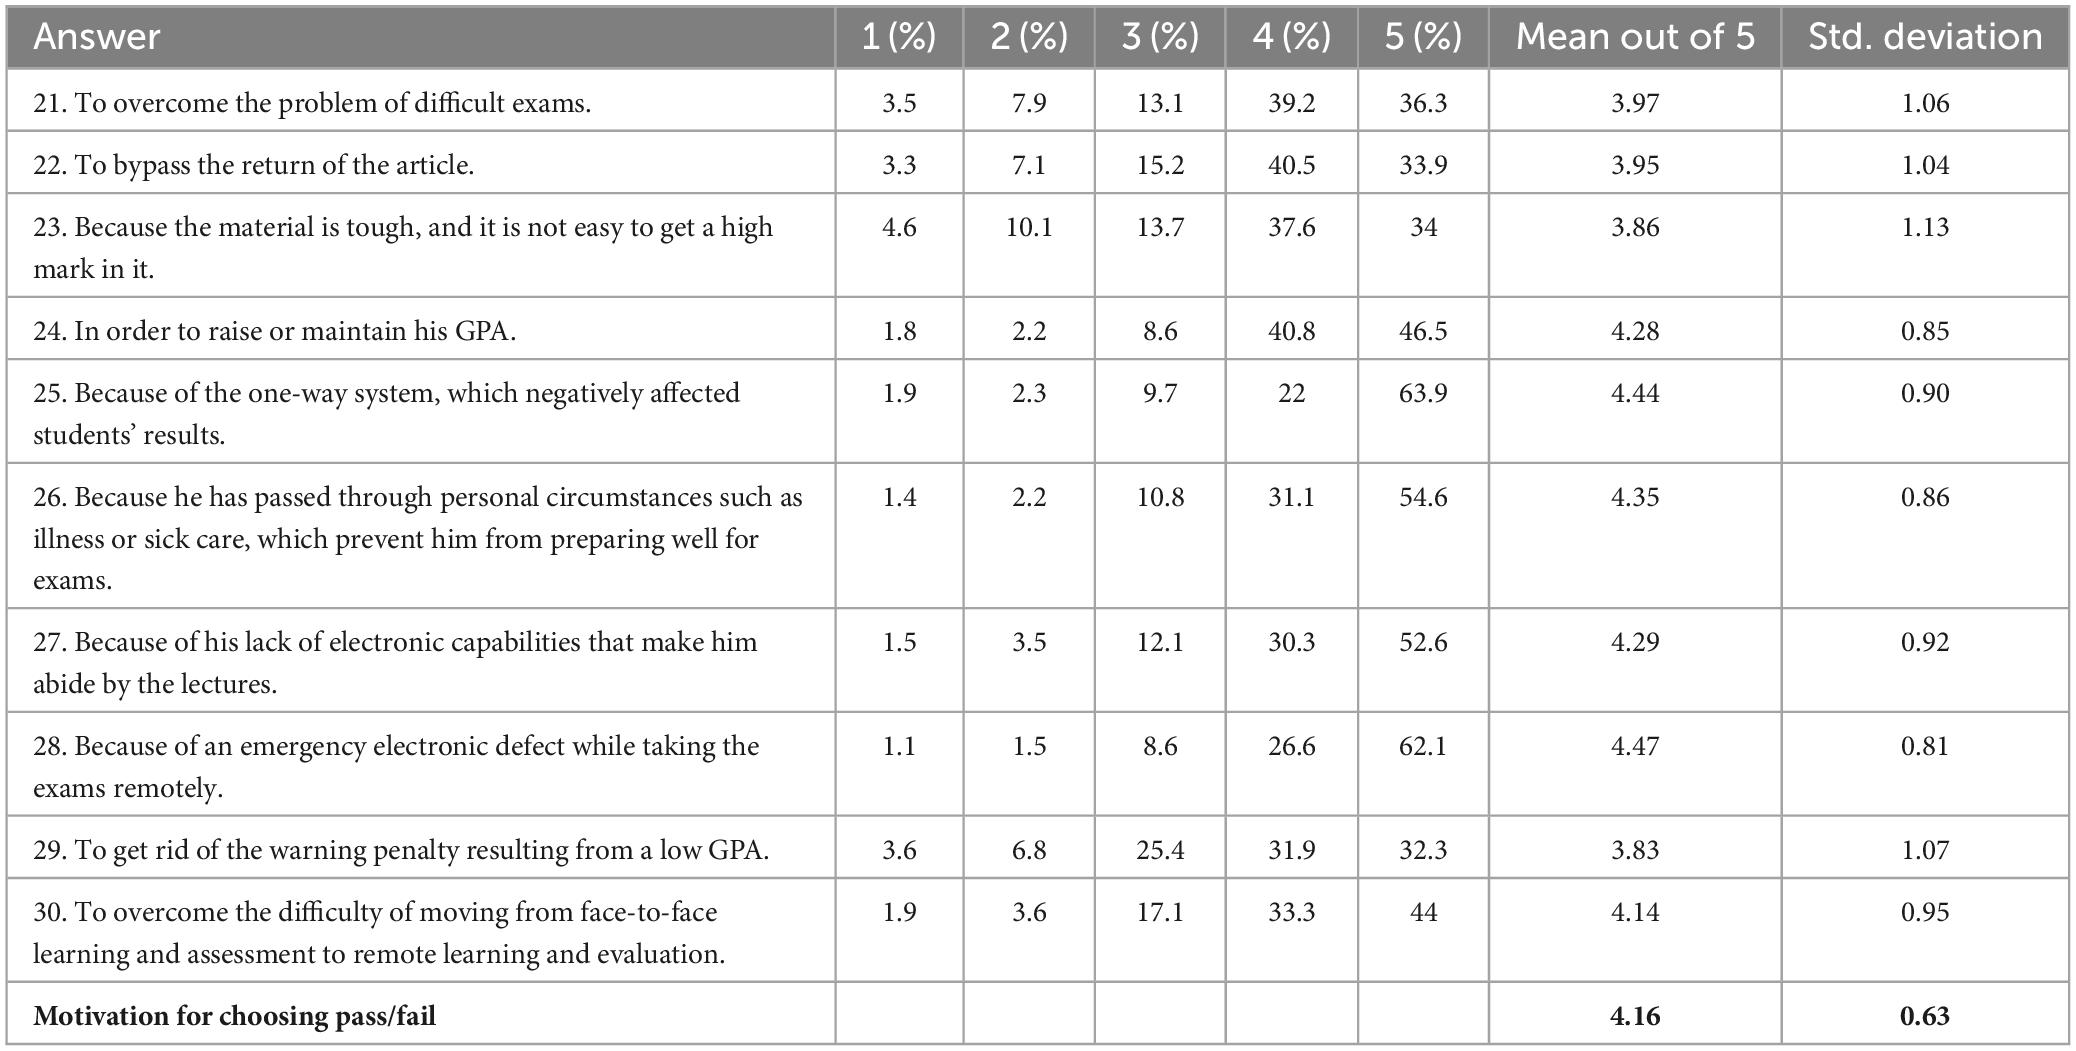
Table 8. The frequencies, means, and standard deviations of scores for questions under the “Reasons” subscale.
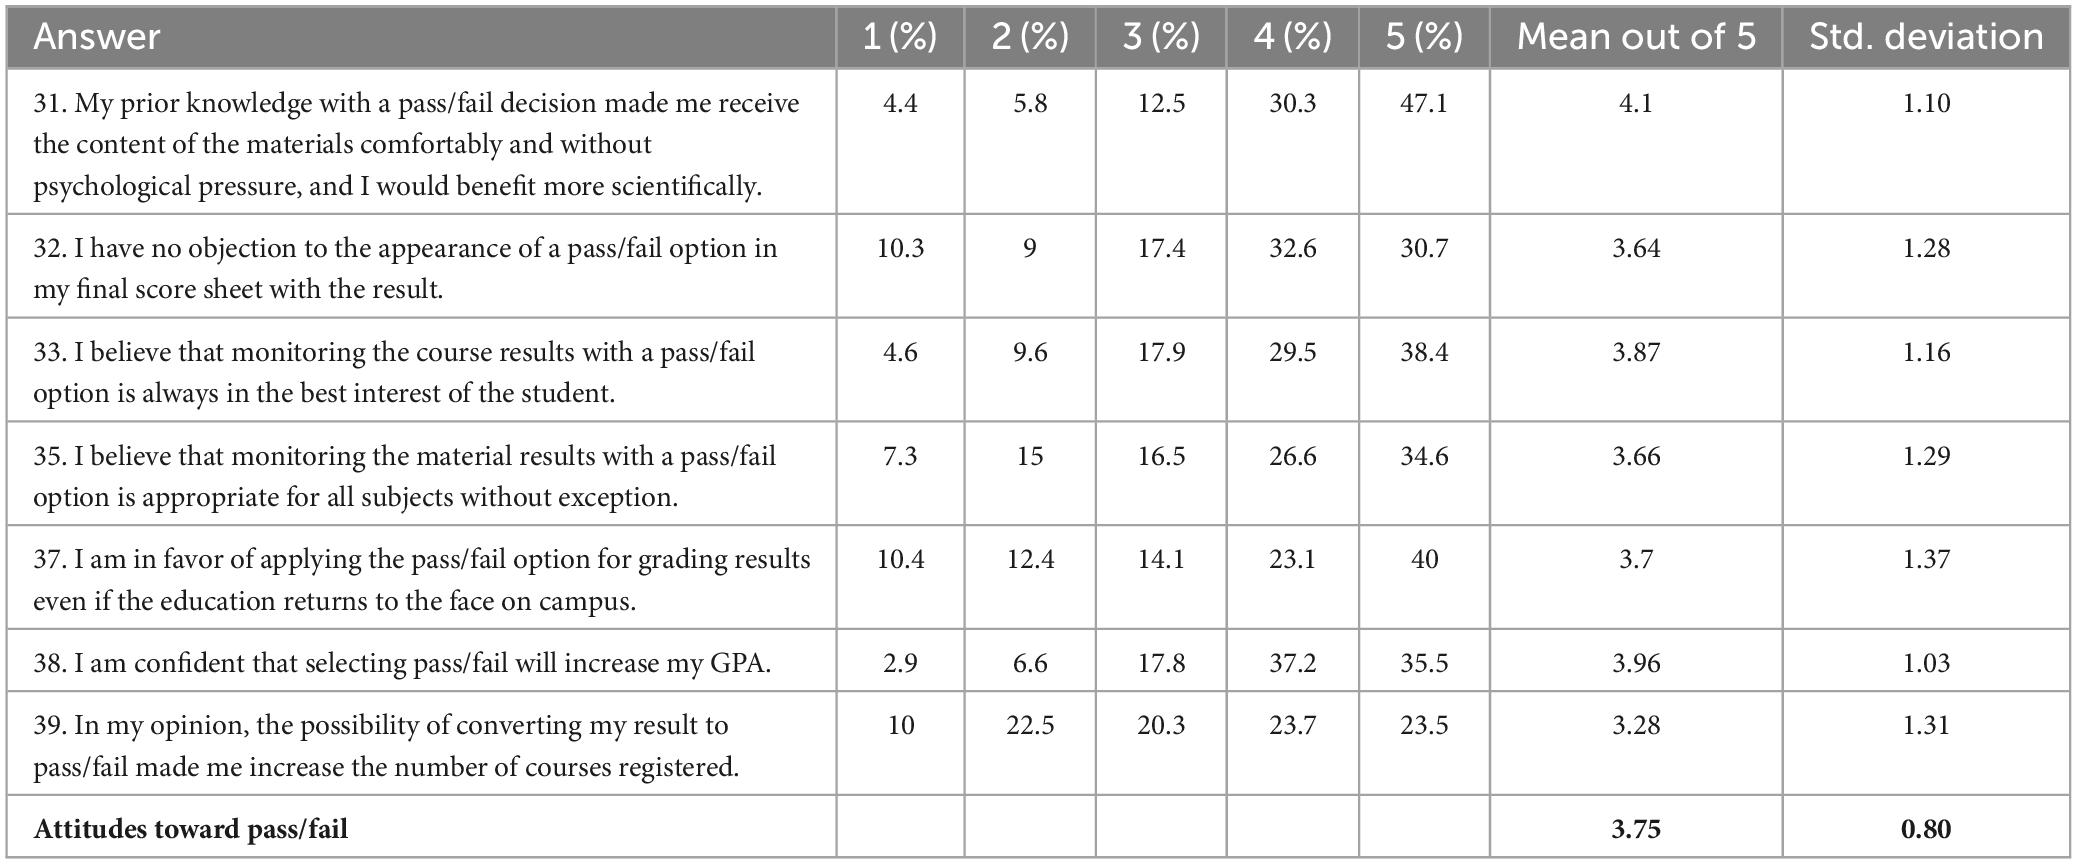
Table 9. The frequencies, means, and standard deviations of scores for questions under the “Attitudes” subscale.
For the Drawbacks subscale of the PFGS, the frequencies, mean scores, and standard deviations of the scores obtained from the answers of the study subjects were extracted and are shown in Table 7.
It can be noted that the mean for all questions ranged between 2.07 and 2.81 for the Drawbacks subscale, with an overall mean of 2.59. The overall evaluation among students is disagreement since the GAW value is equal to 2.59, which is less than 3.
When we look at the frequency percentages, we can see that most participants’ responses were either “disagree” or “strongly disagree” for all questions.
For example, the highest percentage value of 73.7% of the respondents’ answers fell into these two answers (“disagree” and “strongly disagree”) for Question 18. Only 26.36% (8.89% + 9.87% + 7.6%) had other answers.
As for the Reasons subscale for selecting the PFGS, the frequencies, mean scores, and standard deviations of the scores obtained from the answers of the study subjects were extracted and are shown in Table 8.
As shown in Table 8, the mean for all questions ranged from 3.83 to 4.47 for the Reasons subscale, with an overall mean of 4.16. Based on this GAW value, all items were agreed upon among the students.
When we look at frequency percentages, we can see that the majority of participants’ responses were either “agree” or “strongly agree” for all the questions under the Reasons subscale.
As for the Attitudes toward the PFGS subscale, the frequencies, mean scores, and standard deviations of the scores obtained from the answers of the study subjects were extracted and are shown in Table 9.
For example, the highest percentage value of 77.4% of the respondents’ answers fell into these two options (“agree” and “strongly agree”) for Question 31. Only 22.67% (4.4% + 5.78% + 12.49%) had other answers.
To answer the second question: Are there any significant differences atα = 0.05 in students’ perspectives of the PFGS attributed to gender?
According to Peers (2006), if a response variable is normally distributed and is measured for two independent samples of individuals, then an independent t-test can be conducted to test whether there is any statistically significant difference between the means for these two samples. As the normality of the data is violated, a non-parametric analysis, the means, and the standard deviations of the scores on each of the four subscales were calculated separately based on the gender of the subjects. Then, the Mann-Whitney U test for the independent groups was conducted. The results are shown in Table 10.

Table 10. Means, standard deviations, and Z-values of the scores of the study sample on each of the subscales according to gender.
From Table 10, it can be seen that there are significant differences at α = 0.05 in the Drawbacks and Reasons subscales that can be attributed to gender. The differences are in favor of females for both Drawbacks (Z = –5.75, p-value < 0.001), and Reasons (Z = –3.37, p-value < 0.001).
Hence, there are significant differences in the students’ perspectives of the PFGS regarding the Drawbacks and Reasons attributed to gender and in favor of females. For the Advantages and Attitudes subscales, there are no significant differences atα = 0.05. However, the effect size (Z/) was calculated as shown in Table 10. It indicated a very small effect size according to Cohen’s rules, although there was a statistically significant effect of sex.
To answer the third question: Are there any significant differences atα = 0.05 in the students’ perspectives of the PFGS attributed to the school category?
According to Pagano (2012), the analysis of variance is a statistical technique used to analyze multi-group experiments. Using the F-test allows researchers to make one overall comparison that indicates whether there is a significant difference between the means of the groups. As the normality of the data is violated, a non-parametric analysis, K–W test was run to examine if there were differences between the three types of schools on the students’ perspectives of the PFGS. Table 11 shows the results of the analysis.
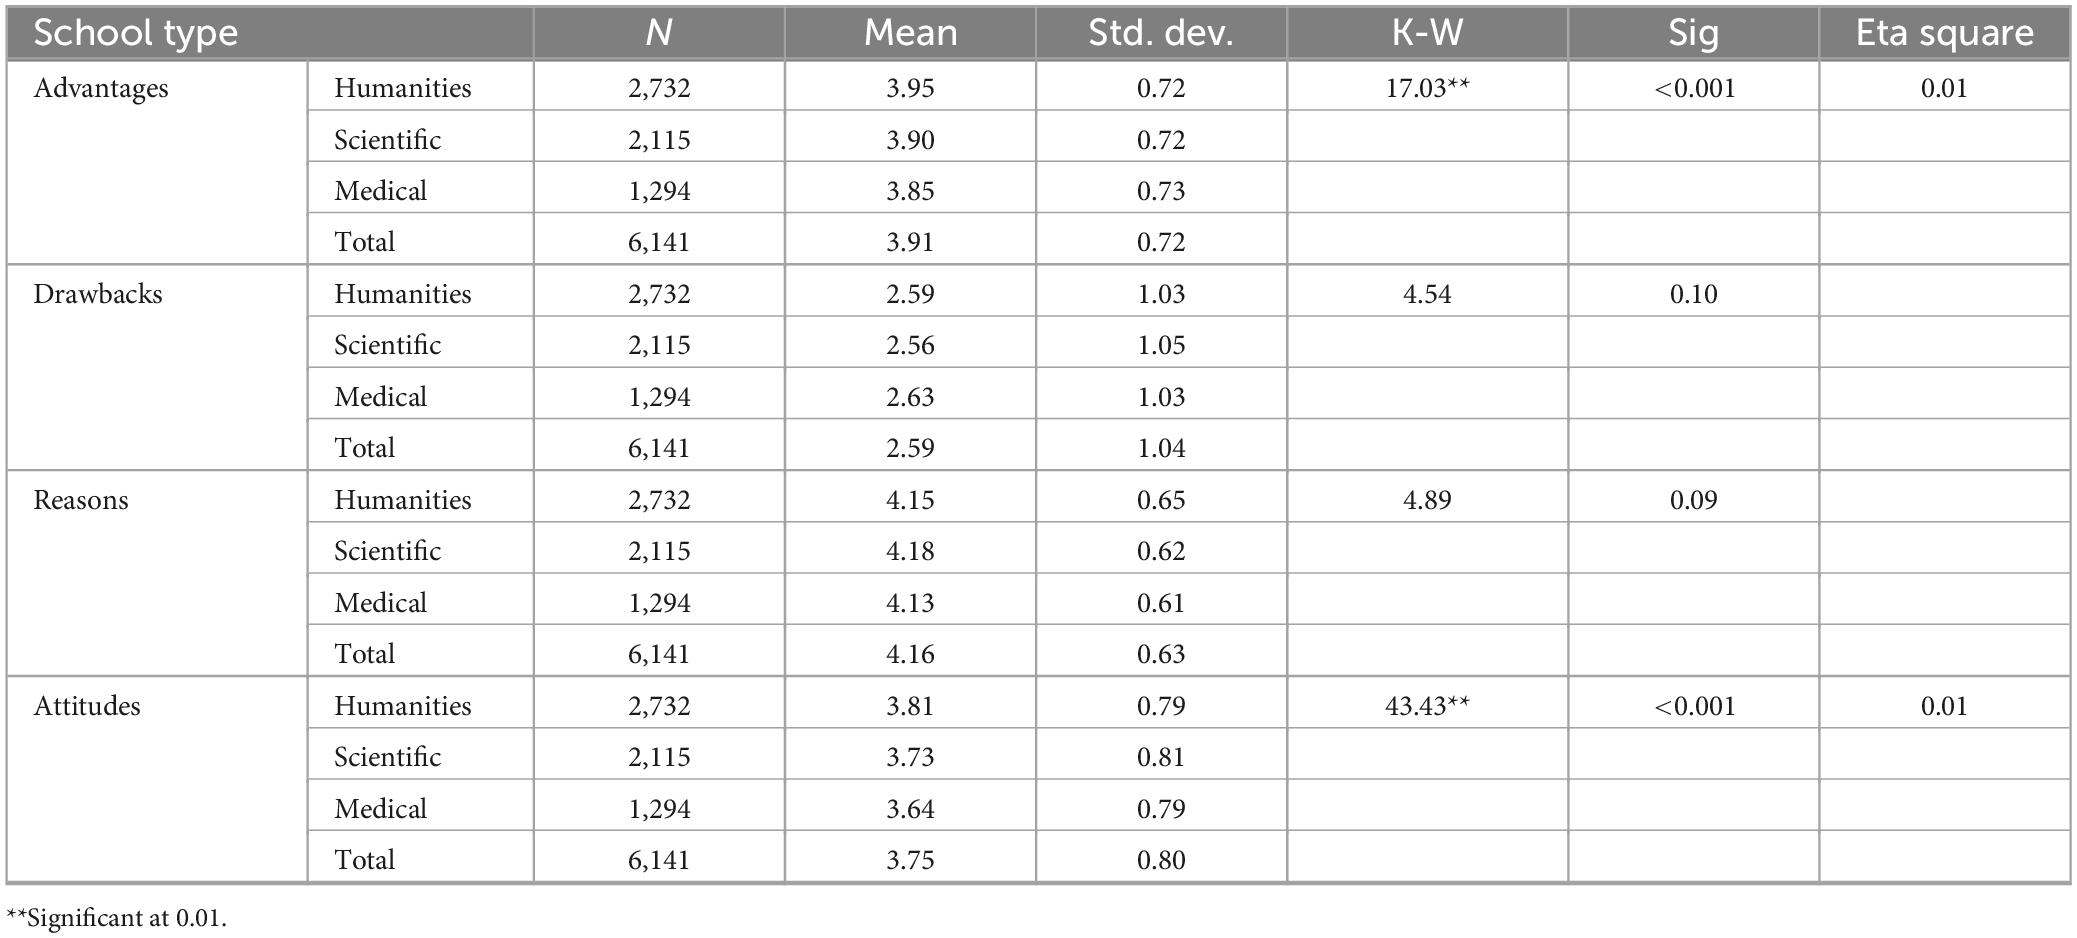
Table 11. Means, standard deviations, and K-W-values of the scores of the study sample on each of the subscales according to school category.
As indicated in Table 11, we can see that the difference was significant for the Advantages and Attitudes subscales, with K–W = 17.03, and 43.43, respectively, at a p-value < 0.001.
As the K-W values are significant, it can be concluded that there are significant differences atα = 0.05 in the students’ perspectives of the PFGS attributed to the school category.
Based on the results recorded in Table 12, Pairwise Comparisons of school type were used as a post-hoc analysis to identify the pairwise significance of differences in the advantages and attitudes subscales. Significance values have been adjusted by the Bonferroni correction for multiple tests. Results are tabulated in Table 12.
Table 12 shows that all pairwise comparisons in the advantages subscale were significant, while one comparison is significant in the attitude subscale (Medical-Humanities). Thus, it can be concluded that humanities schools caused significant differences in students’ perspectives toward using the PFGS when compared with other schools. Effect size using the eta squared statistic was calculated (H-k + 1)/(n-k), as shown in Table 10. It indicated a very small effect size according to Cohen’s rules, although there was a statistically significant effect of the school category.
To answer the fourth question: Are there any significant differences at α = 0.05 in students’ perspectives of using the PFGS attributed to academic level?, the mean and the standard deviations of scores for each of the subscales were calculated according to the academic level of the participants, and then Kruskal-Wallis Test was conducted to analyze the differences in students’ perspectives of the PFGS attributed to academic level. Table 11 shows the results of the analysis.
It is noted that the mean ranks were significant for the Advantages and Drawbacks subscales, with K-W = 28.15 and 52.58, respectively, at p < 0.001.
Based on the results recorded in Table 13, pairwise comparisons of the academic level were used as a post-hoc analysis to identify the pairwise significance of differences in the Advantages and Drawbacks subscales. Significance values have been adjusted by the Bonferroni correction for multiple tests. Results are tabulated in Table 14.
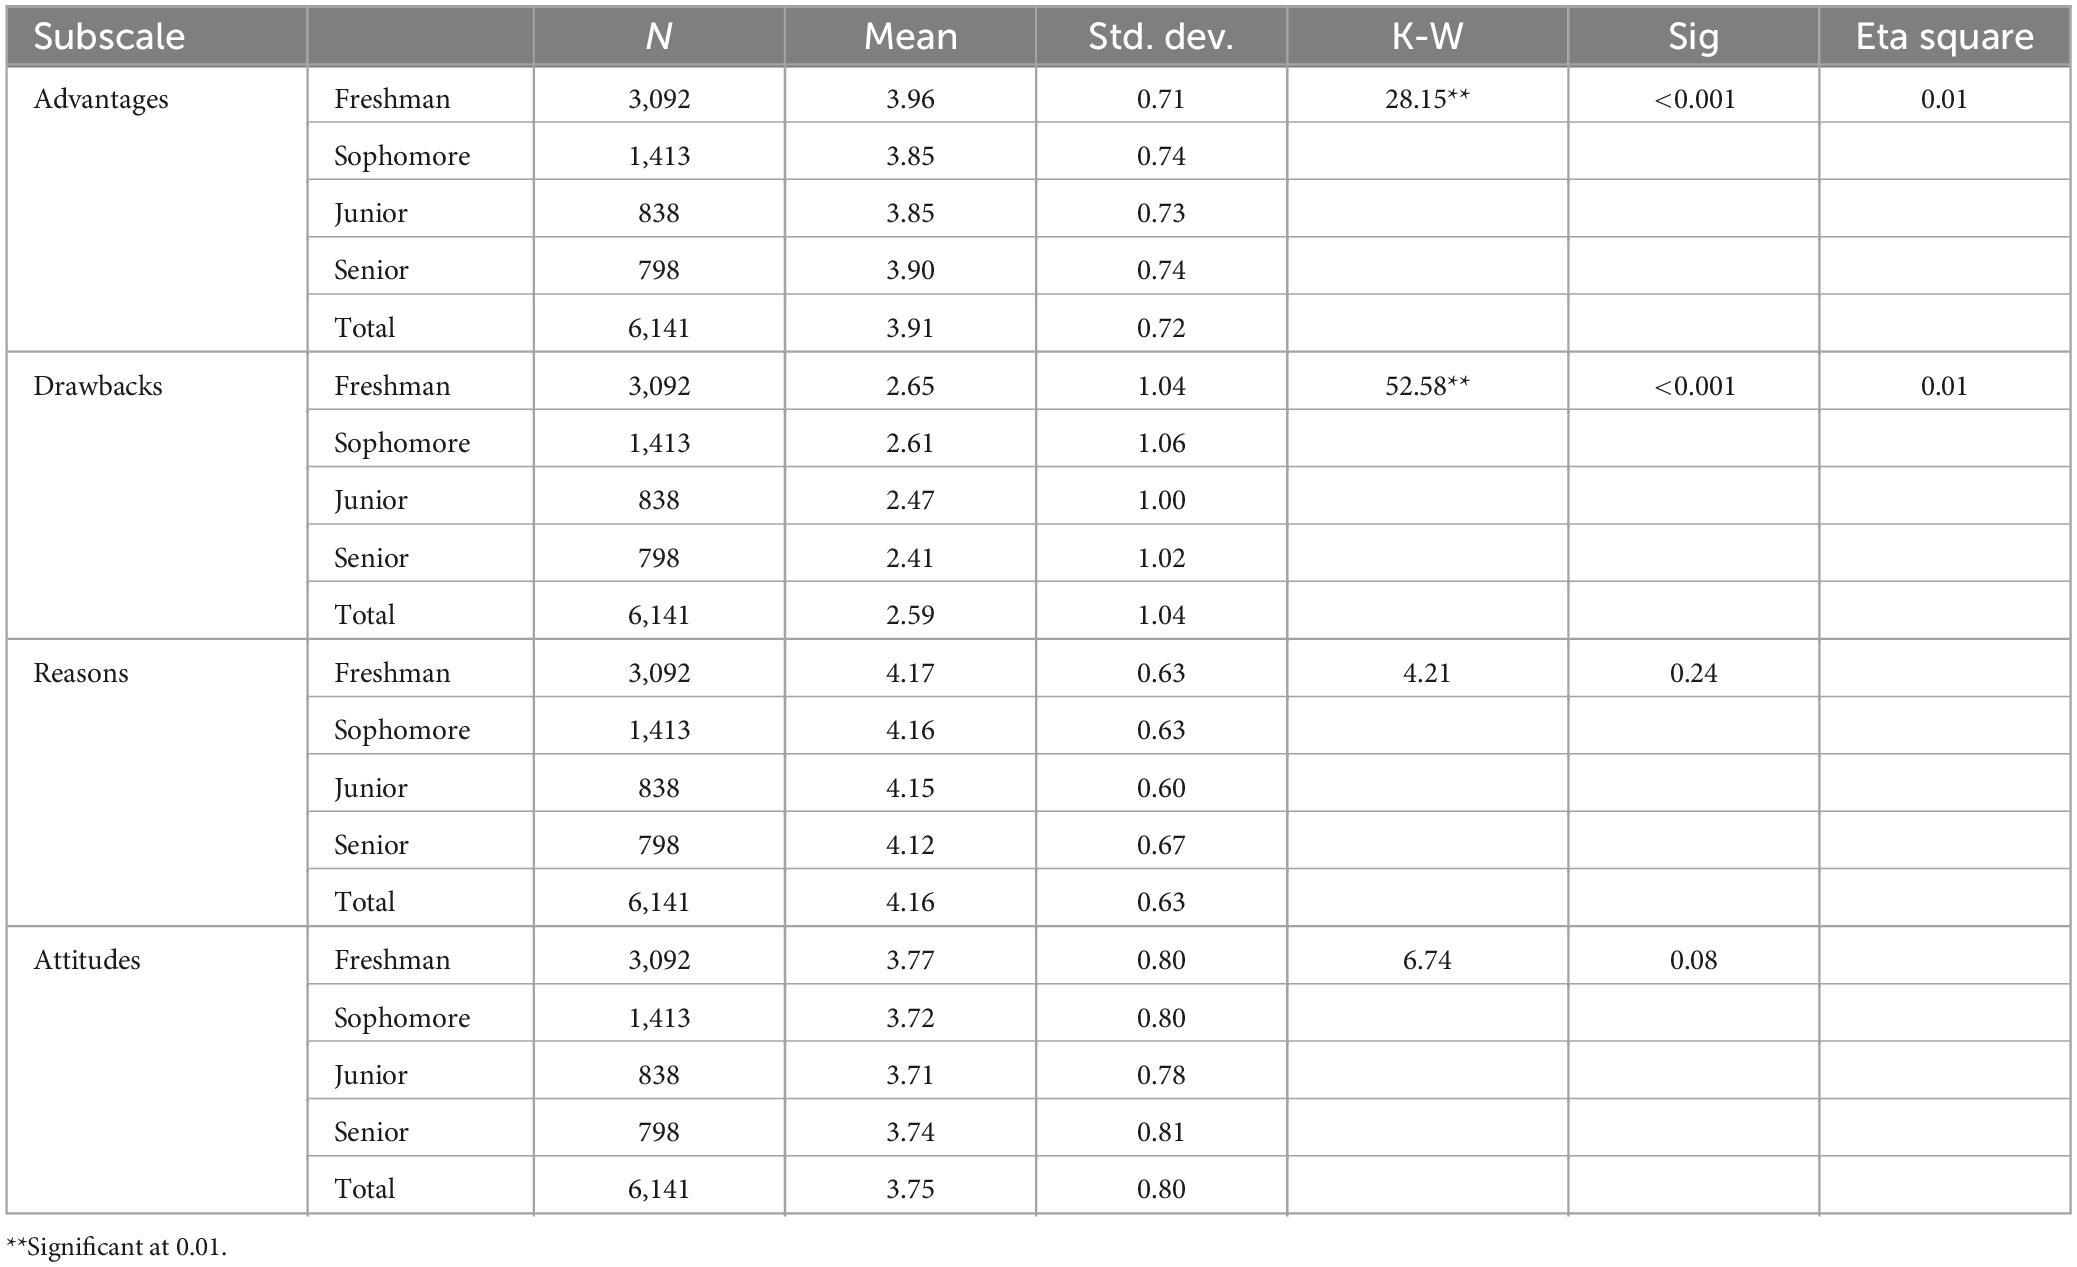
Table 13. Means, standard deviations, and K-W values of the scores of the study sample members on each of the subscales and the total score according to academic level.
Table 14 shows that the following pairwise comparisons in the advantages subscale were significant: Sophomore – Freshman, Junior – Freshman, while the significant pairwise comparisons in the drawback subscale were (Senior – Sophomore, Senior – Freshman, Junior – Sophomore, and Junior - Freshman). Effect size using the eta squared statistic was calculated (H-k + 1)/(n-k), as shown in Table 13. It indicated a very small effect size according to Cohen’s rules, although there is a statistically significant effect on the academic level.
To answer the fifth question: Is there any significant correlation at α = 0.05 between GPA and students’ perspectives of the PFGS?, the Spearman correlation coefficient (r) was used to correlate the scores between students’ GPA and their perspectives on the PFGS. Tables 15–18 show the results for the four subscales.
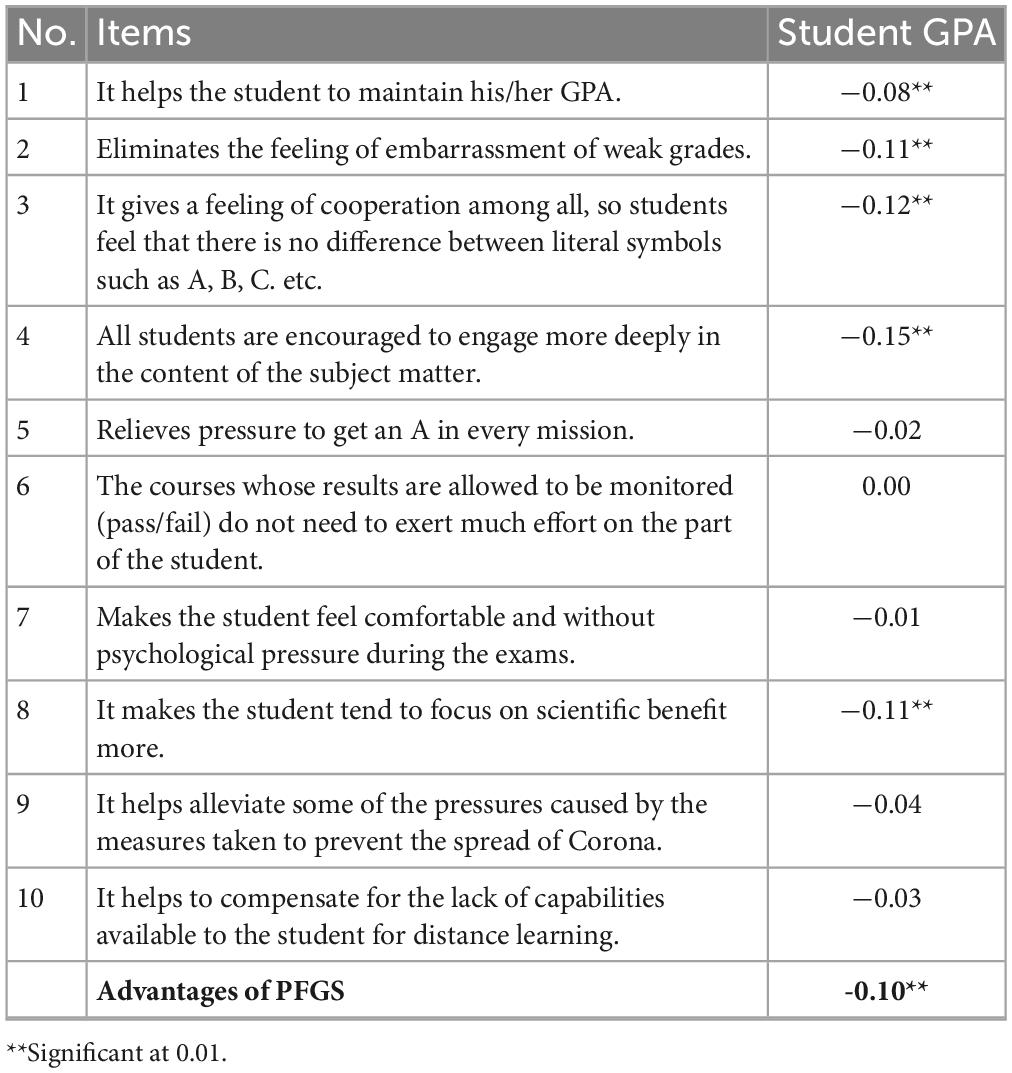
Table 15. Spearman correlation coefficient between students’ GPA and their perspectives of the PFGS based on the Advantages subscale.
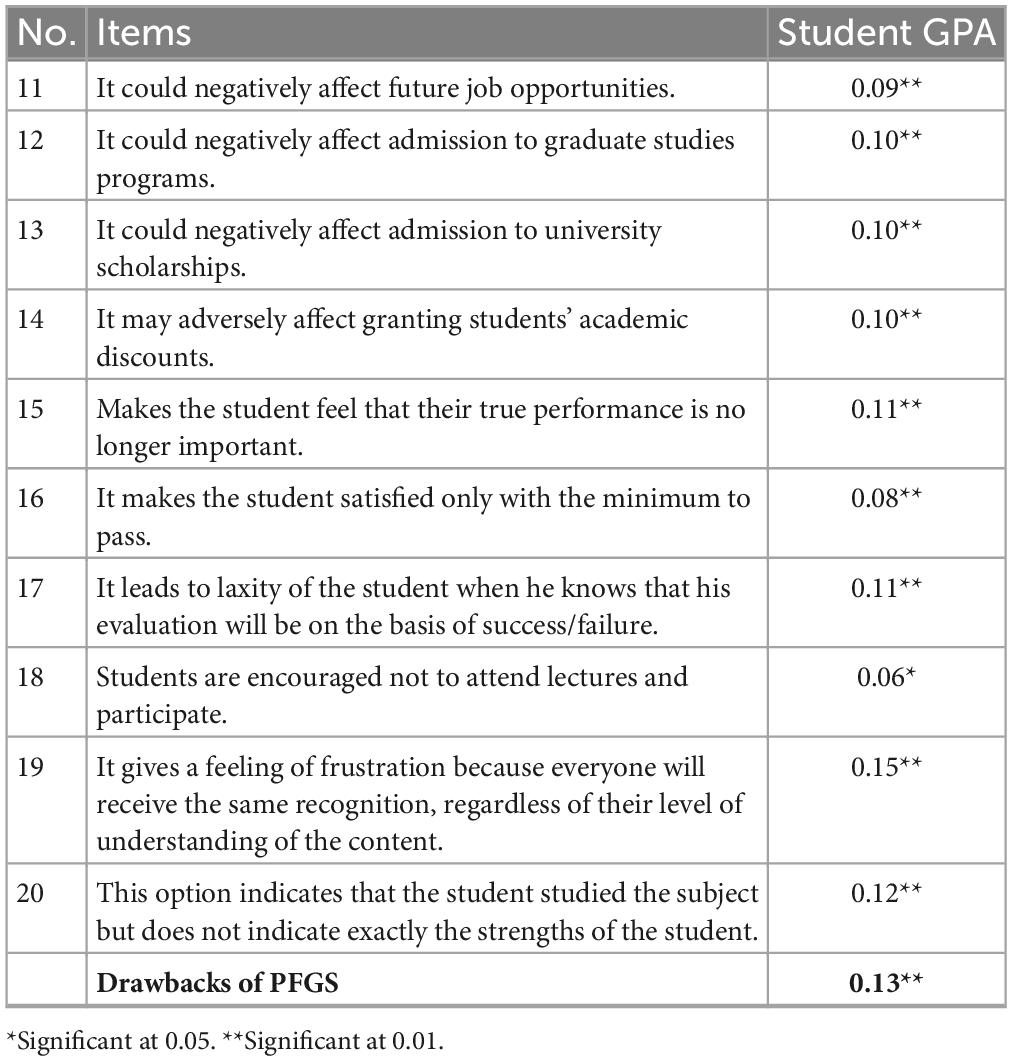
Table 16. Spearman correlation coefficient between the GPA and students’ perspectives of the PFGS based on the Drawbacks subscale.
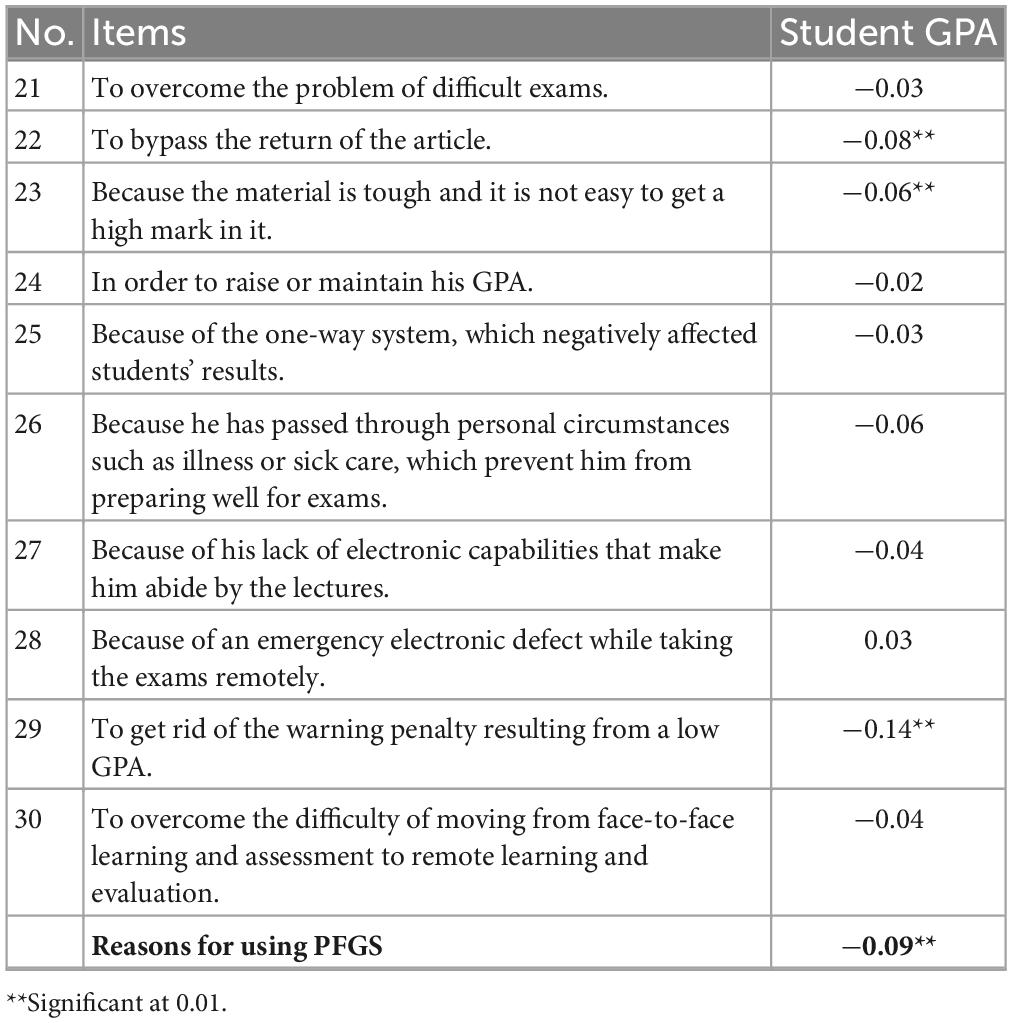
Table 17. Spearman correlation coefficient between the GPA and students’ perspectives on the PFGS based on the Reasons subscale.
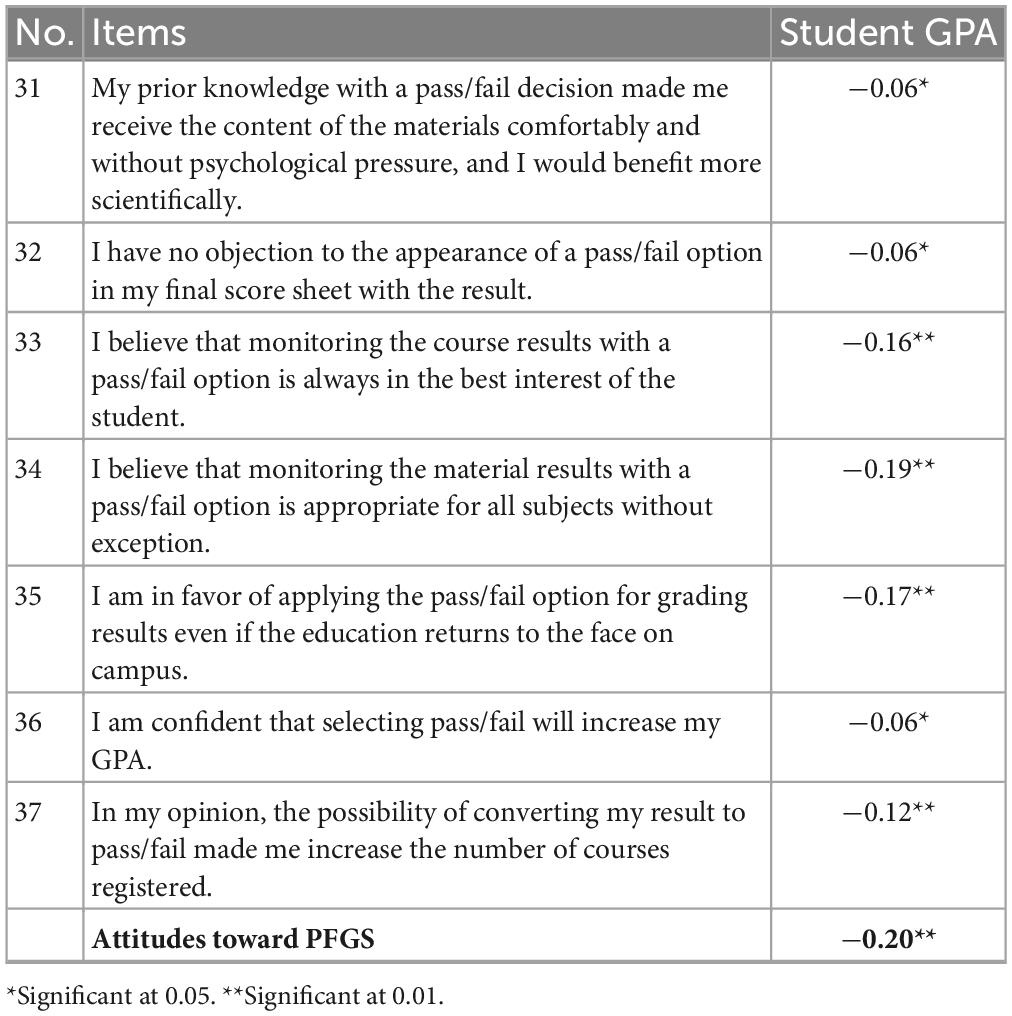
Table 18. Spearman correlation coefficient between the GPA and students’ perspectives of the PFGS based on the Attitudes subscale.
As can be seen in Table 15, the Spearman correlation coefficients ranged from 0.01 to 0.15 for the Advantages subscale. Although these are weak, they indicate a negative significant correlation. The scatter plot in Supplementary Appendix F shows a decreasing relationship. It shows that as the GPA of students increases, their perceptions about PFGS advantages decrease. The determination coefficients for all these Spearman correlation coefficients were also weak, ranging between 0.00 and 0.03. The values indicate a very low explained variance between these two variables.
For the Drawbacks subscale, Table 16 shows that Spearman correlation coefficients range from 0.06 to 0.15. Although these values are also weak, they indicate a positive significant correlation. The scatter plot in Supplementary Appendix G shows an increasing relationship. It shows that as the GPA of students increases, their perceptions about PFGS Drawbacks increase. The determination coefficients for all these Spearman correlation coefficients were also weak, ranging between 0.00 and 0.02. The values indicate a very low explained variance between these two variables.
For the Reason subscale (see Table 17), Pearson correlation coefficients ranged from 0.02 to 0.14, which indicates a negative significant correlation. The scatter plot in Supplementary Appendix H shows a decreasing relationship. It shows that as the GPA of students increases, their perceptions about PFGS reasons decrease. The determination coefficients for all these Pearson correlation coefficients were also weak, ranging between 0.00 and 0.02. The values indicate a very low explained variance between these two variables.
For the Attitudes subscale (see Table 18), Spearman correlation coefficients ranged from 0.06 to 0.19, indicating a negative significant correlation. The scatter plot in Supplementary Appendix I shows a decreasing relationship. It shows that as the GPA of students increases, their attitudes toward PFGS decrease. The determination coefficients for all these Spearman correlation coefficients were also weak, ranging between 0.00 and 0.04. The values indicate a very low explained variance between these two variables.
In summary, with regard to the relationship between students’ GPA and their perspectives on the PFGS, the correlation coefficients indicated a weak but significant correlation. The correlation values were negative between GPA and Advantages, Reasons, and Attitudes, but positive between GPA and Drawbacks. This could be attributed to the finding that the higher the GPA, the lower the approval on these subscales. In the Drawbacks subscale, the correlation was positive.
This study was conducted during the COVID-19 pandemic in the second semester of the 2020/2021 Academic Year. It was limited to undergraduate students at four government universities in different places in Jordan. However, we think that the results we achieved could be valid for postgraduate students as well, this is due to the fact that all levels of students faced the same circumstances during the COVOD-19 pandemic.
In addition, this study utilized a cross-sectional online survey that was conducted among the students’ population. The survey was developed to evaluate the students’ perspectives about the PFGS option during online learning. Therefore, some limitations involving cross-sectional data collection were encountered, which inevitably restricted the generalizability of the study outcomes. Future studies could gather qualitative data for a deeper understanding of these perspectives. This study relied on three categorical variables to compare students’ perspectives: sex, school type, and academic level. As such, future studies should incorporate more personal variables that may influence perspectives on the PFGS option.
From another perspective other than students; we felt that the instructors were agreeing on the results achieved in this study as they were very close to students during the pandemic, chatting at almost all times.
On the other hand, we believe that adding a set of long-term procedures will help avoid any unexpected panic. As such, adding a set of quality assurance procedures for current and future pandemic scenarios will be helpful, i.e., solutions to problems should not be temporary; instead, they should be permanent. In other words, whenever possible, academic institutes should always be proactive, not only reactive.
In academic environments where students are the main clients, we believe that students should be part of making proper decisions. We did our best in this research to present the most important factors affecting the PFGS, even though there might be other ones. Our recommendations are as follows:
1. Set clear criteria and principles for using the PFGS if the intention is to continue using it.
2. Activate student counseling programs to educate students about the conditions that may affect the success and failure system
3. Limit the number of pass/fail credits students can apply toward their degree.
4. Create awareness among students regarding the advantages and drawbacks of this system and the difficulties that may prevent it from being implemented by universities.
5. Conduct further studies on the factors affecting the use of this system.
In a sample of 6,404 bachelor’s degree students who were enrolled in four Jordanian universities during the 2020/2021 Academic Year, a questionnaire for evaluating students’ feedback about the PFGS was applied. In its final version, the questionnaire consisted of 37 questions distributed among four subscales, and 6,141 valid responses were collected. The study seeks to fulfill the following aims: assess students’ perspectives about the PFGS; see the effect of students’ gender on their perspectives about PFGS; assess the effect of students’ school categories on their perspectives about the PFGS; assess the effect of students’ academic level on their perspectives about the PFGS; and assess the relationship between students’ GPA and their perspectives about the PFGS.
The results showed that students agreed with all items of the Advantages subscale (except for one item), the Reasons subscale, and the Attitudes subscale, while students disagreed with all items of the Drawbacks subscale. The majority of participants answered “agree” and “strongly agree” for all questions of the Advantages, Reasons, and Attitudes subscales. On the other hand, the majority of participants answered “disagree” and “strongly disagree” for all questions of the Drawbacks subscale. These results could be attributed to the students’ beliefs that they either need to return to the university campus to receive a direct and quality education or should be offered the PFGS as an option so that their cumulative average will not be negatively affected by the inability of the university to provide suitable e-learning services for them and the absence of adequate e-learning tools for many of them. They requested to use the PFGS because their exams were online and distance learning, in its current form, is unfair according to their opinions, and they face limitations of direct communication with their university professors. They indicated that 100% of their lectures were conducted through distance learning.
The results also showed that there were significant differences at α = 0.05 in some of the subscales of students’ perspectives on the PFGS attributed to gender, school category, and academic level. Female scores were higher than male scores in the Drawbacks and Reasons subscales. On the other hand, humanities students showed a higher degree of agreement (“agree”) regarding the PFGS compared to those in medicine. This could be attributed to the fact that medical students think that the PFGS is an unacceptable choice, as it has an impact on school accreditation and prevents them from exercising their right to have their grades calculated and considered.
The results also indicated that freshman students showed a higher degree of agreement toward applying the PFGS compared to sophomore, junior, and senior students. This could be attributed to their interest in getting higher cumulative averages and their fear of getting low GPAs, which are factors that will affect them in the future. It seemed that students with higher levels of cognitive and emotional development were more aware of their perceptions of academic issues compared to the freshman and sophomore students. Perhaps students at the later academic levels (junior and senior students) possessed a more realistic view of the academic options and the impact of these options on their future and their working lives.
Regarding the relationship between GPA and students’ perspectives on the PFGS, it was clear that the correlation coefficients indicated weak but significant correlations. The correlation values were negative between GPA and Advantages, Reasons, and Attitudes, but positive between GPA and Drawbacks, which could be attributed to our finding that students with higher GPAs gave lower approval on these subscales.
The original contributions presented in this study are included in the article/Supplementary material, further inquiries can be directed to the corresponding author.
RA-S conceptualized basic idea, designed the questionnaire, designed the method, analyzed the results, and wrote the manuscript. FA designed the questionnaire, designed the method, analyzed the results, and wrote the manuscript. MI, DS, SA, and AA collected data and literature review and wrote the manuscript. All authors contributed to the article and approved the submitted version.
The authors declare that the research was conducted in the absence of any commercial or financial relationships that could be construed as a potential conflict of interest.
All claims expressed in this article are solely those of the authors and do not necessarily represent those of their affiliated organizations, or those of the publisher, the editors and the reviewers. Any product that may be evaluated in this article, or claim that may be made by its manufacturer, is not guaranteed or endorsed by the publisher.
The Supplementary Material for this article can be found online at: https://www.frontiersin.org/articles/10.3389/feduc.2023.1186535/full#supplementary-material
Castro, M., Choi, L., Knudson, J., and O’Day, J. (2020). Grading Policy in the Time of COVID-19: 89 Considerations and Implications for Equity. San Mateo, CA: California Collaborative on District Reform. California Collaborative on District Reform.
Cumming, T., Miller, M. D., Bergeron, J., and deBoer, F. (2020). Ensuring Fairness in Unprecedented Times: Grading Our Nation’s Students. Urbana, IL: University of Illinois and Indiana University, National Institute for Learning Outcomes Assessment (NILOA).
Dietrick, J. A., Weaver, M. T., and Merrick, H. W. (1991). Pass/fail grading: a disadvantage for students applying for residency. Am. J. Surg. 162, 63–66. doi: 10.1016/0002-9610(91)90204-Q
Dignath, C., Buettner, G., and Langfeldt, H. P. (2008). How can primary school students learn self-regulated learning strategies most effectively: a meta-analysis on self-regulation training programmes. Educ. Res. Rev. 3, 101–129. doi: 10.1016/j.edurev.2008.02.003
Ebel, R., and Frisbie, D. (1986). Essentials of Education Measurement. Englewood Cliffs, NJ: Prentice-Hall.
Gallardo-Vázquez, D., Valdez-Juárez, L. E., and Lizcano-Álvarez, J. L. (2019). Corporate social responsibility and intellectual capital: sources of competitiveness and legitimacy in organizations’ management practices. Sustainability 11:5843. doi: 10.3390/su11205843
Gamage, K. A., Pradeep, R. G. G., Najdanovic-Visak, V., and Gunawardhana, N. (2020). Academic standards and quality assurance: the impact of COVID-19 on university degree programs. Sustainability 12:10032. doi: 10.3390/su122310032
Gold, R. M., Reilly, A., Silberman, R., and Lehr, R. (1971). Academic achievement declines under pass-fail grading. J. Exp. Educ. 39, 17–21. doi: 10.1080/00220973.1971.11011260
Guo, R., and Muir, J. (2008). Toronto’s honours/pass/fail debate: the minority position. Univ. Toronto Med. J. 85, 95–98.
Hulin, C., Netemeyer, R., and Cudeck, R. (2001). Can a reliability coefficient be too high? J. Consumer Psychol. 10, 55–58. doi: 10.1207/S15327663JCP1001&2_05
Joshi, A., Haidet, P., Wolpaw, D., Thompson, B. M., and Levine, R. (2018). The case for transitioning to pass/fail grading on psychiatry clerkships. Acad. Psychiatry 42, 396–398. doi: 10.1007/s40596-017-0844-8
Maxwell, G. (2021). COVID-19: The Pandemic’s Impact on Grading Practices and Perceptions at the High School Level. MA thesis, San Marcos, CA: California State University San Marcos.
McLaughlin, G. W., Montgomery, J. R., and Delohery, P. D. (1972). A statistical analysis of a pass-fail grading system. J. Exp. Educ. 41, 74–77. doi: 10.1080/00220973.1972.11011376
McMorran, C., Ragupathi, K., and Luo, S. (2017). Assessment and learning without grades? motivations and concerns with implementing gradeless learning in higher education. Assess. Eval. Higher Educ. 42, 361–377. doi: 10.1080/02602938.2015.1114584
Melrose, S. (2017). Pass/fail and discretionary grading: a snapshot of their influences on learning. Open J. Nursing 7, 185–192. doi: 10.4236/ojn.2017.72016
Ministry of Higher Education and Scientific Research (2020). Urgent / The Higher Education Council Makes Important Decisions. Egypt: Ministry of Higher Education and Scientific Research.
Pagano, R. R. (2012). Understanding Statistics in the Behavioral Sciences. Boston, MA: Cengage Learning.
Peers, I. (2006). Statistical Analysis for Education and Psychology Researchers: Tools for Researchers in Education and Psychology. England: Routledge. doi: 10.4324/9780203985984
Quacquarelli Symonds (2020). The Impact of the Coronavirus on Global Higher Education. London: Quacquarelli Symonds.
Ramaswamy, V., Veremis, B., and Nalliah, R. P. (2020). Making the case for pass-fail grading in dental education. Eur. J. Dental Educ. 24, 601–604. doi: 10.1111/eje.12520
Reddan, G. (2013). To grade or not to grade: student perceptions of the effects of grading a course in work- integrated learning. Asia-Pacific J. Cooperative Educ. 14, 223–232.
Rohe, D. E., Barrier, P. A., Clark, M. M., Cook, D. A., Vickers, K. S., and Decker, P. A. (2006). The benefits of pass-fail grading on stress, mood, and group cohesion in medical students. Mayo Clinic Proceed. 81, 1443–1448. doi: 10.4065/81.11.1443
Spring, L., Robillard, D., Gehlbach, L., and Moore Simas, T. A. (2011). Impact of pass/fail grading on medical students’ well-being and academic outcomes. Med. Educ. 45, 867–877. doi: 10.1111/j.1365-2923.2011.03989.x
Strø,mme, T. J. (2019). “Pass/fail grading and educational practices in computer science,” in Proceedings of the Norsk IKT- Konferanse for Forskning og Utdanning. Available online at: https://ojs.bibsys.no/index.php/NIK/article/view/724
Thompson-Whiteside, S. (2013). Assessing academic standards in Australian higher education. Tertiary Educ. Policy Australia 12, 39–58.
Ursachi, G., Horodnic, I. A., and Zait, A. (2015). How reliable are measurement scales? external factors with indirect influence on reliability estimators. Proc. Econ. Finance 20, 679–686. doi: 10.1016/S2212-5671(15)00123-9
Wang, L. (2014). Quality assurance in higher education in China: control, accountability and freedom. Policy Soc. 33, 253–262. doi: 10.1016/j.polsoc.2014.07.003
Keywords: pass/fail grading system (PFGS), gradeless system, online learning, synchronous learning, asynchronous learning, hybrid learning, pedagogical issues, evaluation methodologies
Citation: Al-Sayyed R, Abu Awwad F, Itriq M, Suleiman D, AlSaqqa S and AlSayyed A (2023) The pass/fail grading system at Jordanian universities for online learning courses from students’ perspectives. Front. Educ. 8:1186535. doi: 10.3389/feduc.2023.1186535
Received: 14 March 2023; Accepted: 02 May 2023;
Published: 19 May 2023.
Edited by:
Dheeb Albashish, Al-Balqa Applied University, JordanReviewed by:
Qasem Al-Tashi, University of Texas MD Anderson Cancer Center, United StatesCopyright © 2023 Al-Sayyed, Abu Awwad, Itriq, Suleiman, AlSaqqa and AlSayyed. This is an open-access article distributed under the terms of the Creative Commons Attribution License (CC BY). The use, distribution or reproduction in other forums is permitted, provided the original author(s) and the copyright owner(s) are credited and that the original publication in this journal is cited, in accordance with accepted academic practice. No use, distribution or reproduction is permitted which does not comply with these terms.
*Correspondence: Rizik Al-Sayyed, ci5hbHNheXllZEBqdS5lZHUuam8=
Disclaimer: All claims expressed in this article are solely those of the authors and do not necessarily represent those of their affiliated organizations, or those of the publisher, the editors and the reviewers. Any product that may be evaluated in this article or claim that may be made by its manufacturer is not guaranteed or endorsed by the publisher.
Research integrity at Frontiers

Learn more about the work of our research integrity team to safeguard the quality of each article we publish.