 Travis Weiland
- Department of Curriculum and Instruction, University of Houston, Houston, TX, United States
Introduction: A robust understanding of statistics has become crucial in our data centric societies. In the school setting the teaching of statistics is situated within the mathematics curriculum in the U.S. However, many mathematics teachers often have little to no past experiences with statistics before teaching it. Given such circumstances, textbooks likely play a strong role influencing the statistics curriculum teachers enact for students. In this study, I investigate how the discourse of two common high school textbook series form what the actions are for doing statistics.
Methods: For this study I used a Foucauldian discourse analysis to inductively analyze the texts for the actions they create.
Results: One of the main results of the study was that the actions are very routinized/algorithmic in nature. Furthermore, most actions were associated with analyzing data. I also contrast the findings of the analysis to the discourse of the field of statistics education, namely through the Guidelines for Assessment and Instruction in Statistics Education, which highlighted some significant absences including statistical questions to drive investigation and discussion of collecting data.
Discussion: The findings have implications for teacher education in terms of topics to focus teachers’ attention on and to help provide them further support with teaching to their students.
1. Introduction
We live in an information age where data is constantly being collected, analyzed, interpreted, and communicated in an effort to better understand the world, inform others, and to influence people’s views and decisions. The consideration of data now influences almost every facet of our daily lives. Statistics, which is often considered the science of data (Davidian and Louis, 2012), has become a crucial discipline for individuals to have robust experiences with, in order to make sense of and engage in, the increasingly data-centric world we all live. Steen (2001) over two decades ago pointed out that society is “drenched in data.” Since then technological innovations have only accelerated this trend to a point where one might say we are now “drowning in data.” Therefore, an important question for K-12 education stakeholders is, how to prepare future generations to not only make sense of, but to thrive in and transform, such data-centric societies.
In the K-12 setting, the teaching of statistics is generally situated in the mathematics curriculum in the U.S. [National Council of Teachers of Mathematics (NCTM), 2000; National Governors Association Center for Best Practices (NGA Center) and Council of Chief State School Officers (CCSSO), 2010]. This is in contrast to a disciplinary perspective where statistics and mathematics are overlapping, but distinct disciplines. Key disciplinary differences also lead to differences in how statistics is suggested to be taught (Cobb and Moore, 1997; Franklin et al., 2007; Groth, 2017), which I discuss later.
The teaching of statistics in K-12 education is not a new phenomenon in the U.S. However, the push to teach statistics to all students, is recent (Scheaffer and Jacobbe, 2014). The shift to teaching all students concepts of statistics has also come with its challenges. For example, the preparation of mathematics teachers has been slow to pivot to provide experiences for future mathematics teachers to learn statistics or how to teach statistics, and many current mathematics teachers report having limited past experiences learning or using statistics themselves, to draw upon to shape and guide their instruction (Shaughnessy, 2007; Conference Board of the Mathematical Sciences, 2012; Franklin et al., 2015). Given this issue, along with the increased emphasis on statistics at the middle and high school levels by the Common Core State Standards for Mathematics [CCSSM; National Governors Association Center for Best Practices (NGA Center) and Council of Chief State School Officers (CCSSO), 2010], teachers may need to rely heavily upon written curriculum for planning and enacting their instruction of statistics concepts.
Past research has found that the written curriculum that teachers use, influences the instruction they enact, which their students experience directly (Stein et al., 2007; Remillard and Heck, 2014). This means that written curriculum likely influences the types of experiences students have with statistics. To investigate what experiences with statistics are created by written curriculum for students, I investigated what practices of statistics two popular high school mathematics textbook series create opportunities for students to experience. The textbooks were analyzed inductively using a Foucauldian discourse analysis (FDA) to see what opportunities to learn are created by the texts. FDA is not commonly used in mathematics education but has become more common with sociopolitical researchers in the field who seek to uncover and critique discourses (Kollosche, 2016). I use FDA in this way to first see what discourse is created by the texts for students to take up and then I critique those inductive findings by contrasting them to policy recommendations on how statistics should be taught in the widely endorsed Guidelines for Assessment and Instruction in Statistics Education (GAISE II; Bargagliotti et al., 2020). I end by providing discussion of implications of the findings for teacher education and curriculum developers.
2. Background
2.1. Statistics and statistical enquiry
To situate and rationalize this study I begin by discussing the relationship between mathematics and statistics before later delving into statistics position in the mathematics curriculum. Statistics as a discipline only formally came into fruition in the 18th century; forming out of disciplines such as demography, the natural sciences and astronomy (Stigler, 1986; Katz, 2009). It was born out of a need to make sense of and organize large aggregates of measurements such as numbers of people, births, deaths, changes in the location of stars in the night sky, etc. As Cobb and Moore (1997) state, “statistics is a methodological discipline. It exists not for itself but rather to offer other fields of study a coherent set of ideas and tools for dealing with data” (p. 801). In this sense, statistics is very much an empirical discipline.
Wild and Pfannkuch (1999), in their foundational study investigating the thought process of statistical enquiry by statisticians, constructed a four-dimension framework that includes an investigative cycle, types of thinking, an interrogative cycle, and dispositions. The investigative cycle of statisticians, described by Wild and Pfannkuch (1999), includes five aspects: a problem that can be answered by data, planning how to tackle the problems and collect data to investigate it, collecting data and cleaning it, analyzing data to make sense of the problems, and finally conclusions to interpret the analysis findings and communicate such findings. The investigative cycle was later taken up, and modified, in the GAISE framework (Franklin et al., 2007) where it is referred to as the statistical investigative process. The types of thinking are group into two categories: general (strategic, seeking explanations, modeling, applying techniques) and fundamental to statistical thinking (recognition for need of data, transnumeration [“changing representations to engender understanding” (Wild and Pfannkuch, 1999, p. 226)], consideration of variation, reasoning with statistical models, integrating the statistical and contextual). The interrogative cycle includes generate possibilities, seek information and ideas, interpret, criticize, and judge. The use of this cycle in conjunction with the investigative cycle has been used in middle school classroom settings with some success (Cannon, 2020). The dispositions of statisticians in statistical enquiry include skepticism, imagination, curiosity and awareness, openness, a propensity to seek deeper meaning, being logical, engagement, and perseverance. Wild and Pfannkuch (1999) describe that all of these aspects of statistical enquiry occur simultaneously. Of particular interest to this study is the investigative cycle, which describes “the way one acts and what one thinks about during the course of a statistical investigation” (Wild and Pfannkuch, 1999, p. 225), because the actions that students are positioned to take up for the doing of statistics are the specific focus of this study. Furthermore, it is the investigative cycle that has been taken up in GAISE II (Bargagliotti et al., 2020) as part of the core structure of its recommendations for what should be taught as statistics, in K-12 education.
Though both mathematics and statistics are part of the mathematical sciences, statistics is its own distinct discipline not a sub-discipline or branch of mathematics (Cobb and Moore, 1997; Franklin et al., 2007; Gattuso and Ottaviani, 2011; Groth, 2013). As Steen (2001) points out, “although each of these subjects shares with mathematics many foundational tools, each has its own distinctive character, methodologies, standards, and accomplishments” (p. 4). Statistics relies heavily on mathematics, but there are distinct practices and habits of mind in statistics that are non-mathematical (Groth, 2007, 2013). Part of this reliance is through probability, which is necessary for statistical inference, and firmly a part of mathematics (Fienberg, 1992). There is a strong literature base that discusses important differences that should be considered between the discipline of mathematics and statistics in undergraduate and school settings (Cobb and Moore, 1997; Scheaffer, 2006; Franklin et al., 2007, 2015; Groth, 2007, 2015; Gattuso and Ottaviani, 2011; Usiskin, 2014). The most prominently discussed differences include the treatment of context, variability, inductive versus deductive reasoning, and uncertainty. In spite of these differences, many scholars support the location of teaching statistics, in the mathematics curriculum (Scheaffer, 2006; Gattuso and Ottaviani, 2011). However, some scholars point out it should be distributed cross the teaching of all disciplines (Usiskin, 2014).
2.2. Statistics in written mathematics curriculum
It is very difficult to discuss school mathematics curriculum in the U.S. because of the vast array of complex educational contexts and settings that mathematics is taught (Schmidt and McKnight, 2012). This is because of the decentralized nature of education in the U.S. As a result, vast differences occur from state to state, county to county, district to district, school to school, and even classroom to classroom in the opportunities and experiences children are provided to learn mathematics (Schmidt and McKnight, 2012). In mathematics education, textbooks, standards, and policy documents are often grouped together and referred to as written curriculum. Written curriculum have been found to influence the intended curriculum of teachers and in turn the enacted curriculum that students experience (Tarr et al., 2006; Stein et al., 2007; Tarr et al., 2008; Remillard and Heck, 2014). However, it is important to note, each of these types of written curriculum have been found to influence the enacted curriculum in different ways, which Remillard and Heck (2014) describe in their framing of the curriculum enactment process. For example, standards, which are part of the official curriculum, set the bar for the minimum learning expectations for students, which influence instruction materials like textbooks, but do not dictate them. However, past scholarship has found a disconnect between the content of textbooks and the standards they claim to address (Polikoff, 2015; Tran, 2016). For this reason, it is important to investigate all types of written curriculum. In this study, I choose to focus on textbooks as they are the written curriculum students typically engage with most directly in their learning of mathematics. However, before I review the relevant literature around statistics in textbooks, I first review the GAISE II framework, which is the most relevant standards/policy document for teaching statistics in the mathematics curriculum to provide some broader policy context.
The GAISE framework (Franklin et al., 2007) and its’ recent update GAISE II (Bargagliotti et al., 2020) are frameworks that describes how people develop an understanding of statistics concepts, reasoning, and thinking. It does not represent a list of standards to be covered or tested. The GAISE II document comes from the statistics education community, which is deeply rooted in the discipline of statistics, and was written explicitly with the teaching and learning of statistics in school mathematics curriculum in mind. The GAISE II framework has also been endorsed by NCTM, which is the leading professional organization for mathematics educators, making it the most current and influential policy for preK-12 statistics education in the U.S. The GAISE framework is structured hierarchically, with three levels of development (A, B, & C) across the elements of the statistical investigative cycle, which consists of four main elements: formulating questions, collecting data, analyzing data, and interpreting result, building from Wild and Pfannkuch (1999) work. The levels of development are not designed to be grade level specific but are instead based on the level of understanding someone has with statistics, making them potentially relevant for every grade level, and for adults.
The most common form of written curriculum that students experience directly is textbooks. Though textbooks do not dictate the experiences students have with concepts and practices in the enacted curriculum of the classroom, they have been found to influence those experiences (Stein et al., 2007; Schmidt and McKnight, 2012; Fan et al., 2013; Remillard and Heck, 2014). For example, in a survey of classrooms it was reported that 45% (±2.7) of teachers reported using instructional materials for 75% or more of the class time and 74% (±1.5) reported using their text to guide the overall structure and content emphasis of their instructional units (Banilower et al., 2013). This means that classroom texts may largely influence the experiences students might have with statistics in a high school mathematics classroom. In spite of this influence, in an extensive survey of past literature on textbook research in mathematics education, Fan et al. (2013) found that much of the research that has been done on textbooks, has been isolated and patchy.
Up to this point, there has been very little scholarly work specifically focused on investigating the statistics content of school mathematics texts, in the context of the U.S. At the high school level, Tran (2013) and Tran and Tarr (2017) looked at learning trajectories related to bivariate data in a single high school mathematics textbook. Tran (2016) additionally looked at three textbook’s alignment with the CCSSM in terms of the instruction of association, finding disconnects that challenge the claim by the publishers that the texts were standards aligned. Additionally, Weiland (2019) investigated the contexts presented in high school textbooks, finding most were trivial and fictitious.
At the middle school level, Huey and Jackson (2015) investigated informal inferential tasks in middle school mathematics textbooks and created a framework for investigating such tasks. Pickle (2012) investigated the nature, sequence and scope, and cognitive demand of the statistics content of four middle school textbooks in the U. S. She found that statistics only made up 4.6–16% of the content of the texts analyzed, and that it was generally only in a single chapter. Furthermore, the statistical content was predominantly on graph types and measures of central tendency, with much less focus on measures of spread, except for one curriculum series. This is somewhat concerning as variability is at the very heart of statistics (Cobb and Moore, 1997; Wild and Pfannkuch, 1999). Also concerning, was that Pickle (2012) found that the cognitive demand of the tasks was mostly, what she classified as, low demand-procedures without connections, with some classified as high demand-procedures with connections, and almost none were classified as high demand-doing statistics; meaning such tasks where not typically creating opportunities for students to do statistics.
At the elementary level, Jones et al. (2015) investigated the distribution of statistical topics and emphasis on elements of the statistical investigative cycle, of statistics tasks in five elementary mathematics textbook series. They found that the proportion of the texts that presented statistics content varied from 10.8–18.1%. Jones et al. (2015) also found 90% of the statistics tasks were focused on the analyzing data element of the statistical investigative cycle, with almost none on the interpretation of results, and few on posing questions, or collecting data. Bargagliotti’s (2012) review of three elementary reform curriculums, found the presence of tasks focused on every element of the statistical investigative cycle that were consistent with the first level of the GAISE framework (Franklin et al., 2007). Based on this review of the literature, there seems to be a lack of research on the statistics content of mathematics textbooks, especially at the high school level, particularly given statistics prevalence in society today. This dearth of research is also concerning, given that statistics and mathematics are distinct disciplines in spite of statistic’s location within the mathematics curriculum.
3. Theoretical framework
To frame this study, I draw upon the idea of discourse, focusing on the discourse in written textbooks. In Ryve’s (2011) meta-synthesis of literature on discourse in mathematics education, he found only 10 of the 108 articles reviewed focused on analyzing written text. Ryve (2011) in fact points out that the lack of analysis of assessments, curriculum, and textbooks make them ripe areas for current discourse research. In education, the term discourse is frequently linked to talk, language, or other methods of communication (Walshaw, 2007; Ryve, 2011). In this study, I am drawing from Foucault’s perspective of discourse (Foucault, 1971, 1972; Mills, 2003; Walshaw, 2007). More specifically, I am drawing from his use of the term “as a regulated practice that accounts for a certain number of statements” (Foucault, 1972, p. 80). The regulated practice Foucault is referring to is often considered similar to a set of rules, which are generally taken for granted, and also constrain and “specify what is possible to speak, do, and even think, at a particular time” (Walshaw, 2007, p. 19). This makes discourse very powerful, producing what is considered knowledge or truth regimes in particular historical, social, and political spaces (Foucault, 1972; Mills, 2003; Walshaw, 2007). Discourses do not have specific origins or ends; they exist in time and space. As Foucault (1972) describes, “discourse must not be referred to the distant presence of the origin, but treated as and when it occurs” (p. 25). Furthermore, discourses are not continuous, impenetrable, monolithic things. Instead, they are dynamic, constantly changing over time. They are fraught with discontinuities and ruptures. It is in interrogating discourses, uncovering the taken for granted rules, and shining a light on their discontinuities, that individuals can transform them (Butler, 1990).
Discourses are important to study because they influence and shape how we see the world around us, similar to a paradigm. They create structures that shape and frame who we are, who we can be, and how the world is perceived. These structures do not represent objective reality. They are socially created and subjective, and they are shaped through the truths that are produced in various discourses. For example, the achievement gap discourse frames academic success in terms of performance on standardized tests (Boaler and Sengupta-Irving, 2006; Martin, 2009; Gutiérrez and Dixon-Roman, 2011). These tests are not objective arbiters of truth. They are as flawed as the humans that created them with the purpose of measuring certain aspects of mathematics, while choosing to ignore others. They are subjective measures of knowledge that are given great power as gatekeepers to individuals’ future entry into jobs and higher education (Martin et al., 2010).
Related to the focus of this paper, I am investigating how two high school mathematics textbook series, which are from a particular historical, social, and political space, produce what is considered the practices (actions) for the doing of statistics. The focus of this work is also related to the work of Schmidt and McKnight (2012) around opportunities to learn in mathematics education. For example, consider the following statement:
Materials set limits on what can be done in learning activities, or at least what can be done easily. In the absence of other factors, these materials often determine what content a teacher will cover in instruction. If the topic is in the materials, the probability is greater that it will be covered in class. If the topic is not in the materials, the probability is greater that it will not be covered in class. Textbooks and other materials do not determine what a teacher may do, but for busy, overworked teachers, they often serve as de facto curriculum and set strong limits on what is likely to be done and thus on the likely presence or absence of OTLs [opportunities to learn] (Schmidt and McKnight, 2012, p. 18).
Schmidt and McKnight discuss both the limiting nature of materials and how they create opportunities to learn. Similarly, Foucault talks about the limiting nature of discourses, which limit what is possible, or considered normal to see, do, or know, while at the same time constructing what counts as truth, similar to opportunities to learn.
There has been very little work done investigating mathematics textbooks using a discursive lens drawing from Foucault. In fact, even though Foucault’s influence is growing in mathematics education (Walshaw, 2007; Martin et al., 2010; Stinson and Bullock, 2012; Gutiérrez, 2013; Stinson, 2013; Kollosche, 2016), the only other work that explicitly focuses on analyzing mathematics textbooks was done by McBride (1989). In her work McBride’s (1989) goal was to, “use the ideas of Foucault to analyze how gender is conceptualized in the teaching of mathematics” (p. 40). To that end she analyzed a number of mathematics texts finding that men were generally positioned as those that created mathematics, with very little mention of women’s contributions to mathematics. In fact, she found the historical pictures provided in texts were almost always of men, and the cartoons were too often of women expressing difficulties understanding the mathematical content. Taking a Foucauldian approach to considering discourse has two advantages in the study of mathematics textbooks. One, is that an inductive approach creates space for new aspects of texts to be studied that have not been studied before. Deductive frameworks come with already created structures, but they may miss emergent patterns in data. Two, is a Foucauldian approach comes from different epistemological and ontological assumptions than other inductive approaches like grounded theory do, which shapes the claims that can be made, and the warrants used to justify them, which I delve into more in the methodology section.
4. Methodology
In this section, I describe my answer to what Guba and Lincoln (1994) refer to as the methodological question, “how can the inquirer (would-be knower) go about finding out whatever he or she believes can be known” (p. 108)? In working toward this end, let me first state explicitly my ontological and epistemological assumptions while conducting this work. I reject the existence of knowable, objective, independent reality that individuals can access (Kendall and Wickham, 1999; Walshaw, 2007; Arribas-Ayllon and Walkerdine, 2008). I believe that objective reality can never truly be known as it is filtered through discourse. As Guba and Lincoln (1994) explain:
A reality is assumed to be apprehendable that was once plastic, but that was, over time, shaped by a congeries of social, political, cultural, economic, ethnic, and gender factors, and then crystallized (reified) into a series of structures that are now (inappropriately) taken as "real, " that is, natural and immutable. For all practical purposes the structures are "real, " a virtual or historical reality (p. 110).
It is through the rules and regularities in statements, constituted by various discourses that crystallize or reify such structures, which shape and construct the reality we perceive. Furthermore, I view knowledge or “truth” as socially constituted by discourses. Various “regimes of truth” are created through rules and regularities in statements in discourses that are historical and situated in context. Rooted in ontological and epistemological stances described, I relied upon Foucault’s (1972) methodology of Archeology in an effort to answer the research question I posed.
Because of the inherent subjectivity in research, it is important I lay bare my own subjectivity in relation to this work as suggested by others in the field (Aguirre et al., 2017). I come at this work as a white cisgender male working in academia that comes with many privileges that allow me space to conduct this type of work. I was formerly a high school mathematics classroom teacher who relied heavily on mathematics textbooks for my teaching, particularly my teaching of statistics, which has driven the focus of my work in academic settings. The findings I discuss in this paper come from my reading and immersion in the data and are influenced by my lived experiences. This work was also done as part of my dissertation in the years 2015–2017, which is why the texts selected come from that time period.
4.1. Archeology
There are generally two types of methodologies attributed to Foucault; archeology and genealogy (Kendall and Wickham, 1999; Walshaw, 2007; Arribas-Ayllon and Walkerdine, 2008; Bazzul, 2014). Genealogy is a historical approach focused on investigating the flow of power in creating knowledge and truth that is used to highlight the connections between knowledge and power (Walshaw, 2007; Bazzul, 2014). The knowledge/power connection is beyond the scope of this study. For this study, I drew upon Foucault’s notion of archeology, which is focused on the study of discourse. In archeology, Foucault takes a historical approach to interrogate the “regimes of truth” formed by the rules or regularities of statements in discourse (Walshaw, 2007; Bazzul, 2014). In this way, discourse regulates what is considered possible or considered normal to say, do, or think in different social, cultural, and historical contexts.
In this type of analysis, the unit of analysis is statements, as statements are the building blocks of discourse, just as sentences are the building blocks of texts (Foucault, 1972). The purpose of describing statements is as Foucault (1972) states, “to uncover what might be” (p. 115), which is the goal of this work. More specifically, I considered the actions made available for people to take up in the doing of statistics, formed by the discourse. For example, a statement like “calculate the mean and standard deviation of each data set,” functions to position the actions of calculating mean and standard deviation of data sets as actions for the doing of statistics that students can then take up. Statements also leave things silenced, such as what one might do with calculations of the mean or median. In this example, calculation is advantaged as an action for doing statistics, but interpretation is left silent and not positioned or reenforced as an action of statistics. One statement alone does not create such positions though, it is through regular patterns across many statements that such positions are created.
There are also rules to discourse that function to regulate how statements form and function, similar to grammar in language. In the case of discourse, these rules are discursive practices, as Foucault describes, “these rules define not the dumb existence of a reality, nor the canonical use of a vocabulary, but the ordering of objects” (Foucault, 1972, p. 48). It is the rules, these discursive practices, that operate systematically to form and order objects. Foucault (1972) refers to the ‘things’ formed by discursive practices as discursive formations, which he describes:
Whenever one can describe, between a number of statements, such a system of dispersion, whenever, between objects, types of statement, concepts, or thematic choices, one can define a regularity (an order, correlations, positions and functionings, transformations), we will say, for the sake of convenience, that we are dealing with a discursive formation (p. 38).
It is such regularities that form the actions for the doing of statistics.
To carry out an Archeology, Foucault (1972) cautions about interpreting or evaluating statements during analysis. Instead, the goal is to focus specifically on what the texts state, without attempting to delve beneath the surface of the texts to infer the politics at play or the meaning meant to be transferred. Instead, the focus is on looking at what statements are made of, as well as which are repeated. Part of staying on the surface involves not attempting to infer what meanings the authors of the text are trying to convey, focusing instead on what is formed by the discourse.
Rooted in the tradition of the methodology of archeology and through the lens of my own positionality in this study I investigated the specific research question:
How are the actions for the doing of statistics formed by statements from the statistics lessons of two major high school mathematics textbook series?
Foucault does not lay out specific tools in the traditional sense for carrying out research in the methodologies he describes (Kendall and Wickham, 1999; Walshaw, 2007; Arribas-Ayllon and Walkerdine, 2008). As such, drawing from the epistemological and ontological underpinnings of his work and its interpretation by others, I created specific tools for investigating the research question I posed.
4.2. Mathematics textbooks selected
There are a number of textbook series available for high school mathematics. To select which textbook series to analyze, I relied on findings from the National Survey of Science and Mathematics Education, which surveyed a nationally representative sample of science and mathematics teachers in schools across the U. S. with 7,752 teachers participating (Banilower et al., 2013). Part of the data gathered in the survey was on the textbook usage of teachers in schools. In high school mathematics classes, 81 percent (SE = 1.0) of the teachers surveyed reported using commercially published textbooks/programs, and more than two-thirds reported covering 75–100% of their text (Banilower et al., 2013). These statistics exemplify the power commercially published texts have in influencing classroom instruction. In looking at the commercial publishers that were used for high school mathematics texts, the top two companies making up the market share were Houghton Mifflin Harcourt with 35% (SE = 1.6) and Pearson with 30% (SE = 2.0) with their traditional Algebra I, Geometry, Algebra II sequence textbook series. Since Houghton Mifflin Harcourt and Pearson combined made up the majority of the market share, I chose to select the main textbook series from each to study.
The National Survey of Science and Mathematics Education I relied on for choosing the texts was conducted in 2012. At the time I conducted this study, Houghton Mifflin Harcourt had recently published a series called Houghton Mifflin Harcourt Algebra 1, Geometry, Algebra 2 curriculum (Kanold et al., 2015) that was selected, and Pearson had published a series referred to as the Pearson Algebra 1, Geometry, Algebra 2 Common Core curriculum (Randall et al., 2015) that was selected. Since the data was selected and analyzed, a more recent version of The National Survey of Science and Mathematics Education was conducted in 2018. In the summary of the findings for high school mathematics, the texts I selected for this study were among the most commonly used texts reported by mathematics teachers who reported using commercial texts in the teaching (61% of teachers surveyed reported using commercial textbooks in their weekly lessons; Hayes, 2019, pp. 27–28).
Each lesson in the Pearson series (Randall et al., 2015) is designed around a 5-step sequence (interactive learning, guided instruction, lesson check, practice, assess and remediate). Of the Algebra 1 student materials, 38 of 792 pages (5%) are focused on statistics. Of the Geometry student materials, none of the 876 pages (0%) are focused on statistics. Of the Algebra 2 student materials, 71 of 964 pages (7%) are focused on statistics. Overall, 4% of Pearson’s Common Core Traditional Pathways curriculum is focused on statistics standards.
The Houghton Mifflin Harcourt (Kanold et al., 2015) series is built around a 5E instructional model including engage, explore, explain, elaborate, and evaluate. The text is organized hierarchically in units, modules, and lessons. Of the Algebra 1 student materials, 168 of 942 pages (18%) are focused on statistics. Of the Geometry student materials, none of the 1,002 pages (0%) are focused on statistics. Of the Algebra 2 student materials, 207 of 896 pages (23%) are focused on statistics. Overall, 13% of Houghton Mifflin Harcourt’s curriculum is focused on statistics standards.
4.3. Lessons selected
To begin an analysis using Archeology, Arribas-Ayllon and Walkerdine (2008) point out, “the analyst must recognize discourse as a ‘corpus of statements’ whose organization is relatively regular and systematic. The first task, then, is selecting the kind of statements appropriate to one’s research question” (p. 100). In the case of this study, I had to choose the statements related to statistics from the corpus of statements that make up the discourse of each textbook series. There are no clear-cut boundaries between what is statistics and what is mathematics. However, for the practical purposes of the analysis for this study, such boundaries had to be drawn. Therefore, I chose to draw from the GAISE framework, and the major differences discussed in the literature between mathematics and statistics, to draw boundaries between what I considered statistics lessons for this analysis, and what was excluded.
Drawing from the GAISE framework (Franklin et al., 2007), I included all lessons that discussed topics from statistics including data exploration, descriptive, and inferential statistics, as well as the key concepts from probability: “to understand probability as a long-run relative frequency; understand the concept of independence; and understand how probability can be used in making decisions and drawing conclusions” (Franklin et al., 2007, p. 85). I also included lessons focused on modeling, if the data being modeled included variability, consistent with the consideration of variability being a major difference between mathematics and statistics (Cobb and Moore, 1997; Franklin et al., 2007; Groth, 2007). Such lessons were identified by reviewing the tables of contents of the texts. Any lesson that was later found to not contain situations with variability, or discussions of the topics identified in the GAISE framework (Franklin et al., 2007), were removed from the analysis.
4.4. Archeological analysis
To investigate the actions made available to students for the doing of statistics, I considered statements on a sentence-by-sentence basis. I looked for regularities in the statements both within and across lessons in each textbook series. In the case the specific data I considered, different actions were often presented in each sentence. In fact, there were a number of sentences that contained multiple actions. I conducted the analysis iteratively through a series of readings of the data, with different aspects of the data as the focus of each reading. In my first reading of the data I identified and recorded all the sentences that indicated actions students are intended to perform. To provide some insight into how I read the texts, I provide a brief example. Figure 1 shows a page taken from the Houghton Mifflin Harcourt Algebra II text (Kanold et al., 2015) that I analyzed.
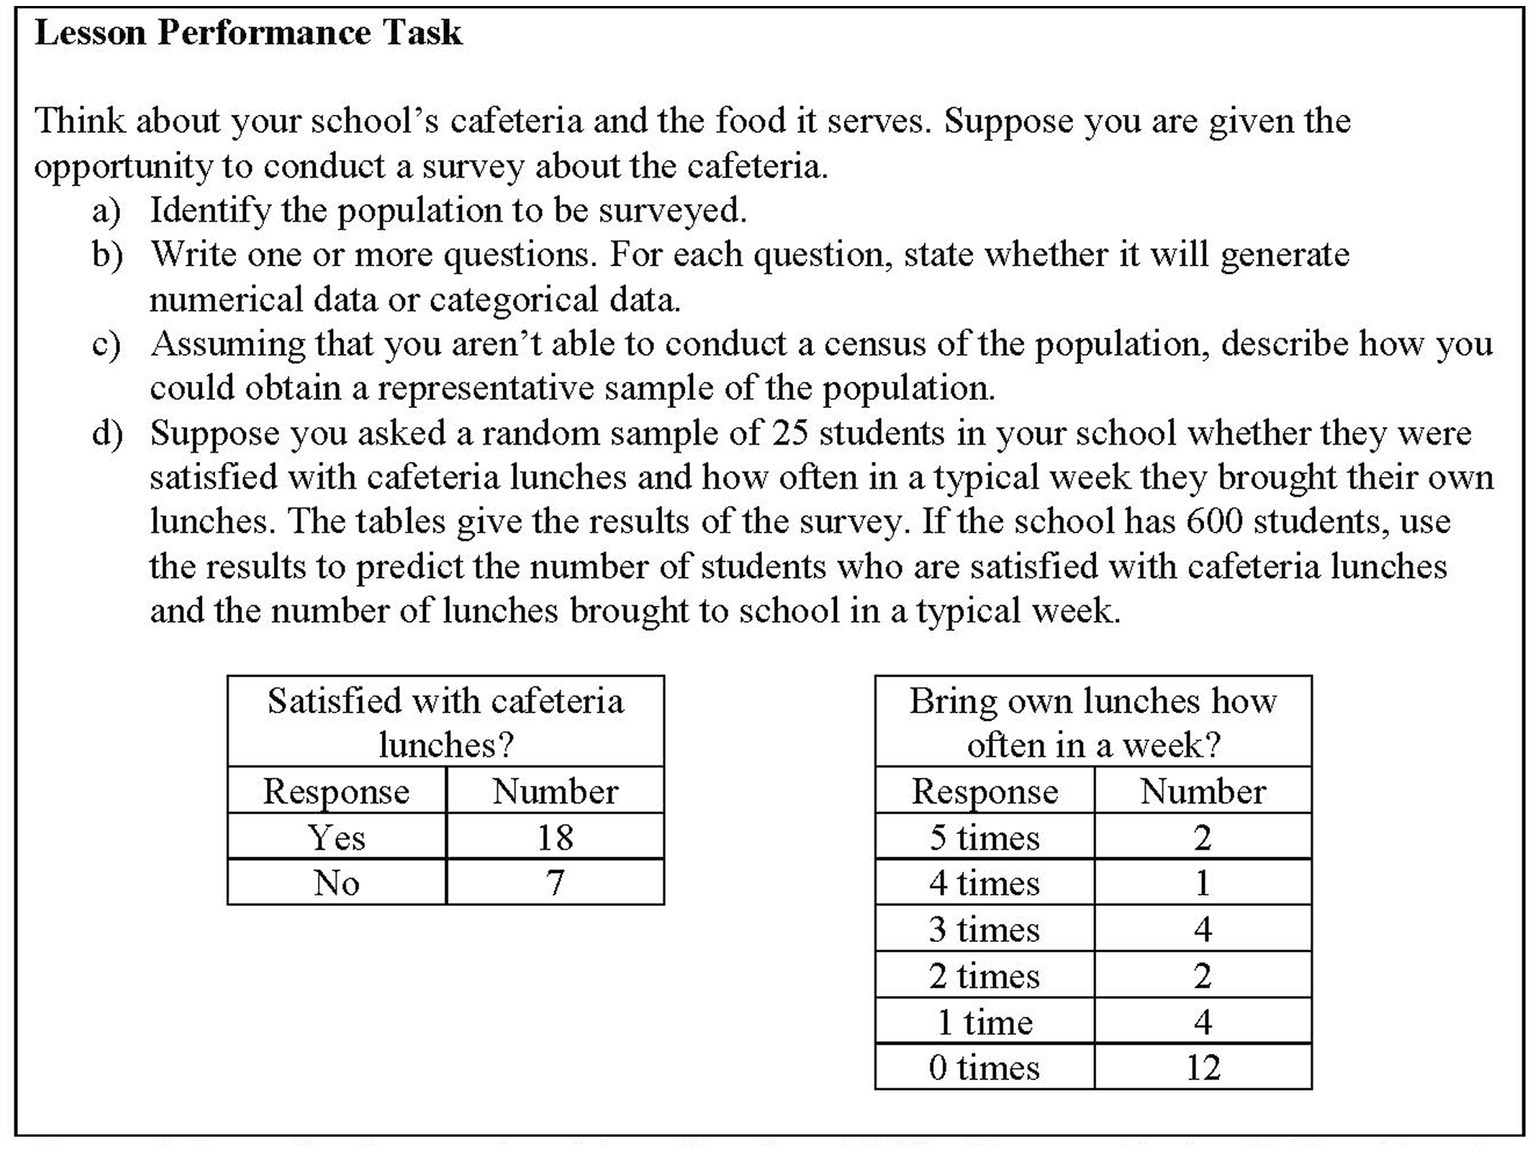
Figure 1. Example of text analyzed from Houghton Miflin Harcourt Algebra II (Kanold et al., 2015, p. 802).
In the case of this page, I included all of the sentences in the analysis, except for a single sentence in the middle of the third line of text in part d that states, “the tables give the results of the survey.” This sentence is operating to form an object, in this case the tables provided, but it does not form an action for someone to take up. I then placed selected sentences in an excel spreadsheet for the analysis shown in Table 1.
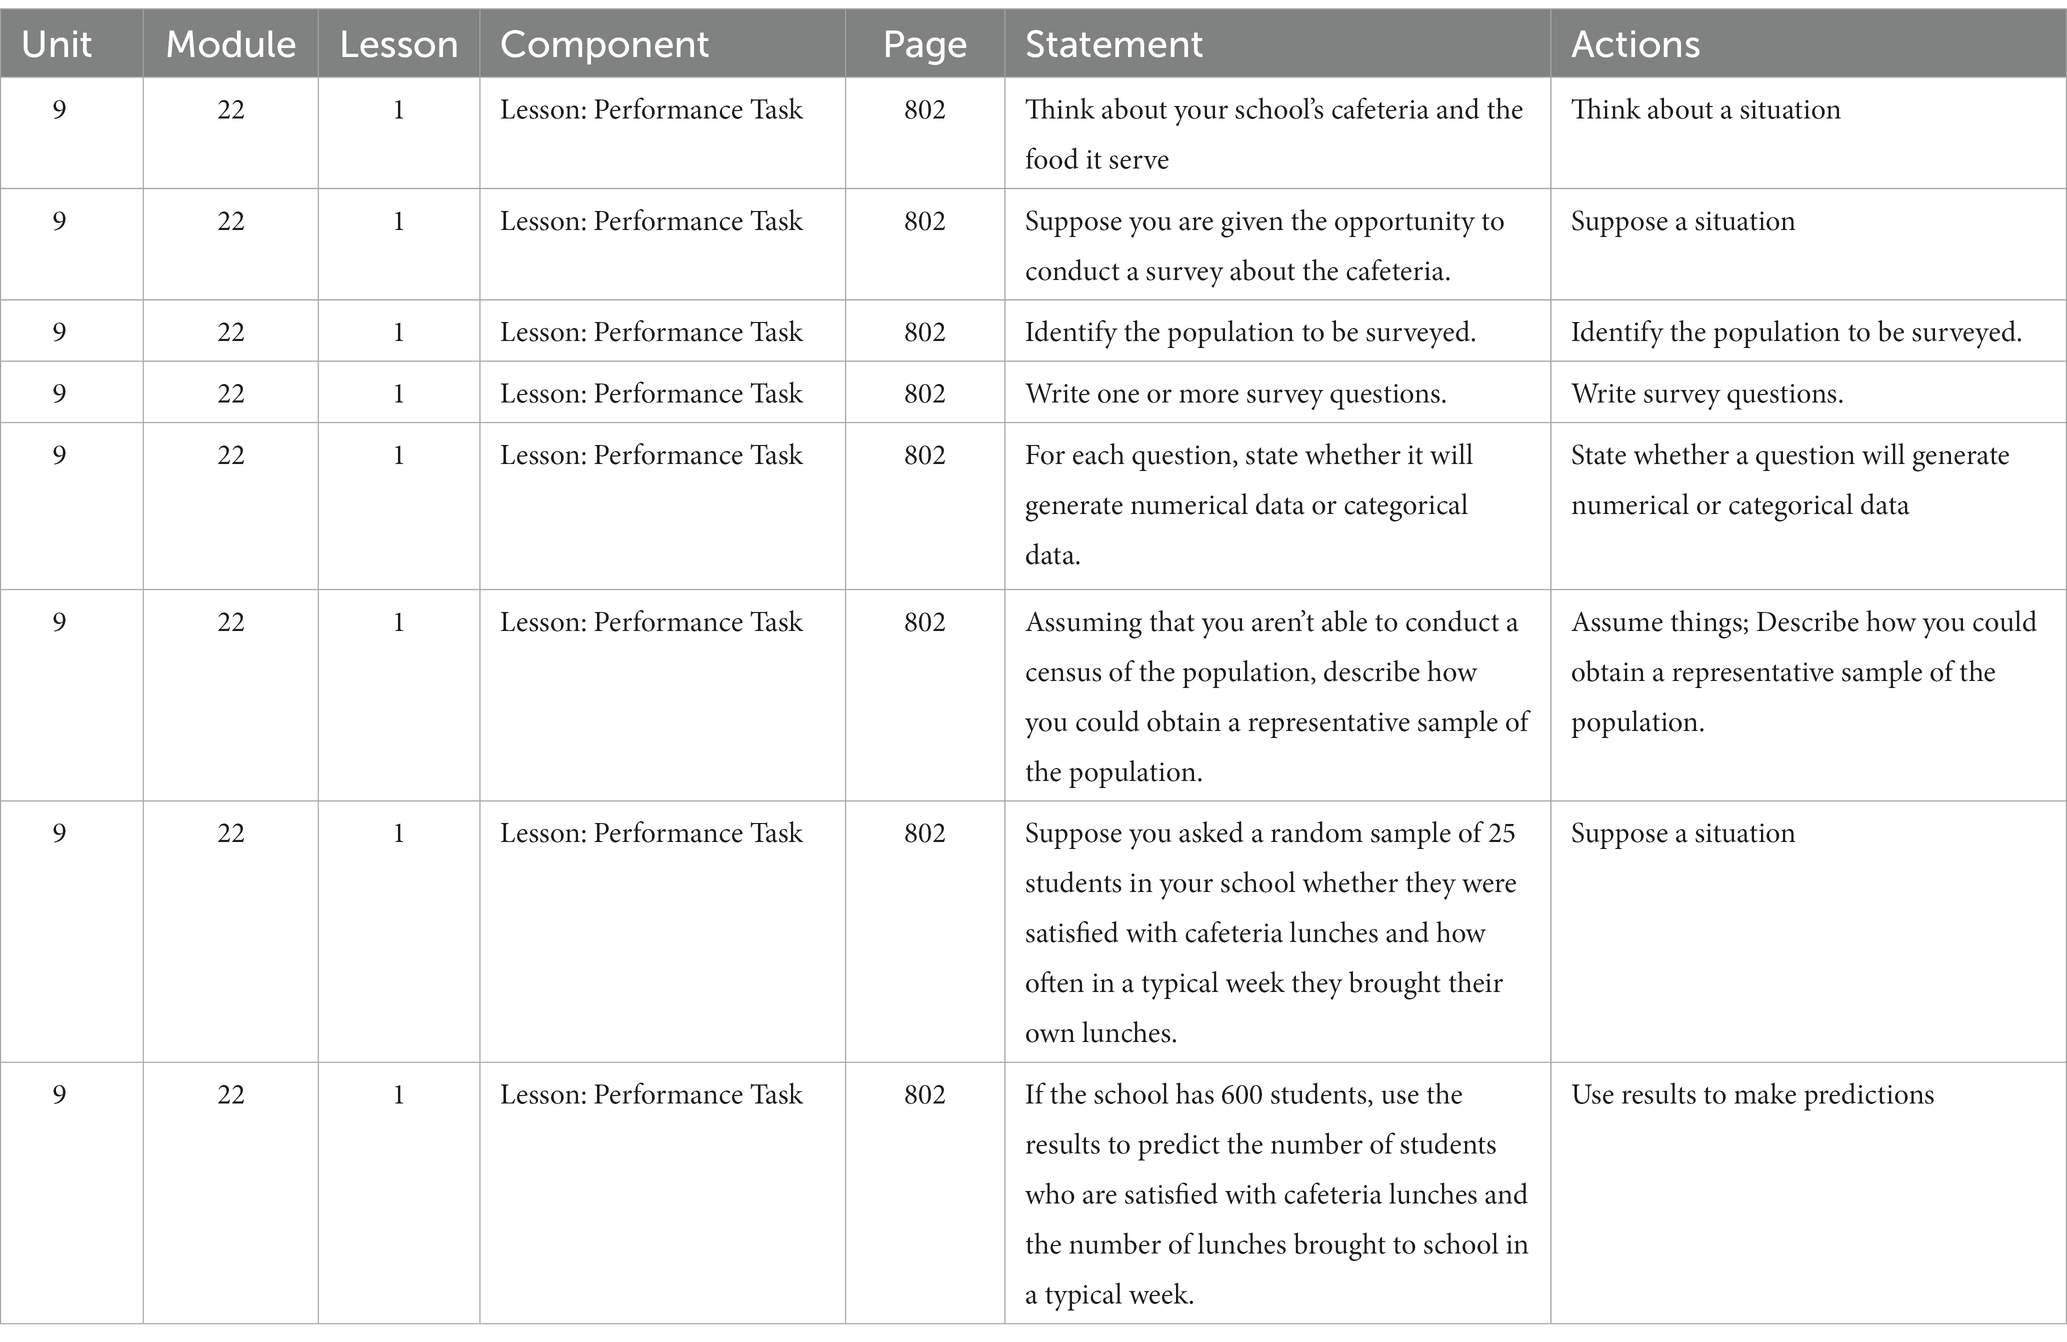
Table 1. Example of analysis carried out for the first two readings of the data for investigating the actions made available to students for the doing of statistics from Pearson Algebra 1 (Randall et al., 2015).
The second iteration consisted of me taking the sentences I identified as relevant statements during the first reading and summarizing the actions in each statement. An example of this can be seen in actions column of Table 1. I carried out this process in the excel spreadsheet where the data from the first reading was recorded. The third iteration consisted of me taking all the summarized actions for each statement from the previous iteration and putting them into a word document organized by lesson and then grouping the actions that were similar by lesson. I treated any group that had three or more statements in it as a regularity or action created by the discourse of the text. I considered such regularities as a discursive formation, consistent with what I described earlier in terms of the methodology of Archeology (Foucault, 1972).
For the fourth iteration, I took all the actions that met the threshold I created for being considered a regularity within a lesson and put them into a document. I then placed all the statements that did not make the cutoff for being considered regularities within a lesson into a separate document for each textbook. I then looked for regularities that occurred across the lessons that did not come out from the analysis within the lessons. Any regularity I found across lessons was then added to those I found within lessons in that document.
During the third and fourth rounds of reading, I realized that there were different sizes to the actions that were found regularly in the texts. For example, some actions were very specific, such as find the mean, or find the median; while other actions were quite large, with many possible approaches, such as use models to make estimates and predictions. To help to synthesize and communicate the actions made available by the texts, I performed a fifth round of analysis that consisted of taking all the actions that came out of rounds three and four of the analysis and synthesizing them into groups of actions. I synthesized the actions into groups to make it easier to contrast the findings with literature from statistics education. I chose to group the actions by the element of the statistical investigative process they were associate with (i.e., statistical questions, collect/consider data, analyze data, and interpret results), which is what I report in the findings to help answer the research question.
5. Findings: actions formed
In this section, I report on the findings from the Archeological analysis of the data described in the methodology in order to respond to the research question: how are the actions for the doing of statistics formed by statements from the statistics lessons of two major high school mathematics textbook series? In order to answer the “how” of this question, I begin this section by focusing on the “what” aspect, relative to what actions are formed. I respond to the “how” aspect of the question in two ways. First, I have done so already, to some extent, by operationalizing what I considered a discursive formation relative to my investigation of the actions formed for the doing of statistics. Second, in the findings, I take what actions are formed in the statements of the text and synthesize them into larger discursive formations and explain how and why I have grouped the actions in such ways.
From the analysis described in the methodology, I found over 100 actions to be formed discursively through regularities in the text of each of the textbooks analyzed. For practical purposes, I do not discuss every one of these actions individually. In reviewing the list of actions created through the analysis of the data, I noticed that the actions formed varied in size. For example, the following actions were formed through regularities in the statements from the Pearson texts: find the mean, find the median, find the mode, find the variance of a data set, find the standard deviation of a data set, and find the range of a data set. Each of these actions is relatively small in terms of the time it would take to complete and are very specific in scope and could be grouped into a larger action formation of finding univariate quantitative measures of center and spread of data sets. Some action formations that came out of the analysis were already large and did not seem to fit with other actions to be combined. For example, find and explain the error in other’s thinking, use standards of mathematical practice, or suppose a situation. For practical reasons, to communicate clearly the findings, I present only the actions summarized into large action formations for the textbooks. The action formations for both Pearson textbooks can be found in Table 2 and the action formations for the HMH textbooks can be found in Table 3.
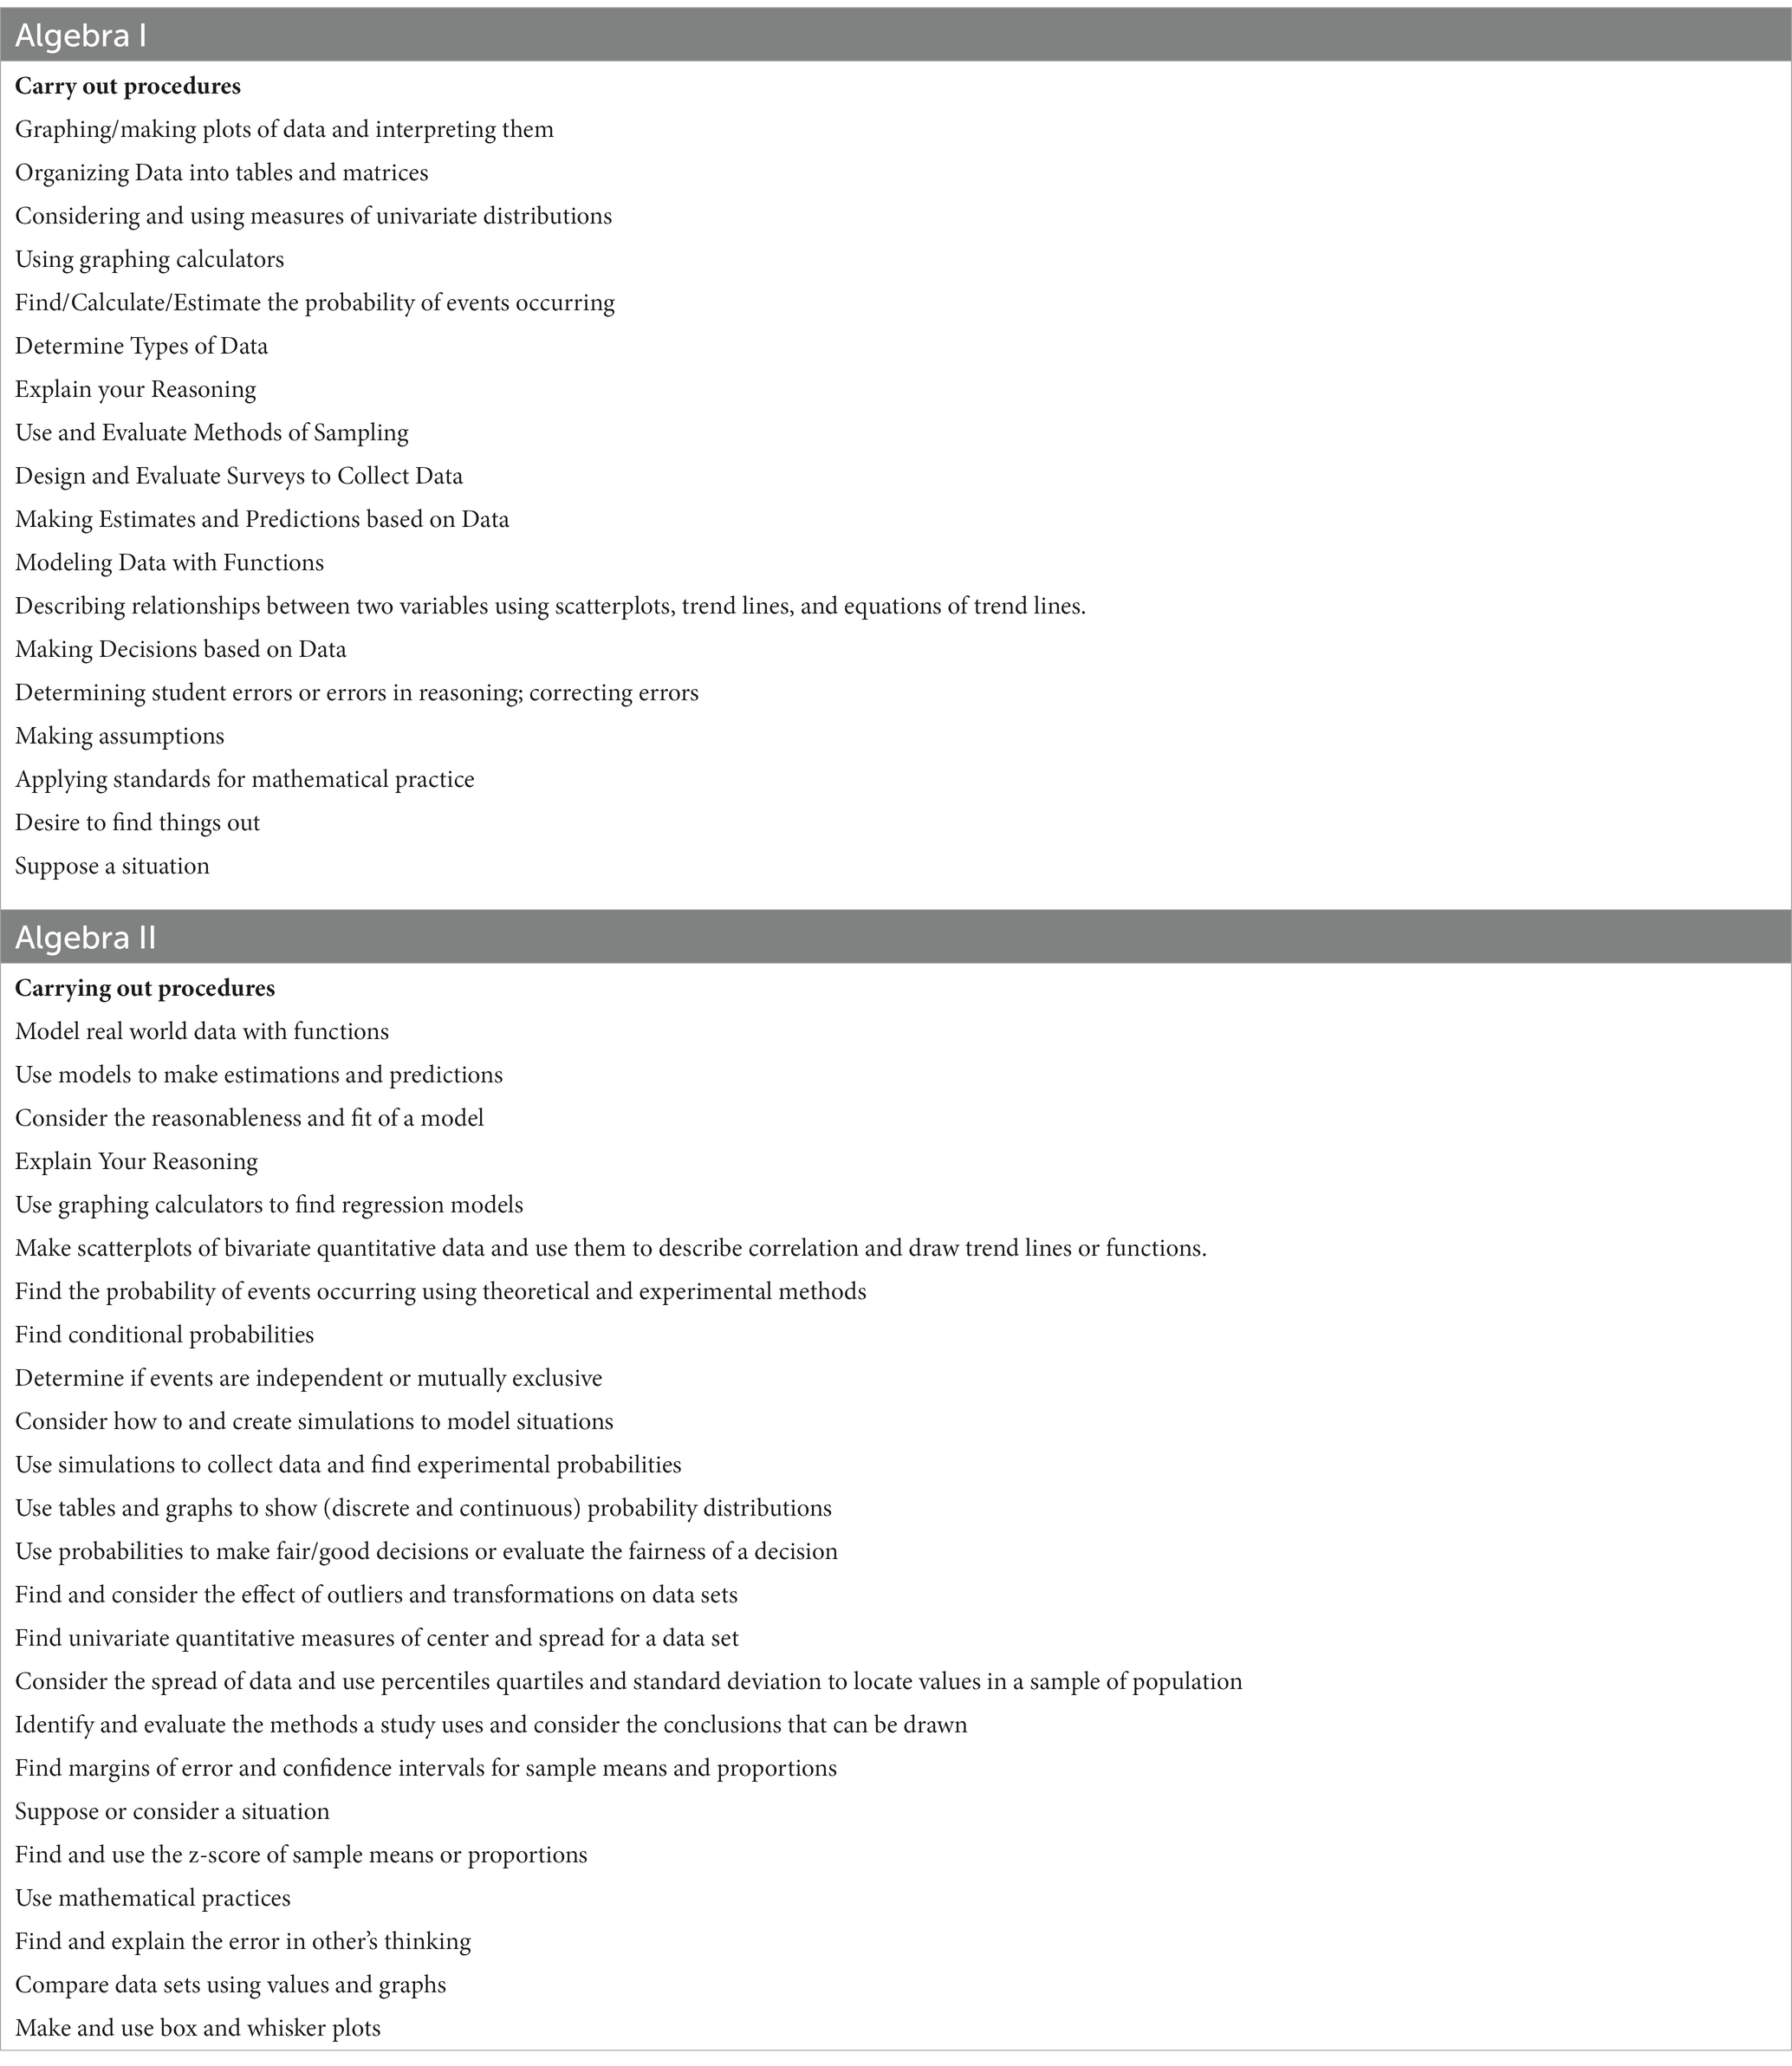
Table 2. Action discursive formations from the text of the Pearson Algebra I & II textbooks (Randall et al., 2015).
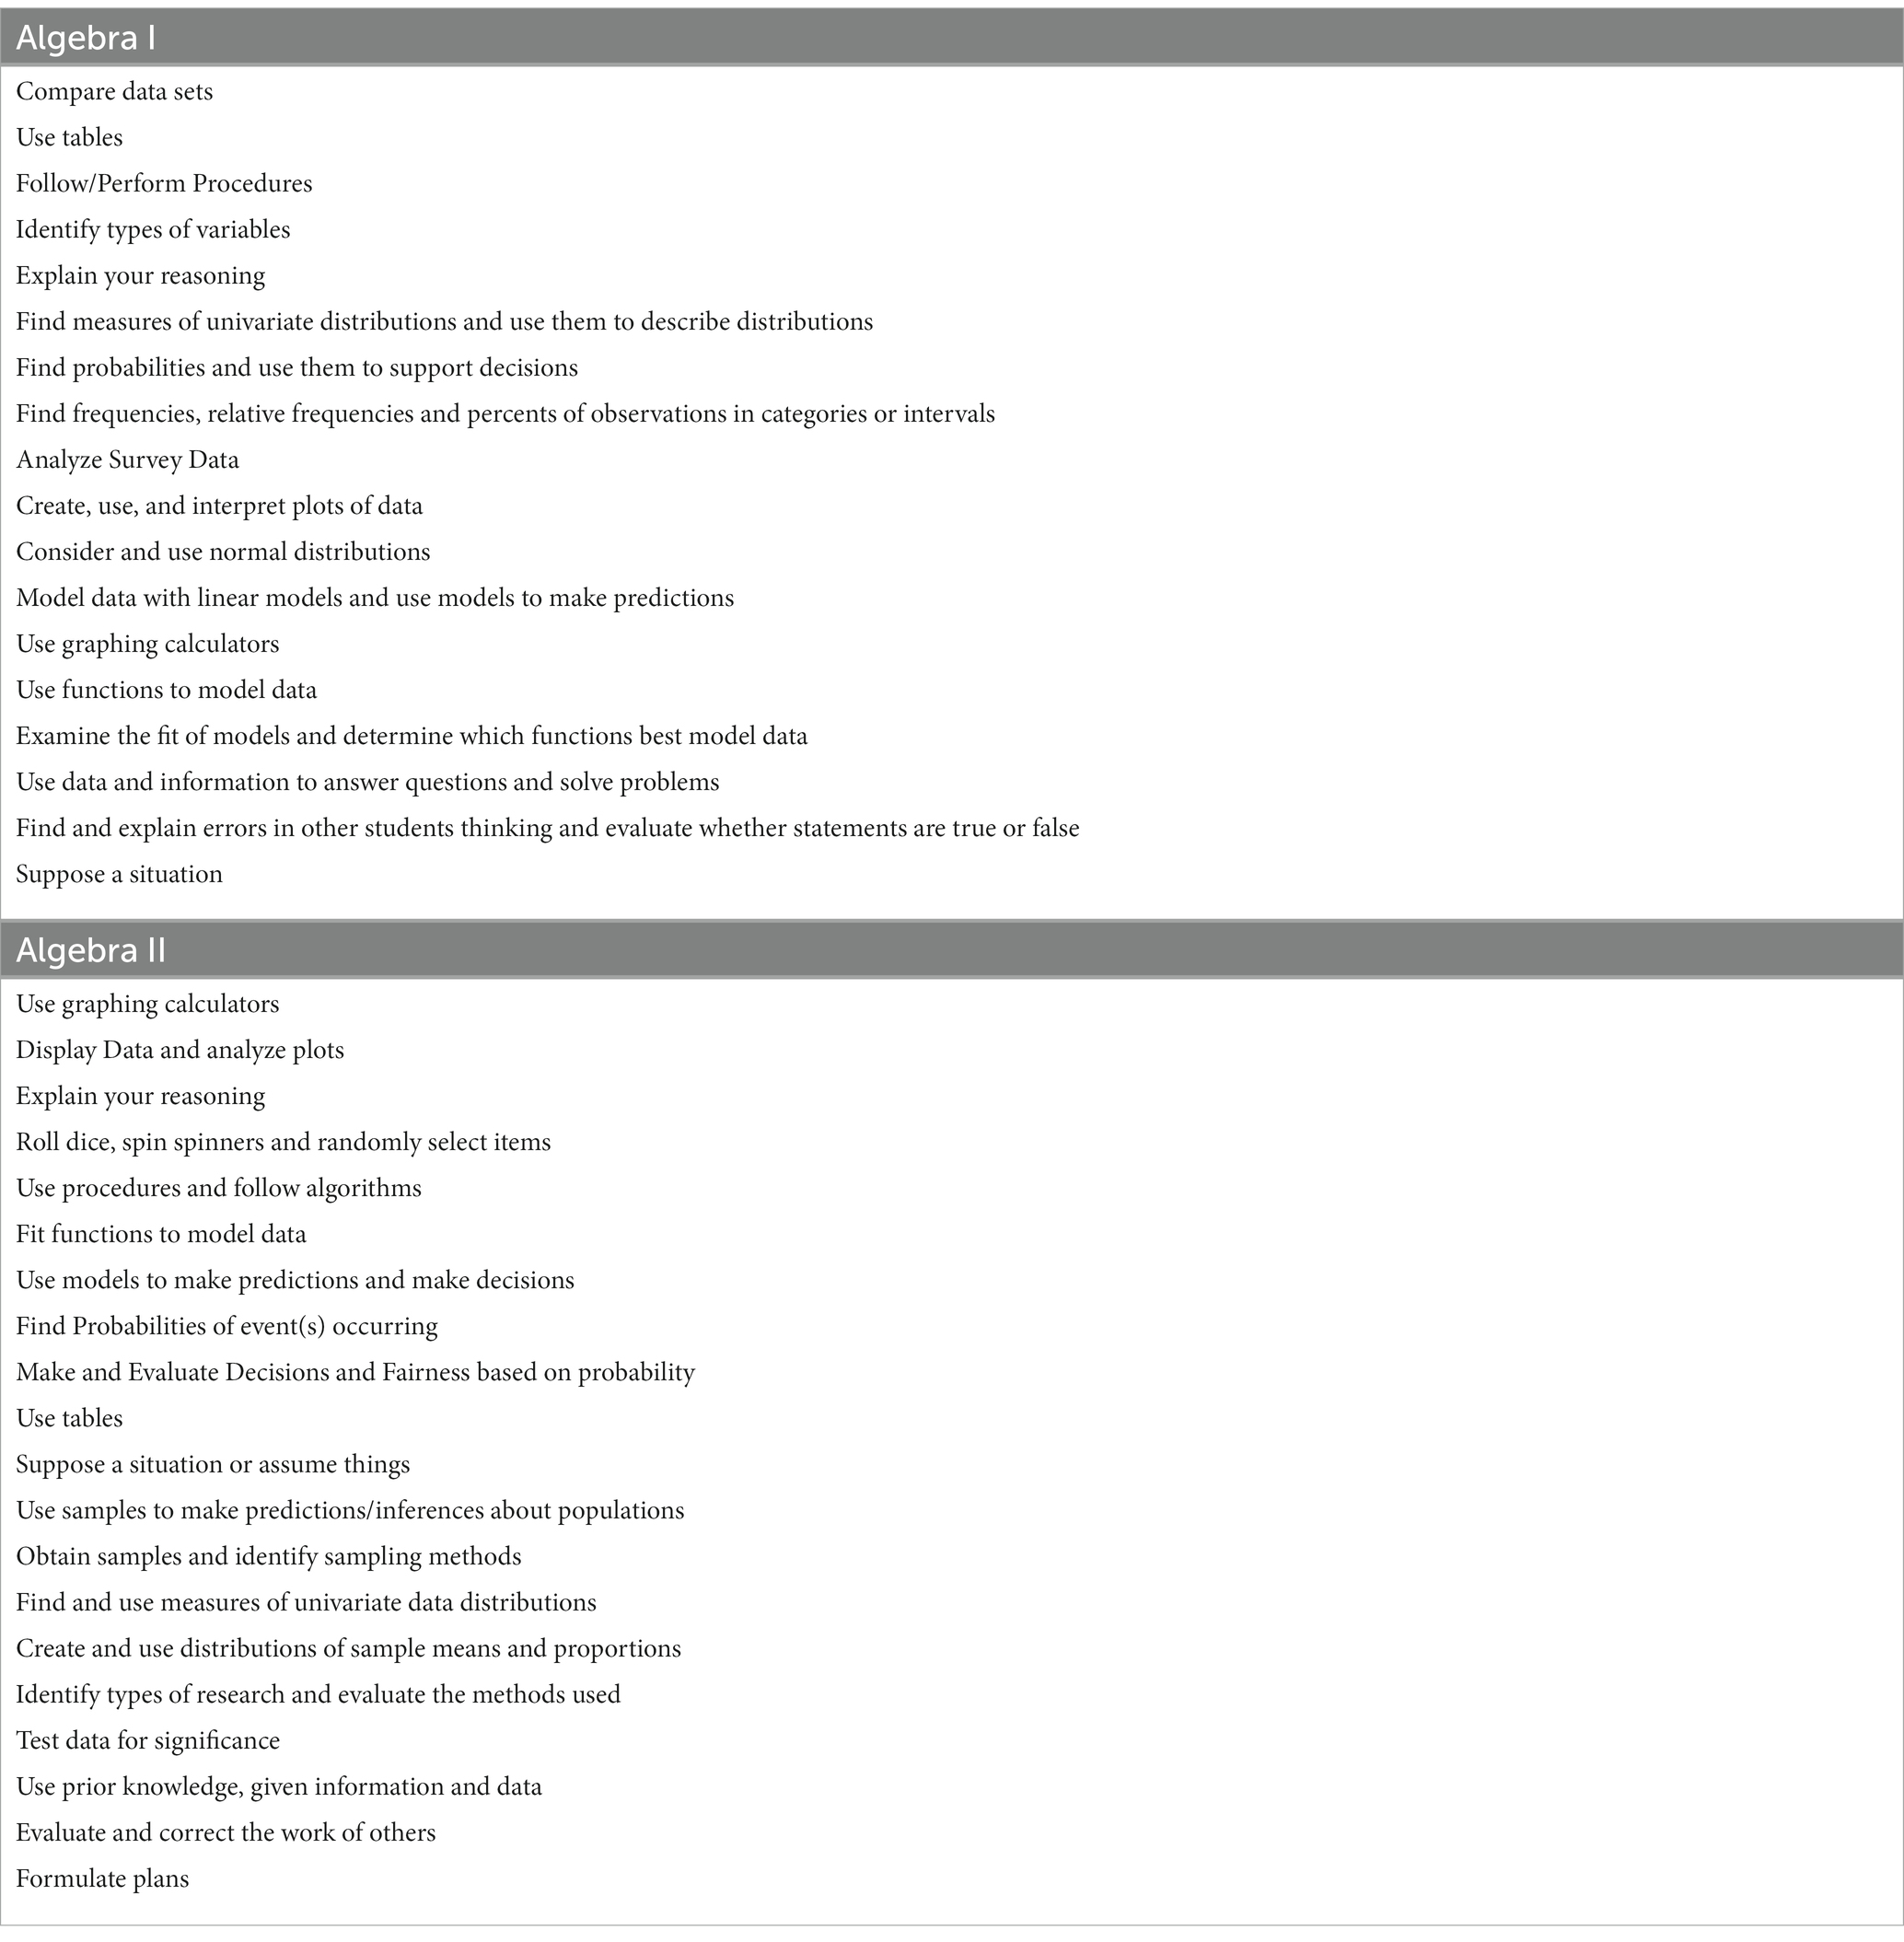
Table 3. Summarized actions formed by regularities in the text of the HMH Algebra I & II textbooks (Kanold et al., 2015).
Considering the literature, when I reviewed the action formations in Tables 2, 3, I found that many of these actions could be considered in terms of the elements of the statistical investigative cycle (Franklin et al., 2007), namely asking questions, collecting data, analyzing data, and interpreting data. I used the elements of the statistical investigative cycle to help organize and communicate the findings, which I also considered discursive formations. There were also several action formations that came up repeatedly both within and across the lessons in both textbook series that did not fit in the broad categories/formations of asking questions, collecting, analyzing, or interpreting data. These action formations included suppose a situation, explain your reasoning, and evaluating/correcting the work of others, which I discuss in detail later. Before delving into each of the discursive formations of actions, I discuss a dominant overarching pattern I found in analyzing the data that was prevalent throughout all of the texts analyzed, which is the routinized or algorithmic nature of the actions formed. This pattern also represents a discursive formation of actions.
5.1. Routinized/algorithmic action
The most apparent and overarching pattern/formation found during the analysis of the actions made available to students through the discourse of the texts was that the actions formed were predominantly formed in very routinized or algorithmic manner. This pattern/formation is clearly evidenced in the action formation, carry out procedures and follow algorithms. This formation can also be seen in the prevalence of many very small specific action formations that are part of very specific directives or explanations of actions that students are told to perform. For example, one of the most common actions formed through regularities in the text was finding or calculating measures of central tendency particularly the mean. The action is characterized as using a formula that is presented as finding the sum of the values in a data set and then dividing that sum by the total number of values in the data set. This action is formed as a very algorithmic process and is presented in statements again and again across all of the texts studied.
Many of the actions formed in the texts are done in similar fashion with the text first constructing how to perform specific actions, followed by the text asking students to carry out identical actions in slightly different circumstances. This can be seen in the following statement: “calculate the mean median and range of the data” (Randall et al., 2015, p. 740). In the text, the actions of calculating the mean, median and range of a given set of data are made available in the statement, this is followed by the specific process by which these actions are to be carried out with given data.
Another relevant statement from the same task is “how can you tell from the graph that the mean and median are equal” (Randall et al., 2015, p. 740)? This statement requests students to consider how a given graph shows that the mean and median are equal. This question is immediately followed by the response the text presents, “when the graph is symmetric, the mean and median will be equal” (Randall et al., 2015, p. 740). This type of example problem is at the core of the body of the lessons in both textbook series and is typically followed by a directive for the student to carry out the same action(s) in a similar situation.
Another very common example of the often routinized/algorithmic nature of the actions formed for doing statistics in both textbooks series is the heavy emphasis on the use of tables to organize data and support performing calculations. For example, Figure 2 shows an example of a task that positions students to copy and complete a given table, in this case for the completion of very repetitive calculations. Also, notice the actions formed in the statements are very directive and focused on specific calculations, ending with a comparison of the sum of the squared residuals.
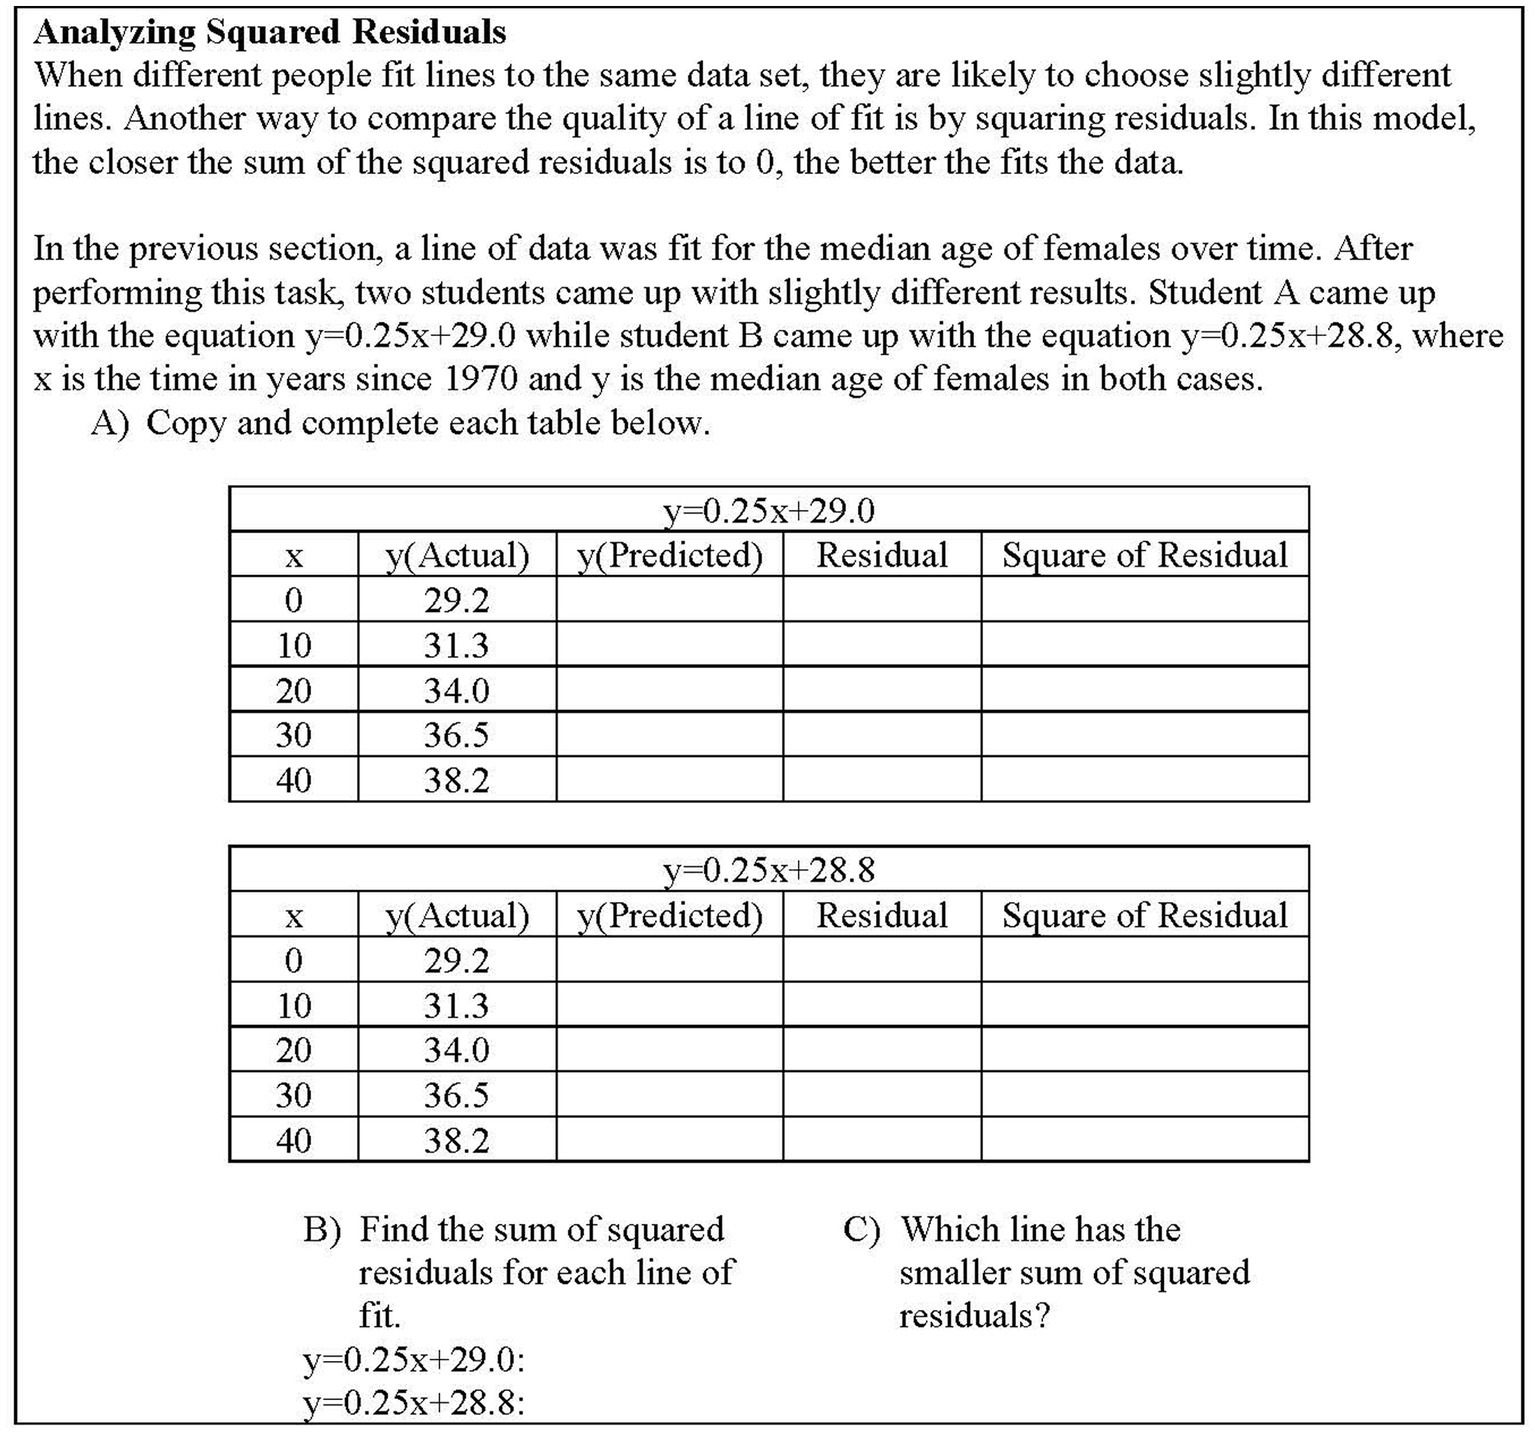
Figure 2. Example of a task with statements forming routinized/algorithmic action from HMH Algebra I (Kanold et al., 2015, pp. 364–365).
As a note, actions of a more open-ended nature are formed by the texts analyzed. However, they are the exception to the rule. Some examples of such formations include use mathematical practices, which is formed in both Pearson textbooks, and find and explain the error in other’s thinking, which is formed across all the textbooks analyzed from both series. These formations were often only formed when looking across lessons and often just met the thresholds described for being considered a regularity in the statements (i.e., occurring in at least three statements). Whereas the formation of algorithmic and routine actions was found in and across lessons as well as in a significant number of other discursive formations. More examples of the formation of the actions for the use of statistics in an algorithmic or routinized fashion can be found by reviewing the actions outlined in Tables 2, 3.
5.2. Formations of actions related to elements of the statistical investigative cycle
In this section, I discussion of the actions formed through regularities in the discourse of the textbooks grouped by the formations of collecting, analyzing, and interpreting data from the statistical investigative cycle (Franklin et al., 2007). As a note, there are a number of action formations that are in multiple statistical investigative cycle formations as they were created inductively from analyzing the data, not deductively by using these groupings. In connecting back to the literature, the practices of collecting, analyzing, and interpreting data are supposed to be connected and deeply intertwined as part of a larger process of statistical enquiry (Wild and Pfannkuch, 1999; Franklin et al., 2007).
5.2.1. Collect data
Action formations related to the collecting of, or considering the collection of data, can be found in all but one of the textbooks analyzed (e.g., HMH Algebra I). The actions related to this broad practice can be seen in Table 4. There were not many action formations related to this formation and those that are primarily about collecting data through simulation or identifying and evaluating the manner in which given data was collected.
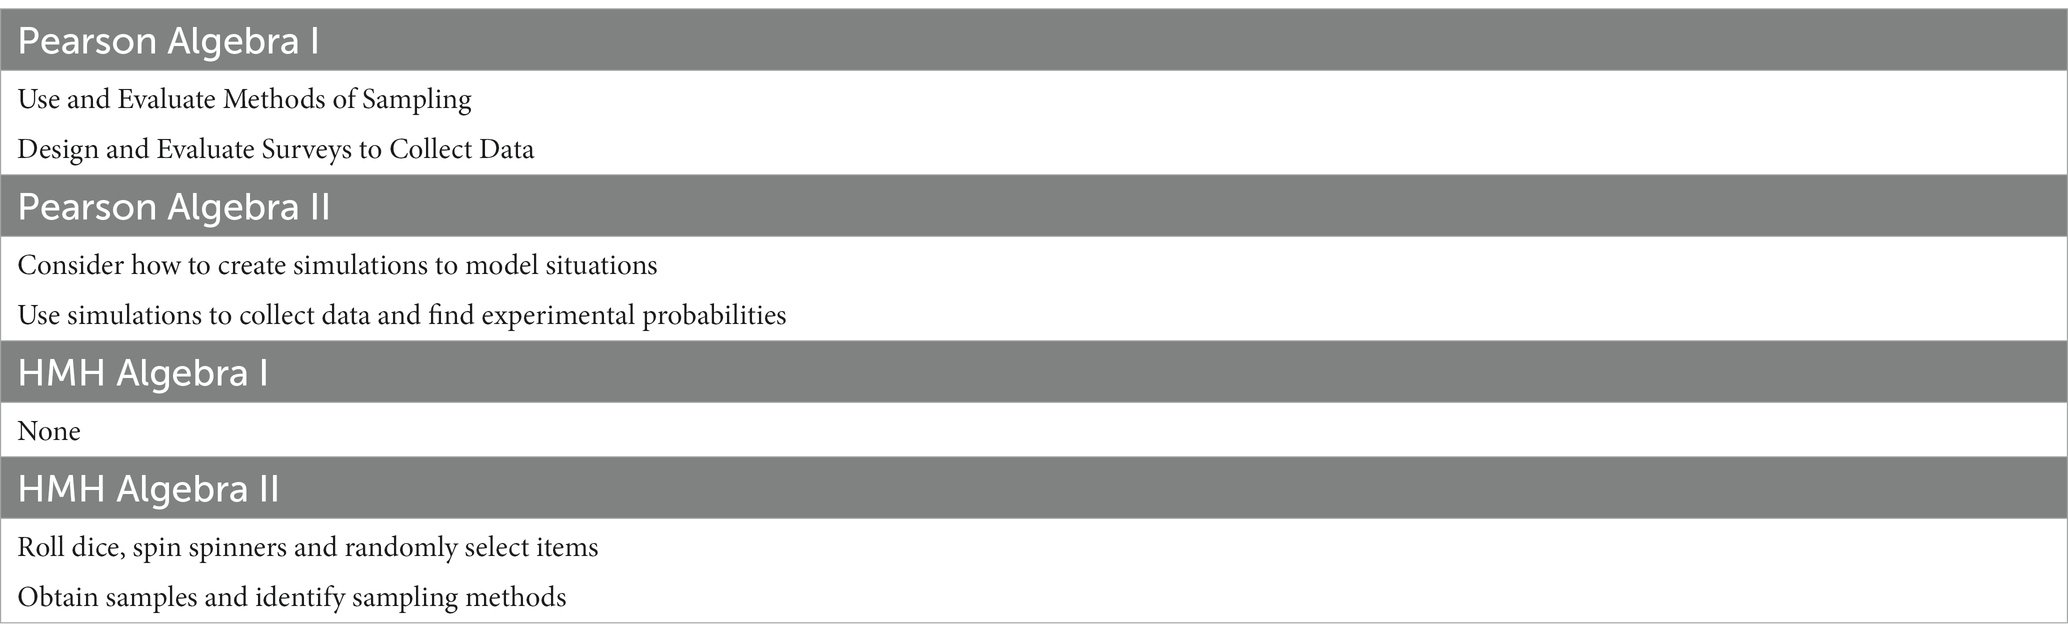
Table 4. Large grain sized actions related to the discursive formation of collecting data.
Simulations as a data collection method are only formed as an action in statements from Pearson’s Algebra II textbook (Randall et al., 2015). The more common way in which collecting data was seen in the action formations found in the analysis, is in the form of identifying and evaluating how someone else collected data. Action formations of this nature can be found in statements in Pearson’s Algebra I textbook (Randall et al., 2015) and HMH’s Algebra II textbook (Kanold et al., 2015). Aside from evaluating sampling methods for collecting data, students are also asked to evaluate the design of studies in terms of whether they are experimental or observational and how data was collected in such studies. As a note, students are never asked to collect data themselves (outside of structured simulations) with any regularity, they are only asked to consider how data has been collected by others.
5.2.2. Analyze data
Action formations related to analyzing data were by far the most prevalent, accounting for the vast majority of the action formations found, show in Table 5. These action formations include graphing data, finding/calculating univariate and bivariate statistics, making informal inferences, testing for significance, modeling data with functions, using models to make estimates/predictions, using probability, and using graphing calculators to support the analysis of data.
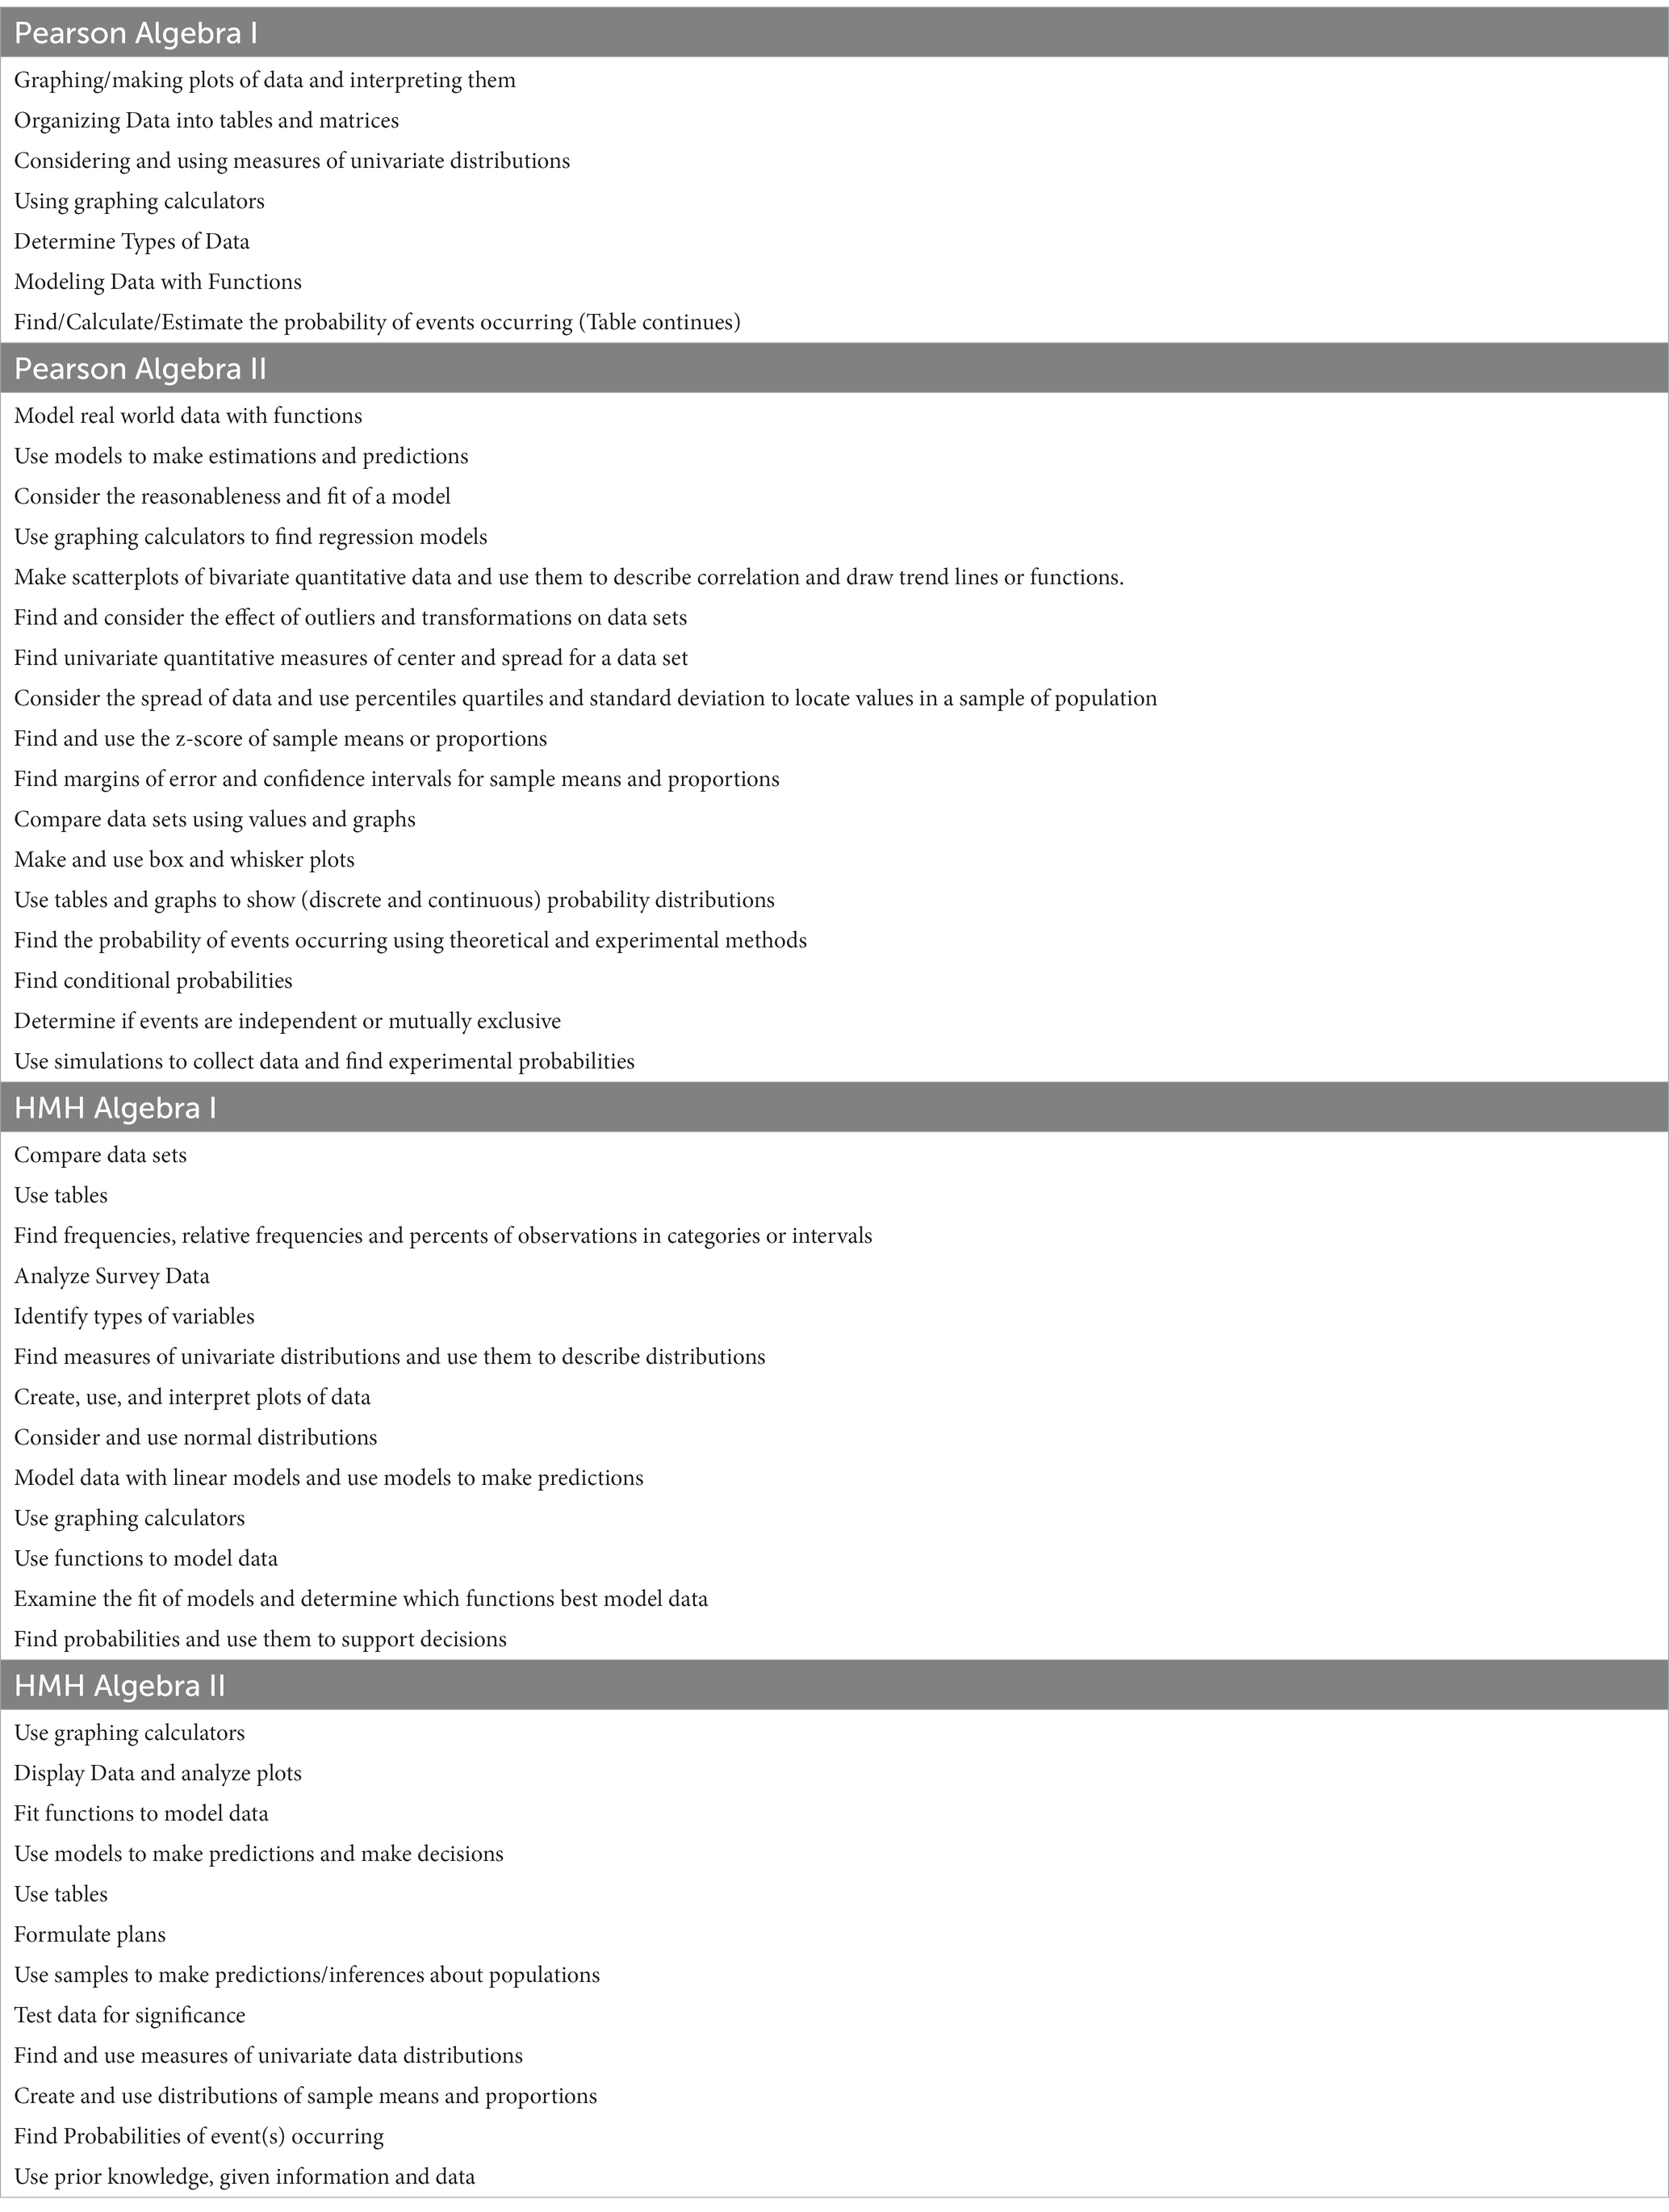
Table 5. Large grain sized actions related to the discursive formation of analyzing data.
Creating graphs of data, and using graphs of data that are given, are action formations that are made available to students frequently in statements throughout all four textbooks analyzed. In creating univariate graphs, students are most frequently asked to do so by hand. The use of graphing calculators for creating graphs is also made available to students, but it is far less common than by hand. In terms of creating bivariate graphs, students are positioned most often to use graphing calculators to create scatterplots and often in conjunction with graphing functions that model the data being graphed. The creating of scatterplots by hand is made available initially to students, but quickly shifts over to using the graphing calculator. The types of plots made available for students to create for doing statistics include box and whisker plots, histograms, scatterplots, dot/line plots and residual plots.
Students are also often presented with graphs and asked to use them to carry out various actions. In the case of univariate graphs, actions such as determining the shape of a distribution, analyzing what a graph is showing in terms of the data, estimating the likelihood of an event occurring, and comparing different distributions using graphs are made available for the analysis of data. In the case of bivariate graphs, a number of actions are formed including using them to determine what type of function to use to model bivariate data, to assess the fit of a model, to help create lines of best fit, to help make extrapolations and interpolations, to describe the relationship between two variables, to estimate correlation, and to compare the fit of different models.
What might be considered the computational side of analyzing data is most prevalent in the actions formed by the text, with a heavy emphasis on actions related to finding/calculating univariate and bivariate statistics. For example, see Figure 2. Such computational actions position students to calculate statistics both by hand and with the support of graphing calculators. Related to univariate statistics, actions include determining the minimum, maximum, median, mode, and first and third quartiles of a data set, as well as, calculating the mean, standard deviation, percentile rank, range, and interquartile range. Students are positioned to use the statistics outlined to describe data sets in terms of their center and spread and also to compare data sets. Students are also positioned to determine what measure of central tendency best describes a data set and to find and consider the effects of outliers on data sets.
Calculating bivariate statistics is deeply tied to modeling, which is also prevalent in the textbooks analyzed. For example, students are asked to take such actions as finding regression models (linear, exponential, quadratic, and sinusoidal) and calculating the correlation coefficient (r) and fit (r2) of linear regression models using the graphing calculator. Action formations related to modeling go beyond just calculation, though many involve determining what function best models a situation where students are positioned to consider scatterplots, residual plots, calculations such as first and second difference, and the value of r2. Action formations also include using models to make estimates/interpolations or prediction/extrapolations.
Actions around the use of probability are also relevant to analyzing data in terms of both theoretical probability and experimental probability and how to use such probabilities to make decisions based on data and also to begin to make inferences and test for significance. The use of probability distributions and the normal distribution are also actions made available to students related to making inferences and testing for significance. Finding conditional probabilities is particularly prevalent connected to analyzing categorical data in two-way tables. Such probability-related action formations are also connected to using simulations of situations discussed earlier, related to collecting data. The action formation of making random selections is also heavily emphasized, which also connects back to collecting data in terms of evaluating sampling methods, with random selection positioned as ideal to avoid bias.
The use of tables is also heavily emphasized in relation to analyzing data as they are made available to students to present data to be analyzed, to facilitate the calculation of statistics and probabilities, to facilitate the construction of graphs, to analyze categorical data for trends and associations, and to organize data. The action formation of copying and completing tables provided is prevalent in statements in all the texts analyzed (see Figure 2). Frequency, cumulative frequency, and two-way tables are the most common types of tables students are positioned to create.
5.2.3. Interpret data
The action formations related to the interpreting of data can be seen in terms of interpreting the analysis students have performed themselves on given data sets, as well as, interpreting the analyses and interpretations of others given in the text, shown in Table 6. A number of the action formations involve using graphs to both make interpretations of data and to help communicate such interpretations to others, which is an example of the close connection between the formations of analyzing data and interpreting data. Another overlap is between the action formations that are related to collecting data and those of interpreting data. For example, the action of designing and evaluating surveys to collect data, by designing one’s own study to collect data, and in terms of interpretation by interpreting the results of someone else related to evaluating the design of the survey used to collect data.
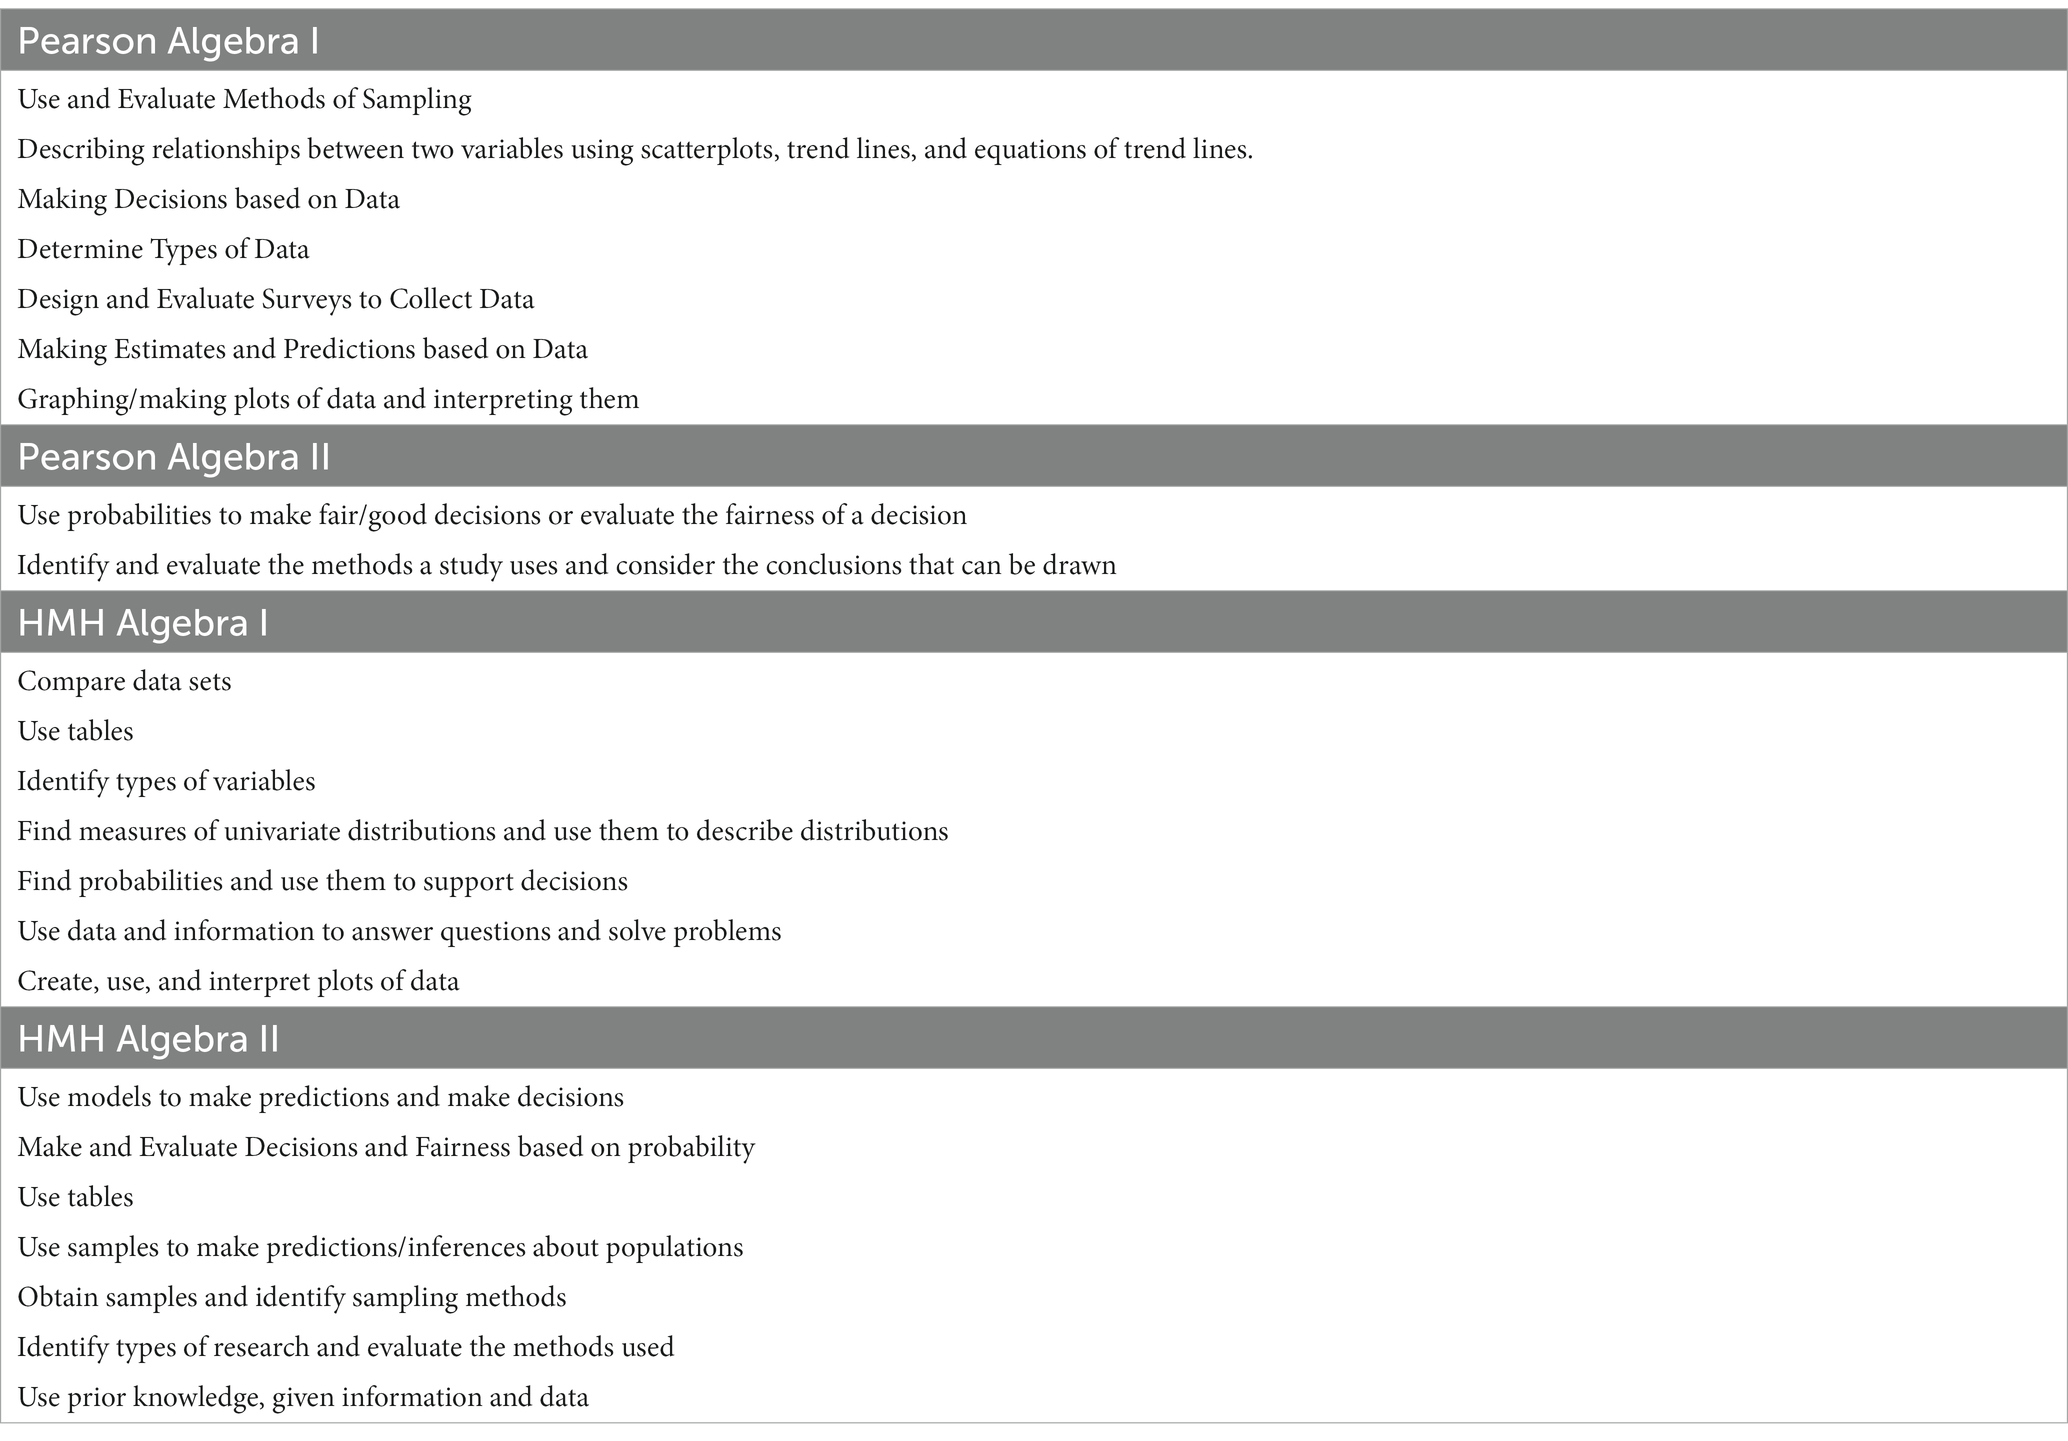
Table 6. Large grain sized actions that are related to the discursive formation of interpreting data.
One of the most common actions made available to students is to interpret the interpretations of others by evaluating decisions made by others using probability. There is also the interpretation of the types of data being used in a study as well as using tables to communicate interpretations of data. Interpreting and using models for estimation and prediction are also action formations that are indicative of interpreting data. For example, describing the meaning of correlation coefficients, slope, and y-intercept of lines of best fit.
5.3. General action formations
The action formations I discuss in this section could be considered actions that are general to mathematics as they are not specific to statistics or working with data like the action formations previously discussed.
5.3.1. Suppose a situation
The action formation of supposing a situation appears frequently in statements throughout lessons in all of the textbooks analyzed. Statements indicative of this action formation typically begin with “suppose …” and go on to describe some sort of fictional situation that students were being given to consider. A typical example of such statements is, “suppose you want to find out how many hours of exercise the students at your school get each week” (Randall et al., 2015, p. 752). This action is not specific to dealing with data as this action can be used in any case where students are asked to consider a fictional situation or to take information for granted that is given.
5.3.2. Explain your reasoning
Statements found in all four textbooks also formed the action of explaining one’s reasoning as an action for the doing of statistics, which could also be considered an action for doing mathematics in general. For example, consider the statement from the Pearson Algebra I textbook: “Are an event and its complement mutually exclusive or overlapping? Use an example to explain” (Randall et al., 2015, p. 780). This is typical of the types of statements that formed this action. Often the text would just make the statement “explain” following a question. The statements were often quite narrow in the scope of what students were asked to explain.
5.3.3. Evaluating/correcting the work of others and evaluating true/false statements
The action of evaluating or correcting the work of others was also found to be prevalent in statements across lessons in all four textbooks analyzed as was the evaluation of true/false statements. This action was formed in relation to evaluating issues such as minor computational errors as well as in evaluating the reasoning of others and correcting their mistakes.
5.3.4. Use mathematical practices
The action formation of using mathematical practices could be considered an action general to mathematics like the previous three discussed. However, unlike the previous action formations discussed, this action was only made available to students in the statements in textbooks from the Pearson series (Randall et al., 2015). This action was formed as a direct connection to the mathematical practices outlined in the CCSSM [National Governors Association Center for Best Practices (NGA Center) and Council of Chief State School Officers (CCSSO), 2010]. For example, consider the following statements:
As you complete the task, you’ll apply several Standards for Mathematical Practice.
• You’ll analyze the task and relate its solution to the information shown in the diagram (MP 1).
• You’ reason abstractly and quantitatively using the compliment of an event and conditional probability (MP 2).
• You’ll use a simulation to find experimental probabilities (MP 4) (Randall et al., 2015, p. 673).
Statements like these made direct connections between the actions student would carry out in tasks and the mathematical practice standards outlined in the CCSSM.
6. Findings: through a disciplinary lens
To put the inductive findings from the Archeological analysis into perspective, I discuss them through a disciplinary lens drawing from the earlier discussion of the discipline of statistics. This is an important step as school curriculum which can become increasingly divorced from the discipline it is meant to come from and create warped perspectives of what is important or counts. For example, in the school mathematics curriculum teachers often talk about imperfect fractions, which is the term used for fractions whose numerator is great than its denominator. However, this term is not one from the discipline of mathematics, it is one born from the arbitrary cuts created in what mathematics is taught at various grade levels, which can lead to misconceptions of mathematics.
The notion of disciplines is also connected to that of discourse, as Arribas-Ayllon and Walkerdine (2008) discuss:
Discourse approximates the concept of ‘discipline’ in at least two ways: it specifies the kind of institutional partitioning of knowledge such as medicine, science, psychiatry, biology, economics, etc. But it also refers to the practices through which certain objects, concepts and strategies are formed (p. 99, emphasis in original).
Discourses and disciplines are not synonymous, it is better to think of disciplines as a type of discourse (Foucault, 1971). The focus of my discussion here then is to compare the actions formed for the doing of statistics by the discourse of the textbooks analyzed to the discourse of the discipline of statistics.
In the previous section I already began to align the actions formed for the doing of statistics related to the discipline of statistics in terms of the elements from a statistical enquiry namely, collecting, analyzing and interpreting data. Here I use the elements of the statistical investigative cycle (statistical question, collect data, analyze data, interpret data), which make up one dimension of the GAISE framework (Franklin et al., 2007; Bargagliotti et al., 2020) and are aligned with empirical work on statistical enquiry of members of the discipline of statistics (e.g., Wild and Pfannkuch, 1999) as a basis for contrasting the findings from the discourse of the texts to the discipline of statistics.
6.1. Statistical questions
There is a glaring absence when considering the findings through a disciplinary lens, which is the absence of actions related to students asking statistical questions, or really any questions for that matter. This connects back to the very routinized or algorithmic nature dominant in the actions formed. The actions formed related to questioning generally come from the text, in the form of asking students to carry out procedures or algorithms. In other words, the text asks the questions. Students are not positioned to ask questions of their own or to answer statistical questions that require exploration or completing a statistical investigation.
6.2. Collecting data
Related to the practice of collecting data, the Pearson textbooks (Randall et al., 2015) include actions for the use and evaluation of methods of sampling, as well as designing and evaluating surveys to collect data in the Algebra I textbook. The Algebra II textbook formed actions for considering how to create simulations to model situations, and for using simulations to collect data and find experimental probabilities. As a note, the data to be collected in simulations was data based on models of random phenomena such as flipping a coin or rolling a die. In the HMH textbooks (Kanold et al., 2015), no actions related to collecting data were formed in the Algebra I textbook. In the Algebra II textbook, the actions of rolling dice, spinning spinners and randomly selecting items for collecting data were formed, as well as obtaining samples and identifying sampling methods. Obtaining samples was focused on the notion of resampling from a given sample. All of these action formations can be found summarized in Table 4.
Unfortunately, neither textbook series included consideration of evaluating the source of data or the collection of data, relative to issues of bias such as socially desirable answers, both of which are important issues of statistical literacy for citizenship (Wallman, 1993; Utts, 2003). Much of what the texts do focus on is the collection of data in terms of the design of a study (i.e., observational vs. experimental), biased wording of questions, and sampling methods that are not representative. These are important to statistics, but there is much more to this practice that is not included.
6.3. Analyzing data
The practice of analyzing data is by far the most thoroughly attended to in the actions that are formed by the textbooks analyzed, which are summarized in Table 5. In the textbook series, actions are formed around analyzing data both numerically using univariate and bivariate descriptive statistics, and graphically using plots such as histograms and box and whisker plots. Initial connections to actions associated with inferential statistics are formed as well; generally, around repeated sampling to develop sampling distributions. Connections are also made to important actions related to probability, which are necessary for inferential statistics.
Since I have already discussed the specific actions formed related to the practice of analyzing data in detail in the previous section, I will not repeat such discussion here. There are however a couple of notable absences to discuss. First, there is a general absence of actions related to the open exploration of data centered around exploratory data analysis, as described by Tukey (1977), which has been considered the basis for the statistics standards in the PSSM [National Council of Teachers of Mathematics (NCTM), 2000] and is still an influential school of thought in the discipline of statistics. What I mean by this is that there is an absence of overarching principles to guide the actions of analyzing data, the most notable being the open exploration of a data set, which is instead done in bite size chunks, in a very specified and directed manner in the textbooks. As Tukey (1977) pointed out, “restricting one’s self to the planned analysis—Failing to accompany it with exploration—loses sight of the most interesting results too frequently to be comfortable” (p. 3).
Another issue is the relatively limited use of technology for creating tables and graphs or calculating descriptive statistics. There is certainly some importance in learning how to create these things “by hand.” However, at a certain point it just becomes busy work and takes away from conceptual goals of learning statistics, like making sense of what the measures tell you about the data and the thing you are investigating. Beyond the issue of limited technology use, there is also an absence of the use of technology other than the graphing calculator. Though not explicitly discussed earlier, the use of technology is prolific in the discipline of statistics today and should have a significant role in the teaching and learning of statistics (Gould, 2010; Pratt et al., 2011; Ridgeway, 2016). The use of technology supports both visualizing data, and finding and calculating descriptive and inferential statistics. Furthermore, the absence of the use of technology outside of graphing calculators is at odds with the mathematical practice of using tools appropriately in the CCSSM [National Governors Association Center for Best Practices (NGA Center) and Council of Chief State School Officers (CCSSO), 2010], for which these texts are said to be aligned. For example, using computer software such as spreadsheets to offload the work of creating plots, and calculating statistics such as standard deviation that are made up of tedious and repetitive calculations, so that instruction can be focused on reasoning and sense making are encouraged for the development of statistical reasoning (Franklin et al., 2007; Lehrer et al., 2007; Kader and Jacobbe, 2013; Peck et al., 2013). Though graphing calculators can perform some of these tasks moderately well, there are a number of significantly more powerful tools for learning statistics, such as TinkerPlots (Konold and Miller, 2005) or CODAP (Common Online Data Analysis Platform, 2014), which were specifically developed based on research on learning statistics concepts and practices. For example, TinkerPlots allows students to create their own measures of center and spread, which is an epistemological practice of statistics and has been shown to be developmentally powerful for building conceptual understanding (Lehrer and English, 2018). Furthermore, the use of dynamic data visualization software has been described by others as helping to support transnumeration (Shaughnessy, 2007; Lee et al., 2014), which Wild and Pfannkuch (1999) found to be a type of thinking common in statisticians and specific to the discipline of statistics. Another significant limitation of graphing calculators is that they are limited in the size of the datasets they can consider, and they do not allow for multivariate data analysis, which limits their usefulness in incorporating real data about issue of consequence in the classroom and means they fall short of supporting the learning of statistics describe in the GAISE II Framework (Bargagliotti et al., 2020).
6.4. Interpreting data
The practice of interpreting data also has a number of actions that are formed by the textbooks associated with it, which are summarized in Table 6. Interpreting plots of data is an action formed in both the Pearson and HMH textbook series that is relevant to this practice. Another common and relevant practice that is formed, is that of making and evaluating decisions based on fairness, which is generally formed in terms of using probability and notions of equal likelihood. There are also a number of absences. For example, the interpretation of data is discussed in the GAISE framework (Bargagliotti et al., 2020) as centered of discussing how the analysis of the data answers the statistical questions posed. However, related to earlier discussions, there is a general absence of the consideration of statistical questions that makes it impossible to then interpret the results related to a guiding statistical question.
The actions related to interpretation in the texts are instead focused on interpreting aspects of the analysis of data related to very specific and directed questions. For example, consider the problem in Figure 3. There is an analysis of the data done graphically in terms of constructing a scatterplot. The interpretation of that analysis involves describing what type of relationship is shown. What is missing is any guiding statistical question, which leads the interpretation to be somewhat meaningless and algorithmic, because students are only positioned to find a relationship between variables when told to, and interpret it algorithmically in terms of what one variable does as the other increases. However, to state it bluntly, why do we care? There is no question we are trying to answer relative to the context of airplanes and altitudes, the focus is instead on doing only what one is told to do directly.
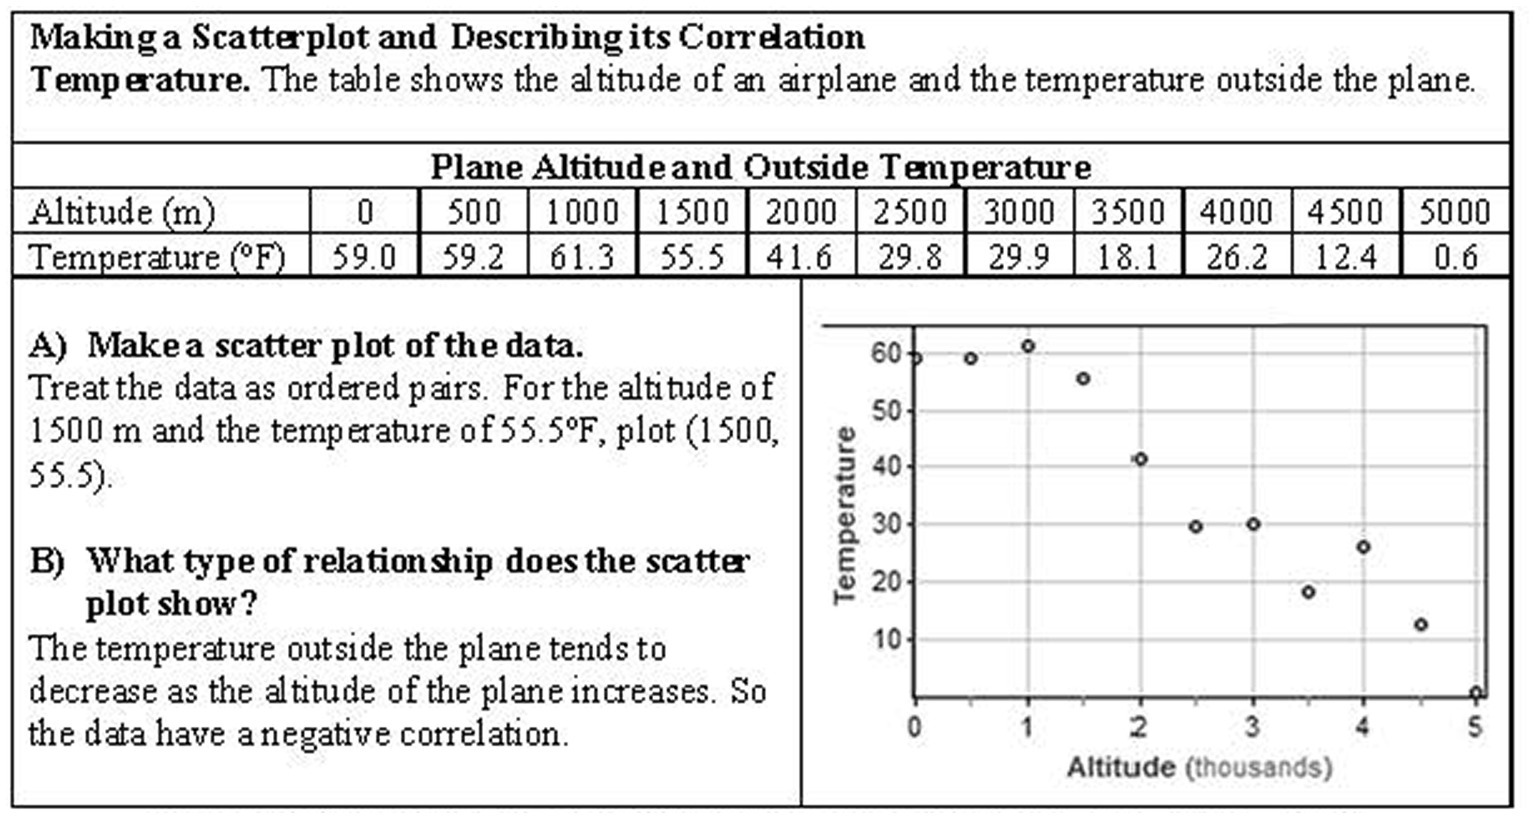
Figure 3. Recreation of task: from Pearson Algebra I (Randall et al., 2015, p. 337).
7. Discussion
In investigating the actions formed for doing statistics in the discourse of the two textbooks series analyzed, the predominant formation of actions was as routine and algorithmic. Actions for open exploration and sense making were not often formed, if at all, by the texts. Instead, the actions formed were generally very specific and directive, such as, find the mean of a data set, create a histogram, or copy and complete a given table. These findings are similar to what Pickle (2012) found in her study of middle school mathematics texts that most of the tasks only had students doing procedures and mostly of a low cognitive demand. This is very much in conflict with those practices generally considered part of the discipline of statistics. It is unfortunate that the actions formed are so routinized and algorithmic as many of the standards-based reform curriculums created in the nineties were meant to push back against such focus in curriculum and emphasize reasoning, problem solving, and sense making (Senk and Thompson, 2003). Yet, as the results of the National Survey of Science and Mathematics Education show, less than 1 % of classroom high school mathematics teachers use such reform-based mathematics curriculum (Banilower et al., 2013). Furthermore, it seems that such reform curriculums and the PSSM [National Council of Teachers of Mathematics (NCTM), 2000] for which they were based upon, have not had significant effect on the predominant written textbook curriculums present in high school mathematics classrooms today, as evidenced by the findings.
Another major finding relative to the actions formed, was that they predominantly fit into the practice of analyzing data, with only some focusing on interpreting data, and little to none related to collecting data or asking statistical questions. This means that these texts are forming a distorted image of the actions for the doing of statistics, relative to the discipline, which values actions related to all aspects of statistical enquiry (Wild and Pfannkuch, 1999; Franklin et al., 2007). Unfortunately, such findings have been found previously by Jones et al. (2015) in their study of elementary mathematics textbooks where they found 90% of the tasks to be focused on analyzing data.
As Jones and Tarr (2010) point out, key elements such as formulating questions and collecting data should be incorporated throughout the curriculum, not just put in a single grade. The image of statistics that is being created by the textbook series analyzed, is primarily of statistics as an analytical method, made up of a number of calculations and algorithms, that can be interpreted in specific ways. Furthermore, it would seem from these results that the GAISE framework (Franklin et al., 2007) from statistics education does not seem to have had much influence on the mathematics curriculums analyzed due to the absences discussed. This implies the field of statistics education needs to consider possibly applying new strategies to influence the mathematics curriculum to improve the statistical education of students in high school.
Investigating written curriculum is important, but a more impactful future direction is for curriculum developers, mathematics educators and statistics educators to consider these findings when they create curriculum, so as to learn from the issues exposed in other curriculums. Most notably, curriculum should provide more opportunities for students to engage in authentic practices of statistics, particularly given what we know about student learning from sociocultural theories of learning (Vygotsky, 1930; Lave and Wenger, 1991; Lerman, 2000). It is also important that student are given opportunities to use technology that is commonly available and conducive to the learning of statistics. The texts focused almost strictly on TI-84 graphing calculators that are, at this point in time, an ancient technology that is well outdated. Furthermore, this is an equity issue as TI-84 s still typically cost around $100 new and are not commonly used in any context outside of a mathematics or perhaps science classroom. On the other hand, most students have smartphones that have far more powerful tools. It is also important that students have opportunities to engage in all the aspects of a statistical investigation holistically and coherently to engage in authentic practice. Students should also have opportunities to have agency over what issues they explore, and also in meaningful and relevant issues, not just positioned to suppose fictitious issues and situations to explore.
The results of this work also have important implications for teacher education. Textbooks are a resource teachers can use to help support their instruction. However, teachers can choose to supplement the lessons in textbooks, or to ignore them completely and choose other instructional resources. This means teacher educators need to consider how they are preparing and supporting teachers to teach statistics in going beyond textbooks in using instructional materials. Also, the absences uncovered in this study are important actions for teacher educators to focus on supporting teachers in incorporating into their lessons. Though it is ideal that teachers would have autonomy over the decision of what instructional materials to use, to best support their students, there are more and more teachers reporting being mandated to use specific instructional materials to increasing levels of fidelity (Hayes, 2019), disregarding their expertise in both the curriculum and their students. In such unfortunate cases, the content of textbooks is extremely important, as it becomes closer and closer to what students experience as the enacted curriculum.
With the prevalence of data and data-based arguments in every facet of people’s everyday lives, it is crucial that students have robust experiences with concepts and practices from statistics. To do so, it is important that teachers and students have access to a mathematics curriculum, which includes teaching statistics in a meaningful way based on the discipline of statistics, such that students are empowered to make sense of the world around them through both mathematics and statistics.
Data availability statement
The datasets presented in this article may be made available upon request to the author – TW, dHdlaWxhbmRAdWguZWR1.
Author contributions
The author confirms being the sole contributor of this work and has approved it for publication.
Funding
The article processing fees for this article were paid for by start-up funds provided to the author by the University of Houston.
Acknowledgments
The author would like to acknowledge the support his dissertation committee including Shahknoza Kayumova, Jesse Bazzul, Eileen Murray, and Chandra Orrill provided him in his work.
Conflict of interest
The author declares that the research was conducted in the absence of any commercial or financial relationships that could be construed as a potential conflict of interest.
Publisher’s note
All claims expressed in this article are solely those of the authors and do not necessarily represent those of their affiliated organizations, or those of the publisher, the editors and the reviewers. Any product that may be evaluated in this article, or claim that may be made by its manufacturer, is not guaranteed or endorsed by the publisher.
References
Aguirre, J., Herbel-Eisenmann, B., Celedón-Pattichis, S., Civil, M., Wilkerson, T., Stephan, M., et al. (2017). Equity within mathematics education research as a political act: moving from choice to intentional collective professional responsibility. J. Res. Math. Educ. 48, 124–147. doi: 10.5951/jresematheduc.48.2.0124
Arribas-Ayllon, M., and Walkerdine, V. (2008). “Foucauldian discourse analysis” in The SAGE handbook of qualitative research in psychology (London, England: SAGE Publications Ltd), 91–108.
Banilower, E. R., Smith, P. S., Weiss, I. R., Malzahn, K. A., Campbell, K. M., and Weis, A. M. (2013). Report of the 2012 National Survey of science and mathematics education. Chapel Hill, NC: Horizon Research, Inc.
Bargagliotti, A. E. (2012). How well do the NSF funded elementary mathematics curricula align with the GAISE report recommendations. J. Stat. Educ. 20, 1–26. doi: 10.1080/10691898.2012.11889646
Bargagliotti, A., Franklin, C., Arnold, P., Gould, R., Johnson, S., Perez, L., et al. (2020). Pre-K-12 guidelines for assessment and instruction in statistics education II (GAISE II) (2nd Edn). Boston, MA: American Statistical Association.
Bazzul, J. (2014). Critical discourse analysis and science education texts: employing Foucauldian notions of discourse and subjectivity. Rev. Educ. Pedag. Cult. Stud. 36, 422–437. doi: 10.1080/10714413.2014.958381
Boaler, J., and Sengupta-Irving, T. (2006). “Nature, neglect & nuance: changing accounts of sex, gender and mathematics” in The Sage handbook of gender and education. eds. C. Skelton, B. Francis, and L. Smulyan (Thousand Oaks, CA: Sage Publications).
Cannon, S. O. (2020). Data interrogations for critical statistical literacy. Statistics Teacher. Available at: https://www.statisticsteacher.org/2020/11/12/data-interrogations-critical-statistical-literacy/
Cobb, G. W., and Moore, D. S. (1997). Mathematics, statistics, and teaching. Am. Math. Mon. 104, 801–823. doi: 10.1080/00029890.1997.11990723
Common Online Data Analysis Platform. Common Online Data Analysis Platform [Computer software]. (2014). Concord, MA: The Concord Consortium.
Conference Board of the Mathematical Sciences. (2012). The mathematical education of teachers II. Providence, Rhode Island: American Mathematical Society; In cooperation with Mathematical Association of America.
Fan, L., Zhu, Y., and Miao, Z. (2013). Textbook research in mathematics education: development status and directions. ZDM 45, 633–646. doi: 10.1007/s11858-013-0539-x
Fienberg, S. E. (1992). A brief history statistics in three and one half chapters: a review essay. Stat. Sci. 7, 208–225. doi: 10.1214/ss/1177011360
Foucault, M. (1972). The archaeology of knowledge and the discourse of language. New York, NY: Pantheon Books.
Franklin, C., Bargagliotti, A., Case, C., Kader, G., Scheaffer, R., and Spangler, D. (2015). Statistical education of teachers. Boston, MA: American Statistical Association.
Franklin, C., Kader, G., Mewborn, D., Moreno, J., Peck, R., Perry, M., et al. (2007). Guidelines for assessment and instruction in statistics education (GAISE) report: A pre-K--12 curriculum framework. Alexandria, VA: American Statistical Association.
Gattuso, L., and Ottaviani, M. G. (2011). “Complementing mathematical thinking and statistical thinking in school mathematics” in Teaching statistics in school mathematics-challenges for teaching and teacher education: A joint ICMI/IASE study. eds. C. Batanero, G. Burrill, and C. Reading (New York, NY: Springer Science+Business Media), 121–132.
Gould, R. (2010). Statistics and the modern student. Int. Stat. Rev. 78, 297–315. doi: 10.1111/j.1751-5823.2010.00117.x
Groth, R. E. (2007). Toward a conceptualization of statistical knowledge for teaching. J. Res. Math. Educ. 38, 427–437. doi: 10.2307/30034960
Groth, R. E. (2013). Characterizing key developmental understandings and pedagogically powerful ideas within a statistical knowledge for teaching framework. Math. Think. Learn. 15, 121–145. doi: 10.1080/10986065.2013.770718
Groth, R. E. (2015). Working at the boundaries of mathematics education and statistics education communities of practice. J. Res. Math. Educ. 46, 4–16. doi: 10.5951/jresematheduc.46.1.0004
Groth, R. E. (2017). Developing statistical knowledge for teaching during design-based research. Stat. Educ. Res. J. 16, 376–396. doi: 10.52041/serj.v16i2.197
Guba, E. G., and Lincoln, Y. S. (1994). “Competing paradigms in qualitative research” in Handbook of qualitative research. eds. N. K. Denzin and Y. S. Lincoln (Thousand Oaks, CA: Sage Publications), 105–117.
Gutiérrez, R. (2013). The sociopolitical turn in mathematics education. J. Res. Math. Educ. 44, 37–68. doi: 10.5951/jresematheduc.44.1.0037
Gutiérrez, R., and Dixon-Roman, E. (2011). “Beyond gap gazing: how can thinking about education comprehensively help us (re)envision mathematics education?” in Mapping equity and quality in mathematics education. eds. B. Atweh, M. Graven, W. Secada, and P. Valero (Dordrecht: Springer Netherlands)
Hayes, M. L. (2019). 2018 NSSME+: Status of high school mathematics. Chapel Hill, NC: Horizon Research, Inc.
Huey, M. E., and Jackson, C. D. (2015). “A framework for analyzing informal inferential reasoning tasks in middle school textbooks” in Proceedings of the 37th annual meeting of the north American chapter of the International Group for the Psychology of mathematics education. eds. T. G. Bartell, K. N. Bieda, R. T. Putnam, K. Bradfield, and H. Dominguez (Michigan State University: East Lansing), 431–438.
Jones, D. L., Brown, M., Dunkle, A., Hixon, L., Yoder, N., and Silbernick, Z. (2015). The statistical content of elementary school mathematics textbooks. J. Stat. Educ. 23, 1–22. doi: 10.1080/10691898.2015.11889748
Jones, D. L., and Tarr, J. E. (2010). “Recommendations for statistics and probability in school mathematics over the past century” in Mathematics curriculum issues, trends, and future directions: 72nd yearbook. eds. B. J. Reys and R. E. Reys (Reston, VA: National Council of Teachers of Mathematics), 65–75.
Kader, G. D., and Jacobbe, T. (2013). Developing essential understandings of statistics: Grades 6–8. Reston, VA: National Council of Teachers of Mathematics.
Kanold, T. D., Burger, E. B., Dixon, J. K., Larson, M. R., and Lienwand, S. J. (2015). Houghton Mifflin Harcourt algebra 1, geometry, and algebra 2. Boston, MA: Houghton Mifflin Haircourt.
Kendall, G., and Wickham, G. (1999). Using Foucault’s methods. Thousand Oaks, Calif: Sage Publications.
Kollosche, D. (2016). Criticising with Foucault: towards a guiding framework for socio-political studies in mathematics education. Educ. Stud. Math. 91, 73–86. doi: 10.1007/s10649-015-9648-5
Konold, C., and Miller, C. D. (2005). TinkerPlots: Dynamic data exploration. Em eryville, CA: Key Curriculum Press.
Lave, J., and Wenger, E. (1991). Situated learning: Legitimate peripheral participation. Cambridge: Cambridge University Press.
Lee, H. S., Kersaint, G., Harper, S. R., Driskell, S. O., Jones, D. L., Leatham, K., et al. (2014). Teachers’ use of transnumeration in solving statistical tasks with dynamic statistical software. Stat. Educ. Res. J. 13, 25–52. doi: 10.52041/serj.v13i1.297
Lehrer, R., and English, L. D. (2018). “Introducing children to modeling variability” in International handbook of research in statistics education. eds. D. Ben-Zvi, K. Makar, and J. Garfield (Berlin: Springer), 229–260.
Lehrer, R., Kim, M., and Schauble, L. (2007). Supporting the development of conceptions of statistics by engaging students in measuring and modeling variability. Int. J. Comput. Math. Learn. 12, 195–216. doi: 10.1007/s10758-007-9122-2
Lerman, S. (2000). “The social turn in mathematics education research” in Multiple perspectives on mathematics teaching and learning. ed. J. Boaler (Norwood, NJ: Ablex), 19–44.
Martin, D. B. (2009). Researching race in mathematics education. Teach. Coll. Record 111, 295–338. doi: 10.1177/016146810911100208
Martin, D. B., Gholson, M. L., and Leonard, J. (2010). Mathematics as gatekeeper: power and privilege in the production of knowledge. J. Urban Math. Educ. 3:95. doi: 10.21423/jume-v3i2a95
National Council of Teachers of Mathematics (NCTM). (2000). Principles and standards for school mathematics. Reston, VA: National Council of Teachers of Mathematics, Inc.
National Governors Association Center for Best Practices (NGA Center) and Council of Chief State School Officers (CCSSO). (2010). Common core state standards for mathematics. Washington DC: Authors.
Peck, R., Gould, R., and Miller, S. (2013). Developing essential understanding of statistics: Grades 9–12. Reston, VA: National Council of Teachers of Mathematics.
Pickle, M. C. C. (2012). Statistical content in middle grades mathematics textbooks (dissertation). Tampa, FL: University of South Florida.
Polikoff, M. S. (2015). How well aligned are textbooks to the common Core standards in mathematics? Am. Educ. Res. J. 52, 1185–1211. doi: 10.3102/0002831215584435
Pratt, D., Davies, N., and Connor, D. (2011). “The role of technology in teaching and learning statistics” in Teaching statistics in school mathematics-challenges for teaching and teacher education: A joint ICMI/IASE study. eds. C. Batanero, G. Burrill, and C. Reading (Berlin: Springer Science+Business Media), 97–107.
Randall, C., Hall, B., Kennedy, D., Bellman, A. E., Bragg, S. C., Handlin, W. G., et al. (2015). Algebra 1, geometry, & algebra 2 common Core series. Hoboken, NJ: Pearson.
Remillard, J., and Heck, D. J. (2014). Conceptualizing the curriculum enactment process in mathematics education. ZDM 46, 705–718. doi: 10.1007/s11858-014-0600-4
Ridgeway, J. (2016). Implications of the data revolution for statistics education. Int. Stat. Rev. 84, 528–549. doi: 10.1111/insr.12110
Ryve, A. (2011). Discourse research in mathematics education: a critical evaluation of 108 journal articles. J. Res. Math. Educ. 42, 167–198. doi: 10.5951/jresematheduc.42.2.0167
Scheaffer, R. L. (2006). “Statistics and mathematics: on making a happy marriage” in Thinking and reasoning with data and chance: Sixty-eighth yearbook. eds. G. Burrill and P. Elliot (Reston, VA: National Council of Teachers of Mathematics), 309–321.
Scheaffer, R. L., and Jacobbe, T. (2014). Statistics education in the K-12 schools of the United States: a brief history. J. Stat. Educ. 22:9705. doi: 10.1080/10691898.2014.11889705
Schmidt, W. H., and McKnight, C. C. (2012). Inequality for all: The challenge of unequal opportunity in American schools. New York, NY: Teachers College Press.
Senk, S. L., and Thompson, D. R. (2003). Standards-based school mathematics curricula: What are they? What do students learn?. New York, NY: Taylor and Francis.
Shaughnessy, M. (2007). “Research on statistics learning and reasoning” in Second handbook of research on mathematics teaching and learning. ed. F. K. Lester (Charlotte, NC: Information Age Publishing), 957–1009.
Steen, L. (2001). Mathematics and democracy: The case for quantitative literacy. Washington, DC: The National Council on Education and the Disciplines.
Stein, M., Remillard, J., and Smith, M. (2007). “How curriculum influences student learning” in Second handbook of research on mathematics teaching and learning. ed. F. K. Lester (Charlotte, NC: Information Age Publishing), 319–369.
Stigler, S. M. (1986). The history of statistics: The measurement of uncertainty before 1900. Cambridge, MA: Harvard University Press.
Stinson, D. W. (2013). Negotiating the “white male math myth”: African American male students and success in school mathematics. J. Res. Math. Educ. 44, 69–99. doi: 10.5951/jresematheduc.44.1.0069
Stinson, D. W., and Bullock, E. C. (2012). Critical postmodern theory in mathematics education research: a praxis of uncertainty. Educ. Stud. Math. 80, 41–55. doi: 10.1007/s10649-012-9386-x
Tarr, J. E., Chávez, Ó., Reys, R. E., and Reys, B. J. (2006). From the written to the enacted curricula: the intermediary role of middle school mathematics teachers in shaping students’ opportunity to learn. Sch. Sci. Math. 106, 191–201. doi: 10.1111/j.1949-8594.2006.tb18075.x
Tarr, J. E., Reys, R. E., Reys, B. J., Chávez, Ó., Shih, J., and Osterlind, S. J. (2008). The impact of middle-grades mathematics curricula and the classroom learning environment on student achievement. J. Res. Math. Educ. 39, 247–280. doi: 10.2307/30034970
Tran, D. (2013). Learning trajectories related to bivariate data in contemporary high school mathematics textbook series in the United States (doctoral dissertation). Columbia: University of Missouri.
Tran, D. (2016). Statistical association: alignment of current U.S. high school textbooks with the common Core state standards for mathematics. Sch. Sci. Math. 116, 286–296. doi: 10.1111/ssm.12179
Tran, D., and Tarr, J. E. (2017). Examination of bivariate data tasks in US high school textbooks through the statistical investigation and cognitive demands frameworks. Int. J. Sci. Math. Educ. 16, 1581–1603. doi: 10.1007/s10763-017-9851-1
Usiskin, Z. (2014). On the relationships between statistics and other subjects in the K-12 curriculum. Sustainability in Statistics Education. Flagstaff, AZ.
Utts, J. (2003). What educated citizens should know about statistics and probability. Am. Stat. 57, 74–79. doi: 10.1198/0003130031630
Wallman, K. K. (1993). Enhancing statistical literacy: enriching our society. J. Am. Stat. Assoc. 88, 1–8. doi: 10.2307/2290686
Weiland, T. (2019). The contextualized situations constructed for the use of statistics by school mathematics textbooks. Stat. Educ. Res. J. 18, 18–38. doi: 10.52041/serj.v18i2.138
Keywords: statistics education, mathematics curriculum, textbook analysis, Foucauldian discourse analysis, written curriculum
Citation: Weiland T (2023) High school mathematics texts construction of statistics practices. Front. Educ. 8:1186522. doi: 10.3389/feduc.2023.1186522
Edited by:
Adam V. Maltese, Indiana University, United StatesReviewed by:
Timothy Fukawa-Connelly, Temple University, United StatesSaskia Schreiter, Heidelberg University of Education, Germany
Copyright © 2023 Weiland. This is an open-access article distributed under the terms of the Creative Commons Attribution License (CC BY). The use, distribution or reproduction in other forums is permitted, provided the original author(s) and the copyright owner(s) are credited and that the original publication in this journal is cited, in accordance with accepted academic practice. No use, distribution or reproduction is permitted which does not comply with these terms.
*Correspondence: Travis Weiland, dHdlaWxhbmRAdWguZWR1