 Ana Susac
 Maja Planinic
 Andreja Bubic3
 Katarina Jelicic
 Marijan Palmovic
- 1Department of Applied Physics, Faculty of Electrical Engineering and Computing, University of Zagreb, Zagreb, Croatia
- 2Department of Physics, Faculty of Science, University of Zagreb, Zagreb, Croatia
- 3Department of Psychology, Faculty of Humanities and Social Sciences, University of Split, Split, Croatia
- 4Laboratory for Psycholinguistic Research, Department of Speech and Language Pathology, Faculty for Special Education and Rehabilitation, University of Zagreb, Zagreb, Croatia
Eye tracking can provide valuable insights into how students use different representations to solve problems and can be a useful tool for measuring the integration of information from multiple representations. In this study, we measured the eye movements of 60 university students while solving two PISA items that contain graphs taken from mathematics and science assessments with the aim of studying the difference in visual attention between students who correctly and incorrectly identify graphs from a verbal description. We were particularly interested in the differences in the integration of information from different representations (text, graphs, and picture) between students who were successful or unsuccessful in solving items. The results suggest that students who solved the items correctly tend to solve the items longer than their counterparts who did not solve the items correctly. Analysis of eye tracking data suggests that students who solved science item correctly analyzed the graph for significantly longer time and had significantly longer average fixation time. This finding suggests that a careful analysis of graphs is crucial for the correct solution of PISA items used in this study. Furthermore, the results showed that students who solved the mathematics item correctly had significantly higher number of transitions between graphs and picture, which indicates a greater integration of information from two different representations. This indicates that these types of items require a lot of time and effort to complete, probably because solving them requires a lot of steps, which is cognitively demanding. We also found that the average fixation durations for different representations may vary for different items, indicating that it is not always equally difficult to extract necessary information from different types of representations. The results of this study suggest that instructors may be able to improve their teaching methods by considering the importance of individual representations (e.g., texts, graphs, and pictures) and the integration of information from multiple sources.
1. Introduction
There is a wealth of research in the field of education that supports the idea that using multiple representations in teaching and learning can be beneficial for students. One early theory that contributed to this understanding is Paivio’s dual coding theory (Paivio, 1971), which assumes that verbal and pictorial information are processed in distinct cognitive systems. This was confirmed by functional brain imaging studies and led to the development of the well-known multimedia learning theory (Mayer, 1997). This theory suggests that presenting information in different representations (e.g., words and pictures) is more advantageous for learning than using single representations (e.g., words alone).
Another theory that helps to explain the benefits of using multiple representations is the cognitive load theory (Sweller, 1988). This theory suggests that students have a limited capacity for processing information in their working memory and that presenting information in multiple representations can help to reduce the cognitive load and make understanding easier. For example, presenting the same information using multiple representations can reduce cognitive load by making it easier for learners to extract the key information and understand the relationships between different concepts. Namely, a graph can provide a visual representation of the same information that was presented in the text, making it easier for learners to understand and remember.
However, it is important to consider that excess information that does not scaffold the learner can have a negative effect on learning. When developing instructional methods and materials, it is important to carefully consider the use of multiple representations. For example, research has shown that the inclusion of pictures in a text can be helpful for students in some cases, but it can also have negative effects on learning (Schnotz and Bannert, 2003). The use of multiple representations can be an effective way to engage students and facilitate learning, but it is crucial to consider the specific needs and abilities of the learners and to use them in a targeted and effective manner. Some researchers developed conceptual frameworks for learning with multiple representations based on constructivist theories of education and research findings on learning and teaching with different representational formats (Ainsworth, 2006; Airy and Linder, 2017).
Eye tracking is a research method that is commonly used in education research to study how people learn and process information. In recent years, there have been numerous eye-tracking studies conducted in the field of physics education, and a review by Hahn and Klein (2022) provides an overview of the main topics and findings from these studies. For example, eye-tracking was used to investigate students’ visual attention while taking standard tests such as the Force Concept Inventory (FCI; Han et al., 2017; Kekule and Viiri, 2018). Küchemann et al. (2020) showed that eye tracking can be used for the identification of preconceptions related to rotating frames of reference. Different strategies in the interpretation of the divergence of the graphical vector field were also explored by using eye tracking (Klein et al., 2018, 2019c). Hoyer and Girwidz (2020) compared the eye movements of students to assess the effect of animation and interactivity in a computer-based physics experiment.
One area that has been explored through eye-tracking research is how students use different representations during problem solving. It has been shown that graphical representations of measurement data can be particularly helpful for students, as they can assist with visualizing and understanding the data (Susac et al., 2017). Supportive diagrams that visualize the physical situation in physics problems can also be beneficial, as they can reduce cognitive load and free up cognitive resources for further problem solving (Susac et al., 2019).
Pictorial representations have also been found to be effective in conveying physics concepts. Chen et al. (2014) found that it is easier and faster to identify crucial areas in a picture than in text while Chen and She (2020) found that pictorial representation helped students to better understand electricity concepts compared to a textual representation. However, it is worth noting that even pictorial representations can contain complex information that is not always easy to understand, as was demonstrated in a study on the recognition of pictorial representation of interference and diffraction patterns in wave optics (Susac et al., 2020, 2021). These studies found that this was a very demanding item for students, not a mere recall of a remembered pattern, thus indicating that pictorial representations can sometimes be challenging to grasp.
Eye tracking has been used extensively to investigate student understanding of graphs in physics. For example, an early study investigated the link between spatial visualization ability and solving kinematics problems and interpreting kinematics graphs (Kozhevnikov et al., 2007). Madsen et al. first analyzed how visual attention differed between those who answered correctly and incorrectly introductory physics problems (some of which contained graphs), and in the subsequent study, they investigated the effects of visual cueing on students’ eye movements and performance on similar problems (Madsen et al., 2012, 2013). Kekule (2014) also explored the differences in the visual attention of students who solved correctly and incorrectly questions with kinematics graphs. Several studies examined students’ eye movements while they were solving questions probing their understanding of graph slope and area under a graph (Susac et al., 2018; Klein et al., 2019a,b; Brückner et al., 2020). Furthermore, the identification of graphs that describe certain physical phenomena was investigated for students who were divided by their physics teacher into one of three groups according to their success in physics classes (Skrabankova et al., 2020). A recent study explored how students extract information from complex graphical displays of information such as the Hertzsprung-Russell diagram (Langendorf et al., 2022).
Research has found that the processing of information conveyed through graphs is complex and can take a significant amount of time to extract the necessary information (e.g., Susac et al., 2018; Klein et al., 2019a). Eye-tracking studies have also shown that experts and non-experts have different strategies for solving items that contain graphs and that students generally struggle with interpreting and analyzing graphs (e.g., Madsen et al., 2012; Susac et al., 2018; Klein et al., 2019a). One area where students have particularly been found to have difficulties is in conceptual understanding and calculation of the area under the graph (Susac et al., 2018; Klein et al., 2019a). Improving students’ understanding and ability to interpret and analyze graphs is an important area of focus in physics education, and the use of eye tracking can help researchers and educators better understand how students approach these items and how they can be supported in their learning.
In addition to examining the use of individual representations, such as texts, graphs, pictures, equations, etc., and comparing their effectiveness, it is also valuable to investigate the use of multiple representations in STEM teaching and learning more broadly. Research in this area can help educators understand how to effectively integrate different representations to support student learning. Eye tracking can be a useful tool for studying the integration of information from different representations, as it allows researchers to track how students use and process multiple forms of information while solving problems (Rau, 2017). Multiple representations can positively affect learning by providing learners with different ways to approach and understand concepts, but too many representations can also lead to confusion and hinder the learning process.
In a recent study, Wu and Liu (2021) found that students with higher prior knowledge had a greater number of eye-movement transitions between representations compared to those with lower prior knowledge. Van Gog et al. (2005) reported some expertise-related differences in electrical circuit-troubleshooting performance while Kekule and Viiri (2018) found differences in the way that students who solved items correctly and incorrectly used different representations. These differences depended on the specific type of representation and the item at hand. For example, students who correctly solved items involving graph representations tended to look at the entire area of the graphs, while those working with motion map representations focused on individual points. Motion map representations depict the motion of an object over time, with each mark on a horizontal line indicating the position of the object at a specific point in time. Ibrahim and Ding (2021) also found that the integration of information from a diagram and text depended on the type of problem being addressed. Overall, the use of multiple representations in physics teaching and learning can be beneficial, and eye tracking can provide valuable insights into how students process and integrate information from different forms of representation.
Multiple representations have also been investigated in other STEM education disciplines such as mathematics and chemistry. For example, Ott et al. (2018) studied the use of different combinations of representations in mathematics problem solving and found that the combination of text and formula was as effective as other combinations containing more representations. In this study, text representation was found to be the most attended to and can be regarded as the reference representation.
Similarly, Stieff et al. (2011) found that students struggle with multiple representations in molecular mechanics and tend to attend more to visual–spatial representations (ball-and-stick model of the molecular system) than mathematical representations (equations). O’Keefe et al. (2014) also explored the integration of information from multiple representations in a multimedia simulation of the ideal gas law and found that transitions between different simulation elements were related to different learning outcomes. The authors emphasized the importance of making conceptual connections between specific representations in the learning process.
In this study, we decided to use Program for International Student Assessment (PISA) items that contain graphs because graphs are often used in PISA items to present information about scientific phenomena or to prompt students to interpret and analyze data. Thus, students need to extract and integrate information from text and graphs to solve the items. In addition, PISA items are designed to evaluate the general knowledge and skills of 15-year-old students in different countries, i.e., they measure “the ability to complete tasks relating to real life, depending on a broad understanding of key concepts, rather than limiting the assessment to the understanding of subject-specific knowledge” (OECD, 2007).
The focus on general knowledge and skills in PISA items is intended to measure students’ ability to think critically and creatively about scientific issues and to use scientific knowledge and skills to solve problems. These are important skills for success in higher education, and PISA items provide a useful way to assess students’ progress in these areas. While the items are designed specifically for 15-year-old students, it is expected that older students should also be able to solve these general items, as they do not require very specific knowledge. The OECD (2018) emphasizes the importance of these skills and the value of PISA items in measuring them.
There have been several previous eye-tracking studies that have used PISA items. For example, Krstić et al. (2018) analyzed the eye movements of 15-year-old students while they were solving PISA reading items. Hu et al. (2017) investigated how high-performing and low-performing students solve different types of PISA problems. Tóthová and Rusek (2022) compared how chemistry students and chemistry experts solve chemistry and general PISA science items and found that the experts were more efficient, needed less time, and focused on relevant parts of the items more than the students. Thomaneck et al. (2022) used PISA mathematics items in a study on the use of the eye-mind hypothesis in the domain of functions. Lundgren (2022) developed a computational model that simulates different strategies for solving a PISA problem-solving item. The study showed that simulations can be useful in understanding how changing a problem’s properties affects our ability to infer problem-solving strategies.
These studies demonstrate the usefulness of PISA items in eye-tracking research, as they provide a standard way to measure student knowledge and skills and allow for comparisons between different groups of students or experts. PISA items are widely used in education research, and the use of eye tracking in studying these items can provide valuable insights into how students attend to and process different forms of information.
In this study, we aim to answer the following research questions:
RQ1. What is the difference in the visual attention between students who correctly and incorrectly identify graphs from a verbal description?
Visual attention refers to the extent to which participants focus on a specific representation (text, graphs, or picture) and can be operationalized through eye-tracking measures, such as dwell time and average fixation duration.
RQ2. What is the difference in the integration of information from multiple representations between students who correctly and incorrectly answer questions?
Integration of information refers to the extent to which participants are able to combine and put together information from multiple representations (such as text, graphs, or picture) to answer a question and can be operationalized through the number of transitions between representations. Participants who correctly answer questions are expected to show greater integration of information from multiple representations than those who do not.
2. Materials and methods
2.1. Participants
Participants in this study were 60 (34 female and 26 male) undergraduate university students in different years of study. They had diverse backgrounds (science, engineering, humanities, etc.) and their mean age was (23 ± 3) years. We used convenient sampling; voluntary participants who were prepared to come to the university for eye-tracking measurement and to answer some mathematics and physics questions. All participants gave informed written consent before taking part in the study.
2.2. Materials
Students answered nine PISA mathematics and science items that were released in 2006 (OECD, 2006a,b) and that were selected so that each item contained a graph in question stem or in multiple-choice options. Since the goal of this study was to investigate the differences in visual attention and integration of information from multiple representations between students who correctly and incorrectly answer questions, we will report results on only two PISA items Q1 and Q2. For these two items, students’ scores were 52 and 48%, i.e., the numbers of students who answered correctly and incorrectly were comparable. For other PISA items, students’ scores were considerably higher, so the numbers of students who answered correctly and incorrectly were not comparable, so we did not analyze them further.
In PISA science item Q1 (S529Q02; OECD, 2006b), four working conditions of electricity generation in a wind farm are described and students are asked which of the given graphs best represents the relationship between wind speed and electric power output (Figure 1A). In PISA mathematics item Q2 (M465Q01; OECD, 2006a), it is described that water is poured into the water tank whose picture is shown. Students should answer which of the given graphs shows how the height of the water surface changes over time (Figure 1B).
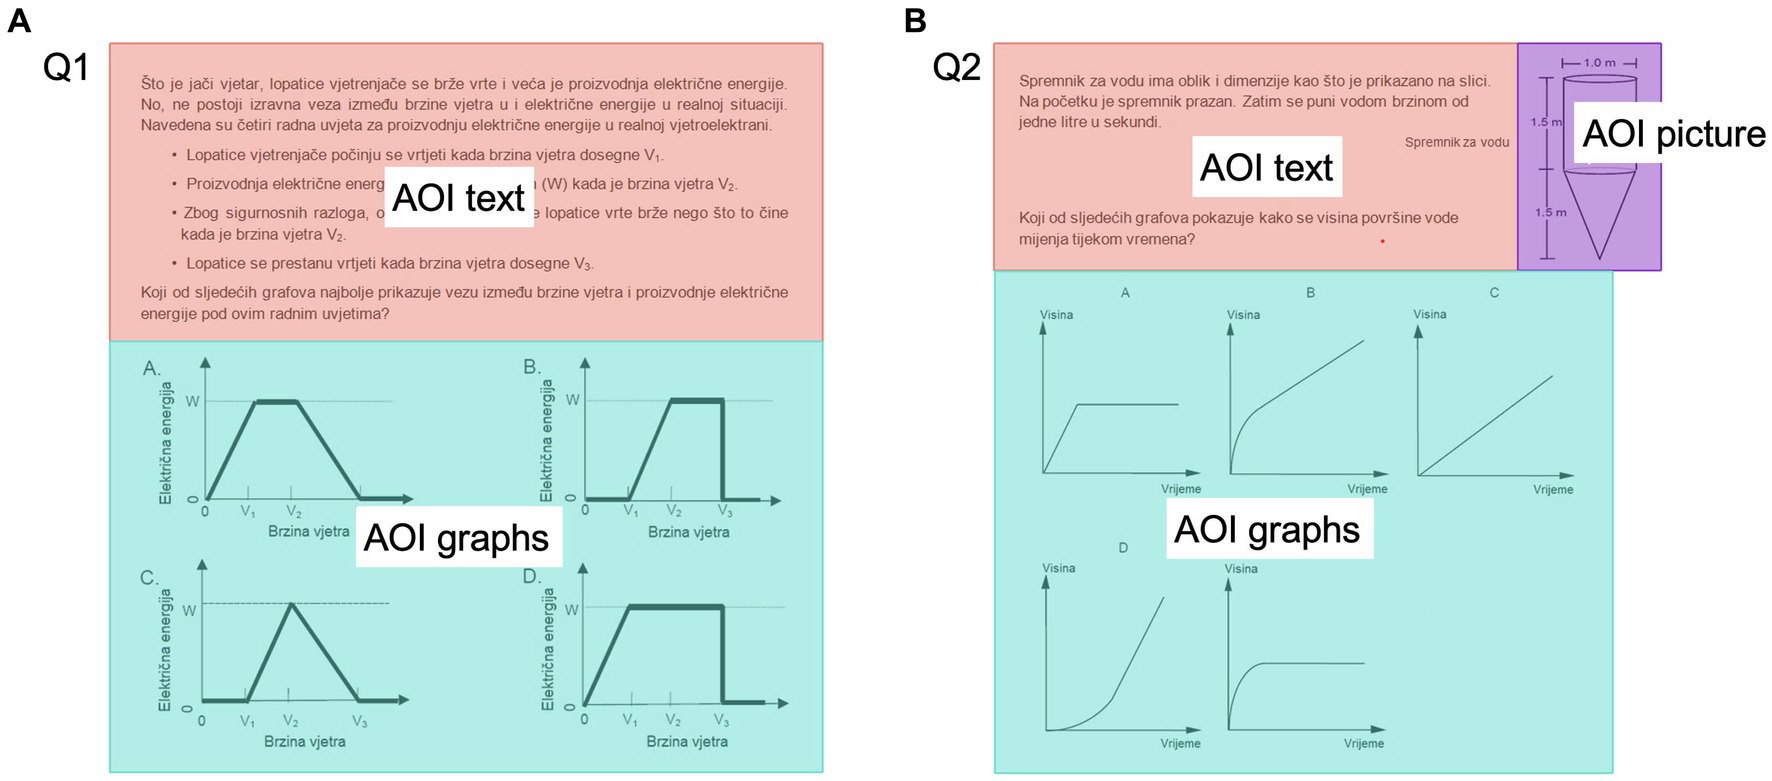
Figure 1. (A) Definition of areas of interest (AOIs) for item Q1. (B) Definition of areas of interest (AOIs) for item Q2.
2.3. Procedure
Eye movements were recorded using the SMI iView Hi-Speed system with a sample rate of 500 Hz and the SMI screen-based RED-m system with a sample rate of 120 Hz (SensoMotoric Instruments G.m.b.H.). The eye-tracking system was calibrated for each participant before the data recording using a 13-point calibration algorithm. Questions were presented on a monitor at a distance of 50 cm from the participants’ eyes. By choosing the answer, participants advanced to the next question. There was no time limit to answer the questions.
After the measurement of eye movements, students solved the same questions using a paper-and-pencil test and gave explanations for their answers. We asked the participants to provide an explanation afterward to make sure they did not choose the correct answer by chance or for the wrong reason. The whole procedure, including eye-movement calibration, recording, and paper-and-pencil testing lasted around 40 min.
2.4. Data analysis
Students’ responses to the nine PISA items were scored correct or incorrect. In addition, these scores were corrected, considering students’ answers and explanations in the paper-and-pencil test. If a correct answer during the eye-tracking measurement was given with a correct explanation in the paper-and-pencil test, the student was awarded one point. If a correct answer was given with a wrong explanation, the student was awarded 0 points. A correct answer without a correct explanation indicated that the correct answer was probably selected by chance or for a wrong reason. The correction of students’ responses given during the eye-tracking measurement was rare, it happened in only 2.4% of all questions. Students’ scores after the correction are reported in this paper.
The recorded eye movements data were analyzed using BeGaze software which allows evaluation of the eye fixations and saccades. Fixation is the state in which the eye is stationary over a period of time, while saccade is the rapid eye movement between fixations. BeGaze used the identification by dispersion-threshold (IDT) algorithm to determine fixations with a maximum dispersion value 100 px and minimum fixation duration 80 ms.
The appropriate number of areas of interest (AOIs) was defined for each item. Figure 1 shows AOIs for items Q1 and Q2. AOIs text included the introduction text and question, and AOIs graphs multiple-choice answers given as graphical representations. Item Q2 also contained an AOI picture, a pictorial representation of a water tank. We evaluated the dwell time, the number of fixations, the number of revisits, and the average fixation duration for each AOI. As we previously reported, these eye-tracking measures are dependent, and usually show a similar pattern of responses (Susac et al., 2019); thus, we will report results on dwell time and average fixation duration. In addition, we evaluated transitions between AOIs as a measure of the integration of information from multiple representations.
Reaction time refers to the amount of time it takes for a person to respond to a PISA item. Dwell time starts at the moment the AOI is fixated and ends at the moment the last fixation on the AOI ends. Fixation duration refers to the average duration of single eye fixations and it typically ranges from 100 to 600 ms (Hahn and Klein, 2022).
Student’s t-test and several two-way ANOVAs were conducted in the analysis of eye-tracking data. A threshold of p = 0.05 was used for determining the level of effect significance within all conducted tests.
3. Results
3.1. Linking information from text and graphs (Q1)
Students who correctly answered item Q1 had the mean reaction time (RT) and standard deviation (80 ± 22) s whereas their peers who incorrectly answered the same item needed (68 ± 21) s to respond. The difference was statistically significant (t(58) = 2.18, p = 0.03).
To compare the distribution of visual attention of students who answered item Q1 correctly and incorrectly, we conducted two-way ANOVAs with repeated measures on factor AOI (text vs. graphs), while the between-subjects factor was Group (correct vs. incorrect). For dwell time, the results showed a statistically significant main effect of both factors, AOI [F(1,58) = 150.41, p < 0.0001, ηp2 = 0.72] and Group [F(1,58) = 5.79, p = 0.02, ηp2 = 0.09], whereas interaction effect was not statistically significant [F(1,58) = 0.15, p > 0.05, ηp2 = 0.003]. Students had a significantly longer dwell time for AOI text [(47 ± 16) s] than AOI graphs [(22 ± 9) s]. Students who correctly answered the question had mean dwell time (37 ± 15) s that was significantly longer than the dwell time (31 ± 13) s of their peers who gave an incorrect answer (Figure 2A). In particular, the dwell time for AOI graphs was (24 ± 9) s for correct solvers, and it was significantly longer than (19 ± 8) s for incorrect solvers [t(58) = 2.38, p = 0.02].
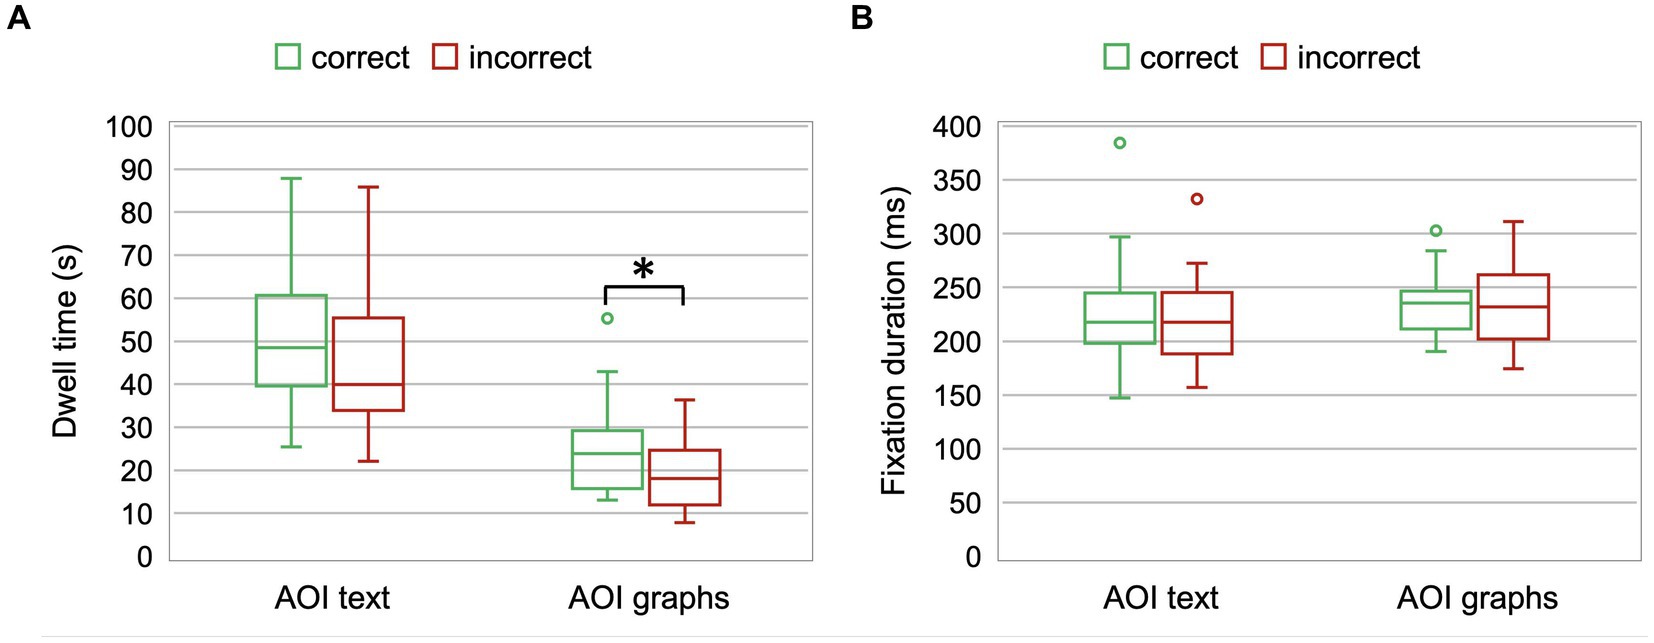
Figure 2. (A) Dwell time of students who correctly and incorrectly answered item Q1 for AOI text and AOI graphs. A box and whisker chart shows median, distribution of data into quartiles, and outliers. (B) Average fixation duration of students who correctly and incorrectly answered item Q1 for AOI text and AOI graphs.
For average fixation duration, a significant main effect of AOI [F(1,58) = 6.15, p = 0.02, ηp2 = 0.10] was found, whereas the effects of Group [F(1,58) = 0.06, p > 0.05, ηp2 = 0.001] and interaction effect [F(1,58) = 0.01, p > 0.05, ηp2 = 0.0002] were not significant. Figure 2B illustrates that the average fixation duration was significantly longer for AOI graphs [(235 ± 33) ms] than for AOI text [(223 ± 43) ms].
To quantify the integration of information from text and graphs, we evaluated the number of transitions between AOI text and AOI graphs (Figure 3). The mean number of transitions and standard deviation for students who answered item Q1 correctly was 20 ± 11, compared to 17 ± 14 for students who answered incorrectly. The difference was not statistically significant [t(58) = 0.67, p > 0.05].
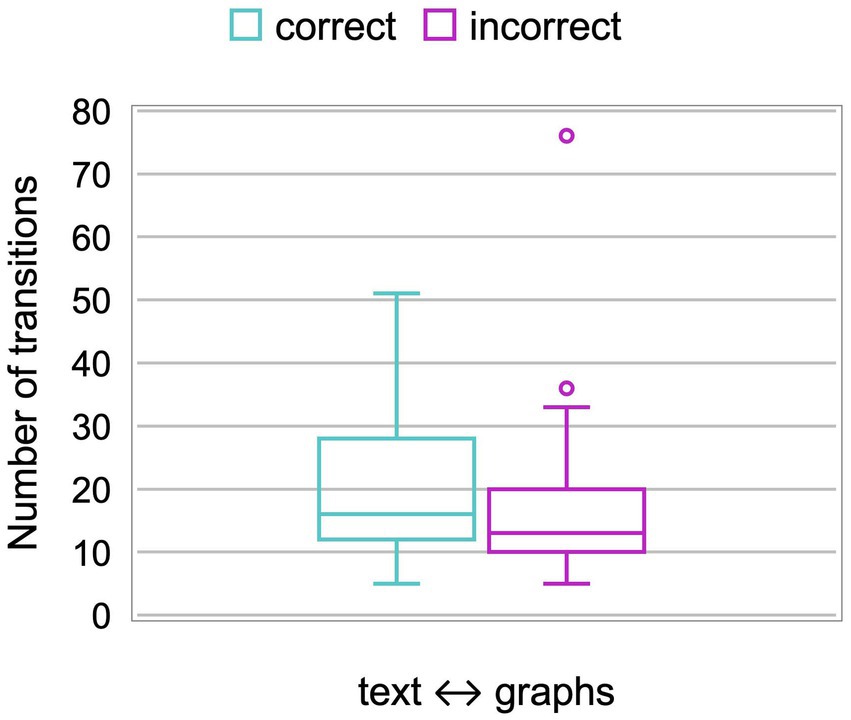
Figure 3. Number of transitions between AOI text and AOI graphs of students who correctly and incorrectly answered item Q1.
Furthermore, we created a sequence chart to visualize the distribution of fixations on AOI text and AOI graphs for students who correctly and incorrectly answered item Q1 (Figure 4). The sequences of eye movements show how often and how long the students attended each AOI. Although Figure 4 shows differences in the visual attention of the participants while they were solving item Q1, they mostly read the text of the task first and then looked at the graphs, occasionally returning to the text. Some participants switched attention from one AOI to another frequently, while others had a much smaller number of transitions between the AOIs.
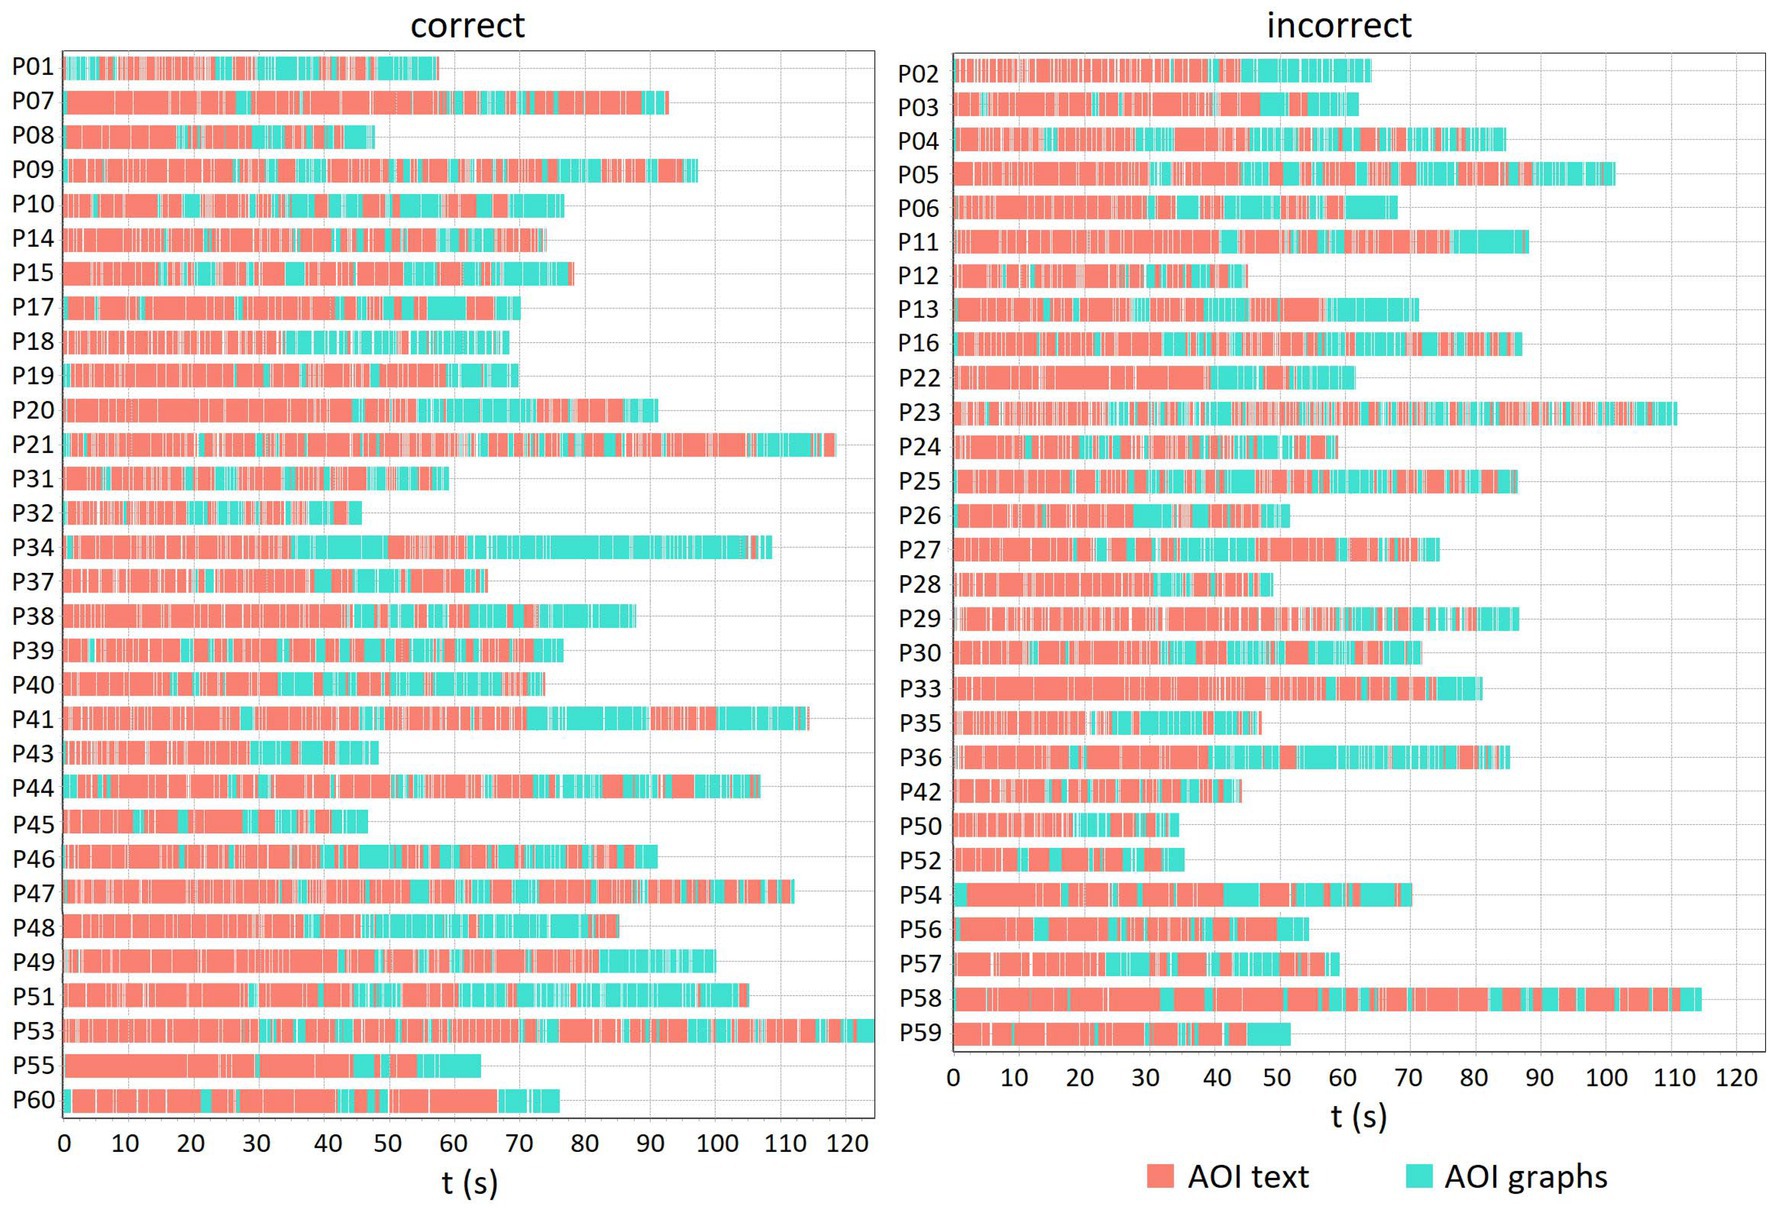
Figure 4. The sequence chart for PISA item Q1 shows the order of fixations for AOI text and AOI graphs, separately for students who solved the item correctly and incorrectly. Fixations that fell within the boundaries of the AOIs are color-coded based on the color of the AOI. Each row represents a different participant.
3.2. Linking information from text, picture, and graphs (Q2)
Mean RT and standard deviation were (51 ± 23) s for students who correctly answered item Q2 and (43 ± 15) s for students who incorrectly answered the same item. The difference was not statistically significant [t(58) = 1.63, p > 0.05].
To compare the students’ dwell time and average fixation duration, we conducted a two-way mixed design ANOVA with a between-subjects factor Group (correct vs. incorrect) and within-subjects factor AOI (text vs. graphs vs. picture). For dwell time, we found a significant main effect of AOI [F(2,116) = 44.46, p < 0.0001, ηp2 = 0.43], whereas the effect of Group [F(1,58) = 2.79, p > 0.05, ηp2 = 0.04] and interaction effect [F(2,116) = 2.87, p > 0.05, ηp2 = 0.05] were not significant. A priori planned comparison of dwell time for two groups (correct and incorrect) on each AOI with Bonferroni-corrected p-values revealed statistically significant difference only for AOI graphs [t(58) = 2.76, p = 0.02]. Students who correctly answered item Q2 had dwell time (18 ± 9) s for AOI graphs that was significantly longer than the dwell time (13 ± 5) s of students who answered incorrectly (Figure 5A).
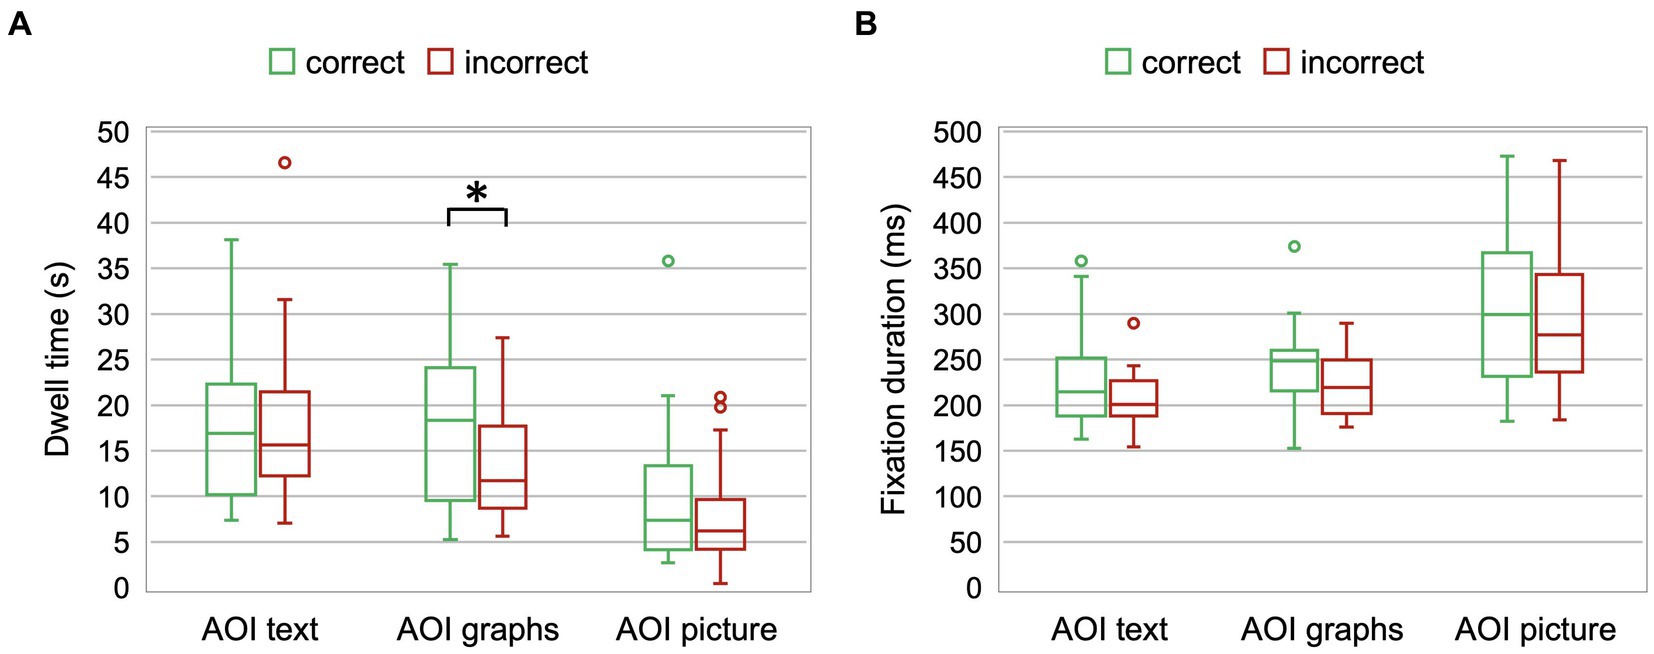
Figure 5. (A) Dwell time of students who correctly and incorrectly answered item Q2 for AOI text, AOI graphs, and AOI picture. (B) Average fixation duration of students who correctly and incorrectly answered item Q2 for AOI text, AOI graphs, and AOI picture.
For average fixation duration, a significant main effect of AOI [F(2,116) = 47.32, p < 0.0001, ηp2 = 0.45] was found, whereas the effect of Group [F(1,58) = 3.76, p = 0.06, ηp2 = 0.06] and interaction effect [F(2,116) = 0.16, p > 0.05, ηp2 = 0.003] were not significant. Figure 5B indicates that the average fixation duration was the longest for the AOI picture. Although Figure 5B shows a trend that students who answered the question correctly have a longer average fixation time, no a priori planned comparison of average fixation time for two groups on each AOI with Bonferroni-corrected p values reached a statistically significant difference. In fact, if we did not correct the p-values for multiple comparisons, we would get the outcome that students who correctly answered question Q2 had a longer average fixation duration for AOI graphs than their peers who failed to do so. Their mean fixation durations were (245 ± 47) and (221 ± 35) ms, respectively, and they were not statistically significantly different.
Again, we used a number of transitions as a measure of the integration of information from text, graphs, and picture. Figure 6 shows the number of transitions between text and picture, text and graphs, and graphs and picture. A two-way mixed-design ANOVA was performed with a between-subjects factor Group (correct vs. incorrect) and within-subjects factor Type of transition (text ↔ picture vs. text ↔ graphs vs. graphs ↔ picture). The results revealed a statistically significant main effect of Type of transition [F(2,116) = 22.99, p < 0.0001, ηp2 = 0.28] while the effect of Group did not reach statistical significance [F(1,58) = 3.92, p = 0.05, ηp2 = 0.06]. The interaction effect of these two factors was statistically significant [F(2,116) = 4.65, p = 0.01, ηp2 = 0.07]. A priori planned comparison of the number of transitions for two groups (correct and incorrect) on each pair of AOIs with Bonferroni-corrected p-values showed statistically significant difference only for transitions between AOI graphs and AOI picture [t(58) = 2.74, p = 0.02]. Students who correctly answered item Q2 had a significantly larger number of transitions graphs ↔ picture than their peers who answered incorrectly (12 ± 9 and 7 ± 6, respectively).
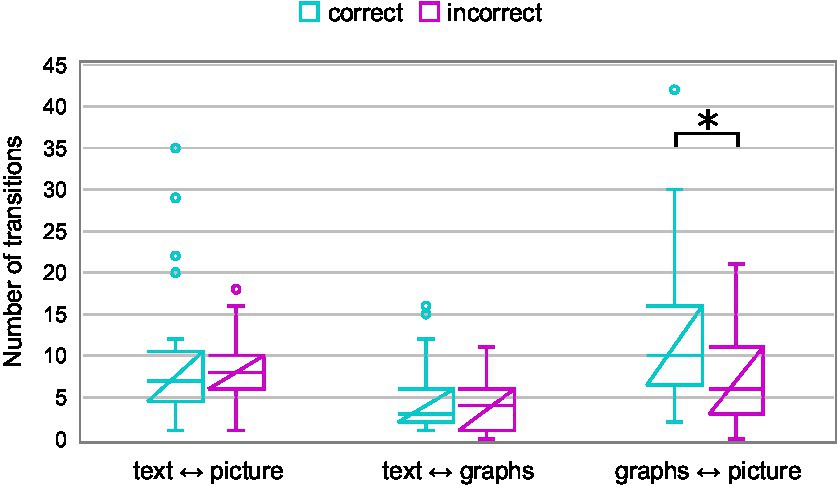
Figure 6. Number of transitions between AOI pairs (text ↔ picture, text ↔ graphs, and graphs ↔ picture) of students who correctly and incorrectly answered item Q2.
To visualize the distribution of fixations at particular AOIs in time, we created a sequence chart. Figure 7 shows that students mostly first read the text, occasionally looking at the AOI picture, and then mostly looked at the graphs, sometimes returning to the AOI picture and/or AOI text. There is also a trend that students who correctly solved item Q2 spent more time paying attention to the AOI graphs than their peers who did not solve the task correctly.
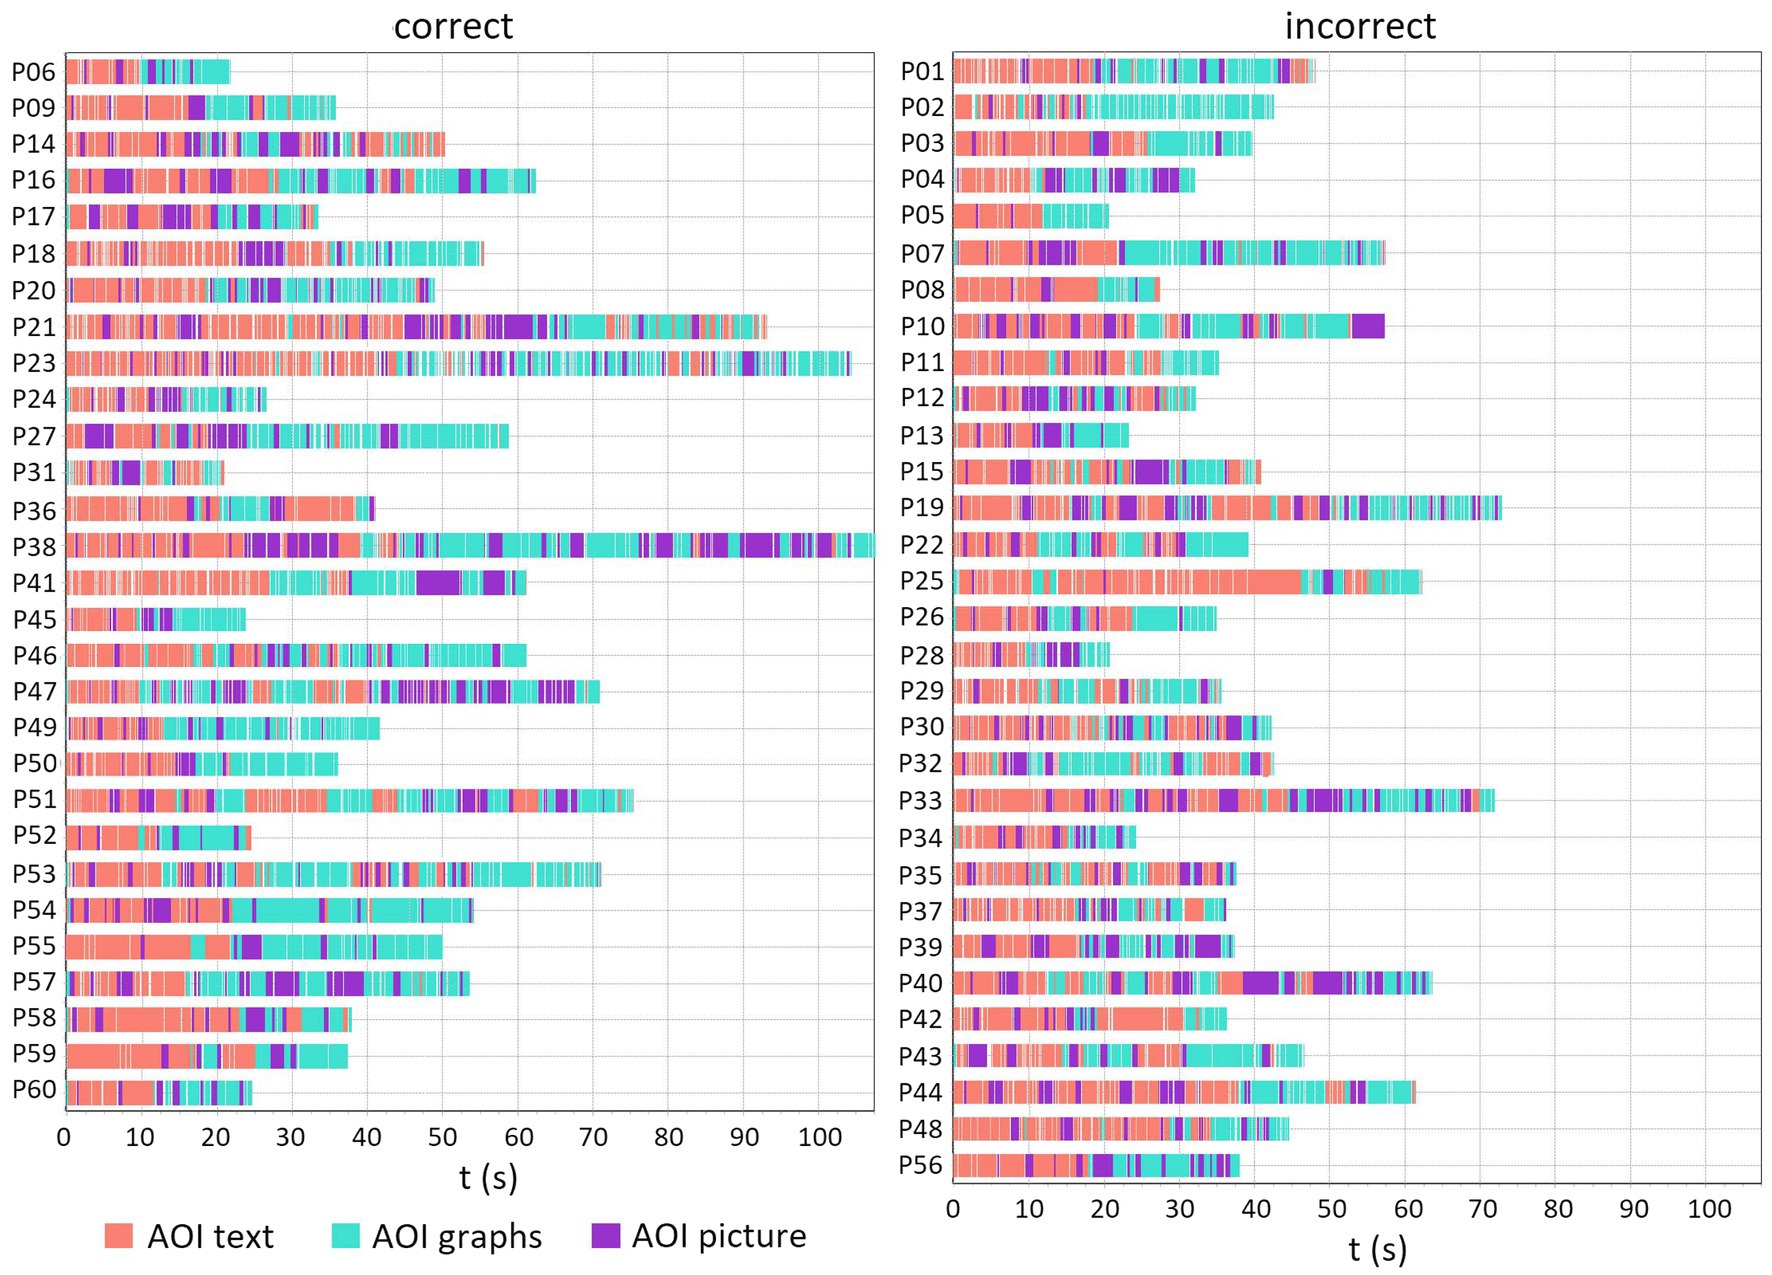
Figure 7. The sequence chart for PISA item Q2 shows the order of fixations for AOI text, AOI graphs, and AOI picture, separately for students who solved the item correctly and incorrectly. Fixations that fell within the boundaries of the AOIs are color-coded based on the color of the AOI. Each row represents a different participant.
4. Discussion
The results of this study suggest that students who correctly solved the two PISA items containing graphs took a longer time to do so than their peers who did not give correct answers. This indicates that some complex PISA items require a longer time to be understood and solved. This is not very surprising, considering that it is unlikely, given the usual types of tasks related to graphs used in mathematics and physics teaching in Croatia, that students are familiar with PISA kind of problems, and it is generally expected that it will take longer to solve unfamiliar problems than familiar ones. Similar results were obtained by Tóthová and Rusek (2022) who found that the student who was successful in solving the PISA item took the longest to do so.
To investigate this further, we compared the dwell times of students who correctly and incorrectly solved items for different representations (text, graph, and picture). For item Q1, which contained text and graphs, students who solved the item correctly had a longer dwell time for AOI graphs. In this item, the text of the task is quite long, and the students attended the text more than the graphs. Item Q2 contained text, graphs and a picture and students spent the least amount of time looking at the picture. This may be because the picture included relatively less relevant information for completing the task, which could have led students to spend less time on it compared to the text and graphs. The only statistically significant difference between the dwell times of students who correctly and incorrectly solved the item was found for AOI graphs. Students who solved the item correctly analyzed the graph for a longer time. This suggests that graph analysis is essential for the correct solution of this item.
Furthermore, different average fixation duration for different representations indicate that it is not always equally difficult to extract the necessary information from text, graphs, and pictures. For question Q1, the average fixation duration for AOI graphs was longer compared to the average fixation duration for AOI text. On the other hand, for question Q2, the average fixation duration was the longest for AOI picture. Again, a trend was shown that the difference between the two groups of students (those who solved the item correctly and incorrectly) appeared for AOI graphs. Again, the key to solving problems correctly seems to be the ability to extract relevant information from the graphs. Also, students who possess prior conceptual knowledge related to the task (e.g., understanding the slope of the graph) may have an advantage in identifying and interpreting relevant information from the graphs, which could lead to more accurate problem-solving outcomes.
Overall, the answer to our RQ1 is that the main difference between students who correctly and incorrectly identify graphs from a verbal description lies in their examination of the offered graphs and extraction of relevant information. These results are consistent with the results of previous eye-tracking studies on students’ understanding of graphs that have shown that understanding graphs and obtaining the required information is challenging for students, especially if it is very likely that they are not familiar with this type of tasks (Susac et al., 2018; Klein et al., 2019a,b).
To answer the research question RQ2 about the difference in the integration of information from multiple representations between students who correctly and incorrectly answer questions, we compared their number of transitions between different representations. The results show a trend of a higher number of transitions for students who solved the items correctly. However, the only statistically significant difference was found for transitions between AOI graphs and AOI picture in question Q2. This indicates that in that item it was crucial to connect the information from the picture and the graphs.
So, the answer to RQ2 is that students who were able to correctly answer the questions tended to have more transitions between representations, especially between those that were important for solving the items. This suggests that it is important for students to be able to link information from multiple representations in order to understand and answer PISA items that contain graphs.
Sequence charts for Q1 and Q2 also illustrate that students who correctly solved these two PISA items spent more time analyzing the graphs than their peers who did not correctly solve the items. Furthermore, they show that students who are successful in solving items have a higher number of transitions between AOIs, which indicates a greater integration of information from different representations. Sequence charts also show high interindividual variability in measured data that could be a contributing factor to the failure to reach the statistical significance of some observed trends in eye-tracking measures for Q1 and Q2.
Our findings are consistent with those of a previous study by Mason et al. (2013), which identified three levels of integration of text and pictures and found that the greater the integrative processing of the illustrated text, the higher the learning performance. Ho et al. (2014) also found similar results in a study on how prior knowledge affects the processing of science texts containing graphs. They found that students with high prior knowledge had more regressions on the graphs, indicating that they were more able to integrate text and graphic information and effectively inspect scientific data. This ability to integrate multiple representations and examine data is essential for inquiry-based learning, and these results suggest that students with high prior knowledge may be better equipped to engage in this type of learning.
The results of our study provided insight into students’ visual attention during answering questions that required them to integrate information from different types of representations (such as text, graphs, and pictures). This information may be helpful for instructors in creating more effective teaching methods. By understanding how students are paying attention to and interacting with different representations, instructors can tailor their methods to better address the needs of their students, including the importance of carefully considering individual representations (especially graphs) and the need to integrate information from multiple sources.
When interpreting the results of this study, it is important to acknowledge that there are some limitations to consider. First, we analyzed students’ eye movements while they were solving only two PISA items. The reason for this was that in other questions, the students had very high scores or the main cause of their difficulties was of a mathematical nature (e.g., problems with calculating percentages). In future studies, it would be needed to analyze the data for more different items to obtain more solid outcomes.
There are several reasons for such high scores of students on PISA items used in this study. University students were solving items intended for 15-year-olds. In addition, participants in our study did not represent the general student population, since we used convenience sampling. Only students who were ready to come to the university for research related to mathematics and physics participated in our study. In addition, our results showed that on some questions (e.g., M159 containing the graph of the speed of the racing car), students give correct answers because they easily eliminate other options, but it is not certain that they understand why the chosen option is correct. In future research, we plan to further investigate the observed problems with some PISA questions.
Furthermore, it would be desirable if we had an even larger sample of participants, although 60 participants is a fairly standard number of participants in eye-tracking studies. There are large differences between participants and the way they allocate their visual attention (Mason et al., 2013). Due to this great variability in the data, in order to obtain statistically significant differences in the results, it is necessary to have a larger number of participants. This is probably the cause of another limitation of this study, which is that some trends can be seen in the data, but they do not always reach statistical significance. Therefore, in future research, more different items with multiple representations should be used and a larger number of participants should be tested.
5. Conclusion
The results of the study suggest that students who are able to correctly solve PISA items that involve the integration of information from multiple representations (such as text, graphs, and pictures) tend to take longer to do so and make more transitions between these different representations than students who are not able to give correct answers. This indicates that these types of items require more time and effort to complete, particularly for students who are not familiar with this type of tasks. PISA items are not standard items that students encounter every day, so students do not have ready-made strategies for solving them. The study also found that the average fixation durations for different representations may vary, indicating that it is not always equally difficult to extract necessary information from different types of materials. These findings may be useful for instructors in developing more effective teaching methods that address the observed student behavior of needing to carefully consider individual representations and integrate information from multiple sources. By taking into account the importance of these factors, instructors may be able to better support their students in understanding and solving complex items.
Data availability statement
The raw data supporting the conclusions of this article will be made available by the authors, without undue reservation.
Ethics statement
Ethical review and approval was not required for the study on human participants in accordance with the local legislation and institutional requirements. The patients/participants provided their written informed consent to participate in this study.
Author contributions
AS, MPl, AB, KJ, and MPa contributed to the conception and design of the study. AS and MPa collected the data. AS analyzed the data and wrote the first draft of the manuscript. All authors contributed to the article and approved the submitted version.
Conflict of interest
The authors declare that the research was conducted in the absence of any commercial or financial relationships that could be construed as a potential conflict of interest.
Publisher’s note
All claims expressed in this article are solely those of the authors and do not necessarily represent those of their affiliated organizations, or those of the publisher, the editors and the reviewers. Any product that may be evaluated in this article, or claim that may be made by its manufacturer, is not guaranteed or endorsed by the publisher.
References
Ainsworth, S. (2006). DeFT: a conceptual framework for considering learning with multiple representations. Learn. Instr. 16, 183–198. doi: 10.1016/j.learninstruc.2006.03.001
Airy, J., and Linder, C. (2017). “Social semiotics in university physics education” in Multiple Representations in Physics Education. eds. D. Treagust, R. Duit, and H. Fischer (Cham: Springer), 95–122.
Brückner, S., Zlatkin-Troitschanskaia, O., Küchemann, S., Klein, P., and Kuhn, J. (2020). Changes in students’ understanding of and visual attention on digitally represented graphs across two domains in higher education: a Postreplication study. Front. Psychol. 11, 1–20. doi: 10.3389/fpsyg.2020.02090
Chen, S. C., and She, H. C. (2020). Effects of analogical learning approaches and presentation modalities on ninth graders’ learning outcome and eye movements: a preliminary study. J. Sci. Educ. Technol. 29, 547–560. doi: 10.1007/s10956-020-09835-7
Chen, S. C., She, H. C., Chuang, M. H., Wu, J. Y., Tsai, J. L., and Jung, T. P. (2014). Eye movements predict students’ computer-based assessment performance of physics concepts in different presentation modalities. Comput. Educ. 74, 61–72. doi: 10.1016/j.compedu.2013.12.012
Hahn, L., and Klein, P. (2022). Eye tracking in physics education research: a systematic literature review. Phys. Rev. Phys. Educ. Res. 18:013102. doi: 10.1103/PhysRevPhysEducRes.18.013102
Han, J., Chen, L., Fu, Z., Fritchman, J., and Bao, L. (2017). Eye-tracking of visual attention in web-based assessment using the force concept inventory eye-tracking of visual attention in web-based assessment using the force concept inventory. Eur. J. Phys. 38:045702. doi: 10.1088/1361-6404/aa6c49
Ho, H. N. J., Tsai, M.-J., Wang, C.-Y., and Tsai, C.-C. (2014). Prior knowledge and online inquiry-based science reading: EVIDENCE from eye tracking. Int. J. Sci. Math. Educ. 12, 525–554. doi: 10.1007/s10763-013-9489-6
Hoyer, C., and Girwidz, R. (2020). Animation and interactivity in computer-based physics experiments to support the documentation of measured vector quantities in diagrams: an eye tracking study. Phys. Rev. Phys. Educ. Res. 16:020124. doi: 10.1103/PhysRevPhysEducRes.16.020124
Hu, Y., Wu, B., and Gu, X. (2017). An eye tracking study of high-and low-performing students in solving interactive and analytical problems. Educ. Technol. Soc. 20, 300–311.
Ibrahim, B., and Ding, L. (2021). Sequential and simultaneous synthesis problem solving: a comparison of students’ gaze transitions. Phys. Rev. Phys. Educ. Res. 17:10126. doi: 10.1103/PhysRevPhysEducRes.17.010126
Kekule, M. (2014). Students’ approaches when dealing with kinematics graphs explored by eye-tracking research method. Eur. J. Sci. Math. Educ. 2, 108–117. doi: 10.30935/scimath/9632
Kekule, M., and Viiri, J. (2018). Students’ approaches to solving R-FCI tasks observed by eye-tracking method. Sci. Educ. 9, 117–130. doi: 10.14712/18047106.1010
Klein, P., Küchemann, S., Brückner, S., Zlatkin-Troitschanskaia, O., and Kuhn, J. (2019a). Student understanding of graph slope and area under a curve: a replication study comparing first-year physics and economics students. Phys. Rev. Phys. Educ. Res. 15:20116. doi: 10.1103/PhysRevPhysEducRes.15.020116
Klein, P., Lichtenberger, A., Kuchemann, S., Becker, S., Kekule, M., Viiri, J., et al. (2019b). Visual attention while solving the test of understanding graphs in kinematics: an eye-tracking analysis. Eur. J. Phys. 41:025701. doi: 10.1088/1361-6404/ab5f51
Klein, P., Viiri, J., and Kuhn, J. (2019c). Visual cues improve students’ understanding of divergence and curl: Evidence from eye movements during reading and problem solving. Phys. Rev. Phys. Educ. Res. 15:10126. doi: 10.1103/PhysRevPhysEducRes.15.010126
Klein, P., Viiri, J., Mozaffari, S., Dengel, A., and Kuhn, J. (2018). Instruction-based clinical eye-tracking study on the visual interpretation of divergence: how do students look at vector field plots? Phys. Rev. Phys. Educ. Res. 14:10116. doi: 10.1103/PhysRevPhysEducRes.14.010116
Kozhevnikov, M., Motes, M. A., and Hegarty, M. (2007). Spatial visualization in physics problem solving. Cogn. Sci. 31, 549–579. doi: 10.1080/15326900701399897
Krstić, K., Šoškić, A., Ković, V., and Holmqvist, K. (2018). All good readers are the same, but every low-skilled reader is different: an eye-tracking study using PISA data. Eur. J. Psychol. Educ. 33, 521–541. doi: 10.1007/s10212-018-0382-0
Küchemann, S., Klein, P., Fouckhardt, H., Gröber, S., and Kuhn, J. (2020). Students’ understanding of non-inertial frames of reference. Phys. Rev. Phys. Educ. Res. 16:10112. doi: 10.1103/PhysRevPhysEducRes.16.010112
Langendorf, R., Schneider, S., and Klein, P. (2022). Extracting information from the Hertzsprung-Russell diagram: an eye-tracking study. Phys. Rev. Phys. Educ. Res. 18:020121. doi: 10.1103/PhysRevPhysEducRes.18.020121
Lundgren, E. (2022). Latent program modeling: Inferring latent problem-solving strategies from a PISA problem-solving task. J. Educ. Data Mining 14, 46–80. doi: 10.5281/zenodo.6686443
Madsen, A. M., Larson, A. M., Loschky, L. C., and Rebello, N. S. (2012). Differences in visual attention between those who correctly and incorrectly answer physics problems. Phys. Rev. Spec. Top. Phys Educ. Res. 8:010122. doi: 10.1103/PhysRevSTPER.8.010122
Madsen, A., Rouinfar, A., Larson, A. M., Loschky, L. C., and Rebello, N. S. (2013). Can short duration visual cues influence students’ reasoning and eye movements in physics problems? Phys. Rev. Spec. Top. Phys Educ. Res. 9:020104. doi: 10.1103/PhysRevSTPER.9.020104
Mason, L., Tornatora, M. C., and Pluchino, P. (2013). Do fourth graders integrate text and picture in processing and learning from an illustrated science text? Evidence from eye-movement patterns. Comput. Educ. 60, 95–109. doi: 10.1016/j.compedu.2012.07.011
Mayer, R. E. (1997). Multimedia learning: are we asking the right questions? Educ. Psychol. 32, 1–19. doi: 10.1207/s15326985ep3201_1
O’Keefe, P. A., Letourneau, S. M., Homer, B. D., Schwartz, R. N., and Plass, J. L. (2014). Learning from multiple representations: an examination of fixation patterns in a science simulation. Comput. Hum. Behav. 35, 234–242. doi: 10.1016/j.chb.2014.02.040
OECD (2007). PISA 2006: science competencies for tomorrow’s world. Available at: www.sourceoecd.org/9789264040007
Ott, N., Brünken, R., Vogel, M., and Malone, S. (2018). Multiple symbolic representations: The combination of formula and text supports problem solving in the mathematical field of propositional logic. Learn. Instr. 58, 88–105. doi: 10.1016/j.learninstruc.2018.04.010
Rau, M. A. (2017). Conditions for the effectiveness of multiple visual representations in enhancing STEM learning. Educ. Psychol. Rev. 29, 717–761. doi: 10.1007/s10648-016-9365-3
Schnotz, W., and Bannert, M. (2003). Construction and interference in learning from multiple representation. Learn. Instr. 13, 141–156. doi: 10.1016/S0959-4752(02)00017-8
Skrabankova, J., Popelka, S., and Beitlova, M. (2020). Students’ ability to work with graphs in physics studies related to three typical student groups. J. Balt. Sci. Educ. 19, 298–316. doi: 10.33225/jbse/20.19.298
Stieff, M., Hegarty, M., and Deslongchamps, G. (2011). Identifying representational competence with multi-representational displays. Cogn. Instr. 29, 123–145. doi: 10.1080/07370008.2010.507318
Susac, A., Bubic, A., Kazotti, E., Planinic, M., and Palmovic, M. (2018). Student understanding of graph slope and area under a graph: a comparison of physics and nonphysics students. Phys. Rev. Phys. Educ. Res. 14:020109. doi: 10.1103/PhysRevPhysEducRes.14.020109
Susac, A., Bubic, A., Martinjak, P., Planinic, M., and Palmovic, M. (2017). Graphical representations of data improve student understanding of measurement and uncertainty: an eye-tracking study. Phys. Rev. Phys. Educ. Res. 13:020125. doi: 10.1103/PhysRevPhysEducRes.13.020125
Susac, A., Bubic, A., Planinic, M., Movre, M., and Palmovic, M. (2019). Role of diagrams in problem solving: an evaluation of eye-tracking parameters as a measure of visual attention. Phys. Rev. Phys. Educ. Res. 15:13101. doi: 10.1103/PhysRevPhysEducRes.15.013101
Susac, A., Planinic, M., Bubic, A., Ivanjek, L., and Palmovic, M. (2020). Student recognition of interference and diffraction patterns: an eye-tracking study. Phys. Rev. Phys. Educ. Res. 16:20133. doi: 10.1103/PhysRevPhysEducRes.16.020133
Susac, A., Planinic, M., Bubic, A., Jelicic, K., Ivanjek, L., Matejak Cvenic, K., et al. (2021). Effect of students’ investigative experiments on students’ recognition of interference and diffraction patterns: an eye-tracking study. Phys. Rev. Phys. Educ. Res. 17:10110. doi: 10.1103/physrevphyseducres.17.010110
Sweller, J. (1988). Cognitive load during problem solving: effects on learning. Cogn. Sci. 12, 257–285. doi: 10.1016/0364-0213(88)90023-7
Thomaneck, A., Vollstedt, M., and Schindler, M. (2022). What can eye movements tell about students’ interpretations of contextual graphs? A methodological study on the use of the eye-mind hypothesis in the domain of functions. Front. Educ. 7:1003740. doi: 10.3389/feduc.2022.1003740
Tóthová, M., and Rusek, M. (2022). Do you just have to know that? Novice and experts’ procedure when solving science problem tasks. Front Educ 7:1051098. doi: 10.3389/feduc.2022.1051098
Van Gog, T., Paas, F., and van Merriënboer, J. J. G. (2005). Uncovering expertise-related differences in troubleshooting performance: combining eye movement and concurrent verbal protocol data. Appl. Cogn. Psychol. 19, 205–221. doi: 10.1002/acp.1112
Keywords: eye tracking, STEM education, visual attention, multiple representations, graphs, PISA
Citation: Susac A, Planinic M, Bubic A, Jelicic K and Palmovic M (2023) Linking information from multiple representations: an eye-tracking study. Front. Educ. 8:1141896. doi: 10.3389/feduc.2023.1141896
Edited by:
Martin Rusek, Charles University, CzechiaCopyright © 2023 Susac, Planinic, Bubic, Jelicic and Palmovic. This is an open-access article distributed under the terms of the Creative Commons Attribution License (CC BY). The use, distribution or reproduction in other forums is permitted, provided the original author(s) and the copyright owner(s) are credited and that the original publication in this journal is cited, in accordance with accepted academic practice. No use, distribution or reproduction is permitted which does not comply with these terms.
*Correspondence: Ana Susac, YW5hLnN1c2FjQGZlci5ocg==