 Maryam Ikram*
 Husaina Banu Kenayathulla*
- Department of Educational Management Planning and Policy, Faculty of Education, University of Malaya, Kuala Lumpur, Malaysia
Purpose: The primary purpose is to examine the impact between education quality (EQ) and student satisfaction (SS) in terms of instructional materials, support, classroom facilities and equipment, and growth in Pakistani private higher education institutes.
Design/methodology/approach: This study utilized correlation-focused quantitative research by randomly distributing a 54-item questionnaire to 440 postgraduate students in Pakistan’s private higher education institutions (HEIs). SPSS (V.23) and PLS-SEM (V.3.3.3) were employed to investigate the data.
Findings: The findings demonstrate that EQ has a direct and significant positive effect on student satisfaction with instructional materials, support, classroom facilities and equipment, and growth in private higher education institutions.
Research implications: The current study will help policymakers, the Higher Education Commission (HEC), and institutions to pay greater attention to the significance of education quality indicators in making a difference in higher education, which may contribute to student satisfaction. In addition, their efforts will significantly contribute to the nation’s progress. Furthermore, it will contribute to the betterment of the world by accomplishing the sustainable development goal of quality education set by the United Nations. The recent findings will also have far-reaching advantages for society, demonstrating the positive effects that high-quality education may have on a nation’s progress by creating competent and productive students.
Limitations: Only private universities in Pakistan’s higher education sector were considered for this study, and students enrolled in post-graduate degrees were the subjects of this investigation. This study was restricted to testing in only one province, Punjab, Pakistan. Another limitation of this study is that it is based on a research framework deduced from previous underpinnings and literature.
Originality: These findings contribute to the existing area of research on the direct and significant effects of EQ on SS in HEIs. These findings may positively impact student satisfaction in private higher education institutions. The findings can guide higher education institutions (HEIs) regarding the importance of EQ in achieving desirable student satisfaction (SS). Because the Higher Education Commission (HEC) efforts will contribute considerably to the growth of higher education institutions (HEIs) and the nation, this study is vital for policymakers and practitioners working in higher education.
1. Introduction
Knowledge has grown exponentially in the twenty-first century (Hislop, 2005). The role of education has also shifted in this context, as it is hard to convey and accumulate such vast volumes of information in a typical classroom setting. Researchers notice new trends in Pakistani educational institutions to ensure students are well-versed in the most recent information (Hamza et al., 2018; Jan et al., 2018). These instruction techniques are outdated and must be improved for students to learn properly. It has been argued that educational processes do not adequately prepare students for these principles of expert competence (Renkl et al., 1996).
In the enormous race between public and private higher education institutes (HEIs), institutes should remain competitive to attract local and international students. This can be achieved by maintaining the service quality of institutions (Gul et al., 2019). Parents invest in their children’s education since it has evolved into a profession and a social requirement. Higher education students place a greater premium on education quality; they are looking for a comprehensive education that will prepare them for the real world at the university premises to improve their skills and capabilities to develop an influential educational personality that always satisfies them (Malik and Danish, 2010). HEIs play a significant part in the world because they are considered a cornerstone for educating people, advancing technologies, and enhancing economic development (Lu et al., 2017). When students reach a higher level of achievement, they want higher quality education and expect greatness from the educational system. Universities provide more and different qualities of education and good services; the more and new prevailing enactment will be there from the students’ side.
High-quality education can increase student satisfaction, leading students to clarify their vision and missions. Cheng and Tam (1997) developed the following seven paradigms of high education quality: (1) satisfaction, (2) mission attainment, (3) avoidance of difficulties, (4) tools (including time and money), (5) knowledge management, (6) authenticity, and (7) procedure. The satisfaction model may be used to develop and implement strategies for high-quality education and is a valuable alternative for researchers. Kuo, Walker, Belland, and Schroder believe that students’ satisfaction is one of the most significant aspects in establishing the quality of educational courses in today’s competitive environment (Kuo et al., 2013). The quality of services provided to students is being evaluated by universities as part of their efforts to develop new policies and approaches (Mark, 2013). For higher education institutions to remain competitive, they must meet and exceed the expectations and needs of their students at all levels (Khosravi et al., 2013). The improvement of workforce skills through teaching and learning is a potential driver of economic growth as well (Wafudu et al., 2022). Thus, universities must improve the quality of their teaching and learning to boost student satisfaction.
This study focuses on UNESCO education quality indicators. Student characteristics, context, enabling inputs, teaching and learning, and educational results are indicators of education quality, as defined by UNESCO (2004). Ability, prior knowledge, learning challenges, and demography are characteristics of a learner to consider. Various factors must be considered when evaluating students’ academic performance in a given situation. Enabling inputs include teaching and learning materials, physical infrastructure, facilities, and related human resources for students at all levels of education. There are several aspects of teaching and learning, including instructional time, teaching methods, assessment, and class size. In addition to reading and numeracy skills, students are expected to develop many other life skills and personal values. Hence, to address the independent variable (education quality), the current study concentrates on teaching and learning materials, physical infrastructure and facilities, teaching methods, and assessment.
Regarding education and services, universities are ideal places for students (Childers et al., 2014). Considering how students connect to their campus and their enthusiasm to use the services that may influence students’ satisfaction levels is one way that educational institutions can enhance the quality of teaching in higher education institutes. In their study, Chang and Fisher (2001) found that a student’s satisfaction is vital to attain their skills or knowledge at the learning environment level. Suppose a student feels that the lesson meets only his expectations and needs. In that case, he can be satisfied, and this is an approach to encourage the student to put his best endeavors into knowledge, boost their constructive mindset on learning, and show up for future classes (Geçer, 2013). This implies that institutions must focus on student satisfaction rather than just education quality.
According to research, higher education institutions environments influence students’ opinions of quality. As a general rule, students who attend colleges and institutions where education quality is emphasized tend to have a more optimistic understanding of the quality of their learning (Akareem and Hossain, 2016). The quality of an institution of higher learning is also affected by factors such as the faculty’s pedagogical approach and their attitude toward their work, facilities such as classrooms and labs, administrative practices such as how they behave, and the physical environment such as support infrastructure and general infrastructure (Mastoi and Hai, 2019). Therefore, educational institutions need to investigate the factors influencing student satisfaction with the quality of the services provided by HEIs.
According to the findings of a recent survey, a student’s level of satisfaction with their educational institution is thought to be affected by factors including the quality of the facilities available to them, such as the library and lab, as well as their access to various forms of communication. Improving communication and other facilities, such as labs and library services, are among the factors contributing to a higher satisfaction level (Ali, 2019). In another Pakistani study, researchers investigated the aspects that affect students’ satisfaction with the quality of the facilities offered by institutions, such as reputation, cost, and culture. Although service quality positively affects student satisfaction, reputation, and pricing have negative effects (Saleem et al., 2017). The higher education sector plays a significant role in shaping student satisfaction across the majority of developed and developing countries (Ikram and Kenayathulla, 2022a).
Pakistani universities encounter many challenges in systematizing their operations and services, according to Riaz (1990) and Mahmood (1999). He identified the following characteristics as significant barriers: insufficient planning, lack of proficiency with computers, lack of a digital library, retroactive transformation, absence of quality standards, an overly complex setup, and technological deficiencies. According to Anwar (1993), libraries in Pakistan have difficulty automating their routine tasks. However, the critical issues at higher education institutions were that librarians lacked computer literacy, administrators and personnel lacked collaboration in sharing experiences, and there were no standards in place in higher education institutes. According to Ramzan (2004), the library suffers from inadequate sufficient and suitable budgets, standard library software, and adequate IT-literate staff.
Greater attention should be paid to higher educational policymaking, as it is a critical feature of higher education, since all aspects of the organizing process (including implications, limitations, and outcomes), as well as indicators that may be used to make effective policy decisions, are included (Cohen, 1980). According to Pakistan’s 1979 national education policy, universities and libraries will provide sufficient educational equipment and labs with up-to-date technology. The Lahore University of Management Science and AghaKhan University were the two private universities created in Pakistan by the national education strategy of 1979. This has established a precedent for other private institutions in the private sector based on these basic metrics of success. The administration’s management style, the caliber of the faculty, the school’s legitimacy, the existence of student organisations, and a minimum of 80% student attendance all rank high on that list. An extra effort to improve higher education quality was made between 1998 and 2010 by bringing educational practices in line with international norms. Furthermore, the quality of education, which includes aspects such as student characteristics, background, enabling suggestions, teaching and learning, and learning goals, is thought to be among the essential aspects of higher education (UNESCO, 2004). Excellent policies in a minimum of four different social, economic, administrative, and political domains are the defining characteristics of high-quality institutions (Jazuli et al., 2022).
The education level offered at several universities is substandard (Abbasi, 2021). HEC officials revealed data on university performance. Nasir Shah, Director of Quality Assurance for the Higher Education Commission (HEC), informed the committee that 91 universities had submitted their yearly progress reports in response to the interim analysis of the Quality Enhance Cells (QEC) of the universities (2018–19). Annual reports indicated that the education provided by 32 different universities was deemed to be of an inadequate standard. In addition, 18 universities in Pakistan declined to submit yearly reports to the Higher Education Commission (HEC) (Abbasi, 2021).
Within the scope of the present investigation, student satisfaction (SS) served as the dependent variable. Student satisfaction has been the subject of numerous studies on universities’ services in Pakistan’s private and public education sectors. According to Butt and Rehman (2010), students’ satisfaction with teachers, the learning environment, the courses offered, and the classroom facilities positively and significantly impact student satisfaction with their campus. The authors explained the findings in a study published in 2010. Furthermore, Manzoor (2013) explored whether on-campus facilities, such as sporting facilities and transportation networks, positively impact scholarly satisfaction in universities, while off-campus facilities have no significant impact on scholarly satisfaction.
Najib et al. (2011) investigated student satisfaction levels with facilities provided by universities to students in Malaysia. According to the results of this analysis, student satisfaction with accommodation is one of the essential variables in Malaysian institutions. Students want housing managers and facility administrators from higher learning institutions to provide better accommodation to improve their services. Garwe (2016) explored the factors students consider when enrolling in higher education institutes. Several variables must be considered, including promotions and advertising, quality of instruction, opportunity, expenses with a pricing structure, and academic reputation, including recognition in the society where the university is located.
Pakistan has one of the world’s lowest college enrolment rates, with only 3% of 17–23 year olds enrolled (Ghulam, 2017). As a result, there will be a reduction in the general quality of higher education (HE) in the coming years, which is detrimental to the prospects of higher education as a whole. Pakistan has suffered significantly from educational failures. Even though it has existed for 74 years, Pakistan does not find itself in an advantageous situation; it continues to spend only 2.9% of its GDP on education, which is less than the 4 percent recommended by UNESCO for all developing nations (World Bank, 2020). The top 300 universities worldwide do not include a single Pakistani institution. Most Pakistani students prefer to pursue further education elsewhere due to the country’s underfunded educational institutions, outdated laboratories, and low technology standards, as well as a weak research culture and an unfair examination assessment system, which lead to poor satisfaction levels (Isani and Virk, 2005).
As a result, this research aims to investigate the direct and significant positive effect of EQ on SS with the instructional materials, instructional support, classroom facilities and equipment, and growth in HEIs.
As such, the following are the aims of this research:
1. To analyse the direct and significant positive effect of EQ on SS in terms of instructional material in HEIs.
2. To analyse the direct and significant positive effect of EQ on SS in terms of instructional support in HEIs.
3. To analyse the direct and significant positive effect of EQ on SS in terms of classroom facilities and equipment in HEIs.
4. To analyse the direct and significant positive effect of EQ on SS in terms of growth in HEIs.
2. Literature review
2.1. Total quality management theory
Several theories and models cover education quality and its indicators of education quality. W. Edwards Deming is one of the pioneers of total quality management (TQM) theory and built some of the most significant and unique tactics for increasing the efficiency and quality of any organisation (Deming, 1982). Using Deming’s theory, quality can be improved by reducing the unpredictability and uncertainty associated with how they are given. Deming (1986) defines that irregular service delivery upsets consumers or students and harms the reputations of firms or universities, according to Deming (1986). Variability in higher education can be defined as a single teacher using a student-centered teaching approach. However, one of them focuses solely on conveying information about the subject at hand. There may be a discrepancy between declared learning outcomes and an evaluation that measures something other than what was indicated (Redmond et al., 2008).
For all systems and organizations with a plan for continuous improvement, Deming’s wheel can be used as a vital tool to help them achieve their goals (Deming, 1986). The Deming PDCA cycle recommends four main actions to enhance product quality.
1. Plan: The first stage in improvement is identifying the issues and proposing remedies (Deming, 1986). Deming advises companies to establish waste reduction and quality-improving practices and methods by creating high-quality products and essential services that customers want. Physical infrastructure and facilities, as well as teaching and learning materials, were included in the first step of this study. Higher education institutions should design optimum physical infrastructure and facilities for student learning.
2. Do: The second step is to implement a plan to check whether it will work. Implement a plan to measure performance (Deming, 1986). In this study, the 2nd step involved teaching methods. Higher education institutions should implement effective teaching methods to satisfy their students.
3. Check: The third stage is to keep an eye on the results to see how changes in quality affect the outcomes and detect new issues (Deming, 1986). Check the measurements and report the findings to decision-makers. In this research, 3rd step was assessment. Higher education institutes should check their plans by assessing their students.
4. Act: Concludes changes that need to be made and implemented. Implement the changes according to the previous results (Deming, 1986). The findings of this research will be used by the HEC, universities, and policymakers to inform their respective action plans.
2.2. Education quality in HEIs
Various interpretations of the term quality in education depend on context (Abukari and Corner, 2010). Higher education institutions with diverse student bodies are under enormous pressure to become more attentive to their students’ needs and more efficient, effective, and student-centered in their operations. Quality in higher education matters most in today’s academic research and analysis world, and many studies have been done to determine how to assess better and quantify excellence in HE.
One study, an evaluation of management students’ insights about education quality in public institutes, presented by Narang (2012), exposed the features of quality and categorized them into five categories: physical services and accommodations, instructors, learning outcomes, receptiveness, and personality development, among others. Business students’ satisfaction on campus was broken down into many categories by Yusoff et al. (2015), including contented atmosphere, student assessment, and learning practices, teaching space setting, lectures and teaching and learning materials, books and tuition fees, funding opportunities, professional events, affiliation with faculty, educated and reactive faculty, staff usefulness, and feedback. Feedback, aligning assessments with learning aims and results, using grading criteria, and regularly supervising and adjusting assessment processes were the most popular assessment methods (Almossa and Alzahrani, 2022). Gruber et al. (2010) built a quality-measurement tool based on 15 quality parameters. His research in Germany at the University of Education included most facets of student life on campus, intending to assess student satisfaction with the institution. This list includes the following dimensions: organizational and student facilities, student climate, the attractiveness of the location, computer labs and equipment, libraries, reactive faculty, lecture halls, and cafeterias, the importance of teaching to practice, and university ranking, reputation settlement support from faculty presentations of information and university facilities.
2.3. Education quality in Pakistani HEIs
Pakistan’s state of higher education was unstable during the period of independence. The only institute of advanced learning in 1947 was known as Punjab University (Khawaja, 1996). University Grant Commission (UGC) accreditation was created and was responsible for accrediting all universities in Pakistan during that period. This entity was renamed the Higher Education Commission (HEC) in 2002 after it underwent a major revision in 1974. The Higher Education Commission (HEC) monitors, regulates, and accredits Pakistan’s efforts to improve higher education, an agency constitutionally mandated to function independently, autonomously, and independently. HEC contributed significantly to improving the quality standards for HE.
The Global Human Capital Report ranks Pakistan 125th out of 130 total countries, which assesses them according to their educational achievement. According to the report, Pakistan’s human capital potential is stifled by poor-quality education and low enrollment rates. Sri Lanka was the only country in South Asia to make the top 100, ranking 70th. Sri Lanka’s higher quality educational institutions and high enrolment rate positively affect the country. Nepal ranked 98th, India ranked 103rd, and Bangladesh ranked 111th. None of these South Asian countries, including Pakistan, have attained the 60 percent human capital development benchmark, with Sri Lanka being the one exception (World Economic Forum, 2017).
Furthermore, in 2007, 6 percent of Pakistanis (9 percent of males and 3.5 percent of women) earned a bachelor’s or higher degree, according to the UNESCO Global Education Digest 2009. However, in 2010, this number dropped to 5% after a steady decline. According to Pakistan’s objectives, this percentage will increase to 10% in 2015 and 15% by 2020. The annual decrease in enrolment was approximately 5% after the initial spike (Global Education Digest, 2010). Likewise, the ratio of students enrolled in higher education is unsatisfactory in Pakistan. The world’s top 300 universities do not include a single Pakistani institution. Most Pakistani students prefer to pursue further education elsewhere because of the country’s underfunded educational institutions, outdated laboratories, low technology standards, weak research culture, and unfair examination assessment systems (Isani and Virk, 2005).
To that end, this research developed a theoretical framework based on the total quality management strategy put forward by Deming (1982). The conceptual framework has focused on the education quality indicators recommended by UNESCO (2004), and it has also been formulated based on the two-factor theory (Herzberg et al., 1959).
Education quality is determined by examining teaching and learning materials, physical infrastructure and facilities, teaching methods, and the assessment of educational institutions, as outlined by UNESCO (2004). These metrics were measured using a combination of measures to assess educational quality. In addition, satisfaction measurement includes four primary outcomes: instructional material, instructional support, classroom facilities and equipment, and growth (Herzberg et al., 1959). This study examined EQ’s impact on SS in terms of instructional material, instructional support, classroom facilities and equipment, and the growth of private higher education institutions.
2.4. Hypotheses development
Therefore, this study evaluated the following null hypotheses:
H01: There is no direct and significant positive effect of EQ on SS in terms of instructional material in HEIs.
H02: There is no direct and significant positive effect of EQ on SS in terms of instructional support in HEIs.
H03: There is no direct and significant positive effect of EQ on SS in terms of classroom facilities and equipment in HEIs.
H04: There is no direct and significant positive effect of EQ on SS in terms of growth in HEIs.
3. Methodology
This study used a quantitative method that fits positivist philosophical ideas. The positivism paradigm employs various methods such as descriptive, correlational, quasi-experimental, and experimental to conduct research (Ikram and Kenayathulla, 2022b). In this study, a correlational design was taken, and the questionnaire was the primary focus of the investigation. The subsequent sections provide further information on the population, sample, and instruments, along with data collection techniques.
3.1. Population and sampling
This study’s data pooled postgraduate students attending private HEIs in Lahore, Punjab Province, Pakistan. In Lahore, 48,487 students were attending private institutes of higher education at the time of access in December 2021. The data came from postgraduate students at 11 private higher education institutes. The information was gathered by taking a random sampling method. In this investigation, a basic random sampling method was applied using a random application. Everyone in the population stands an equal probability of being selected with this strategy (Creswell, 2012). For a population of 48,487, a sample size of 381 is the bare minimum, as by the Krejcie and Morgan (1970) table (cited in Chua, 2016). This study aimed to obtain more than 381 responses based on this rule. The research tools included an information sheet detailing the study, a consent form, and a personal information sheet for each participant. Table 1 shows the respondents’ demographic characteristics.
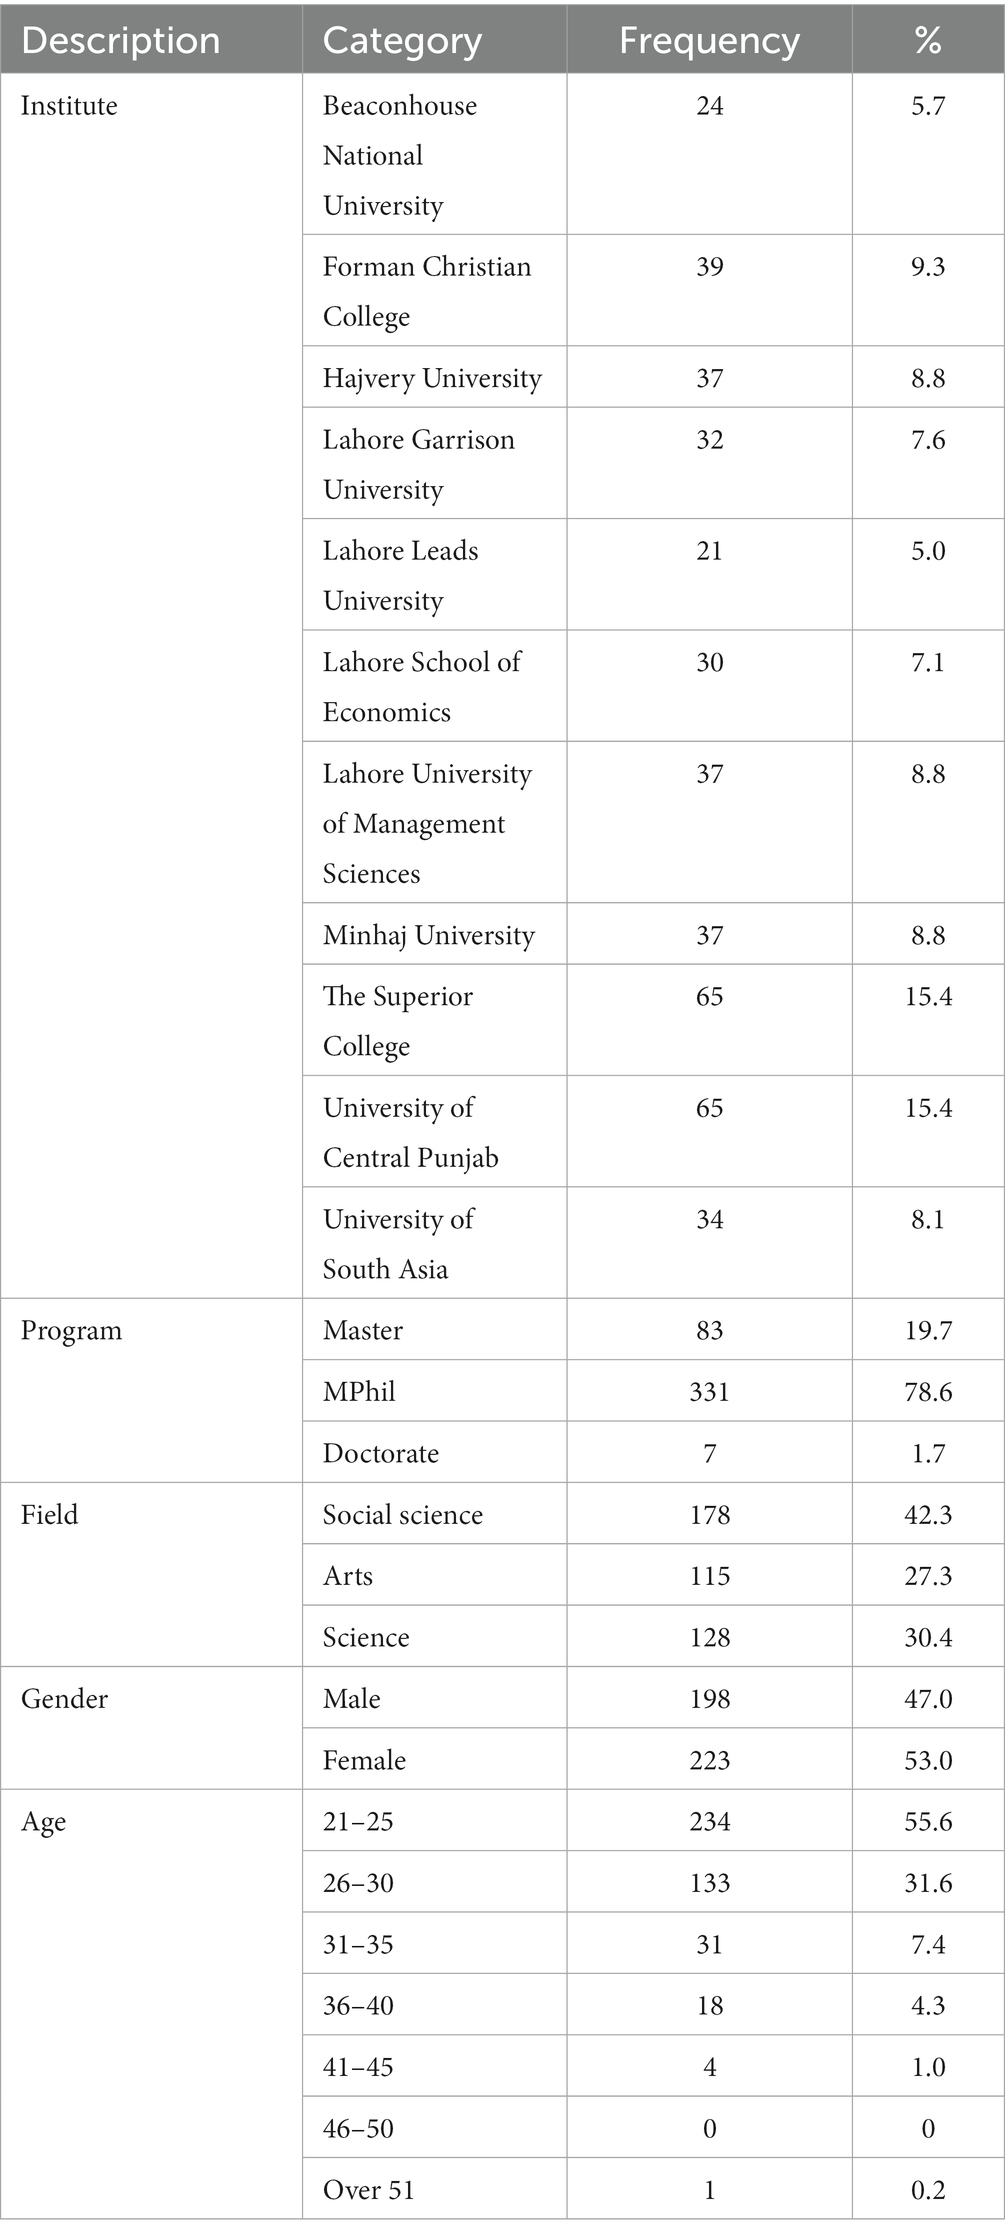
Table 1. Demographic information of the respondents.
SPSS descriptive statistics were used to examine demographic information. According to the information shown in Table 1, most of the respondents came from the Superior College and the University of Central Punjab. The vast majority of participants held an MPhil. Most people who answered had signed up for the social science program. In addition, there were more female respondents than male respondents. Lastly, most responses were between the ages of 21 and 25.
3.2. Instrumentation
The questionnaire comprised three primary sections: demographic information about the respondents, EQ, and SS. The demographic information included institutes, programs, fields, gender, and age. The EQ section has four sub-sections: teaching and learning materials (TL), physical infrastructure and facilities (PH), teaching methods (TM), and assessment (AS). As the EQ was evaluated based on quality indicators, as suggested by UNESCO (2004), various items from various surveys were adopted to evaluate education quality indicators, together with those from Ferwana (2018), Goos and Salomons (2016), Law and Meyer (2011), Sultana et al. (2009), Teeroovengadum et al. (2016), and Vazirova (2016). The instrument used in this investigation combines many other instruments. Combining many instruments is a crucial method that helps minimize each instrument’s limitations and maximize its strengths (Carroll et al., 2012). This section featured eight items under the teaching and learning materials subheading, nine under the physical infrastructure and facilities subheading, seven under the teaching methods subheading, and six under the assessment subheading. The third section of the questionnaire was taken from Gruber et al. (2010) and Olmos-Gómez et al. (2020). It has four sub-sections: instructional material (seven items), instructional support (five items), classroom facilities and equipment (five items), and assessment (seven items). Respondents’ opinions on the EQ and SS were calculated using a five-point Likert scale, with respondents being expected to select one answer for each item based on the options:1 = strongly disagree, 2 = disagree, 3 = neutral, 4 = agree, and 5 = strongly agree. The questionnaire of this study consisted of 54 questions, separated into two major portions: EQ and SS. The following sections summarize the questionnaire’s validity and reliability as determined by the SPSS software program (V.24) and partial least squares structural equation modeling (PLS-SEM).
3.3. Validity
In addition to examining the convergent validity of the components, face validation was performed. Face validation was conducted by four professionals in educational management, planning, and policy with related knowledge and experience in the relevant subject. As indicated in Table 2, the average variance extracted (AVE) was evaluated using PLS-SEM to assess the convergent validity of the correlation between scale constructs. A high degree of convergent validity was inferred from values of 0.5 and higher (Hair et al., 2017). Therefore, each AVE value fell within the permissible range of values.
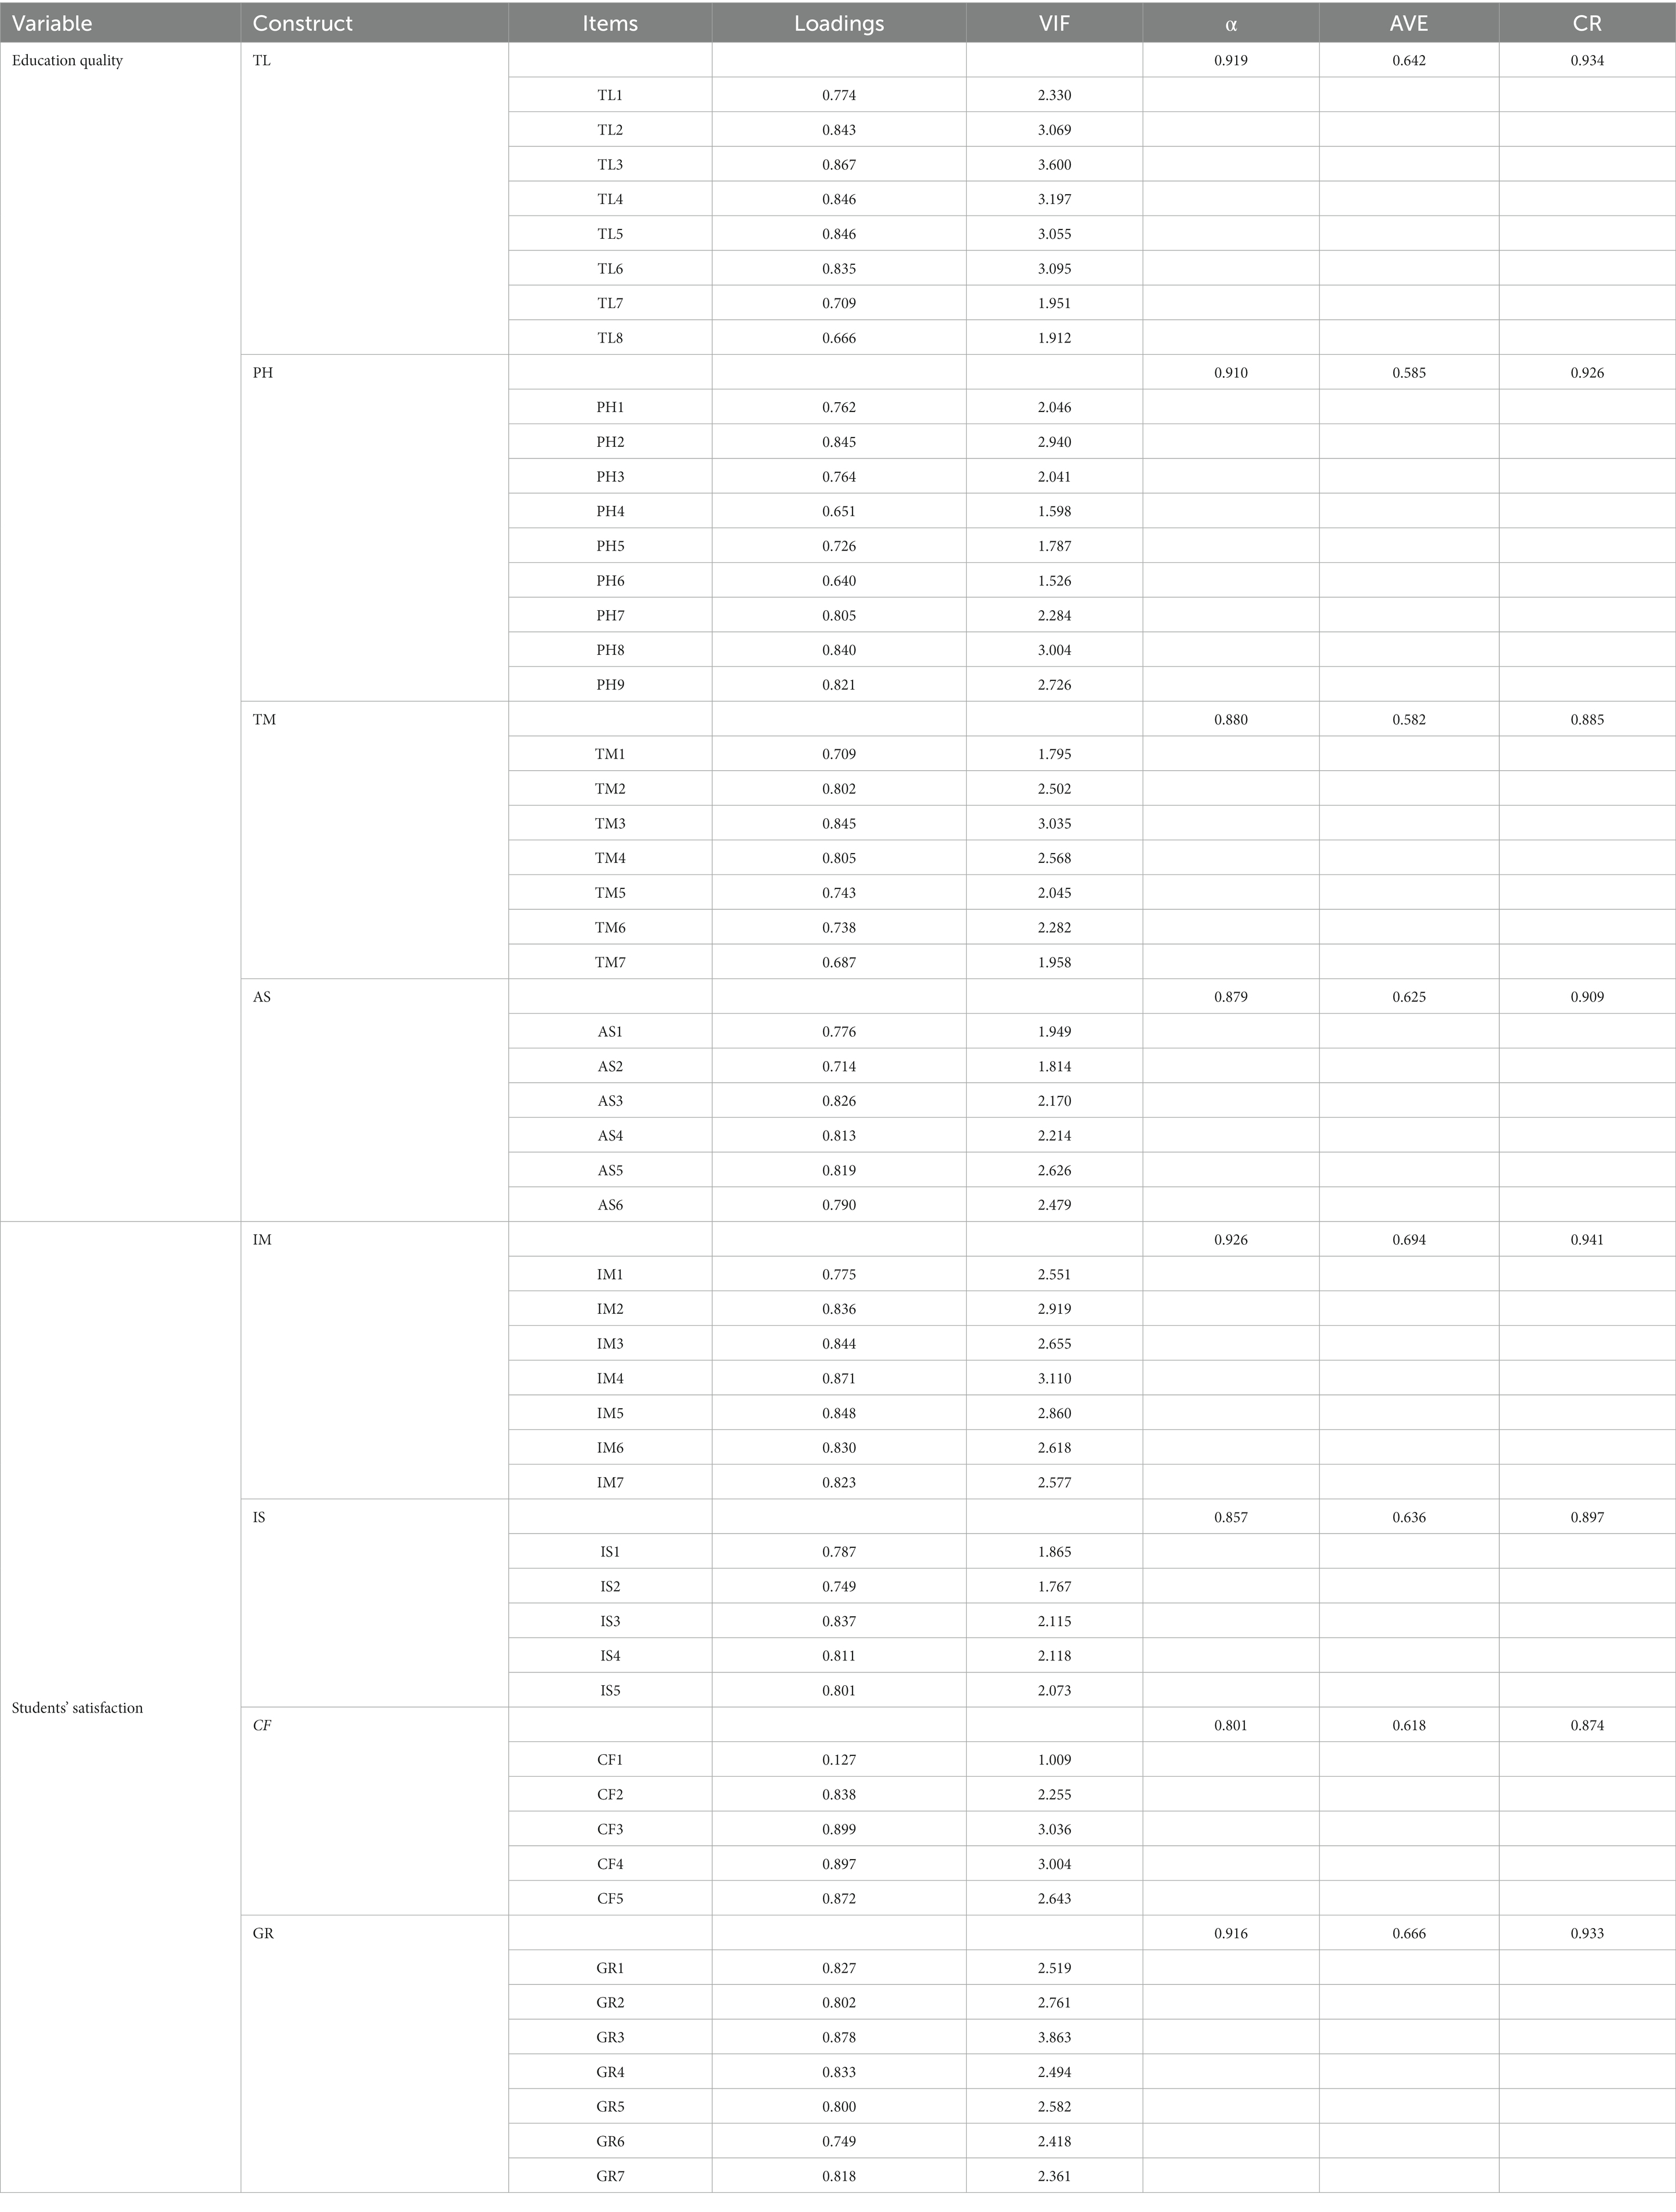
Table 2. Validity and reliability of the instrument.
3.4. Reliability
The evaluation of dependability comprised checking Cronbach’s alpha and composite reliability (CR) for various structures. The value of Cronbach’s alpha needed to be between 0.70 and 0.95 to be regarded as valid (Hair et al., 2017). Hair et al. (2017) proposed an additional measurement known as CR to estimate the scale’s internal consistency. When CR was measured and found to have a value of 0.7 or higher, it suggested good reliability with an adequate level of internal consistency. The findings indicated that the outer loadings had values ranging from 0.640 to 0.899, which were higher than the cut-off level of 0.50, except for CF1, which was removed to improve the findings. In addition, the VIF values, which range from 1.009 to 3.863, are lower than the threshold level.
Table 2 contains information regarding the validity and reliability of the questionnaire. The values provided in Table 2 are all within the acceptable range, except for CF1, which was removed. These findings demonstrate that the instrument being used is reliable and that it can be put to use to collect and examine data.
4. Data analysis procedure
The researchers first carried out a pilot study to evaluate the validity and reliability of the instrument. Next, they conducted the actual analysis and gathered more than 381 responses to confirm no problems with the analysis (Creswell, 2012). Although 780 questionnaires were randomly distributed, only 440 were received. 421 responses that passed SPSS screening and cleaning were analyzed with PLS-SEM. According to Hair et al. (2017), PLS-SEM is the best approach for complicated, variable-rich models. In addition to effectively managing non-normal data, it can simultaneously evaluate the structural and measurement models. As a result, this is the right approach to consider in this inquiry. In the current investigation, hypotheses were formulated to determine whether there was a statistically significant relationship between the variables. As a result, the PLS-SEM statistical technique is the most appropriate one that may be utilized for testing hypotheses.
5. Findings
This part contains in-depth information regarding the evaluation of model fit and the outcomes of hypothesis testing with PLS-SEM, which was employed to analyse the data.
5.1. Measurement model assessment
Analysis of measurement models provides measurements that clarify the links between constructs and indicators (Hair et al., 2017). The measurement assessment model enables researchers to evaluate the suitability of the theory to evidence. Model assessment emphasizes the measurement models, and PLS-SEM estimates can be used to measure the reliability and validity of the various constructs.
In addition, measurement model assessment that addresses the instrument’s validity and reliability are depicted in the figure that can be seen below (Figure 1).
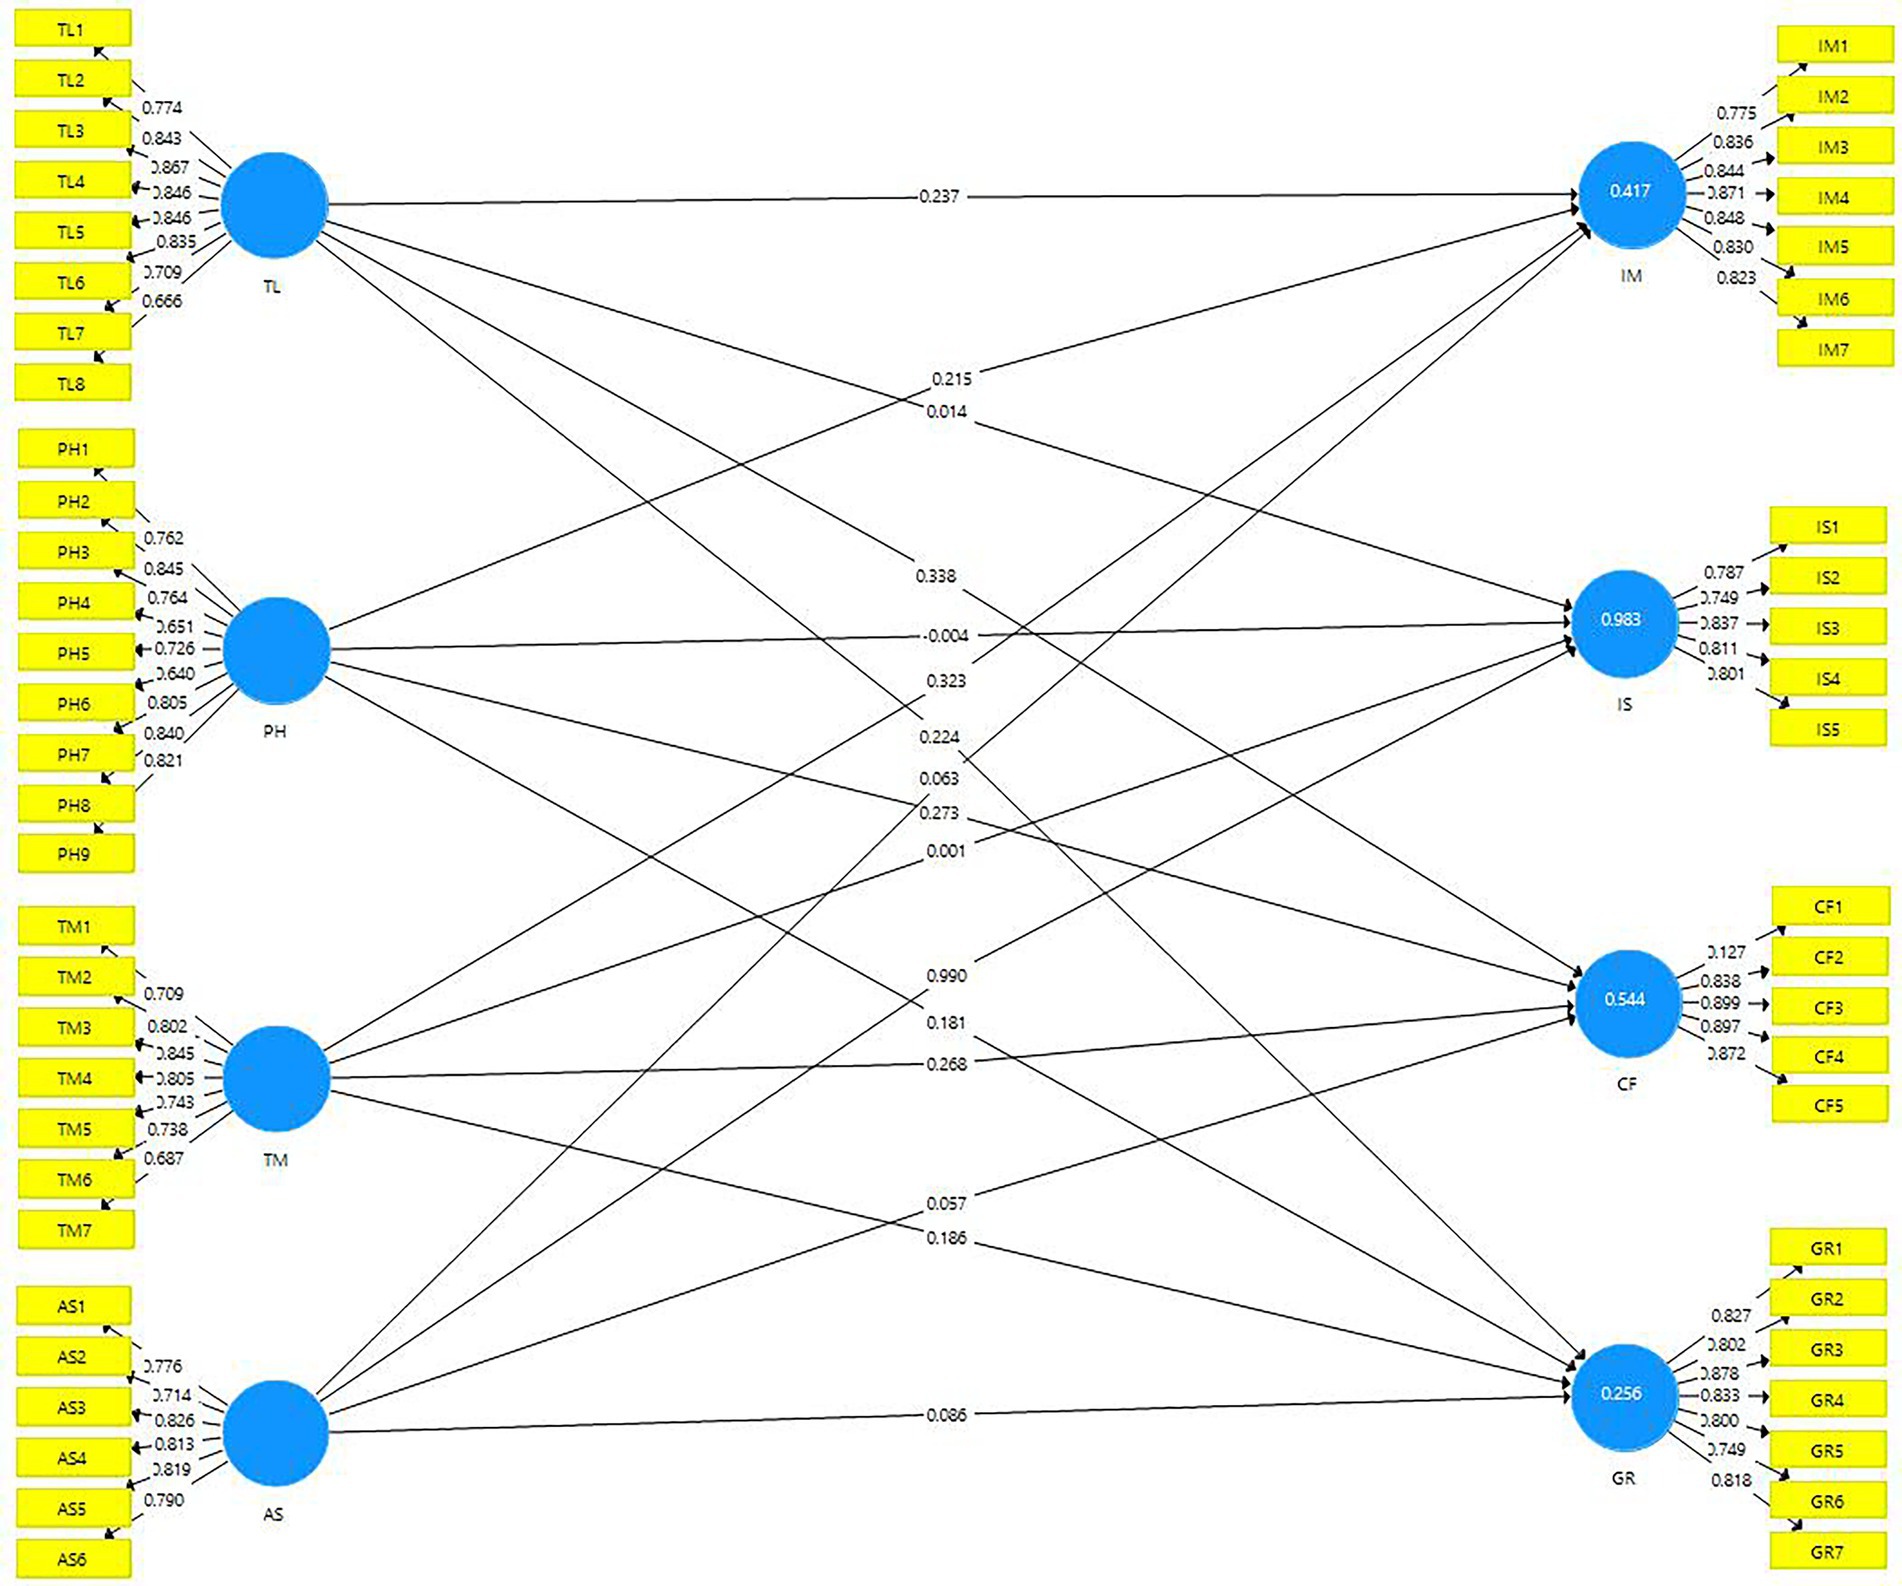
Figure 1. Measurement model assessment.
5.2. Discriminant validity
“Discriminant validity” refers to how different a construct is from other constructs (Hair, 2017). Fornell-Larcker criterion and Hetrotrit-monotrait (HTMT) ratio were applied to analyse the data. Discriminant validity findings are presented in Tables 3, 4.
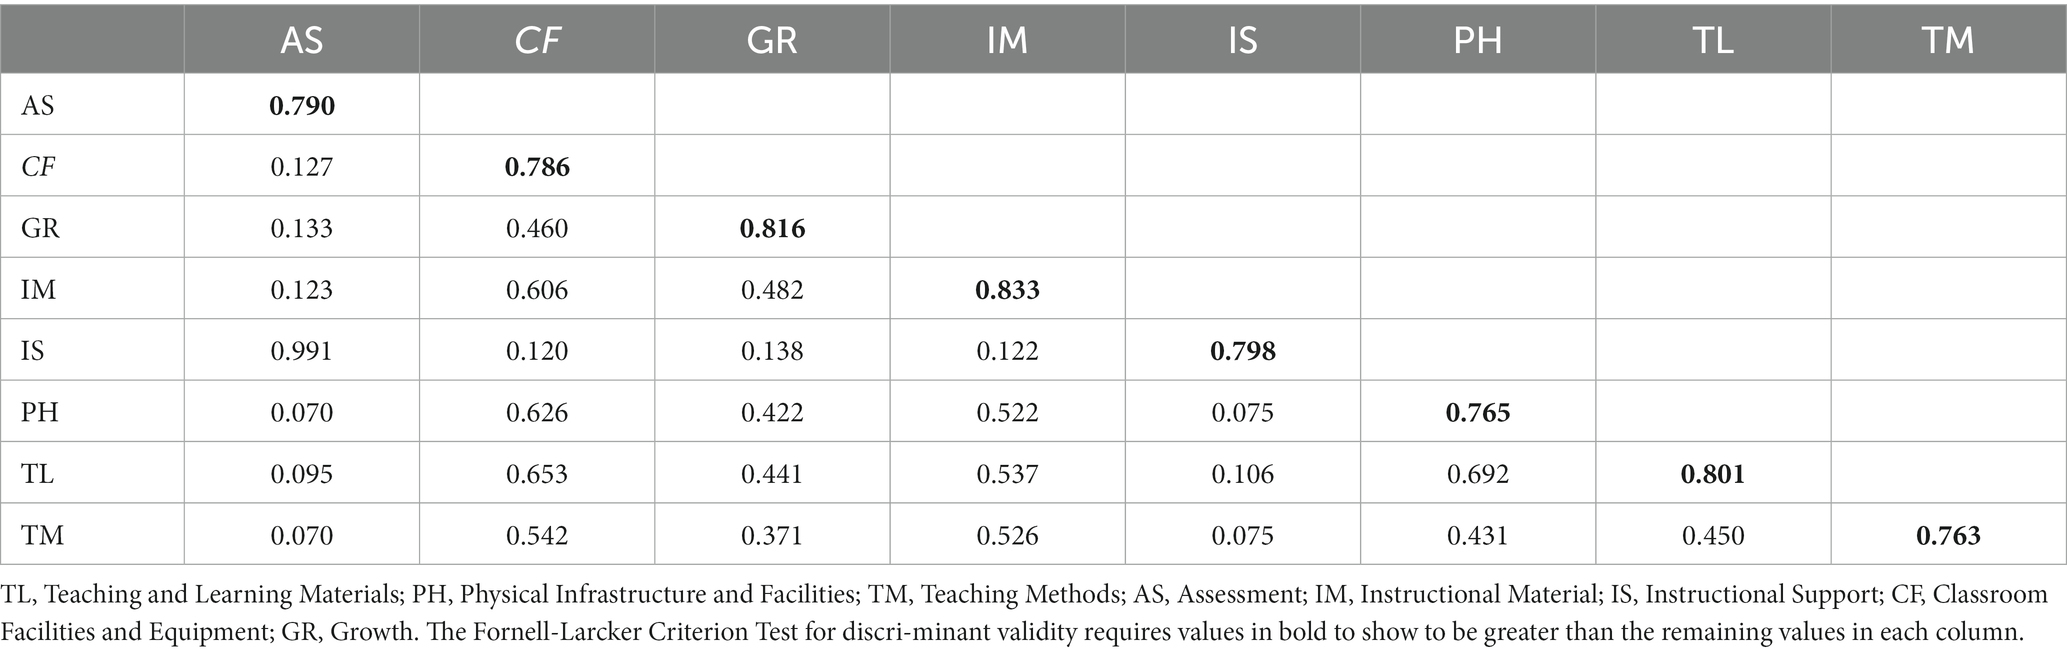
Table 3. The results of fornell-larcker criterion.
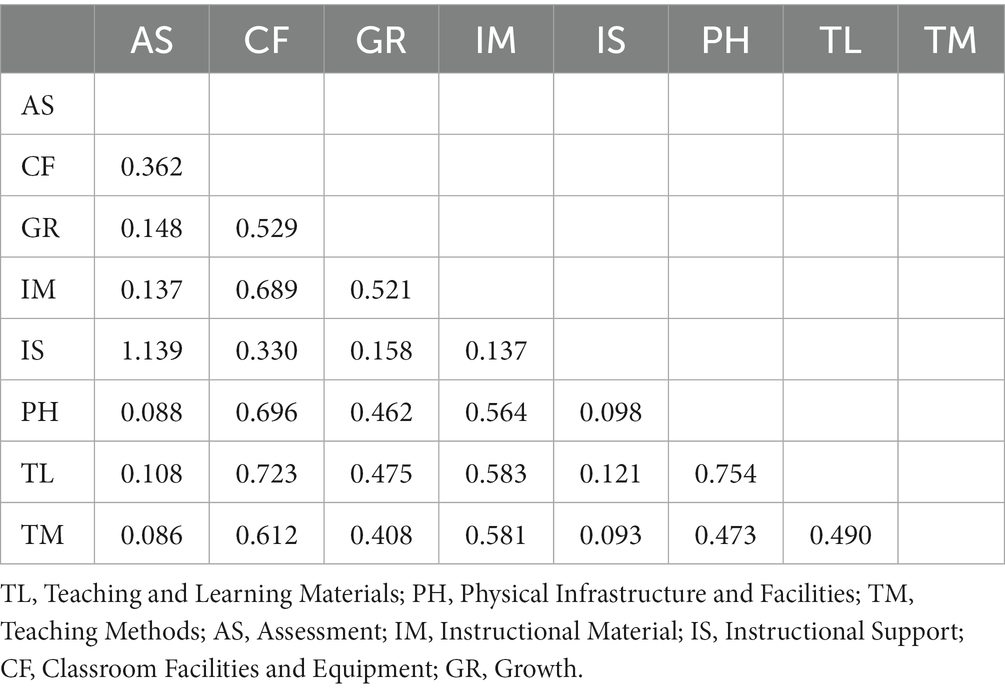
Table 4. Results of HTMT.
Based on the findings in Table 3, it can be concluded that the maximum correlation between any two constructs is less than the square root of the AVE values for each construct. Hence, discriminant validity can be established under the Fornell-Larcker criterion. To measure discriminant validity, the researchers used a third measurement, the heterotrait-monotrait ratio (HTMT). The HTMT value standard is between 0 and 1. Alarcón and Sanchez (2015) and Henseler et al. (2015) found that discriminant validity is harmed if the value of the HTMT is greater than 1. After analyzing the HTMT, the findings revealed that discriminant validity could be achieved through the utilization of the HTMT. The HTMT findings are stated in Table 4.
Based on the discussion above, the HTMT values were within the range, according to Alarcón and Sanchez (2015) and Henseler et al. (2015). Hence, discriminant validity can be established under HTMT. According to Alarcón and Sanchez (2015), Henseler et al. (2015), and the above reasoning, the HTMT values are acceptable. Consequently, discriminant validity may also be demonstrated using HTMT.
5.3. Model fit by PLS-SEM
For both the saturated and estimated models, the SRMR values were 0.078 and 0.081, respectively, and the cut-off value was 0.08 (Hu and Bentler, 1998); it suggests that the fit is satisfactory and makes it clear that the data also fit the model. The value of d ULS for the saturated model was 8.925, whereas that for the estimated model was 9.860. However, the other measures to assess the fit model, including d_G, normed fit index (NFI), chi-square, and RMS_theta, are not available on the output of SEM-PLS, as shown in Table 5.
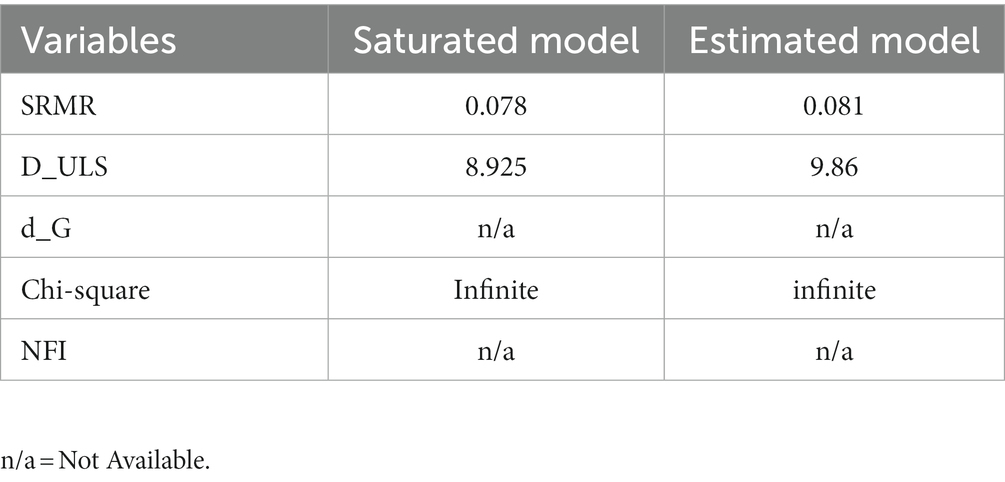
Table 5. Model fit.
5.4. Structural model assessment
The hypotheses were examined using the bootstrapping method during the structural model evaluation. According to the study findings, the effect size, R2, for IM was 0.407, IS was 0.085, CF was 0.530, and GR was 0.255. The values of R2 show the fit of the regression model to the observed data: 40.7% for IM, 8.5% for IS, 53.0% for CF, and 25.5% for GR, indicating that 40.7, 8.5, 53.0, and 25.5% of the data fit the regression model (Henseler et al., 2009). Four null hypotheses were formulated for this study. Path coefficients (β) (between −1 and 1), T-values (more than 1.96), and value of p (less than 0.05) were used to test the null hypothesis. The null hypothesis was rejected when the value of p was equal to or exceeded 0.05. In contrast, if that value exceeds 0.05, the null hypothesis must be accepted (Hair et al., 2014; Fraenkel et al., 2015). The hypotheses were assessed using a structural model assessment, and those findings are shown in Figure 2.
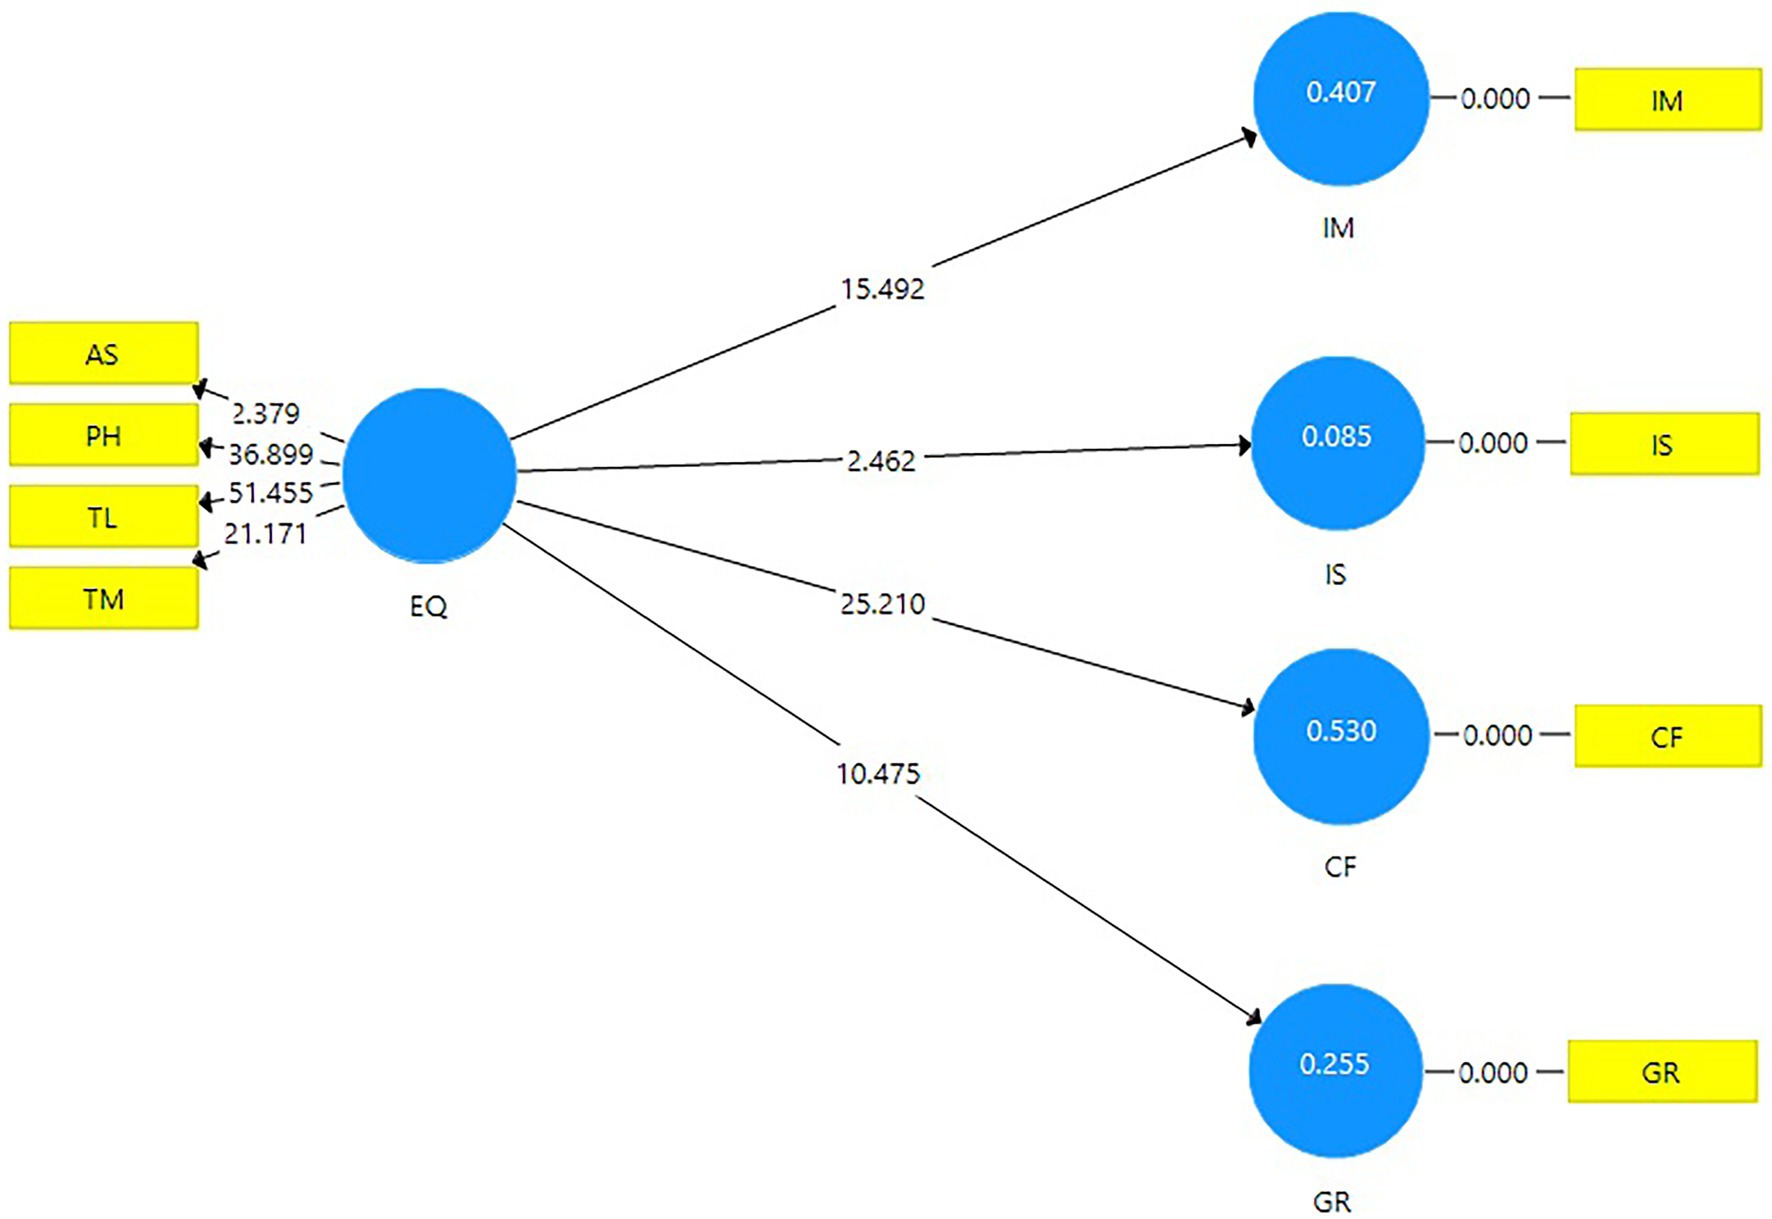
Figure 2. Structural model assessment.
The following section can find more information regarding the testing of hypotheses utilizing path coefficient (β), t-value, and value of p.
5.5. Hypotheses testing
Table 6 demonstrates the results of testing hypotheses, and PLS-SEM statistical method was utilized for the study. Four different null hypotheses were investigated based on the path coefficient (β), the t-value (>1,96), and the value of p (0.001). Hair et al. (2017) gave researchers these values to help them decide whether or not to accept the hypothesis being tested. The alternative hypothesis was accepted when the value of p was less than or equal to 0.001. Therefore, the alternative was accepted, and the null hypothesis was rejected (Fraenkel et al., 2015; Hair et al., 2017).
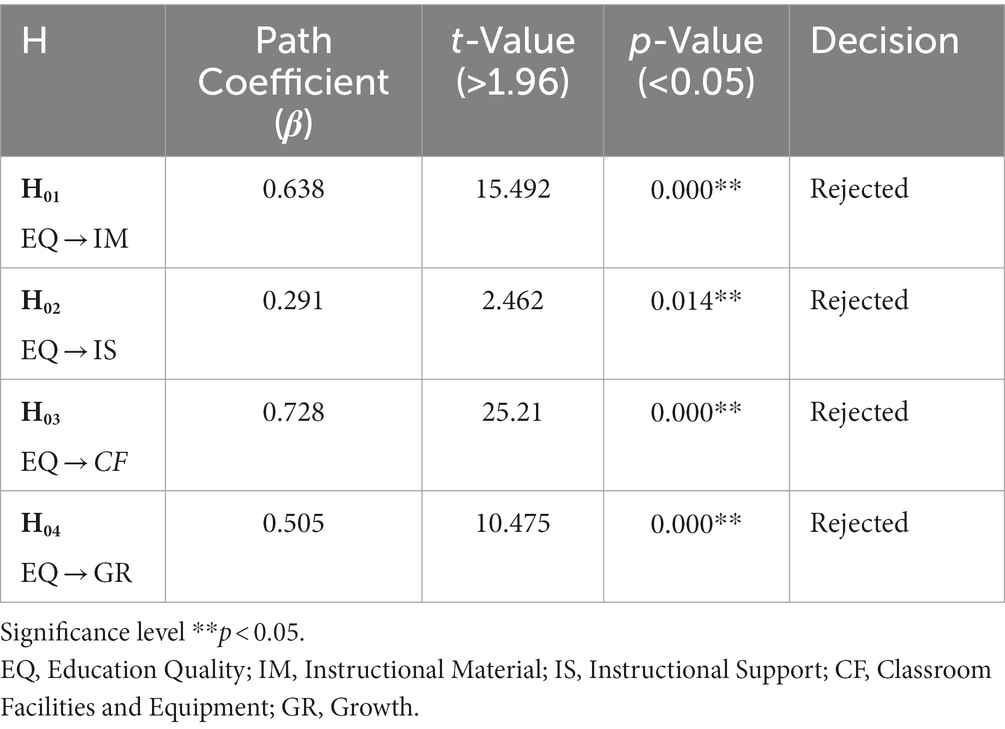
Table 6. The results of hypothesis testing.
According to the findings shown in Table 6, none of the four null hypotheses was supported by this investigation. The testing of hypotheses is discussed in detail in the following four sections.
5.5.1. Section 1: impact of EQ on SS in terms of instructional material
The findings do not support accepting the first null hypothesis, H01. The null hypothesis H01 has been rejected, as shown. The effects of EQ and IM were as follows: (β = 0.638, t = 15.492, p < 0.000). The value of β (0.638) indicates a moderate positive correlation between EQ and IM. This indicated that when education quality improves, there tends to be a corresponding improvement in the quality of instructional material used in higher education and vice versa. However, the strength of this relationship is only moderate, which means that while there is a positive relationship between EQ and IM, there are likely other factors that also contribute to the quality of instructional material beyond just education quality. In addition, the t-value was greater than 1.96, and the value of p was significant. Above mentioned results indicate that the null hypothesis cannot be accepted. Thus, EQ has direct and significant positive impacts on SS in terms of instructional material in HEIs.
5.5.2. Section 2: impact of EQ on SS in terms of instructional support
The findings do not support the second null hypothesis, H02. Thus, the null hypothesis is rejected. The outcome of the effect between the EQ and IS was (β = 0.291, t = 2.462, p < 0.001). The value of β (0.291) indicates a negligible correlation between EQ and IS. A negligible correlation indicated that any relationship between these variables is weak or non-existent. This could mean that other factors, such as instructional material, classroom facilities, equipment, and growth, have a greater influence on the level of instructional support provided to students in higher education. Additionally, the t-value exceeded 1.96, and the value of p was significant. Based on the t-value and value of p, the null hypothesis is rejected. Therefore, EQ had a direct and significant positive but negligible impact on SS in terms of instructional support in private HEIs.
5.5.3. Section 3: impact of EQ on SS in terms of classroom facilities and equipment
The findings do not support the third null hypothesis, H03. The findings of the influence between EQ and CF were (β = 0.728, t = 25.21, and p < 0.001). The value of β (0.728) indicates a high positive correlation between EQ and CF, and a high positive correlation suggests that changes in one variable have a significant impact on the other. In this case, when an institution invests in improving the quality of education being provided, it is likely to also invest in improving the quality of classroom facilities and equipment. This could include things like providing up-to-date technology, comfortable seating, and adequate space for students to work and learn. The t-value exceeded 1.96, and the value of p was statistically significant. Consequently, the null hypothesis was rejected. EQ direct and significantly positively affects SS in terms of classroom facilities and equipment in private HEIs.
5.5.4. Section 4: impact of EQ on SS in terms of growth
The findings do not support the fourth null hypothesis, H04. Null hypothesis H04 has been rejected, as shown. The influence between EQ and GR had the following results: (β = 0.505, t = 10.475, p < 0.000). The value of β (0.505) indicates a moderate positive correlation between EQ and GR. A moderate relationship indicated that when education quality is high, there tends to be greater growth in higher education, and when education quality is low, there tends to be less growth in higher education. A moderate correlation suggests that there is a reasonably strong relationship between education quality and growth in higher education, but that other factors may also play a role in determining growth rates. There may be other variables, such as changes in government funding or demographic shifts, that also have an impact on growth in higher education. If the institution’s mission statement is well-defined, its leaders organize various educational and co-curricular activities, and they appropriately monitor the progress of their students, mentors can have an impact on student achievement, which can ultimately lead to greater student satisfaction (Ikram et al., 2021). In addition, the t-value was greater than 1.96, and the value of p was significant. The results indicate that the null hypothesis cannot be accepted. So, EQ has a direct and significant positive impact on SS in terms of the growth in private HEIs.
6. Discussion
The current investigation aimed to determine whether or not EQ affects SS in HEIs. The results of the hypothesizing imply, in the aggregate, that EQ has a significantly positive effect on SS in HEIs. According to the findings, EQ significantly positively impacts instructional materials, support, classroom facilities and equipment, and overall growth. Although there is some overlap between studies that pointed to not a direct but an indirect effect of the quality of services on students’ satisfaction, one of those studies used a moderating element (Arif, 2011; Jabeen et al., 2014; Militaru et al., 2015). The outcomes of the current study contrast with those of other studies that have been conducted on this topic in the field of higher education. The findings showed a direct and significant positive association between EQ and SS in private HEIs.
Though, the findings of this study follow those of earlier investigations and are supported by Elliott and Shin (2002), Bigné et al. (2003), Ham and Hayduk (2003), Butt and Rehman (2010), De Jager and Gbadamosi (2013), Saleem et al. (2017), and Barua and Uddin (2021). These studies examined the effect of quality of service or education on satisfaction, and all of these studies concluded that quality has a significant effect on student satisfaction but these studies explored student satisfaction without dimensions. Prior research concentrated mostly on identifying teaching and learning materials, physical infrastructure and facilities, teaching methods, and assessment from the perspectives of service quality. Few research on student satisfaction (SS) in higher education has been undertaken. However, none of the earlier studies investigated student satisfaction with dimensions and education quality, as recommended by UNESCO (2004). This study elaborates on education quality (EQ) indicators recommended by UNESCO in Pakistan’s higher education sector with students’ satisfaction with four dimensions. Hence, these studies reveal a direct positive effect of quality on satisfaction in the educational sector. It should be noted that the results of the current research arrived at a similar conclusion in terms of the direct and significant positive effect between quality and student satisfaction (Elliott and Shin, 2002; Bigné et al., 2003; Ham and Hayduk, 2003; Butt and Rehman, 2010; De Jager and Gbadamosi, 2013; Saleem et al., 2017; Barua and Uddin, 2021). As this study is about private higher education institutions, the results can be taken into account as the benchmark for public higher education institutions in Pakistan.
According to the above analysis, EQ directly and significantly positively affects SS in HEIs. This finding suggests that higher education presents unique conditions that permit EQ to affect SS.
7. Implications
7.1. Theoretical implications
The findings of this study add to the body of research that looks at how education quality indicators affect student satisfaction. Previous literature has pointed out that teaching and learning materials, physical infrastructure, and facilities are critical for satisfaction in the educational sector. The current study also supported this finding, which clarified that teaching and learning materials, physical infrastructure, and facilities are significant in higher education. In addition, the findings also showed that Deming’s PDCA cycle of total quality management theory (Deming, 1986) is a suitable model for improving the quality of services, which is missing in previous literature.
The results of this investigation add to the existing literature on the topic of student satisfaction. Motivator factors, responsibility to provide instructional material and instructional support, advancement in the classroom facilities and equipment, and growth developed by Herzberg et al. (1959). Therefore, the findings also showed that Herzberg’s two-factor theory is a suitable tool for application in higher education institutions to evaluate students’ satisfaction in terms of responsibility to provide instructional material and instructional support, advancement in classroom facilities and equipment, and growth.
7.2. Practical implications
7.2.1. For policymakers
This research’s findings will significantly contribute to the existing body of knowledge concerning EQ and SS. It will shed light on the significance of enhancing the quality of education due to its positive and significant effects on SS in higher education, including teaching materials, support, classroom facilities and equipment, and growth. To make a difference in HE and ultimately lead to the desired student satisfaction, practitioners and policymakers in the field be required to pay closer consideration to the significance of education quality indicators. Thus, the development of teaching and learning materials, physical infrastructure and facilities, teaching methods, and assessment in HE must consider the significance of having an acceptable level of EQ to achieve satisfactory outcomes for both students and higher education institutes.
7.2.2. For higher education commission (HEC)
According to research, some factors may influence the correlation between education quality and SS in HEIs. As a result, these aspects should be explored and examined to assist higher education institutes in capturing higher education quality and determining the best strategy for improving student satisfaction. The findings enlighten the higher education commission (HEC) on the significance of producing the best indicators of education quality, which directly impact instructional materials, support, classroom facilities, equipment, and growth. As a result, researchers have suggested that UNESCO’s education quality indicators should be developed further. This study is essential for the Higher Education Commission (HEC), whose efforts will contribute significantly to the nation’s progress. In addition, the current investigation has presented a thorough conclusion regarding the relationship between EQ and SS, namely that there is a direct and significant relationship between education quality indicators and instructional materials, support, classroom facilities, equipment, and growth. The study’s findings may positively impact students and higher education institutions.
7.2.3. For institutions
HEIs must pay more attention to developing teaching materials, support, classroom facilities and equipment, and growth. As specified by UNESCO (2004), higher education institutions must improve the quality of their education by developing teaching and learning materials, physical infrastructure and facilities, teaching methods, and assessment. Teaching and learning materials should cover the implemented curriculum and material resources, while physical infrastructure and facilities should cover the appearance and design of lecture halls, registration procedures, examination methods, results, library services, and cafeterias. In addition, they must enhance their teaching methods to include support for teaching and learning, professional development, and the supervision of teachers. However, assessments should include academic achievement. When higher education institutions combine all these quality indicators, it will directly and positively affect students in higher education institutes.
7.2.4. For society
Recent findings have substantial implications for scientific investigation, practice, and society. The implications for future investigation are centered on examining the characteristics that enable higher education institutions to positively impact student satisfaction and examining other factors that institutions can affect in HE. The implications for practice are centered on considering these findings when developing future quality plans for HE. The findings of this research will also have significant advantages for society in the sense that they will show how a good education may contribute to the betterment of society by producing qualified students who go on to achieve desired outcomes that aid in the growth of the nation. These findings will have a positive influence on society as a whole. These benefits are provided because the current results have already been achieved.
8. Limitations of the study
Pakistani participants in private higher education were the most significant limitation of the current study. Scientific research activities like government grants, research infrastructure including laboratory facilities, equipment, and technology necessary for conducting experiments, faculty, postdoctoral researchers, and graduate students, and the success of research programs are not considered in this research. However, the outcomes of this study have yielded important insights and a broad conclusion regarding the impact of education quality on students’ satisfaction with instructional materials, support, classroom facilities and equipment, and growth. This study’s findings can potentially have a favorable impact on students, particularly in private HEIs.
9. Recommendations for future research
It is essential to build various quality indicators compatible with SS and conduct an additional study on their compatibility. Future studies should explore elements that enable public and private higher education institutions to significantly and directly affect SS. Future research must also determine the extent to which EQ affects instructional materials, support, classroom facilities, and equipment, and the growth of higher education institutions. Finally, additional research will be required to investigate whether demographic factors moderate the impact of education quality indicators on SS in HEIs.
10. Conclusion
According to the current research findings, EQ has a direct and significant positive influence on students’ satisfaction in terms of the growth of private higher education institutions, as well as instructional materials, support, classroom facilities, and equipment. Higher education institutions should prioritize EQ training because of its direct impact on SS, which in turn will improve student retention and graduation rates. Although previous studies have revealed that the effect of quality on SS in the educational sector is indirect, the present findings indicate that EQ directly affects SS in private HEIs. This refers to the various aspects of the higher education sector that directly impact education quality on SS. Therefore, future research should investigate the crucial aspects that enable public and private higher education institutions to benefit from SS and increase student satisfaction.
Data availability statement
The raw data supporting the conclusions of this article will be made available by the authors, without undue reservation.
Ethics statement
Ethical review and approval was not required for the study on human participants in accordance with the local legislation and institutional requirements. The participants provided their written informed consent to participate in this study.
Author contributions
MI: paper concept, original write-up, and analysis. HK: editing, reviewing, and supervision. All authors contributed to the article and approved the submitted version.
Conflict of interest
The authors declare that the research was conducted in the absence of any commercial or financial relationships that could be construed as a potential conflict of interest.
Publisher’s note
All claims expressed in this article are solely those of the authors and do not necessarily represent those of their affiliated organizations, or those of the publisher, the editors and the reviewers. Any product that may be evaluated in this article, or claim that may be made by its manufacturer, is not guaranteed or endorsed by the publisher.
Supplementary material
The Supplementary material for this article can be found online at: https://www.frontiersin.org/articles/10.3389/feduc.2023.1140971/full#supplementary-material
References
Abbasi, K. (2021). Performance of Several Varsities Unsatisfactory, Senate Body Told. Islamabad, Pakistan: DAWN.COM https://www.dawn.com/news/1657725.
Abukari, A., and Corner, T. (2010). Delivering higher education to meet local needs in a developing context: the quality dilemmas? Qual. Assur. Educ. 18, 191–208. doi: 10.1108/09684881011058641
Akareem, H. S., and Hossain, S. S. (2016). Determinants of education quality: what makes students’ perception different? Open Rev. Educ. Res. 3, 52–67. doi: 10.1080/23265507.2016.1155167
Alarcón, D., and Sanchez, J. A. (2015). Assessing Convergent and Discriminant Validity in the ADHD-R IV Rating Scale: User-Written Commands for Average Variance Extracted (AVE), Composite Reliability (CR), and Hetrotrait-Monotrait Ratio of Correlation (HTMT). Spain: Spanish STATA Meeting, 1–39.
Ali, M. (2019). Aspects that affect students’ satisfaction with higher education quality management in Pakistan. Munich Personal RePEc Archive (MPRA) :96180.
Almossa, S. Y., and Alzahrani, S. M. (2022). Assessment practices in Saudi higher education during the COVID-19 pandemic. Humanit. Soc. Sci. Commun. 9, 1–9. doi: 10.1057/s41599-021-01025-z
Anwar, M. A. (1993). “Use of information technology in the libraries of Pakistan” in Challenges in Automating the Library Services. ed. M. Fida (Peshawar: Department of Library and Information Science, University of Peshawar), 3–14.
Arif, S. (2011). Quality management of technology related services for student satisfaction in private universities of Pakistan. Interdiscip. J. Contemp. Res. Bus. 3, 653–667.
Barua, D., and Uddin, M. S. (2021). Service quality dimensions of higher education institutions and students’ satisfaction: Bangladesh perspective. Int. J. Soc. Sci. Stud. 9, 13–19. doi: 10.11114/ijsss.v9i2.5126
Bigné, E., Moliner, M. A., and Sánchez, J. (2003). Perceived quality and satisfaction in multiservice organisations: the case of Spanish public services. J. Serv. Mark. 17, 420–442. doi: 10.1108/08876040310482801
Butt, B. Z., and Rehman, K. U. (2010). A study examining the students satisfaction in higher education. Procedia. Soc. Behav. Sci. 2, 5446–5450. doi: 10.1016/j.sbspro.2010.03.888
Carroll, R. J., Midthune, D., Subar, A. F., Shumakovich, M., Freedman, L. S., Thompson, F. E., et al. (2012). Taking advantage of the strengths of two different dietary assessment instruments to improve intake estimates for nutritional epidemiology. Am. J. Epidemiol. 175, 340–347. doi: 10.1093/aje/kwr317
Chang, V., and Fisher, D. (2001). The Validation and Application of a New Learning Environment Instrument to Evaluate Online Learning in Higher Education. AARE Annual Conference, 1–16.
Cheng, Y. C., and Tam, W. M. (1997). Multi-models of quality in education. Qual. Assur. Educ. 5, 22–31. doi: 10.1108/09684889710156558
Childers, C., Williams, K., and Kemp, E. (2014). Emotions in the classroom: examining environmental factors and student satisfaction. J. Educ. Bus. 89, 7–12. doi: 10.1080/08832323.2012.738258
Cohen, P. A. (1980). Effectiveness of student-rating feedback for improving college instruction: a meta-analysis of findings. Res. High. Educ. 13, 321–341. doi: 10.1007/BF00976252
Creswell, J. W. (2012). Educational Research: Planning, Conducting, and Evaluating Quantitative and Qualitative Research. 4th Edn. New York: Pearson.
De Jager, J., and Gbadamosi, G. (2013). Predicting students’ satisfaction through service quality in higher education. Int. J. Manag. Educ. 11, 107–118. doi: 10.1016/j.ijme.2013.09.001
Deming, W. E. (1982). Quality, Productivity and Competitive Position. Cambridge, MA: Massachusetts Institute of Technology, Center for Advanced Engineering Study.
Elliott, K. M., and Shin, D. (2002). Student satisfaction: an alternative approach to assessing this important concept. J. High. Educ. Policy Manag. 24, 196–209. doi: 10.1080/136008002200001351
Ferwana, M. N. (2018). Service Quality in Higher Education: Identifying Core Determinants and Sub-Factors from Postgraduate Students’ Perspective in the Gaza Strip. The Islamic University of Gaza, Palestine.
Fraenkel, J. R., Wallen, N. E., and Hyun, H. H. (2015). How to Design and Evaluate Research in Education. 9th Edn. New York: McGraw-Hill.
Garwe, E. C. (2016). Increase in the demand for private higher education: unmasking the “paradox.”. Int. J. Educ. Manag. 30, 232–251. doi: 10.1108/IJEM-05-2014-0064
Geçer, A. (2013). Lecturer-student communication in blended learning environments. Educ. Sci. Theory Pract. 13, 362–367.
Ghulam, M. (2017). Indicators for quality in higher education: comparison between Pakistan and Germany. Online J. Qual. High. Educ. 4, 8–16.
Global Education Digest. (2010). Comparing education statistics across the world. Available at: https://uis.unesco.org/sites/default/files/documents/global-education-digest-2010-comparing-education-statistics-across-the-world-en.pdf
Goos, M., and Salomons, A. (2016). Measuring teaching quality in higher education: assessing selection bias in course evaluations. Res. High. Educ. 58, 341–364. doi: 10.1007/s11162-016-9429-8
Gruber, T., Fuß, S., Voss, R., and Zikuda, M. G. (2010). Examining student satisfaction with higher education services: using a new measurement tool. Int. J. Public Sect. Manag. 23, 105–123. doi: 10.1108/09513551011022474
Gul, S., Jan, S., and Shah, F. A. (2019). The impact of service quality on students satisfaction in higher education institutes of Khyber Pakhtunkhwa. Rev. Econ. Dev. Stud. 5:33. doi: 10.26710/reads.v5i1.536
Hair, J. F., Black, W. C., Babin, B. J., and Anderson, R. E. (2014). Multivariate Data Analysis. 7th Edn. United States of America: Pearson Prentice Hall.
Hair, J. F., Hult, G. T. M., Ringle, C. M., and Sarstedt, M. (2017). A Primer on Partial Least Squares Structural Equation Modeling (PLS-SEM). 2nd Edn. Thousand Oaks, CA: Sage.
Ham, L., and Hayduk, S. (2003). Gaining competitive advantages in higher education: analyzing the gap between expectations and perceptions of service quality. Int. J. Value-Based Manag. 16, 223–242. doi: 10.1023/A:1025882025665
Hamza, M., Haq, I.-U., Hamis, S., Nadir, M., and Mehmood, N. (2018). Effect of moderate learning style-teaching mode mismatch on academic performance among 2nd year medical students in Pakistan. Indian J. Psychiatry 60, 109–113. doi: 10.4103/psychiatry.IndianJPsychiatry
Henseler, J., Ringle, C. M., and Sarstedt, M. (2015). A new criterion for assessing discriminant validity in variance-based structural equation modeling. J. Acad. Mark. Sci. 43, 115–135. doi: 10.1007/s11747-014-0403-8
Henseler, J., Ringle, C. M., and Sinkovics, R. R. (2009). The use of partial least squares path modeling in international marketing. Adv. Int. Mark. 20, 277–319. doi: 10.1108/S1474-7979(2009)0000020014
Herzberg, F., Mausner, B., and Snyderman, B. B. (1959). The Motivation to Work. 2nd Edn. New York: John Wiley & Sons.
Hislop, D. (2005). Knowledge Management in Organizations: A Critical Introduction. 1st Edn. United States of America: ProQuest.
Hu, L., and Bentler, P. M. (1998). Fit indices in covariance structure modeling: sensitivity to underparameterized model misspecification. Psychol. Methods 3, 424–453. doi: 10.1037//1082-989x.3.4.424
Ikram, M., Ghavifekr, S., and Kenayathulla, H. B. (2021). Instructional leadership practices among school principals in Asian countries: a systematic review. Int. Online J. Educ. Leadersh. 5, 4–24.
Ikram, M., and Kenayathulla, H. B. (2022a). A systematic literature review of student satisfaction: what is next ? Int. J. Adv. Res. Educ. Soc. 4, 50–75. doi: 10.55057/ijares.2022.4.4.5
Ikram, M., and Kenayathulla, H. B. (2022b). Out of touch: comparing and contrasting positivism and interpretivism in social science. Asian J. Res. Educ. Soc. Sci. 4, 39–49. doi: 10.55057/ajress.2022.4.2.4
Isani, U. A. G., and Virk, M. L. (2005). Higher Education in Pakistan: A Historic and ISO (n.d.) International Organization for Standardization: ISO: 9000. Proquest.
Jabeen, S., Din, A. M., and Sadiq, M. F. (2014). Students’ satisfaction from E-learning system: a case study of virtual University of Pakistan. Int. J. E-Adoption 6, 1–13. doi: 10.4018/ijea.2014070101
Jan, S., Hussain, A., Ibrahim, M., and Saeed, S. (2018). Use of internet by the teaching faculty of Peshawar medical college, Peshawar, Khyber Pakhtunkhwa, Pakistan. J. Pak. Med. Assoc. 68, 459–462.
Jazuli, M. R., Idris, M. M., and Yaguma, P. (2022). The importance of institutional quality: Reviewing the relevance of Indonesia’s Omnibus Law on national competitiveness. Humanit. soc. Sci. Commun. 9, 1–13. doi: 10.1057/s41599-022-01343-w
Khawaja, A. H. (1996). Difficulties and possibilities in university. Pakistan Perspectives, University of Karachi, 1.
Khosravi, A. A., Poushaneh, K., Roozegar, A., and Sohrabifard, N. (2013). Determination of factors affecting student satisfaction of Islamic Azad University. Procedia. Soc. Behav. Sci. 84, 579–583. doi: 10.1016/j.sbspro.2013.06.607
Krejcie, R. V., and Morgan, D. W. (1970). Determining sample size for research activities. Educ. Psychol. Meas. 30, 607–610. doi: 10.1177/001316447003000308
Kuo, Y., Walker, A. E., Belland, B. R., and Schroder, K. E. E. (2013). A predictive study of student satisfaction in online education programs. Int. Rev. Res. Open Dist. Learn. 14, 16–39. doi: 10.19173/irrodl.v14i1.1338
Law, D. C. S., and Meyer, J. H. F. (2011). Adaptation and validation of the course experience questionnaire in the context of post-secondary education in Hong Kong. Qual. Assur. Educ. 19, 50–66. doi: 10.1108/09684881111107753
Lu, J., Laux, C., and Antony, J. (2017). Lean six sigma leadership in higher education institutions. Int. J. Product. Perform. Manag. 66, 638–650. doi: 10.1108/IJPPM-09-2016-0195
Mahmood, K. (1999). The development of computerised library services in Pakistan. Asian Libr. 8, 307–328.
Malik, M. E., and Danish, R. Q. (2010). The impact of service quality on students’ satisfaction in higher education institutes of Punjab. J. Manag. Res. 2, 1–11. doi: 10.5296/jmr.v2i2.418
Manzoor, H. (2013). Measuring student satisfaction in public and private universities in Pakistan. Glob. J. Manag. Bus. Res. Interdiscip. 13, 4–16.
Mark, E. (2013). Journal of Higher Education Policy and Management Student satisfaction and the customer focus in higher education. J. High. Educ. Policy Manag. 35, 2–10. doi: 10.1080/1360080X.2012.727703
Mastoi, A. G., and Hai, L. X. (2019). Higher education service quality based on students’ satisfaction in Pakistan. Eur. Sci. J. 15, 32–62. doi: 10.19044/esj.2019.v15n11p32
Militaru, G., Deselnicu, D., and Pollifroni, M. (2015). An exploratory study of student satisfaction: the moderating role of digital technologies. Proceedings of the 9th International Management Conference. Manag. Innov. Competitive Adv., 234–241.
Najib, N. U. M., Yusof, N. A., and Osman, Z. (2011). Measuring satisfaction with student housing facilities. Am. J. Eng. Appl. Sci. 4, 52–60. doi: 10.3844/ajeassp.2011.52.60
Narang, R. (2012). How do management students perceive the quality of education in public institutions? Qual. Assur. Educ. 20, 357–371. doi: 10.1108/09684881211263993
Olmos-Gómez, M. D. C., Suárez, M. L., Ferrara, C., and Olmedo-Moreno, E. M. (2020). Quality of higher education through the pursuit of satisfaction with a focus on sustainability. Sustainability 12, 1–20. doi: 10.3390/su12062366
Ramzan, M. (2004). Levels of information technology (IT) applications in muslim world libraries. Electronic Libr. 22, 274–280. doi: 10.1108/02640470410541688
Redmond, R., Curtis, E., Noone, T., and Keenan, P. (2008). Quality in higher education: the contribution of Edward Deming’s principles. Int. J. Educ. Manag. 22, 432–441. doi: 10.1108/09513540810883168
Renkl, A., Mandl, H., and Gruber, H. (1996). Inert knowledge: analyses and remedies. Educ. Psychol. 31, 115–121. doi: 10.1207/s15326985ep3102
Riaz, B. (1990). LUMS library: Experience with automation. Punjab University Library Science Alumni Association News 2, 92–95.
Saleem, S., Moosa, K., Imam, A., and Ahmed Khan, R. (2017). Service quality and student satisfaction: the moderating role of university culture, reputation and price in education sector of Pakistan. Iran. J. Manag. Stud. 10, 237–258. doi: 10.22059/ijms.2017.217335.672304
Sultana, N., Yousuf, M. I., Din, M. N. U., and Rehman, S. (2009). The higher the quality of teaching the higher the quality of education. Contemp. Issues Educ. Res. 2, 59–64. doi: 10.19030/cier.v2i3.1088
Teeroovengadum, V., Kamalanabhan, T. J., and Seebaluck, A. K. (2016). Measuring service quality in higher education: development of a hierarchical model (HESQUAL). Qual. Assur. Educ. 24, 244–258. doi: 10.1108/QAE-06-2014-0028
UNESCO. (2004). The 10 dimensions of quality in education Available at: https://learningportal.iiep.unesco.org/en/issue-briefs/monitor-learning/quality-and-learning-indicators#:~:text=Defining Quality&text=UNESCO’s framework on the variables,to learning%2C and demographic variables.&text=(UNESCO%2C 2004%3A 36).
Vazirova, N. (2016). Measuring Service Quality in Higher Education: A Sudy of Post-Graduate Students in Northern Cyprus (issue February). Cyprus: Eastern Mediterranean University.
Wafudu, S. J., Kamin, Y. B., and Marcel, D. (2022). Validity and reliability of a questionnaire developed to explore quality assurance components for teaching and learning in vocational and technical education. Humanit. Soc. Sci. Commun. 9, 1–10. doi: 10.1057/s41599-022-01306-1
World Bank. (2020). GDP on education for developing countries. https://data.worldbank.org/indicator/SE.XPD.TOTL.GD.ZS?locations=PK
World Economic Forum. (2017). The global human capital report. In World economic forum. Available at: https://www.weforum.org/reports/the-global-human-capital-report-2017/
Keywords: education quality, instructional material, instructional support, classroom facilities and equipment, growth, students’ satisfaction, Pakistani higher education
Citation: Ikram M and Kenayathulla HB (2023) Education quality and student satisfaction nexus using instructional material, support, classroom facilities, equipment and growth: Higher education perspective of Pakistan. Front. Educ. 8:1140971. doi: 10.3389/feduc.2023.1140971
Edited by:
Aleksander Aristovnik, University of Ljubljana, SloveniaReviewed by:
Ciprian Marius Ceobanu, Alexandru Ioan Cuza University, RomaniaLiviu Moldovan, George Emil Palade University of Medicine, Pharmacy, Sciences and Technology of Târgu Mureş, Romania
Copyright © 2023 Ikram and Kenayathulla. This is an open-access article distributed under the terms of the Creative Commons Attribution License (CC BY). The use, distribution or reproduction in other forums is permitted, provided the original author(s) and the copyright owner(s) are credited and that the original publication in this journal is cited, in accordance with accepted academic practice. No use, distribution or reproduction is permitted which does not comply with these terms.
*Correspondence: Maryam Ikram, bWFyeWFtLmlrcmFtLnVtQGdtYWlsLmNvbQ==; Husaina Banu Kenayathulla, aHVzYWluYUB1bS5lZHUubXk=