 Manyu Li
94% of researchers rate our articles as excellent or good
Learn more about the work of our research integrity team to safeguard the quality of each article we publish.
Find out more
CURRICULUM, INSTRUCTION, AND PEDAGOGY article
Front. Educ., 02 June 2023
Sec. STEM Education
Volume 8 - 2023 | https://doi.org/10.3389/feduc.2023.1130865
This article is part of the Research TopicInnovations and Technologies in Science/STEM Education: Opportunities, Challenges and Sustainable PracticesView all 13 articles
The article presents the use of open, inclusive pedagogical frameworks to develop a series of open education resources (OERs), specifically, interactive shiny web applications for teaching beginner-level computational social science (CSS) in undergraduate social science education. CSS is an emerging discipline that integrates data science methods with social science theories and research designs. However, undergraduate social science students could face a lack of a sense of STEM identity or belonging. Also, compared to STEM majors in natural science or engineering, average undergraduate social science students come in with limited mathematical or statistical knowledge. The OERs developed and tested in this article are designed with pedagogical frameworks that help overcome these barriers faced by students from diverse backgrounds and offer students a jump-start in learning CSS. This article presents the details of the tools, classroom implementation (in the form of a 6-week workshop series), the pedagogy frameworks applied, and the assessment methods and outcomes.
Computational Social Science (CSS), formalized and popularized in the phenomenal paper by Lazer et al. (2009), is an emerging and evolving discipline defined as “the development and application of computational methods to complex, typically large-scale, human (sometimes simulated) behavioral data” (Lazer et al., 2020, p. 1060). In a little over a decade of development, CSS has attracted support and investments from top-tier institutions and the industry (Kim, 2021), creating a workforce with high demand in the tech industry, public policy decision-making, etc. The rise of CSS calls for a “paradigm for training new scholars” (Lazer et al., 2009, p. 722). Developing instructional methods for CSS education in social science is thus needed to improve the field.
This article aims at contributing to the CSS education literature by introducing instructional innovations, paired with open and inclusive pedagogical frameworks, that can be used to connect social science novices to the world of CSS learning. Specifically, to help students overcome challenges to step into the CSS world, a series of openly-available Rapport-building, Equitable, Learner-centered, Authentic Computational Social Science (RELACSS) web applications written in R language was developed and implemented in undergraduate social science education settings.
Training “computationally literate social scientists” (Lazer et al., 2009, p. 722) may face several challenges. Firstly, undergraduate social science students were found to often lack a sense of STEM identity or belonging (Berndt et al., 2021; Esnard et al., 2021). This lack of STEM identity may contribute to barriers to learning computation-related skills (Berndt et al., 2021; Esnard et al., 2021). For example, their low sense of belonging/identity in computing (Chew and Dillon, 2014; Davies et al., 2015; Lawton and Taylor, 2020) may result in attentional biases (Okon-Singer, 2018; Cui et al., 2019) that further lower their engagement and motivation (Lawton and Taylor, 2020) and prohibit them from moving on to the next level (Davies et al., 2015). Additionally, these challenges have been identified among the under-resourced, marginalized under-represented minoritized (URM) population in STEM (Lisberg and Woods, 2018; Singer et al., 2020). Non-inclusive practices in the teaching process, stereotypes communicated, and perceived stereotype threats were suggested as potential reasons behind the achievement and belonging gap in URMs (Steele et al., 2002; Walton et al., 2015; Rattan et al., 2018; Liu et al., 2021; Yeager et al., 2022).
Second, compared to STEM majors in natural science or engineering, average undergraduate social science students come in with limited mathematical or statistical knowledge (Berndt et al., 2021) and thus find data science challenging (Dong et al., 2020). The lack of a foundation may have contributed to students' low motivation to learn and to advance in subjects that require prior knowledge in computation (Davies et al., 2015; Lawton and Taylor, 2020). Further, many do not expect to use statistics/computation to analyze data when choosing social sciences as their major (Esnard et al., 2021), nor do they expect to use the knowledge after graduation (Berndt et al., 2021). Thus, despite the availability of some free beginner materials online, students may not have the motivation to approach the materials. Even if students attempt to access the free resources available in data science or CSS (e.g., YouTube videos, free Massive Online Open Courses, etc.), complete novices may find the materials to be challenging and may even feel confused when accessing the materials. Therefore, the materials, even though they are freely available, may hinder students from exploring their interest in CSS.
RELACSS is designed to address these challenges and to increase students' interest in pursuing the CSS curriculum. First, in terms of content knowledge, RELACSS web apps focused on the very basics of what data analysis and coding are in social science. The goal is not to include all CSS topics, but to create interesting and approachable introductory CSS materials for complete novices. It is designed to reshape students' beliefs that data science is not for them and to increase their interest in further pursuing CSS. Second, as further detailed in the pedagogical frameworks, RELACSS web apps were designed with scaffolding and learner-centered principles to help students relate to the materials. Also, the web apps were built on social science students' background knowledge, rather than computer science; therefore, students are less likely to feel distant or out of place when learning the materials. Finally, RELACSS web apps are all built as interactive open education resources (OER)1. in the form of Shiny web applications. The interactive nature of the web apps helps students visualize and interact with the codes and materials without being overwhelmed with math or statistics symbols. The OER nature of the materials makes accessing the materials affordable (free) for all students and instructors who may adapt the materials to their courses.
Part of the lesson design for instructors from CSS or related fields is to identify data topics or data sets to which students can relate. Identifying topics or data examples that students relate to increases the personal relevance and authenticity of the learning materials, which in turn, increases students' learning outcomes (Lee et al., 2021). RELACSS addresses this by using multicultural data examples, allowing instructors from different backgrounds to adapt the materials and further contextualize the materials for their unique student population.
The RELACSS lessons developed in this study include data examples created using the World Value Survey data. The World Value Survey is an open data project with data collected from up to 80 countries around the world (Inglehart et al., 2022). The survey contains various questions on values and attitudes in work, family, politics, etc. The data were used throughout the lessons, including data examples, practice exercises, and a final project. Therefore, instructors can choose variables and countries that fit their learning contexts.
Using open data with a large number of variables and sub-samples (e.g., individuals nested within countries) also helps to create open assignments. Open assignments or OER-enabled assignments are assignments that meet the 5R principle of OERs (Wiley and Hilton, 2018). The 5R principle states that for materials to be OERs, they must allow the public to freely reuse, retain, revise, remix, and redistribute. Open assignments build upon this to encourage students to create renewable assignments that use OERs and then share with the 5R principle of OERs (Wiley and Hilton, 2018). In other words, instead of creating non-sustainable assignments that students discard after finishing the course, open assignments encourage students to take ownership by creating their own works and sharing for future learners openly (Wiley and Hilton, 2018; Allen and Katz, 2019). This type of open pedagogy also helps generate diverse, localized examples for future use (Ryan, 2022). In the final project built into the RELACSS learning experiences, students are asked to generate a new research question and conduct data analyses. Instead of discarding the assignments after the workshop, students share them openly.
Interactive features are crucial in overcoming students' challenges. Many previous studies in STEM learning have demonstrated that interactivity is crucial in sustaining students' interest and attention in the materials and to improve performance (Lindgren and DeLiema, 2022). For teaching topics like coding, it is important to have a comprehensive environment where teaching materials, examples, data, codes, and practices are all in one place. The teaching and learning experiences can also flow smoothly when students do not have to shift from various sources (platforms, books, software). To achieve these purposes, RELACSS lessons are built on two R packages, shiny and learnr, and are launched on a single website.
Shiny is an R package that allows app developers to design interactive web applications using R languages (Chang et al., 2022). The web applications can be deployed locally or on a server (e.g., the shiny apps server) and shared with others. Shiny has been used for creating educational materials in various STEM subjects, such as ecology (Moore et al., 2022), statistics (Doi et al., 2016), and biology (Weigelt et al., 2021). The package, learnr was developed to increase efficiency in writing interactive shiny apps for education purposes (Aden-Buie et al., 2022).
Shiny web applications, being open-sourced, are great candidates for creating interactive OERs. Developers can easily share source codes for app users to not only retain and reuse, but also to revise, remix, and redistribute (i.e., the 5Rs of OERs). For example, as shown in Figure 1, in the introductory materials developed, the World Value Survey data (Inglehart et al., 2022) were used to demonstrate how to understand happiness ratings among US people in the past 40 years. Instructors from another country can edit the source codes and change the target country or target variables. Instructors may also add practice questions and charts by editing the codes.
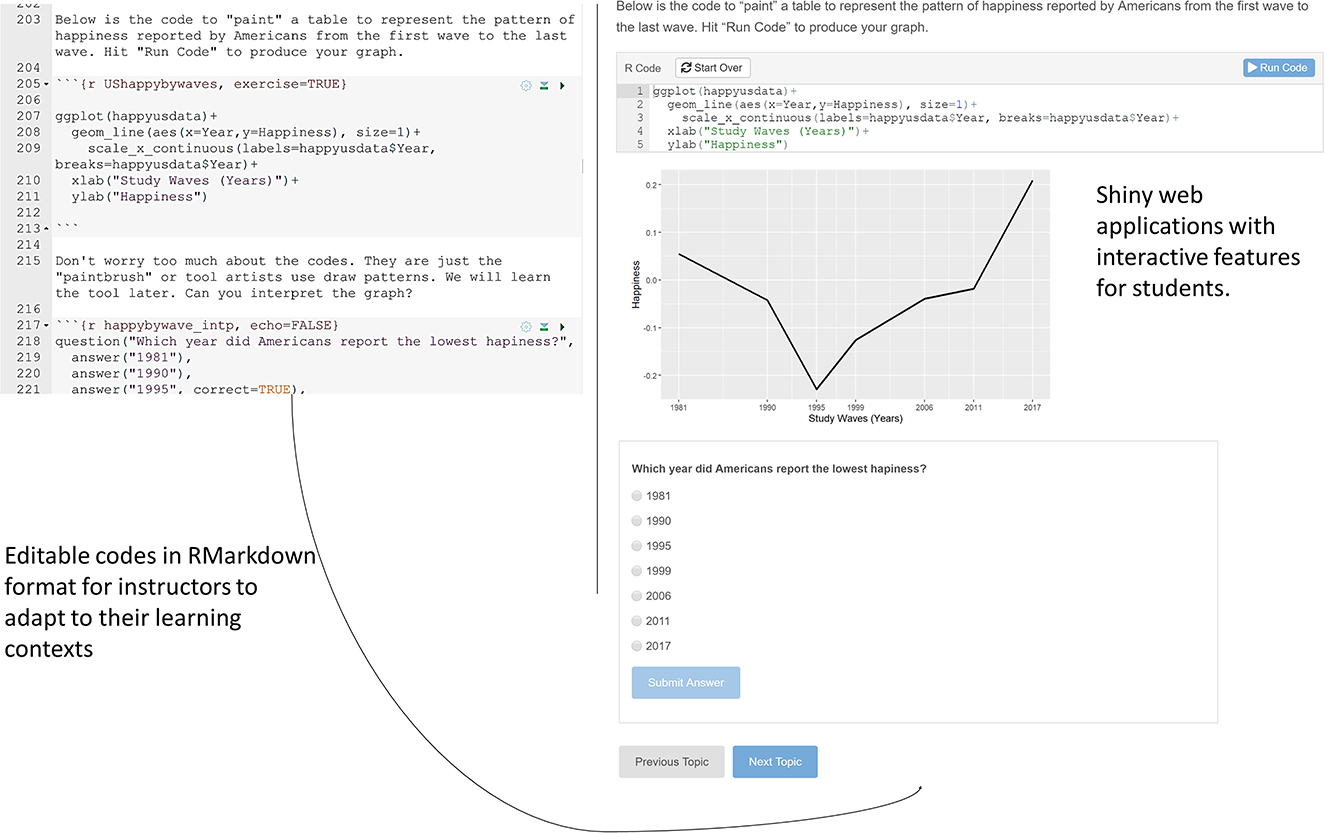
Figure 1. Source code (left) of the interactive shiny web applications (right) can be edited by instructors to teach in unique learning contexts.
In summary, to overcome the challenges of social science novice students in starting to learn computational knowledge, RELACSS beginner OERs were developed with interactive and open features. Several pedagogical frameworks were then applied in designing the learning objectives, contents, and in-class activities. RELACSS was then implemented as a 6-week workshop for university students majoring in social sciences.
As explained in Section 1, the ultimate pedagogical goal of RELACSS is to prepare students to enter the CSS curriculum by overcoming students' challenges, mainly, (1) creating learner-centered, authentic (approachable) content, (2) cultivating a rapport-building, inclusive climate to increase students' STEM identity or sense of STEM belonging, and (3) generating open and interactive materials to make CSS affordable and interesting to students. Several pedagogical frameworks were employed to achieve the goals.
Scaffolding is an instructional strategy (often computer-based) to guide students in building new knowledge systematically (Kim et al., 2017). Scaffolding has been suggested to be effective in helping students master skills or learn materials that they would otherwise not be able to do by themselves (Sherin et al., 2004; Holmes et al., 2013). Scaffolding requires instructors to be learner-centered and to focus on the current state of the students. Specifically, scaffolding requires instructors to identify students' zone of proximal development (ZPD), i.e., the distance between what learners cannot do on their own and what they can do on their own (Vygotskii, 1978; Wertsch, 1984). Scaffolding is realized in three ways in the design of RELACSS.
First, the content knowledge is taught progressively, starting with content that students can easily interpret and scaffold new knowledge. As previously mentioned, average undergraduate social science students often enter the university with limited mathematical and statistical knowledge to sufficiently understand beginner computation (Dong et al., 2020; Berndt et al., 2021). Students may find it difficult to step right into analyzing data and coding. Therefore, the content knowledge taught in RELACSS begins with describing and visualizing data using basic knowledge that is commonly taught in high schools, such as examining trends of a variable in a line graph or histogram. Further, RELACSS is designed for students who are complete novices. Donoho (2017) also suggested that beginner data science education should focus on teaching data gathering, preparation, and exploration (GPE) over modeling at the beginner level. Therefore, RELACSS materials focus on using R codes to learn basic GPE content, including reading data into R, data structure and variables types, exploratory research questions, data cleaning, data visualization, descriptive data analysis, and interpreting and communicating research results.
Second, the overall RELACSS beginner materials follow a progressive four-module structure of Bird-eye view, Use, Modify, and Create (BUMC). In the first module, Bird-eye view, students are exposed to a data story (Lee et al., 2015) that contains a sample “end-product”, i.e., an engaging narrative and visualization explaining a data example. The design of this task is uniquely catered to social science students' lack of interest in data science (Berndt et al., 2021; Esnard et al., 2021) and to motivate students to pursue the next steps. The second to fourth modules follow the Use-Modify-Create structure (Lee et al., 2011) to increase the authenticity of the beginner computation exploration (Franklin et al., 2020; Weintrop, 2021). Specifically, in the second module, Use, students use existing materials and codes to learn basic data analytic skills. Then, the third module, Modify, invites students to consider how they can modify the RQs based on their interests and real-life experiences. In this stage, students modify the analytic plan and R codes and share their modifications with the class. Finally, the last module, Create, challenges students to collaboratively come up with new RQs and write a basic analytic plan and codes from scratch. As detailed in the next section, in addition to the cross-cultural tasks, each module will contain group reflections and co-design discussions to enhance equitable social ecologies in the learning process of RELACSS.
Third, RELACSS materials use social science research questions and data examples to build on social science students' existing knowledge and add new knowledge step-by-step. For example, students are guided to describe and visualize the trend of reported happiness among people in the US. Happiness or life satisfaction, being a topic examined across social science disciplines, can easily connect to social science students. After interpreting basic visualization, students then discuss and come up with factors relating to happiness to test. The analytic concepts and coding methods are embedded in these examples. Through these approachable social science analytic examples, students can associate new knowledge with their existing knowledge.
Peer support is a key feature of RELACSS. As previously mentioned, because of stereotype threats and other associated factors, students, particularly URMs, may feel out of place when learning STEM subjects, resulting in a low sense of belonging and STEM identity (Sax et al., 2018). Collaborative learning can help cultivate an inclusive classroom climate (Nishina et al., 2019) which is crucial to students' success and sense of belonging (Rodriguez and Blaney, 2021; Goering et al., 2022). Collaborative learning has also been consistently found to improve student learning processes and outcomes (Echeverria et al., 2019; Micari and Pazos, 2020).
In the design of RELACSS, in-class discussion questions are embedded in the materials. Further, during the “Modify” stage, two to three students are grouped to modify research questions and codes to conduct analyses using the guided prompt embedded in the lessons. Finally, at the end of each class meeting, 5–10 min are reserved for group reflection. Students first fill out a brief form asking them to summarize their knowledge gained and the challenges experienced. Students shared their responses with one another and collaboratively reflected on the learning experiences. During the workshop, students were also asked to make design suggestions that enable them to learn the materials more effectively. The group reflections and co-design discussions both serve to enhance two-way communications and equitable social ecologies in the learning process of RELACSS (Gutiérrez and Jurow, 2016).
As briefly mentioned in Section 1.2, OER-enabled pedagogy (Wiley and Hilton, 2018) is employed in the “Create” module. Open or OER-enabled pedagogy can be referred to as the design of renewable or sustainable assignments or classroom activities using OERs (Wiley and Hilton, 2018). In the “Create” module, learners are asked to use the cross-cultural World Value Survey open data and the RELACSS OERs learned in the previous class meetings to generate a new research question, analytic plan, and codes. Then, students share the end product openly as a shiny web application, allowing other learners to access and learn from their analytic products.
The design of RELACSS beginner OERs is guided by the following course-level learning objectives:
• Identify basic social science data analytic steps;
• Explore a real-world, open cross-cultural dataset and formulate testable research questions;
• Write simple R codes to execute data analytic tasks;
• Interpret and present data analysis results.
The module-level learning objectives can be found in Table 1. The contents of RELACSS materials can be found on the RELACSS instructional site (bit.ly/RELACSSweb). R language was chosen as the coding language taught in RELACSS because R is the most common coding language among social scientists (Eiler et al., 2020; Vance, 2021).
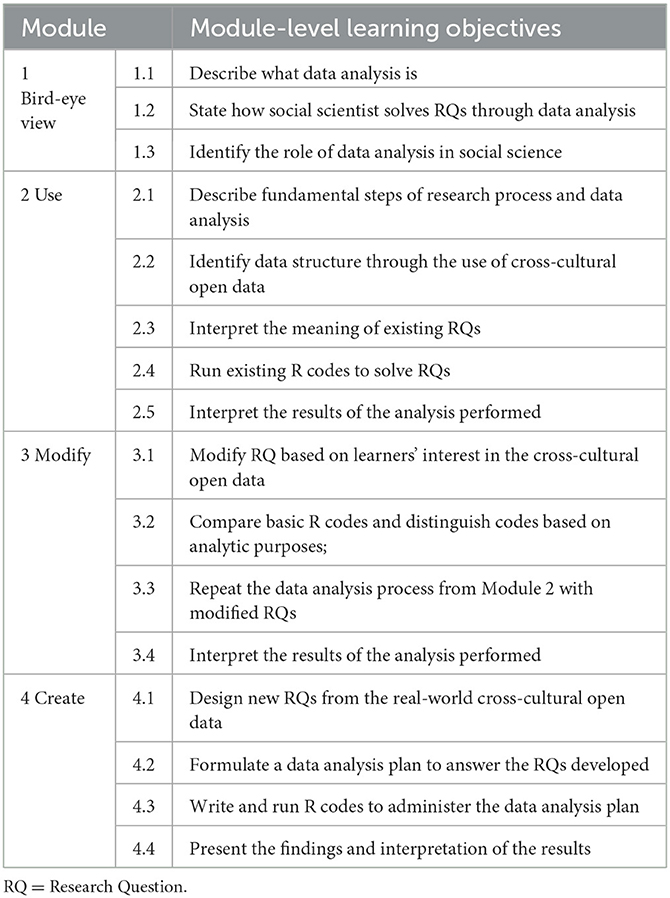
Table 1. Module-level learning objectives.
RELACSS beginner materials were implemented as a 6-week, non-credit workshop for social science students in a university setting. None of the students had prior experience in analyzing data using R codes. Each week, the students met for one hour as a group. A total of 16 students spread across two groups completed the workshop. Students ranged from first-year undergraduate students to graduate students. Students were invited to bring their laptops, but computers were also provided for the students to learn. There were no technical requirements for the computers except that the device must be able to use any web browser to access the lessons (Chrome, Firefox, etc.). The author who is a faculty member in psychology taught the lessons.
During each session, students arrived at the classroom and prepared the lesson by opening the URL of the shiny app lessons. Students were first guided to read the learning objectives of the lesson (the first section of every lesson). The instructor then guided the students to go over the interactive shiny web applications. Embedded prompts were provided to students for participation in peer discussions. Students also had the opportunity to run the codes, respond to the interactive practice questions, and discuss the concepts learned.
The first week was the “Bird-eye View” module, inviting students to examine a data example. During the second to the third week, students applied existing codes and examples to learn the knowledge (the “Use” module). In the fourth week, students collaboratively modified the codes (the “Modify” module). Finally, during the last 2 weeks, students engaged in the “Create” module and complete the final project during class time. Students were encouraged to ask questions and discuss with peers when they create their final project products.
Assessments were conducted according to the pedagogical goals of RELACSS. Student learning outcomes were measured in the format of a final project. The final project was assessed on the accuracy of the data analytic steps and codes, as well as the level of creativity. Students' CSS skills were scored using an adapted version of the American Statistical Association (ASA) Project Competition Rubric (ASA, 2022). The grading categories include (1) research question quality (clearly stated research questions and alignment with analytic methods), (2) raw data management, (3) data visualization, (4) data analysis, (5) conclusion (e.g., clear answers to research questions), and (6) overall presentation.
Additionally, after the workshop, students were assessed on their perception of the learning process. The assessments were developed based on the challenges the tools aimed to address (see Section 1) and the pedagogy goals. The assessment questions (AQ) and the associated assessment tools included
• AQ1. What is students' perception of interactivity and authenticity (i.e., being approachable and relatable) of the RELACSS OERs?
• AQ2. What is students' perception of the social aspects of the classroom experiences (rapport-building collaborative learning)?
• AQ3a. What are students' perceived changes before and after the lessons on their confidence in data analysis, interest in data analysis, knowledge of data analysis, and anxiety when thinking about data analysis?
• AQ3b. What are students' CSS identity, interests, and plans for pursuing data analysis/CSS further?
The assessment tools, the final project rubric, along with the anonymized data can be found on the project's Open Science Foundation (OSF) site (https://osf.io/m87kh/). Details of the assessments are also reported along with the results in Section 4. The assessment and human research associated with the assessments were approved by the author's Institutional Review Board (IRB) under the approval number: IRB-22-123-PSYC-Gird. The data analysis for the assessment is primarily descriptive. Students' final project outcomes were summarized using the adapted version of the American Statistical Association (ASA) Project Competition Rubric (ASA, 2022) mentioned earlier. Then, to answer AQs, descriptive statistics (means and standard deviations) were computed and reported.
Participation in the assessment portion is completely voluntary. A total of 10 students filled out the feedback form. Among the nine students who reported demographics, six identified as females, and three as males. Students were mostly URMs, including African/Black (n = 5), Middle-eastern (n = 1), and Mixed-race (n = 1). Only two identified as White. Students were spread among lower-class undergraduate students (n = 1), upper-class undergraduate students (junior or above; n = 6), and graduate students (n = 2).
With the help of the instructor and peers, all students were able to produce their unique final project products. All final products can be viewed openly in the RELACSS instructional site (bit.ly/RELACSSweb). All students produced satisfactory final project products according to the rubric. Specifically, all students were able to formulate their unique research questions based on variables and countries available in the World Value Survey data. Ten out of the 16 students chose to compare groups or countries, and six students chose to examine relationships between chosen variables. All students produced an excellent level of research questions. In terms of data management codes, all students were able to take materials from previous RELACSS modules to guide them to write the codes. However, most students needed to ask questions in the process to clarify or confirm their coding accuracy. Students also tended to run redundant codes (lack of efficiency) or place codes in incorrect orders.
The biggest challenge in the final project creation appeared to be choosing the right visualization (e.g., box plots vs. line plots) and writing the visualization codes. This may be due to insufficient lesson time to go over a variety of plots. The in-class time was only sufficient for going over limited visualization examples. These examples did not necessarily match the types of research questions students are asking. Also, students were mostly unfamiliar with the principles of visualizing data based on variable types (e.g., differences in visualizing categorical and continuous variables). One way to resolve this is to limit the type of research questions students ask; alternatively, more time can be devoted to going over visualization rather than the codes.
Despite the challenges, with the help of the instructor, all students were able to identify the codes used to visualize their results. Students expressed that the visualization helps them write and present their interpretation of the results. This further underlines the importance of teaching visualization at the beginner level.
In terms of students' perception of interactivity and authenticity of the RELACSS OERs (AQ1), students were asked to rate on a Likert scale from 0 to 10 their perception of whether the RELACSS web applications are authentic (relatable and approachable), learner-centered, informative, and interactive, as well as whether RELACSS helps them gain new knowledge. As shown in Figure 2, students reported high scores across all aspects. Specifically, students perceived RELACSS to be highly interactive (M = 9.11, SD = 0.99), learner-centered (M = 8.89, SD = 0.99), and authentic/relatable (M = 9.11, SD = 0.99). Students also perceived RELACSS to be informative (M = 9.22, SD = 1.31) and help gain new knowledge (M = 8.44, SD = 1.07).
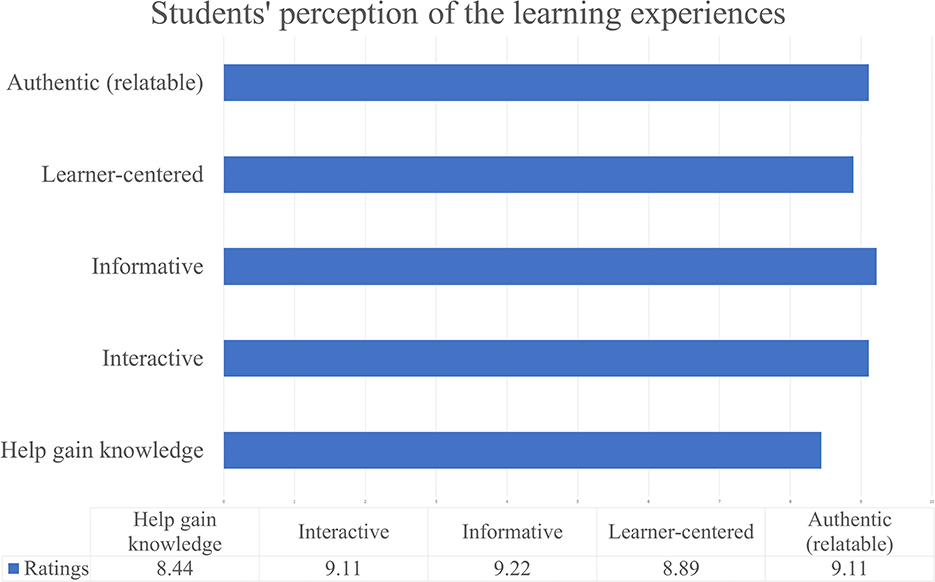
Figure 2. Average ratings of students' perception toward the RELACSS learning experiences.
Students' perception of the social aspects (rapport-building collaborative learning; AQ2) was assessed using one open-ended question, “Is there anything you like or dislike about the classroom learning experience?” Students, in general, responded positively to the classroom climate. Specifically, many students expressed that they felt bonded to other students (e.g., “felt connected to other students”, “felt cared for and respected”, “felt included and respected”, etc.). Others mentioned that they “liked the group setting” and that “the group was small so all my questions were able to be answered and everyone was able to have individual help”. One student mentioned that they wished to have more in-class time and suggested increasing class time and having homework assignments in the future.
Next, students were asked to rate their perceived change before and after the lessons (AQ3a) on their confidence in data analysis, interest in data analysis, knowledge of data analysis, and anxiety when thinking about data analysis using a 5-point Likert scale from 1 (strongly disagree) to 5 (strongly agree). “Data analysis” was chosen as the prompt because data analysis was the umbrella term used to refer to the different aspects of knowledge taught during the implementation (e.g., coding, data management, data visualization, data description, etc.). As shown in Figure 3, students' average self-ratings on their confidence in data analysis (Mafter−before = 1.80, SDafter−before = 0.98), interest in data analysis (Mafter−before = 1.60, SDafter−before = 1.11), and knowledge in data analysis (Mafter−before = 1.80, SDafter−before = 0.87) were about double after participating in RELACSS. Students' anxiety in data analysis also slightly dropped after the RELACSS experiences (Mafter−before = −1.60, SDafter−before = 0.80). No inferential tests were performed due to a small assessment sample size.
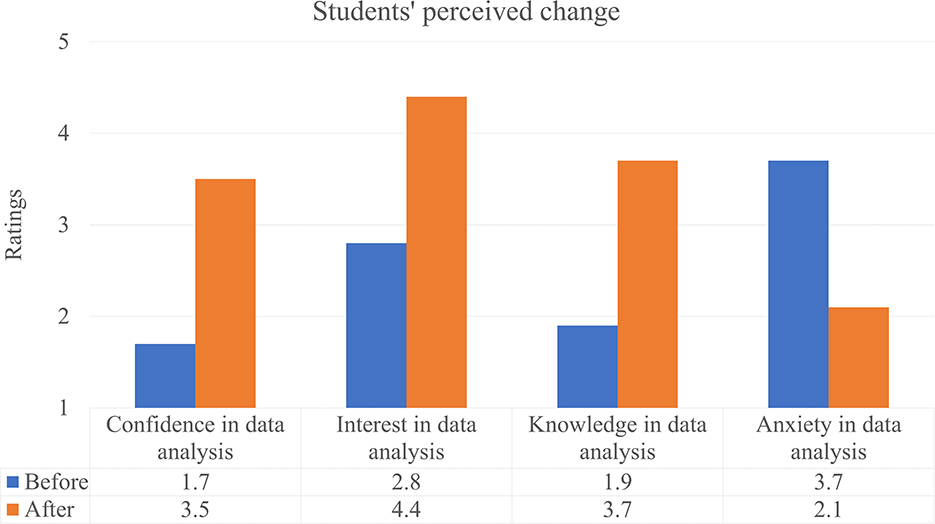
Figure 3. Average ratings of students' perception of change before and after the RELACSS learning experiences.
Students' CSS identity, interests, and plans for pursuing data analysis/CSS in the future (AQ3b) were explored using multiple assessment questions. Students' CSS identity was assessed by asking students to rate from 0 to 10 their agreement on whether they see themselves as a future computational social scientist or data analyst. All students rated highly on the item (M = 9.44, SD = 0.68). Similarly, when using the same scale to report interest in further pursuing social science, students rated their interest highly (M = 8.44, SD = 1.42). Students were also asked if they would sign up for the next level of the CSS workshop in the following semester. All students were interested in signing up.
Finally, students' interest was further gauged using an open-ended question asking them in what ways the RELACSS experiences “has any impact on your future academic and career development or plan”. Some students explicitly expressed that they became interested in a data science or CSS career and that the RELACSS experiences opened a new career possibility for them (e.g., “I would like to go into a career in data analysis”, “The workshop definitely opened my eyes to career opportunities.”, “I think I will be a lot more interested in doing data analysis and statistics for research studies during graduate school”, “I am now more comfortable pursuing a career in data analysis related fields”). Students also shared that the RELACSS experiences changed how they saw their roles in data analysis (e.g., “This workshop made me feel like I have the ability to actually learn R and apply it in my future career, which I didn't think I had the capacity to do before.”, “I would have been too scared to even consider data analysis as a career before the workshop”).
The RELACSS open, interactive shiny web applications and the associated pedagogical frameworks are teaching innovations developed to address challenges novice social sciences may experience when learning CSS-related knowledge. The open nature of RELACSS will allow future instructors to adapt the web applications to their localized context. In addition to being open, the advantage of using the shiny applications for classroom instruction instead of having students work in R Studio or R console is that the tools do not require any software download or account registration/login. Instructors and students simply need to open the URLs for the shiny app and start typing codes and analyzing data using the embedded data examples. This saves time downloading software, opening the software, importing data, etc.
Results from the implementation showed that students felt positive toward the RELACSS experiences and agreed that RELACSS helped them gain new knowledge and move forward in pursuing the data science pathway further as social scientists. Specifically, students rated RELACSS to be highly interactive, learner-centered, and relatable. In terms of the social design of RELACSS, students expressed that they felt included during the experiences and felt comfortable joining the learning group weekly. Students found the instructional environment to be supportive, offering them individual help when needed. In addition, RELACSS appears to help students create a CSS/data analysis identity. Students shared that the RELACSS experiences helped them see what they could achieve in data analysis.
However, because of limited time, some aspects were not assessed. For example, students' perceived difficulties were not examined. Similarly, the effect of scaffolding was not fully examined. However, informal observations made during the 6-week interaction seemed to show that students were able to resolve challenges by asking questions during class, as they all managed to complete the tasks assigned during each lesson. Students' success in persisting to the end of the workshop and generating the final project end products (with in-class help) also supported that the level of difficulty appeared to be appropriate. Future researchers and educators may consider conducting a more thorough assessment, such as using formal classroom observations, interviewing students, or conducting focus groups. Researchers may also conduct design-based research to examine the different design/pedagogical components of the lessons. In addition, there was no quantitative assessment of students' perceived belonging and perception of classroom climate. The benefit of using merely a brief open-ended question for all social aspects is to allow students to freely share their perception of the classroom climate, particularly in aspects that the instructor may not notice. Future studies may consider using mixed methods to assess the social aspects.
One important lesson learned in the implementation process is that students may need more time to complete the RELACSS beginner materials. The implementation reported in this study was one hour per week for 6 weeks out of concerns about beginners' attention spans. Scheduling more than one hour outside everyone's class time was also a challenge. Some students expressed in the survey that they wanted more time to go deeper into the materials. These students tended to be lower-class undergraduate students. On the other hand, graduate students and some upper-class undergraduate students appeared to be comfortable with the current time setting. Future instructors (especially those who are teaching lower-class undergraduate students) may consider doing 1.5 h per week or extending the RELACSS experiences into an 8-week program. Another alternative is to incorporate the materials in regular 3-credit research methods or beginner computational social science courses. This option may fit better in institutions that are more open to creating a new course on CSS or updating current research methods or data analysis courses to include computational knowledge.
The datasets presented in this study can be found in online repositories. The names of the repository/repositories and accession number(s) can be found below: https://osf.io/m87kh/.
The studies involving human participants were reviewed and approved by Institutional Review Board, University of Louisiana at Lafayette. The patients/participants provided their written informed consent to participate in this study.
ML contributed to the conception, design, and assessment of the study and wrote, revised, read, and approved the manuscript.
This work was supported by the Open Education Resources (OER) Research Fellow awarded to the author by the Open Education Group and the Research Competitiveness Subprogram awarded to the author by the Board of Regents Louisiana [LEQSF(2019-22)-RD-A-23]. The Open Education Group supported the publication cost. The Board of Regents Louisiana supported the cost of the research activities and shiny web application development and deployment.
The author declares that the research was conducted in the absence of any commercial or financial relationships that could be construed as a potential conflict of interest.
All claims expressed in this article are solely those of the authors and do not necessarily represent those of their affiliated organizations, or those of the publisher, the editors and the reviewers. Any product that may be evaluated in this article, or claim that may be made by its manufacturer, is not guaranteed or endorsed by the publisher.
1. ^Open Education Materials (OER) are defined as educational materials that follow the 5R principle, i.e., allowing users to freely reuse, retain, revise, remix, and redistribute (Wiley et al., 2013).
Aden-Buie, G., Schloerke, B., and Allaire, J. (2022). learnr: Interactive Tutorials for R. Available online at: https://rstudio.github.io/learnr/, https://github.com/rstudio/learnr
Allen, J. V., and Katz, S. (2019). Developing open practices in teacher education: an example of integrating OER and developing renewable assignments. Open Prax. 11, 311. doi: 10.5944/openpraxis.11.3.972
ASA (2022). Scoring Rubric for American Statistical Association (ASA) Project Competition. Available online at: https://www.amstat.org/asa/files/pdfs/EDU-ProjectJudgingRubric.pdf
Berndt, M., Schmidt, F. M., Sailer, M., Fischer, F., Fischer, M. R., and Zottmann, J. M. (2021). Investigating statistical literacy and scientific reasoning & argumentation in medical-, social sciences-, and economics students. Learn. Individ. Differ. 86, 101963. doi: 10.1016/j.lindif.2020.101963
Chang, W., Cheng, J., Allaire, J., Sievert, C., Schloerke, B., Xie, Y., et al. (2022). shiny: Web Application Framework for R. R package version 1.7.4.9000. Available online at: https://shiny.rstudio.com/
Chew, P. K. H., and Dillon, D. B. (2014). Statistics anxiety update: refining the construct and recommendations for a new research agenda. Perspect. Psychol. Sci. 9, 196–208. doi: 10.1177/1745691613518077
Cui, S., Zhang, J., Guan, D., Zhao, X., and Si, J. (2019). Antecedents of statistics anxiety: an integrated account. Pers. Individ. Dif. 144, 79–87. doi: 10.1016/j.paid.2019.02.036
Davies, E. L., Morys-Carter, W. L., and Paltoglou, A. E. (2015). Helping students to climb the mountain: a study to inform the development of a resource to improve the learning of statistics in psychology. Psychol. Teach. Rev. 21, 56–67. doi: 10.53841/bpsptr.2015.21.1.56
Doi, J., Potter, G., Wong, J., Alcaraz, I., and Chi, P. (2016). Web application teaching tools for statistics using r and shiny. Technol. Innovat. Stat. Educ. 9. doi: 10.5070/T591027492
Dong, A., Jong, M. S. Y., and King, R. B. (2020). How does prior knowledge influence learning engagement? The mediating roles of cognitive load and help-seeking. Front. Psychol. 11, 1–10. doi: 10.3389/fpsyg.2020.591203
Donoho, D. (2017). 50 years of data science. J. Comput. Graph. Stat. 26, 745–766. doi: 10.1080/10618600.2017.1384734
Echeverria, L., Cobos, R., and Morales, M. (2019). Improving the students computational thinking skills with collaborative learning techniques. IEEE Rev. Iberoam. Tecnol. Aprend. 14, 196–206. doi: 10.1109/RITA.2019.2952299
Eiler, B. A., Doyle, P. C., Al-Kire, R. L., and Wayment, H. A. (2020). Teaching computational social science skills to psychology students: an undergraduate research lab case study. Scholar. Pract. Undergrad. Res. 4, 5–14. doi: 10.18833/spur/4/1/5
Esnard, T. R., Alladin, F. M., and Samlal, K. C. (2021). Prior mathematics performance, statistics anxiety, self-efficacy and expectations for performance in statistics: a survey of social sciences students in a caribbean institution of higher education. Stat. Educ. Res. J. 20, 4. doi: 10.52041/serj.v20i1.98
Franklin, D., Coenraad, M., Palmer, J., Eatinger, D., Zipp, A., Anaya, M., et al. (2020). An analysis of use-modify-create pedagogical approach's success in balancing structure and student agency. In: ICER 2020- Proceedings of the 2020 ACM Conference on International Computing Education Research. Virtual event, 14–24. doi: 10.1145/3372782.3406256
Goering, A. E., Resnick, C. E., Bradford, K. D., and Othus-Gault, S. M. (2022). Diversity by design: broadening participation through inclusive teaching. New Direct. Commun. Coll. 2022, 77–91. doi: 10.1002/cc.20525
Gutiérrez, K. D., and Jurow, A. S. (2016). Social design experiments: toward equity by design. J. Learn. Sci. 25, 565–598. doi: 10.1080/10508406.2016.1204548
Holmes, N. G., Day, J., Park, A. H. K., Bonn, D. A., and Roll, I. (2013). Making the failure more productive: scaffolding the invention process to improve inquiry behaviors and outcomes in invention activities. Instruct. Sci. 42, 523–538. doi: 10.1007/s11251-013-9300-7
Inglehart, R., Haerpfer, C., Moreno, A., Welzel, C., Kizilova, K., Diez-Medrano, J., et al. (2022). World Values Survey: All Rounds - Country-Pooled Datafile Version. Technical report, JD Systems Institute. Available online at: https://www.worldvaluessurvey.org/WVSDocumentationWV7.jsp
Kim, B. (2021). Scaling up data science for the social sciences. Harvard Data Sci. Rev. 3. doi: 10.1162/99608f92.d3f14ea4
Kim, N. J., Belland, B. R., and Walker, A. E. (2017). Effectiveness of computer-based scaffolding in the context of problem-based learning for stem education: Bayesian meta-analysis. Educ. Psychol. Rev. 30, 397–429. doi: 10.1007/s10648-017-9419-1
Lawton, S., and Taylor, L. (2020). Student perceptions of engagement in an introductory statistics course. J. Stat. Educ. 28, 45–55. doi: 10.1080/10691898.2019.1704201
Lazer, D. M. J., Pentland, A., Adamic, L., Aral, S., Barabási, A.-, l., Brewer, D., et al. (2009). Computational social science. Science 323, 721–723. doi: 10.1126/science.1167742
Lazer, D. M. J., Pentland, A., Watts, D. J., Aral, S., Athey, S., Contractor, N., et al. (2020). Computational social science: obstacles and opportunities. Science 369, 1060–1062. doi: 10.1126/science.aaz8170
Lee, B., Riche, N. H., Isenberg, P., and Carpendale, S. (2015). More than telling a story: a closer look at the process of transforming data into visually shared stories. IEEE Comp. Graph. Appl. 35, 84–90. doi: 10.1109/MCG.2015.99
Lee, I., Martin, F., Denner, J., Coulter, B., Allan, W., Erickson, J., et al. (2011). Computational thinking for youth in practice. ACM Inroads 2, 32–37. doi: 10.1145/1929887.1929902
Lee, V. R., Wilkerson, M. H., and Lanouette, K. (2021). A call for a humanistic stance toward k–12 data science education. Educ. Res. 50, 664–672. doi: 10.3102/0013189X211048810
Lindgren, R., and DeLiema, D. (2022). Viewpoint, embodiment, and roles in STEM learning technologies. Educ. Technol. Res. Dev. 70, 1009–1034. doi: 10.1007/s11423-022-10101-3
Lisberg, A., and Woods, B. (2018). Mentorship, mindset and learning strategies: An integrative approach to increasing underrepresented minority student retention in a stem undergraduate program. J. STEM Educ. 19, 14–20.
Liu, S., Liu, P., Wang, M., and Zhang, B. (2021). Effectiveness of stereotype threat interventions: a meta-analytic review. J. Appl. Psychol. 106, 921–949. doi: 10.1037/apl0000770
Micari, M., and Pazos, P. (2020). Beyond grades: improving college students' social-cognitive outcomes in STEM through a collaborative learning environment. Learn. Environ. Res. 24, 123–136. doi: 10.1007/s10984-020-09325-y
Moore, T. N., Thomas, R. Q., Woelmer, W. M., and Carey, C. C. (2022). Integrating ecological forecasting into undergraduate ecology curricula with an r shiny application-based teaching module. Forecasting 4, 604–633. doi: 10.3390/forecast4030033
Nishina, A., Lewis, J. A., Bellmore, A., and Witkow, M. R. (2019). Ethnic diversity and inclusive school environments. Educ. Psychol. 54, 306–321. doi: 10.1080/00461520.2019.1633923
Okon-Singer, H. (2018). The role of attention bias to threat in anxiety: mechanisms, modulators and open questions. Curr. Opin. Behav. Sci. 19:26–30. doi: 10.1016/j.cobeha.2017.09.008
Rattan, A., Savani, K., Komarraju, M., Morrison, M. M., Boggs, C., and Ambady, N. (2018). Meta-lay theories of scientific potential drive underrepresented students' sense of belonging to science, technology, engineering, and mathematics (stem). J. Pers. Soc. Psychol. 115, 54–75. doi: 10.1037/pspi0000130
Rodriguez, S. L., and Blaney, J. M. (2021). “we're the unicorns in STEM”: Understanding how academic and social experiences influence sense of belonging for latina undergraduate students. J. Divers. High. Educ. 14, 441–455. doi: 10.1037/dhe0000176
Ryan, M., (2022). Beyond the Traditional Essay: Increasing Student Agency in a Diverse Classroom With Nondisposable Assignments. Series in Education. Wilmington, NC: Vernon Press.
Sax, L. J., Blaney, J. M., Lehman, K. J., Rodriguez, S. L., George, K. L., and Zavala, C. (2018). Sense of belonging in computing: the role of introductory courses for women and underrepresented minority students. Soc. Sci. 7, 122. doi: 10.3390/socsci7080122
Sherin, B., Reiser, B. J., and Edelson, D. (2004). Scaffolding analysis: extending the scaffolding metaphor to learning artifacts. J. Learn. Sci. 13, 387–421. doi: 10.1207/s15327809jls1303_5
Singer, A., Montgomery, G., and Schmoll, S. (2020). How to foster the formation of stem identity: studying diversity in an authentic learning environment. Int. J. STEM Educ. 7, 57. doi: 10.1186/s40594-020-00254-z
Steele, C. M., Spencer, S. J., and Aronson, J. (2002). Contending with group image: The psychology of stereotype and social identity threat. Adv. Exper. Soc. Psychol. 34, 379–440. doi: 10.1016/S0065-2601(02)80009-0
Vance, E. A. (2021). Using team-based learning to teach data science. J. Stat. Data Sci. Educ. 29, 277–296. doi: 10.1080/26939169.2021.1971587
Walton, G. M., Logel, C., Peach, J. M., Spencer, S. J., and Zanna, M. P. (2015). Two brief interventions to mitigate a “chilly climate” transform women's experience, relationships, and achievement in engineering. J. Educ. Psychol. 107, 468–485. doi: 10.1037/a0037461
Weigelt, P., Denelle, P., Brambach, F., and Kreft, H. (2021). BotanizeR: A flexible r package with shiny app to practice plant identification for online teaching and beyond. Plants People Planet 4, 122–127. doi: 10.1002/ppp3.10226
Weintrop, D. (2021). The role of block-based programming in computer science education. In: Understanding Computing Education (Vol 1). Proceedings of the Raspberry Pi Foundation Research Seminar Series (Virtual event: Raspberry Pi), 1–8. Available online at: https://www.raspberrypi.org/app/uploads/2022/10/The_Role_of_Block_Based_Programming.pdf
Wertsch, J. V. (1984). The zone of proximal development: some conceptual issues. New Dir. Child Adolesc. Dev. 1984, 7–18. doi: 10.1002/cd.23219842303
Wiley, D., Bliss, T. J., and McEwen, M. (2013). Open educational resources: a review of the literature. In Handbook of Research on Educational Communications and Technology (New York, NY: Springer), 781–789.
Wiley, D., and Hilton, J. L. III. (2018). Defining oer-enabled pedagogy. Int. Rev. Res. Open Distrib. Learn. 19, 133–147. doi: 10.19173/irrodl.v19i4.3601
Keywords: computational social science, R programming, social science, research methods, pedagogy, shiny apps, undergraduate education, science technology engineering mathematics (STEM)
Citation: Li M (2023) Teaching beginner-level computational social science: interactive open education resources with learnr and shiny apps. Front. Educ. 8:1130865. doi: 10.3389/feduc.2023.1130865
Received: 23 December 2022; Accepted: 09 May 2023;
Published: 02 June 2023.
Edited by:
Wang-Kin Chiu, The Hong Kong Polytechnic University, ChinaReviewed by:
Evelyn Valdez-Ward, University of Rhode Island, United StatesCopyright © 2023 Li. This is an open-access article distributed under the terms of the Creative Commons Attribution License (CC BY). The use, distribution or reproduction in other forums is permitted, provided the original author(s) and the copyright owner(s) are credited and that the original publication in this journal is cited, in accordance with accepted academic practice. No use, distribution or reproduction is permitted which does not comply with these terms.
*Correspondence: Manyu Li, bWFueXUubGlAbG91aXNpYW5hLmVkdQ==
Disclaimer: All claims expressed in this article are solely those of the authors and do not necessarily represent those of their affiliated organizations, or those of the publisher, the editors and the reviewers. Any product that may be evaluated in this article or claim that may be made by its manufacturer is not guaranteed or endorsed by the publisher.
Research integrity at Frontiers
Learn more about the work of our research integrity team to safeguard the quality of each article we publish.