 Antonio Hernández-Fernández
- 1Department of Pedagogy, University of Jaén, Jaén, Spain
- 2Department of Research Methods and Diagnosis in Education, University of Granada, Granada, Spain
This article analyzes the psychometric properties of the scale used in the research corresponding to the topic “Stories of Abandonment. A Biographical-Narrative Approach to the Academic Dropout in Andalusian Universities. Multicausal Analysis and Proposals for Prevention.” The scale is composed of 71 items, with five Likert-type response alternatives. The participants forming the convenience sample were 970 from six Spanish universities. The study dimensions are: A.-Motivation, B.-Commitment, C.-Attitude and behavior, D.-Socioeconomic conditions, and finally E.-Permanence. The study begins by calculating the statistical power and the effect size, thus determining the type I and type II error. Similarly, reliability has been calculated based on the intercorrelation of items through Cronbach’s alpha (0.906). The construct validity was carried out through exploratory factor analysis, for which the correlation matrix was studied using the Kaiser-Meyer-Olkin measure of sampling adequacy (KMO coefficient), in this case the value is 0.886, the result of Bartlett’s test of sphericity is 0.000 and the Determinant 4.009E−12, so we continue with the analysis of the correlational structure, extracting the factors through the principal components method and determining in this way the communalities with the highest and lowest values. Next, we calculated the total variance explained, obtaining 16 factors and an accumulated variance of 57.315%. Finally, the model was determined by distributing the items according to the highest level of saturation by factors, obtaining a 30-item scale with a Cronbach’s alpha of 0.893, which is reliable. In conclusion, the questionnaire used complies with the psychometric aspects necessary to be an optimal scale.
1. Introduction
One of the main problems of the university system, both internationally and nationally, is the dropout of university students before completing their studies. However, this problem does not only affect the system itself, but also involves damage to the development of a society’s human capital (Rué, 2014), in addition to generating a high economic cost for public accounts (Colás, 2015). These issues already justify the need to understand university dropout as a phenomenon on which it is necessary to intervene and understand its causes in order to generate strategies to prevent or reduce it.
The project in which this work is framed focuses on the dropout rate of the system, without considering the dropout rate of each degree in particular or the rate of change of degree. With the application of the analyzed instrument it is intended to detect the presence or absence of variables that may lead to dropout from the university system. With regard to the variables that influence this issue, Velázquez and González (2017) establish four factors to be taken into account:
1) motivation,
2) commitment,
3) attitudes and behavior,
4) social and economic conditions.
It should be noted that in this study, university dropout is considered to be a situation in which, without having completed university studies, a period of two academic years is allowed to pass without enrolling in the official degree program or in a different one.
Turning to psychometric issues, it should be noted that Sánchez et al. (2011), analyzing the Neyman-Pearson lemma, point out that in any study there are two opposing hypotheses, a null and an alternative hypothesis, in our case that the subject is or is not at risk of dropping out of university studies, and this gives us two possible errors. The authors define Type I error as that which is committed by rejecting a null hypothesis that is in fact correct, while Type II error is defined as that which is committed by accepting a null hypothesis that is in fact false.
On the other hand, reliability, according to Prieto and Delgado (2010), refers to the consistency or stability of the measurements in case of repeating the measurement process. According to the authors, the lower the variability between different measurements under similar conditions, the higher the reliability of the instrument.
Regarding to validity, Ávalos (2022) lists the three types of validity that any measurement instrument in order to be considered optimal:
a) Construct validity. This refers to the precision of the definition of the behavior, trait or characteristic to be measured and the adaptation and suitability of the instrument used to provide evidence that allows the measurement of said behavior, trait or characteristic. Construct validity should be carried out through expert judgment.
b) Content validity. It is considered to have been explicated to the extent that the items that make up the instrument are representative of the number of behaviors and traits that are intended to be detected. Content validity is usually corroborated by expert judgment and application of Kappa coefficient análisis, but this is not the only way.
c) Criterion validity. It can be concurrent or predictive and is considered acquired when the instrument to be validated is applied together with others that measure the same thing, and that have already achieved validity, and similar results are obtained. For criterion validity, analyses of sensitivity, specificity, positive predictive value, negative predictive value, proportion of false positives, proportion of false negatives and percentage of coincidence are usually carried out.
By means of the present text, the results obtained after performing the psychometric analysis of one of the instruments used in the aforementioned Project are shown, specifically the questionnaire on successful student permanence by Velázquez and González (2017). This work provides a smaller instrument that requires less time for its application with high reliability.
2. Materials and methods
The research “Stories of Abandonment. A Biographical-Narrative Approach to the Academic Dropout in Andalusian Universities. Multicausal Analysis and Proposals for Prevention” follows a quantitative, non-experimental and descriptive methodology. In this work, the narrative methodology has not been dealt with, since the object of research is centered on the questionnaire. Quadrants were made with the different degrees to which the research team had Access (the quadrants are not shown, due to their extensión), either by teaching or by being able to access through a colleague, trying to cover the largest possible number of degrees. Thus, a sample of 970 students from four Spanish universities (University of Granada - Granada Campus, University of Granada - Ceuta Campus, University of Jaén, Pablo de Olavide University and University of Seville) was obtained, with participants from 12 different degrees and 7 double degrees (Degree in Early Childhood Education, Degree in Social Education, Degree in Primary Education, Degree in Nursing, Degree in Physical Activity and Sports Sciences, Degree in Physiotherapy, Degree in Business Administration and Management, Degree in Telecommunications Technology Engineering, Degree in Environmental Sciences, Degree in Criminology, Degree in Pedagogy, Degree in Industrial Electronic Engineering, Double Degree in Business Administration and Management and Law, Double Degree in Environmental Sciences and Agricultural Engineering, Double Degree in English Studies and Primary Education, Double Degree in Environmental Sciences and Geography and History, Double Degree in Law and International Relations, Double Degree in Geography and History and International Relations and Double Degree in Translation and Interpretation and International Relations).
For data collection, the Velázquez and González (2017) scale is used, composed of 71 items, with five Likert-type response alternatives, grouped into 4 factors: motivation, commitment, attitudes and behavior, and social and economic conditions, to which the permanence factor was added after factor analysis.
The psychometric analysis of this study begins with the analysis of Type I and II errors as well as the statistical power of the research. Reliability will then be determined based on item intercorrelation, concluding with content and construct validity.
3. Results
The first results come from establishing that the research design should consider the sample size and the statistical power that would be achieved with it (Cardenas and Arancibia, 2016). In this way, the type I and type II error is determined, represented in Figure 1.
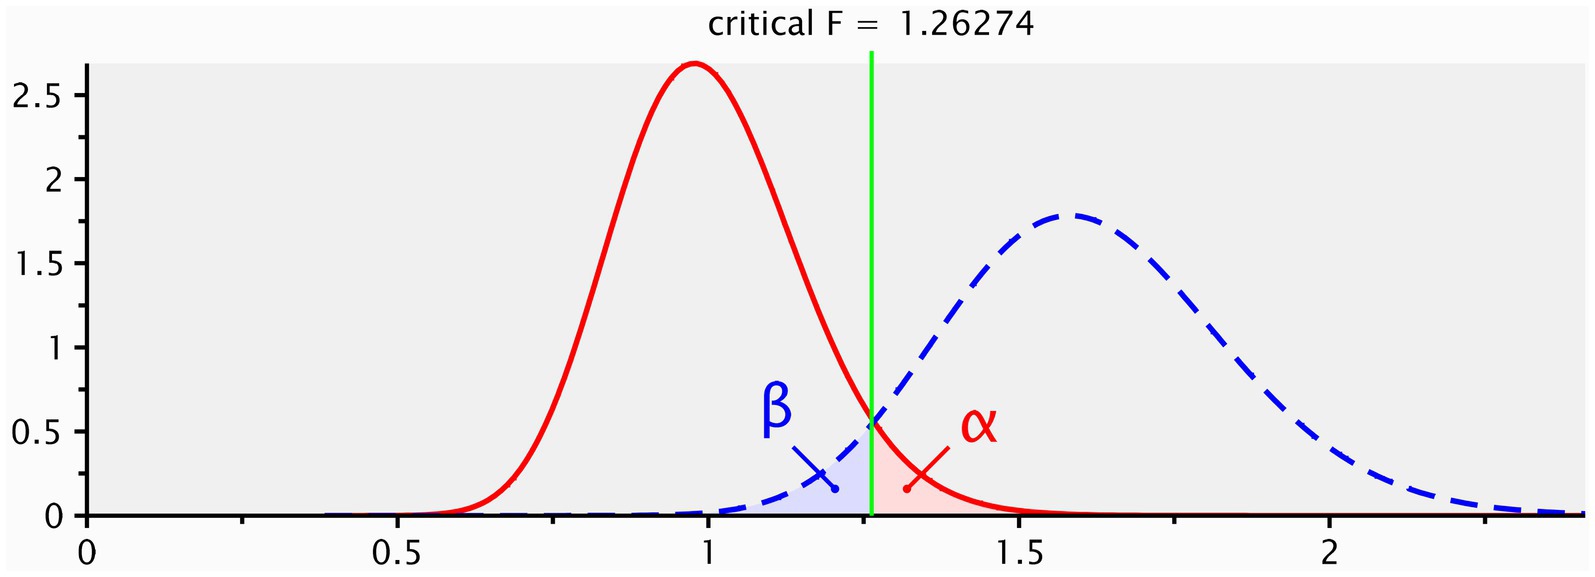
Figure 1. Representation of type I and II errors. Own source.
The statistical power of this research is the complement of the type II error probability, that is, the probability of erroneously accepting the null hypothesis (Cohen, 1992). In this case the effect size is 0.25, and the power is 95%. Following (Cardenas and Arancibia (2016), the power should be higher than 80%, showing a correct validity (see Figure 2).
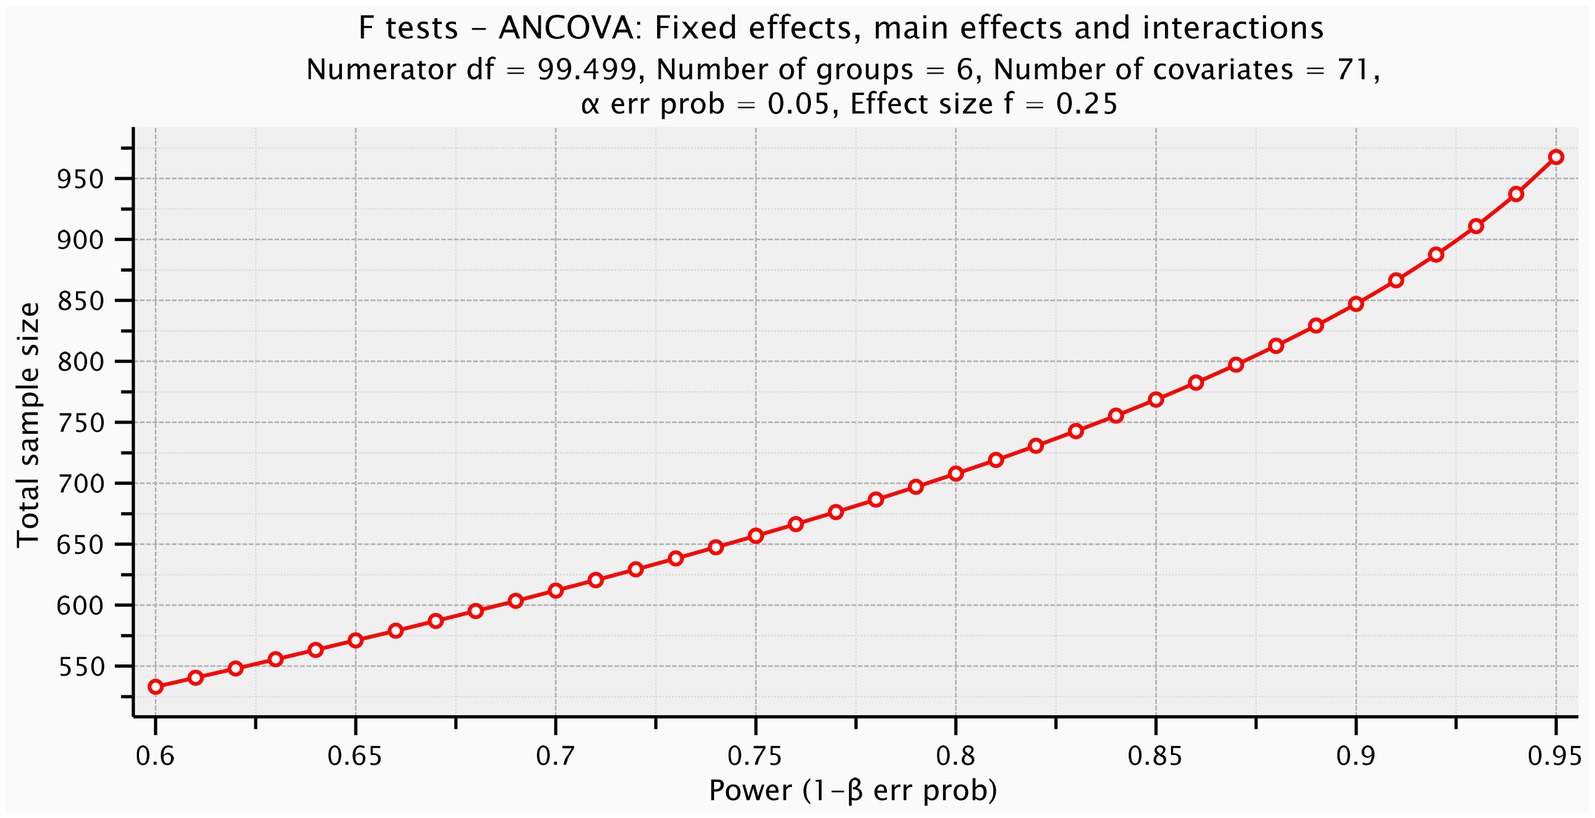
Figure 2. Sample and statistical power. Own source.
First of all, reliability was calculated based on the intercorrelation of items through Cronbach’s alpha (0.906), which according to George and Mallery (2003) can be considered excellent (see Table 1).
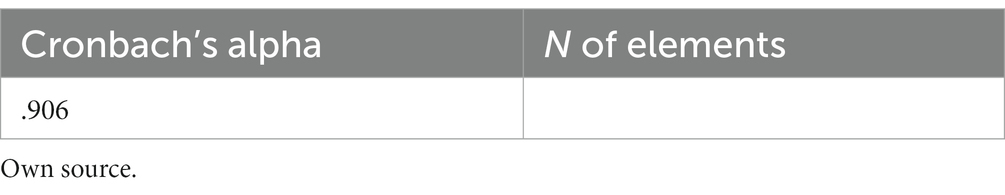
Table 1. Reliability statistics.
The calculation was carried out with the SPSS software, and the cut-off points taken into account are those established by George and Mallery (2003).
Next, we proceeded to investigate the content validity, which was carried out by fifteen PhD specialists (Malla and Zabala, 1978) authorized to perform this evaluation and belonging to different universities. Their competence coefficient was calculated to be k = 0.9, which shows a high level of competence (Mengual, 2011). After analyzing the validation questionnaires, some questions were readjusted, without affecting the substance of the question. On the other hand, a pilot test was carried out on a subgroup of the sample to review comprehension difficulties, identify questions that generated doubt, etc., the corresponding checklist was used (Iraossi, 2006). The results of the pilot test were satisfactory and the instrument was validated in its content.
The construct validity has been carried out through exploratory factor analysis, for which the correlation matrix has been studied using the Kaiser-Meyer-Olkin measure of sampling adequacy (KMO coefficient), in this case the value is 0.886, following Kaiser (1974) the value is very good, the result of Bartlett’s test of sphericity is 0.000 and the Determinant 4.009E−12, so we continue with the analysis of the structure of the correctives (see Table 2).

Table 2. KMO and bartlett test.
Next, the factors are extracted through the principal components method, thus determining the communalities with the highest and lowest values.
The items with the highest extraction value are:
B22: I have passed all my subjects during my college career (0.799).
C45: Communication between me and my family members is positive and open (0.779).
I feel accepted and valued by my peers (0.769).
I feel totally integrated into my group (0.764).
B24: I have passed my subjects within the regular A (0.722).
The items with the lowest extraction value are:
B25: If I find a subject difficult, I consult additional bibliography or seek advice to clear my doubts (0.394).
C47: I identify my parents as authority figures (0.408).
The total variance explained was calculated, obtaining 16 factors and a cumulative variance of 57.315%.
Finally, the model was determined by distributing the items according to the highest level of saturation by factors, obtaining a 30-item scale with a Cronbach’s alpha of 0.893, which is high.
- Dimension A: A1, A13, A14, A15, A16, A17.
- Dimension B: B18, B20, B2, B28, B3, B34.
- Dimension C: C42, C44, C45, C46, C48, C49, C50, C51, C52, C53, C54, C55, C56, C57, C60.
- Dimension D: D61.
- E-dimension: E6, E71.
4. Discussion
Given the relevance of the phenomenon generated by university dropout at the international level, both in terms of social development and economic issues, it is necessary to analyze the problem in order to detect the causes that lead to it and, in this way, have the option of making intervention proposals aimed at reducing university dropout rates (see Table 3).
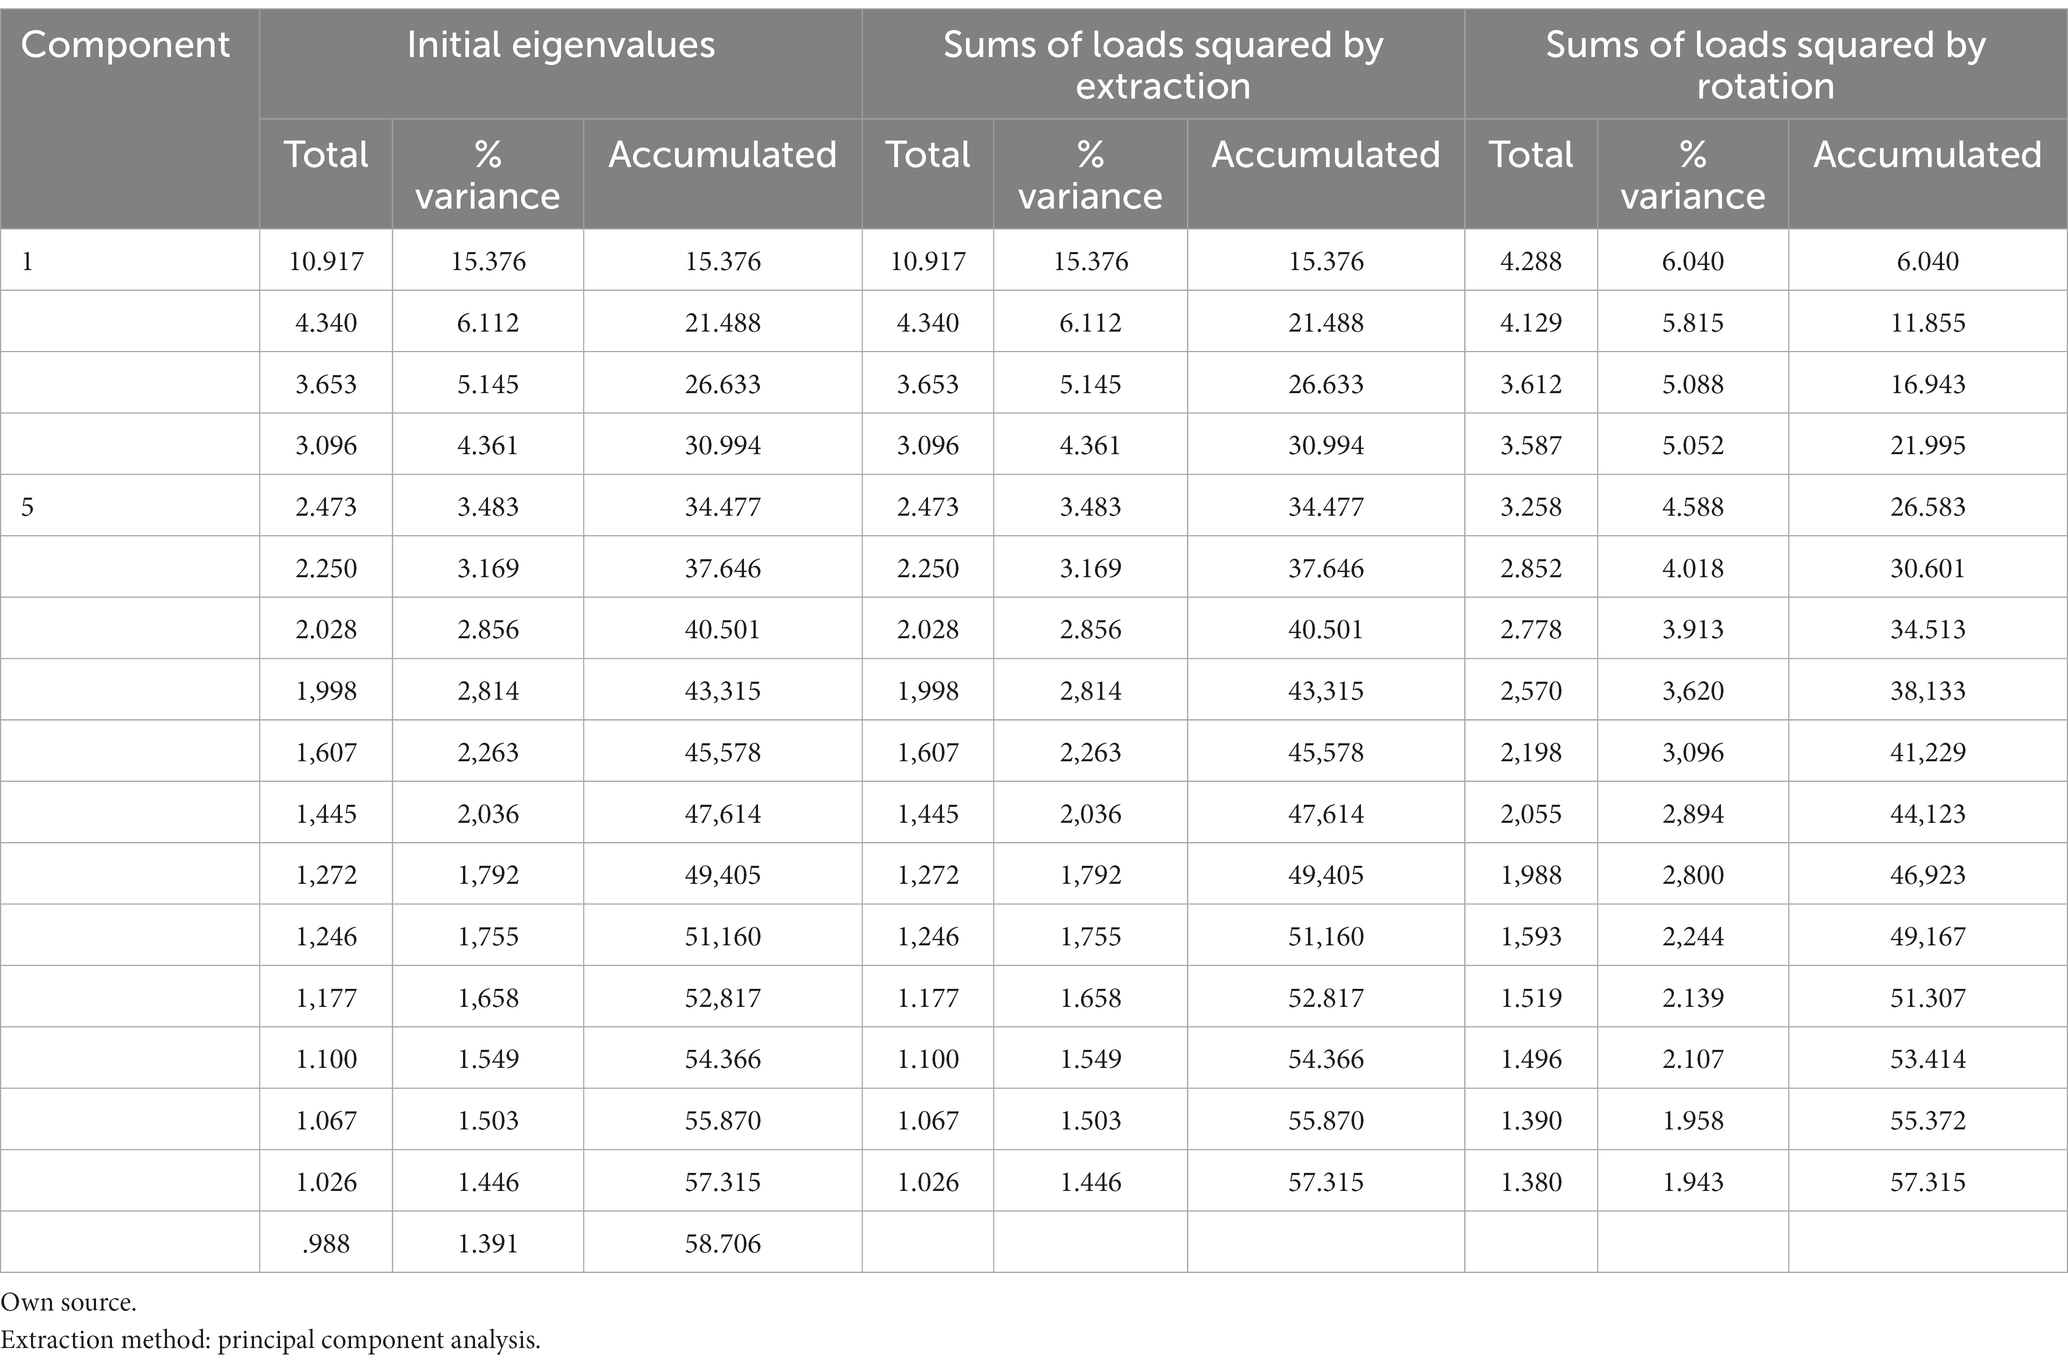
Table 3. Total variance explained.
One of the necessary steps in a study of these characteristics is the analysis of instruments that can shed light and make it possible to anticipate the occurrence of a university dropout situation. The instrument selected for this purpose has been analyzed psychometrically, offering positive results. Firstly, in relation to the sample that made up the study, it was adequate. The higher the number of participants, the greater the power, as indicated by Bono and Arnau (1995), who add that power is determined by the ability to commit a Type II error. The results of this study show that a statistical power of 95% has been obtained, which is very satisfactory in this sense.
Turning to the reliability of the scale, it should be noted that in its original version it already had a high reliability, but given the change of context, it was decided to analyze the construct. This allowed us to know the weight of the items, which puts us in a position to highlight the relevance of issues such as the trajectory in the university and in studies in general, the communication that exists between the members of the family, the acceptance by the rest of the peers and the feeling of integration in the group.
Knowing these data has made it possible to reduce the number of items that make up the instrument, while maintaining good reliability. Thus, we have gone from having an instrument composed of 71 items to a questionnaire with a total of 30 items. The reliability obtained with this new version of the scale translates into a Cronbach’s alpha of 0.893, which indicates that the level of reliability remains high.
With all the data provided, we can affirm that a new version of the Velázquez and González (2017) successful student permanence questionnaire has been obtained. This new version has good statistical power, is shorter, since the number of items has been reduced, and offers a good level of reliability, which allows us to affirm that it is an ideal instrument for trying to anticipate possible situations of dropping out of university studies. This instrument is an effective tool for researchers and people interested in obtaining information on the subject in a reliable way.
Data availability statement
The original contributions presented in the study are included in the article/Supplementary material, further inquiries can be directed to the corresponding author.
Ethics statement
The studies involving human participants were reviewed and approved by University of Granada. The patients/participants provided their written informed consent to participate in this study.
Author contributions
All authors listed have made a substantial, direct, and intellectual contribution to the work and approved it for publication.
Funding
This work was funded by research with reference B-SEJ-516-UGR18.
Acknowledgments
This work was comes from the research with reference B-SEJ-516-UGR18 approved in the call for projects I + D + i FEDER Andalucía 2014-20. This research has been approved by the Research Ethics Committee of the University of Granada with registration number 2778/CEIH/2022.
Conflict of interest
The authors declare that the research was conducted in the absence of any commercial or financial relationships that could be construed as a potential conflict of interest.
The handling editor CDBC declared a past collaboration with the author AF.
Publisher’s note
All claims expressed in this article are solely those of the authors and do not necessarily represent those of their affiliated organizations, or those of the publisher, the editors and the reviewers. Any product that may be evaluated in this article, or claim that may be made by its manufacturer, is not guaranteed or endorsed by the publisher.
References
Ávalos, I. (2022). Development and validation of a screening instrument for the assessment and diagnosis of minors at risk of social exclusion. Doctoral thesis. University of Granada. Spain
Cardenas, J. M., and Arancibia, H. (2016). Statistical power and effect size calculation in G*power: complements to statistical significance testing and its application in psychology. Health Soc. 5, 210–244. doi: 10.22199/S07187475.2014.0002.00006
Colás, P. (2015). University dropout. Revista Fuentes 16, 9–14. doi: 10.12795/revistafuentes.2015.i16
Cohen, J. (1992). Statistical power analysis. Curr. Dir. Psychol. Sci. 1, 98–101. doi: 10.1111/1467-8721
George, D., and Mallery, P. (2003). Using SPSS for windows step by step: A simple guide and reference (4th). Pearson Education. Noida
Iraossi, G. (2006). The power of survey design: A user's guide for managing surveys, interpreting results, and influencing respondents. The World Bank, Washington
Kaiser, H. F. (1974). An index of factorial simplicity. Psychometrika 39, 31–36. doi: 10.1007/BF02291575
Malla, F. G., and Zabala, (1978). Forecasting the future in the firm (III): the Delphi method. Estudios Empresariales 39, 13–24.
Mengual, S. (2011). The importance perceived by faculty and students on the inclusion of digital competence in higher education. An analysis in sciences of physical activity and sport at the University of Alicante. Doctoral thesis. University of Alicante. Spain
Rué, J. (2014). University dropout: variables, frameworks and quality policies REDU. Revista de Docencia Universitaria 12, 281–306.
Sánchez, C., Cortiñas, P., and Tejera, I. (2011). “Hypothesis testing: fisher and Neyman-Pearson trends” in History of probability and statistics (V). eds. J. M. Riobóo and I. Riobóo. Xunta de Galicia.
Keywords: psychometrics, questionnaire, dropout, dropout prediction, university
Citation: Hernández-Fernández A, Ávalos-Ruiz I and Pantoja-Vallejo A (2023) Psychometric properties of a dropout prediction tool for students in Andalusia. Front. Educ. 8:1121985. doi: 10.3389/feduc.2023.1121985
Edited by:
Claudia De Barros Camargo, Universidad Autónoma de Madrid, SpainReviewed by:
Juliette Lyons-Thomas, Educational Testing Service, United StatesDaniel Álvarez Ferrándiz, University of Granada, Spain
Georgios Kostopoulos, University of Patras, Greece
Copyright © 2023 Hernández-Fernández, Ávalos-Ruiz and Pantoja-Vallejo. This is an open-access article distributed under the terms of the Creative Commons Attribution License (CC BY). The use, distribution or reproduction in other forums is permitted, provided the original author(s) and the copyright owner(s) are credited and that the original publication in this journal is cited, in accordance with accepted academic practice. No use, distribution or reproduction is permitted which does not comply with these terms.
*Correspondence: Inmaculada Ávalos-Ruiz, inmaavalos@ugr.es
†These authors have contributed equally to this work and share first authorship