 Stephen Humphry
 Paul Montuoro
- Graduate School of Education, The University of Western Australia, Crawley, WA, Australia
A key feature of the polytomous Rasch model is that it entails a single classification process into one of a set of ordered response categories. The first aim of this article is to make explicit two processes in rubric designs that bring about such classifications, and identify implications of the distinction between them. The first process involves judgements of similarity, typified by judgements that a performance is similar to a category description. The second process involves judgements of difference. It is typified by judgements that a performance is better than a category description. In this article, each process is explicated using a hypothetical context in which assessors compare performances with exemplars. The second aim is to demonstrate that, for reporting purposes, judgements of similarity are recommended, particularly when results are interpreted by persons with limited knowledge of the Rasch model and its parameters. In judgements of similarity, category descriptions are located at the peak of each category probability curve, at the point of highest probability in each the category, with thresholds located between them. This is easier to interpret than judgements of difference, where category descriptions are located at the thresholds, and where the point of highest probability has no material reference. This is explicated using a simple real-world example. Implications for rubric design are discussed, as well as implications for related types of instruments, such as attitudinal measures and pairwise comparisons.
Introduction
Clarity on the distinction between judgements of similarity and judgements of difference is useful for two practical reasons. First, in measurement construction, such clarity fosters an explicit understanding of the intended meaning of assessment categories. Second, and as a result of this explicit understanding, categories can be written in a manner that calls attention to a similarities- or differences-based approach to assessment. This helps to ensure that assessors are cognizant of the judgements they are required to make. This is important because, in the polytomous Rasch model, each approach has a unique influence on parameter estimates and threshold locations. Ill-defined assessment categories that confound these approaches, and/or assessors who do not adopt a consistent approach to judgement, risk negatively impacting person parameter estimates and threshold locations. Individual person parameter estimates for equal performances may receive different parameter estimates and, more generally, threshold locations will shift in unintended ways, thus affecting the entire scale. In this article, we also illustrate the relative advantages of judgements of similarity. Briefly, in the interpretation of the polytomous Rasch model, judgements of similarity are simply easier to understand. This is because category descriptions are located at the peak of category probability curves (CPCs), rather than at the thresholds. Hence, in judgements of similarity, a clear distinction exists between the underlying meaning of the peak of each CPC, and the thresholds located between them.
Subsequent to derivations by Rasch (1961) and Andersen (1977), Andrich (1978b) detailed a formal relationship between integer scores and threshold parameters for polytomous items such that, “successive categories are scored with successive integers” (Andrich, 1978b, p. 569). This provided a theoretical foundation for the use of sequential integer scores in assessment contexts, which preserves the distinctive properties of the dichotomous Rasch model that underpin its theoretical congruence with measurement in the physical sciences (Rasch, 1961, 1977, 1980). The application of the Rach model for polytomous data also permits a stringent empirical test of the hypothesis that response categories reflect increasing levels of the latent trait, hence reflecting underlying order in regions of the latent continuum.
Andrich showed how this result is achieved by resolving the category coefficients and scoring function of Rasch’s (1961) model into thresholds and threshold discriminations. Andrich (1978b, 2005) expressed the model as follows:
where , τk is the kth threshold, τ0 ≡ 0, δi is the item location, βn, is the person location, and x = 0, …, m are the integer scores.
In the model of Eq. (1), Andrich (1978b, p. 569) stated that “the sufficient statistic is simply the number of thresholds, with respect to all items, that the subject has passed” (see also Andersen, 1977). Andrich showed how to preserve, and extend the domain of application of, this property of the model by adopting a theoretical approach to the problem of resolving and interpreting relevant terms of Rasch’s (1961) model. Thresholds partitioning a continuum into regions are ordered with respect to the magnitude of a latent trait. Such ordering is implied by the definition of integer scores given the nature of the model, and is therefore necessary to the justification for assigning successive integer scores to categories. In this article, Eq. (1) is referred to as the polytomous Rasch model.
Partitioning the continuum and the classification process
In using an instrument with ordered categories there is a single classification into one of the possible categories. And in applying the polytomous Rasch model, each threshold divides the continuum into two adjacent regions, below and above the threshold location. Before proceeding, this feature is further explicated by considering an analysis in which Michell (1997) specified five conditions that must hold in order for an attribute to constitute a continuous quantity. In specifying the fifth of these conditions, pertaining specifically to continuity, Michell (1997, p. 357) noted the following:
Given any two sets of magnitudes, an “upper” set and a “lower” set, such that each magnitude belongs to either set but none to both and each magnitude in the upper set is greater than any in the lower, there must exist a magnitude no greater than any in the upper set and no less than any in the lower.
In the polytomous Rasch model, each threshold in an item is hypothesized to represent a magnitude that lies between such an upper and lower set of magnitudes, such that if each of the regions were extended to include the threshold location, that threshold location would constitute the intersection of the regions.
Let A, B, and C represent three such regions or sets of magnitudes, such that each magnitude within region C is greater than each magnitude within region B, and in turn each magnitude within region B is greater than each magnitude within region A. Further, let τ1 be the measure, in terms of a particular unit and origin, of a magnitude which is greater than all magnitudes in A and less than all magnitudes in B, and let τ2 be the measure, in terms of the same unit and origin, of a magnitude which is greater than all magnitudes in B and less than all magnitudes in C. According to the preceding definitions and stipulations, it necessarily follows that τ1 > τ2. Such partitioning is illustrated in terms of a linear continuum in Figure 1.
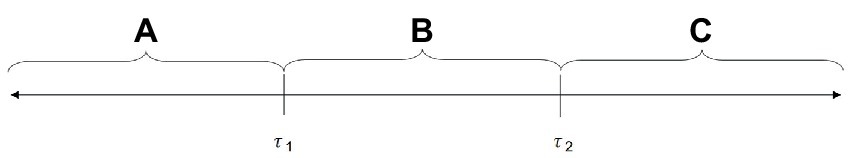
Figure 1. Two thresholds which partition a continuum into three regions.
Processes of classification for ordered response categories
Having outlined this conceptual background, the focus now turns to the two distinct types of assessment processes (i.e., judgements of similarity versus judgements of difference) as they relate to parameter estimates in the polytomous Rasch model. A hypothetical pairwise comparison example is used in this article to make explicit the distinction between these processes. And later, consideration is given more broadly to issues encountered in the use of response formats in other assessment contexts, including rubrics and Likert-type scales.
The pairwise comparison scale referred to in this article is based on Thurstone’s (1927, 1959) law of comparative judgement, which was a predecessor to the dichotomous Rasch model (Andrich, 1978a). Replacing Thurstone’s use of the cumulative normal distribution with the numerically equivalent logistic function gives the Bradley-Terry-Luce (BTL) model (Bradley and Terry, 1952; Luce, 1959). The BTL model has been used to develop a two-stage method of assessment involving calibrated exemplars (see Heldsinger and Humphry, 2010, 2013; Humphry and Heldsinger, 2014). In the first stage, the pairwise comparison of exemplars and then the BTL model are used to construct an interval-level scale. In the second stage, the resulting scale and associated calibrated exemplars are used as a reference from which to judge the magnitude of the objects of measurement.
Two forms of the relevant assessment approaches are described below. In both hypothetical cases, a set of performance exemplars is presented to assessors, and exemplars are used as a basis for assessing student performances. In the first approach, the assessors are asked which, in a series of exemplars, the performance is most similar to in level of performance (i.e., judgements of similarity). In the second process, assessors are asked how many exemplars in the series of exemplars the object of measurement exceeds in level of performance. As can be seen, the second process involves making judgements about whether the object differs from one or more exemplars.
In the hypothetical example used here, assessors judge writing scripts. Figure 2 shows a screenshot of an interactive pairwise comparison design. In it assessors scroll through the vertical scale and click the associated “thumbnails” to inspect each exemplar more closely. The object of measurement is depicted to the right. Depending on the approach used, assessors either select the exemplar that is most similar to the performance being measured (i.e., judgements of similarity), or the position on the scale in which the object of measurement is greater in magnitude than all preceding exemplars, and less than all proceeding exemplars (i.e., judgements difference).
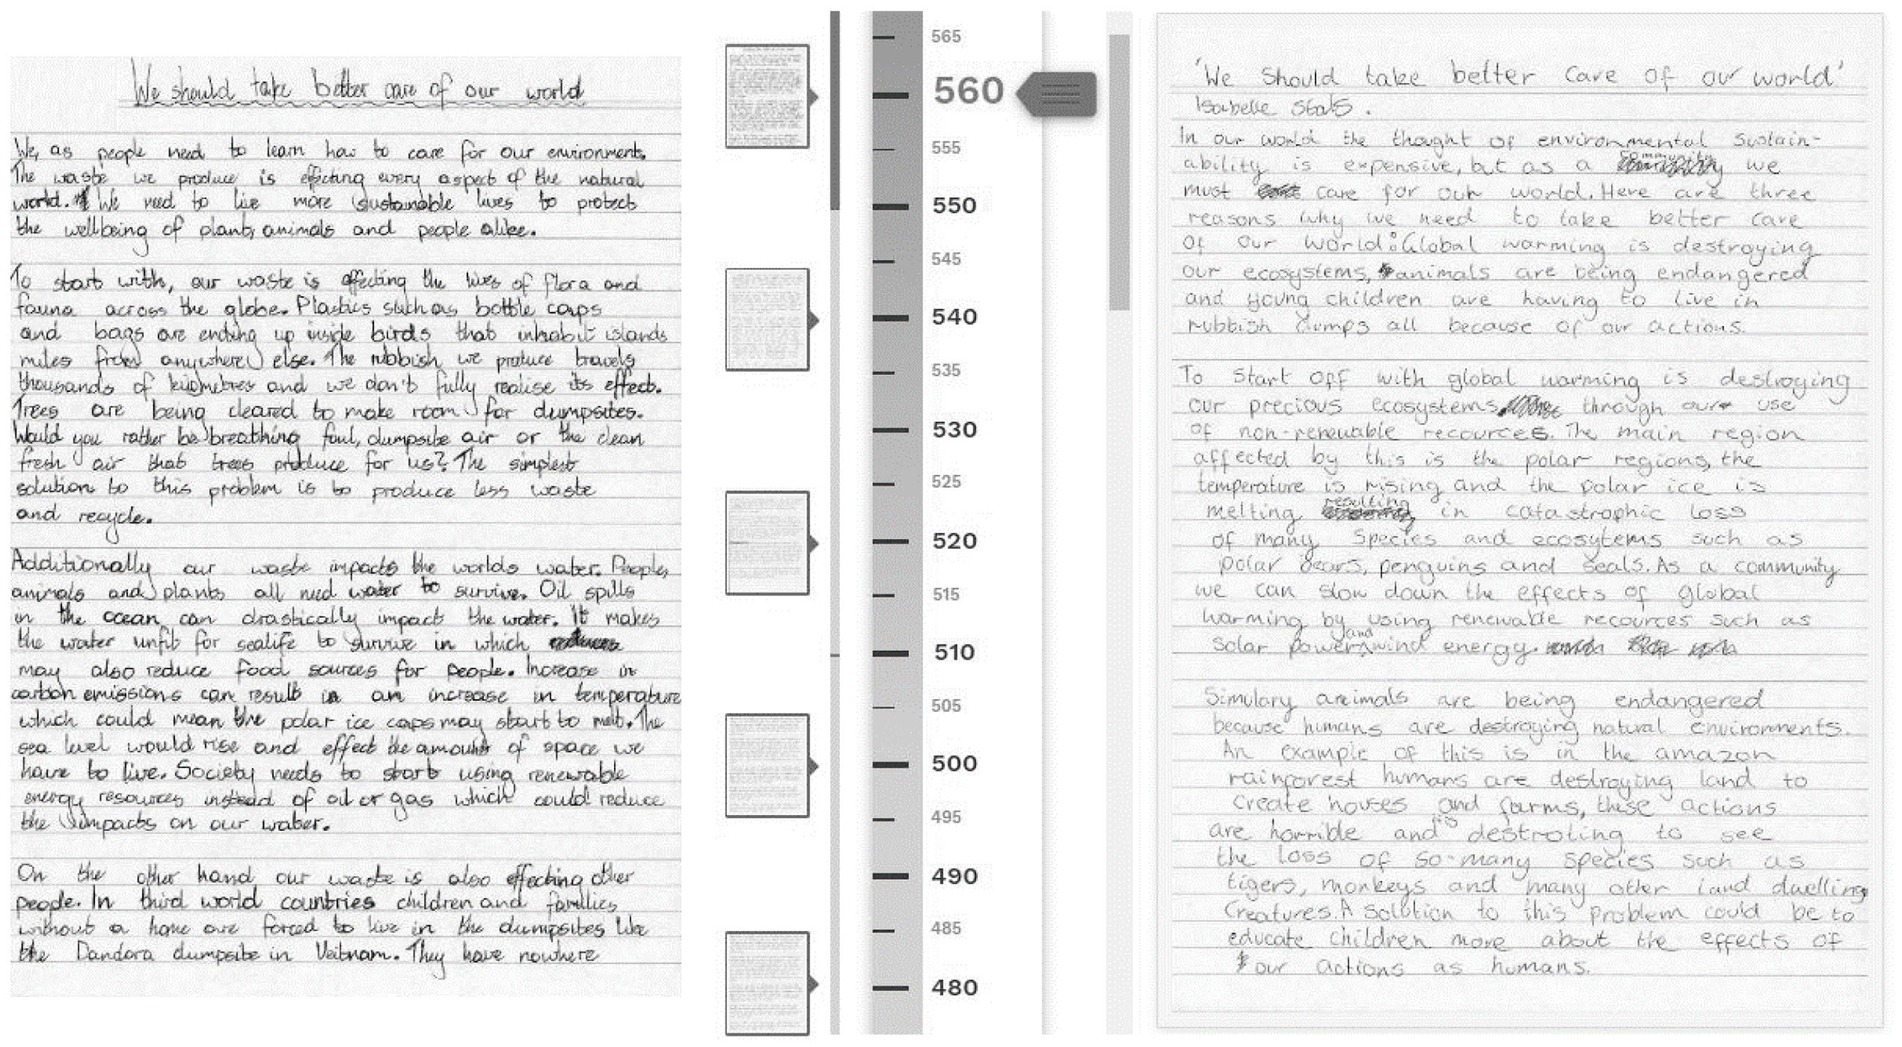
Figure 2. Ordered exemplars and a target performance.
In this hypothetical example, each judge within each criterion is conceived of as an item i in Eq. (1). As such, the raw scores can be analyzed using the polytomous Rasch model. Accordingly, each exemplar is referred to as a category of each item. The two approaches to assessment described in this article elicit judgements indicative of the perceived magnitude of the object of measurement. However, in each approach the specific conceptualization of how to record the perceived magnitude of an object of measurement has a distinct influence on the threshold locations of the model in Eq. (1).
Classification effects on the polytomous Rasch model
The purpose of the hypothetical example used in this article is to illustrate the relationship between perceived magnitudes and the location of exemplars and thresholds in the polytomous Rasch model. A specific logical connection is implied, but the extent to which the relationship holds depends on the empirical data in each context. Irrespective of the results in a given context, the distinction between the two assessment approaches has consequences for the way in which assessors judge the magnitude of objects of measurement, and, in turn, the way in which parameter estimates are interpreted when data conform to the model.
In the polytomous Rasch model, the CPC commonly depicts a single polytomous item. However, the CPC in Figure 3 depicts the predicted probability of a given score for a judge assessing a performance against exemplars. In this hypothetical CPC depicting judgements of similarity, there are four writing script exemplars that the judge referenced in the pairwise comparisons. Judging similarities involves classifying performances into categories based on perceived similarity with exemplars, which are, in turn, located at the peak of CPCs, between adjacent thresholds. Stated differently, in this approach, thresholds lie between the location of example performances on the continuum. For example, for a score of 2, the exemplar lies at the peak of the third CPC located at approximately 1.1 logits, between the adjacent thresholds. As such, a judge is most likely to give a score of 2 if the performance is judged as most similar to the third exemplar on the scale.
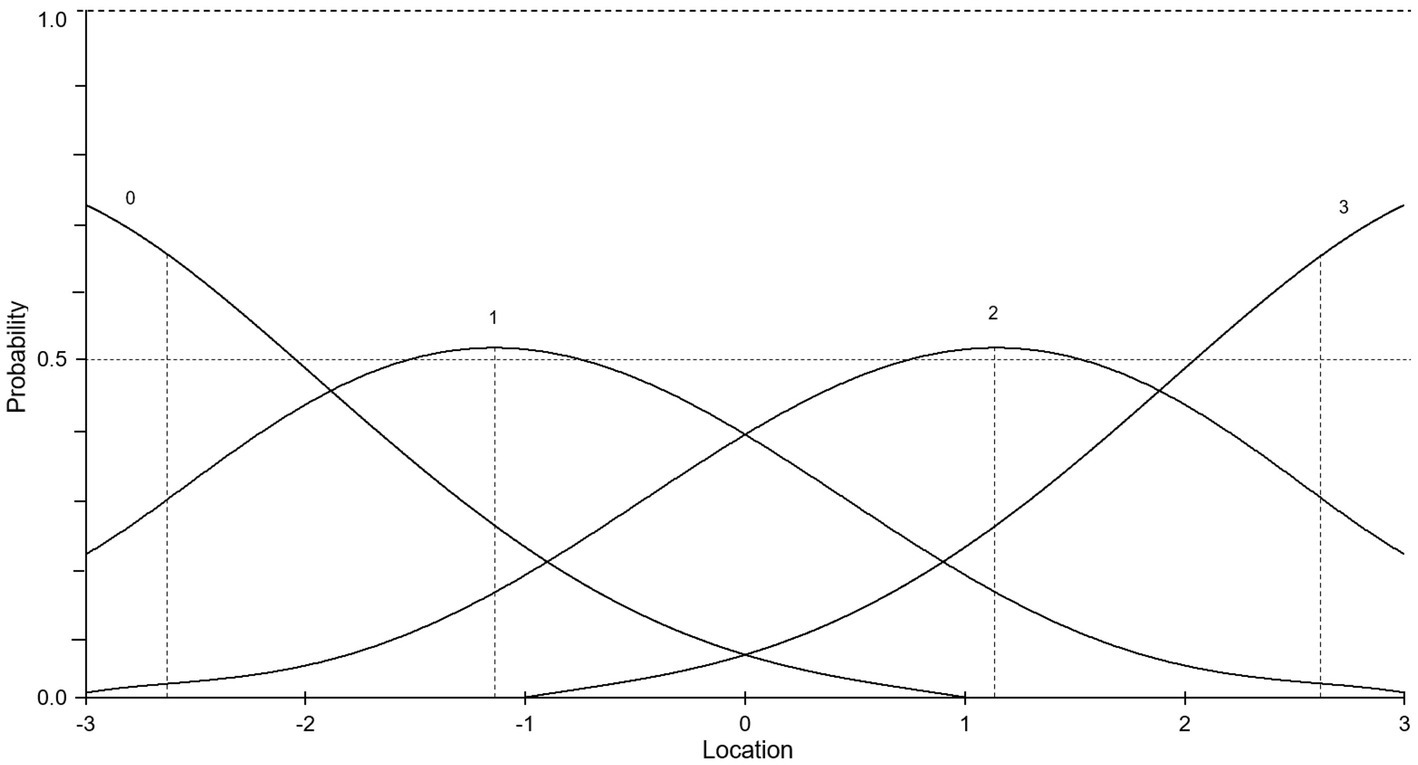
Figure 3. Category probability curve for judgements of similarity.
In Figure 4, the hypothetical CPC depicts the probabilities of awarding scores based on judgements of difference, and specifically, whether a performance is judged as better than one or more exemplars. In the current hypothetical example, if an assessor judges a performance as better than the first and second exemplars, but worse than the third, he or she will award the performance a score of 2. In judgements of this kind, exemplars are not located at the peak of the CPCs, but instead at the thresholds. Here the continuum is partitioned into regions by exemplars/thresholds, and score category regions are located between them. As such, and unlike in judgements of similarity, the peak of each CPC is not linked to a tangible exemplar. Instead, the peak of each CPC represents a far more abstract location between exemplars/thresholds. For example, in Figure 4, the second exemplar is located at the second threshold at 0 logits. And somewhat confusingly, the point of highest probability for a score of 2 is lies between second and third exemplars/thresholds.
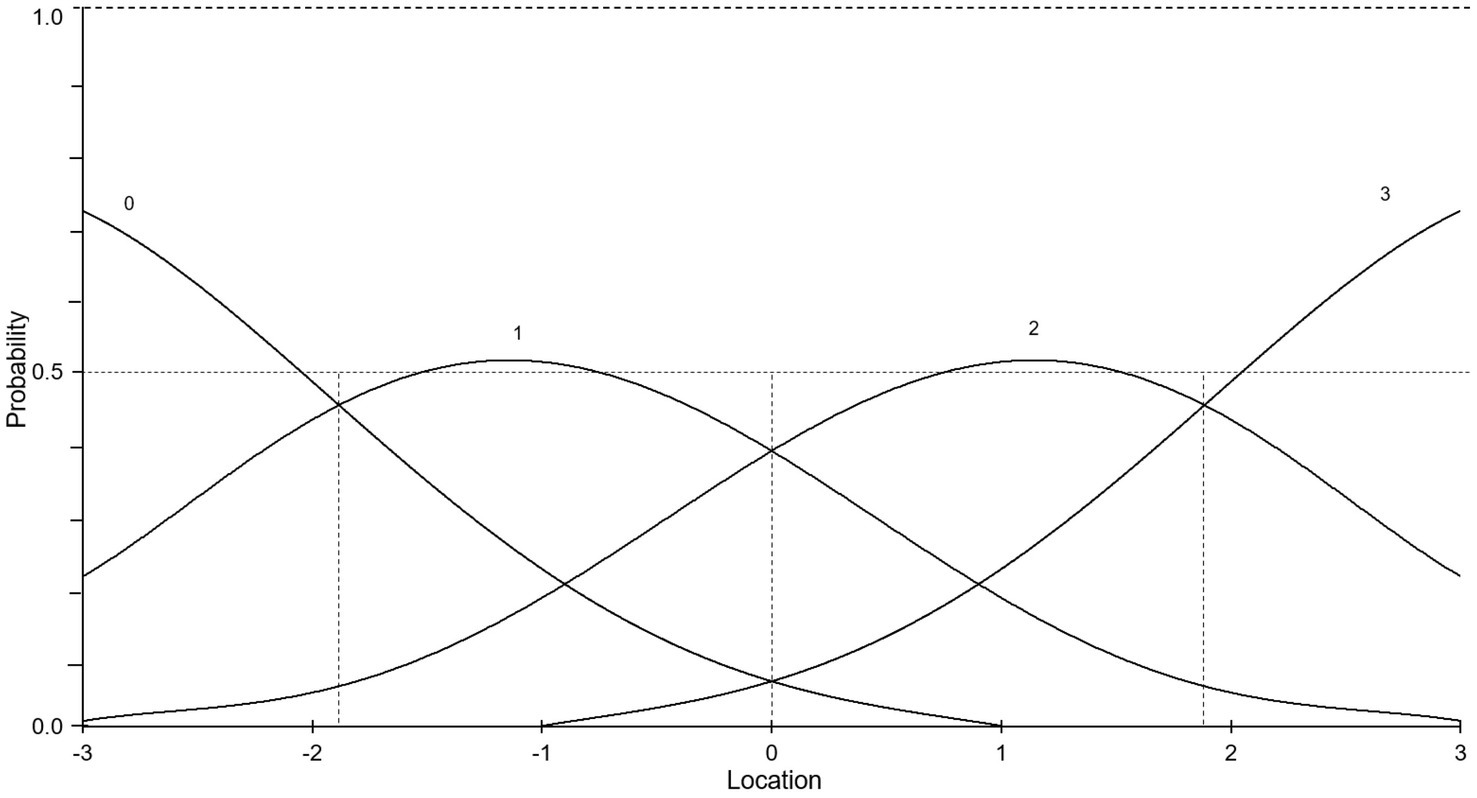
Figure 4. Category probability curve for judgements of difference.
The specific impact that judgements of similarity and difference have on the location of exemplars in the CPCs is important when it comes to results analysis. In judgements of similarity, each exemplar is located at the peak of a probability curve. As such, the peak of each probability curve has a consistent and tangible meaning as the location of a raw score with a corresponding exemplar that can be directly referenced. In this approach, the thresholds located between exemplars represent the singular notion of the intersection on the latent scale between one exemplar, or raw score, and the next. In judgements of difference, however, the results are less intuitive. Consistent with judgements of similarity, the peak of each probability curve refers to a raw score. However, thresholds are precisely at the location of exemplars. Practically, this means that the peak of each probability curve refers to, “the location of a raw score, positioned between two exemplars, which themselves lie at thresholds on the latent scale”.
The advantages of judgements of similarity can also be demonstrated in the Wright Map. Figure 5 depicts a Wright Map adapted for judgements of similarity. The uncentralized thresholds are depicted as normal, but the locations of exemplars, or raw scores, are also depicted. As can be seen, when the Wright Map is used in this way for judgements of similarity, the location of exemplars and thresholds on the latent scale is simple and intuitive; exemplars have a tangible reference and represent a raw score, thresholds lie between them. In the Wright Map in particular, this isolation of concepts simplifies the interpretation of results. That is, exemplars refer to a singular idea, which can be directly compared to person abilities on the latent scale. The same holds for thresholds, which refer to a different and distinct idea. This isolation of phenomena means that more information is reported in the Wright Map (i.e., exemplars and thresholds). As such, in Figure 5, instead of reporting only item-related information in one general area, as occurs in a typical Wright Map, we have divided exemplars and thresholds by criteria. As can be seen, this means that exemplars and thresholds can be readily compared between criteria, and that exemplars or thresholds, within or across criteria, can be readily compared to person locations.
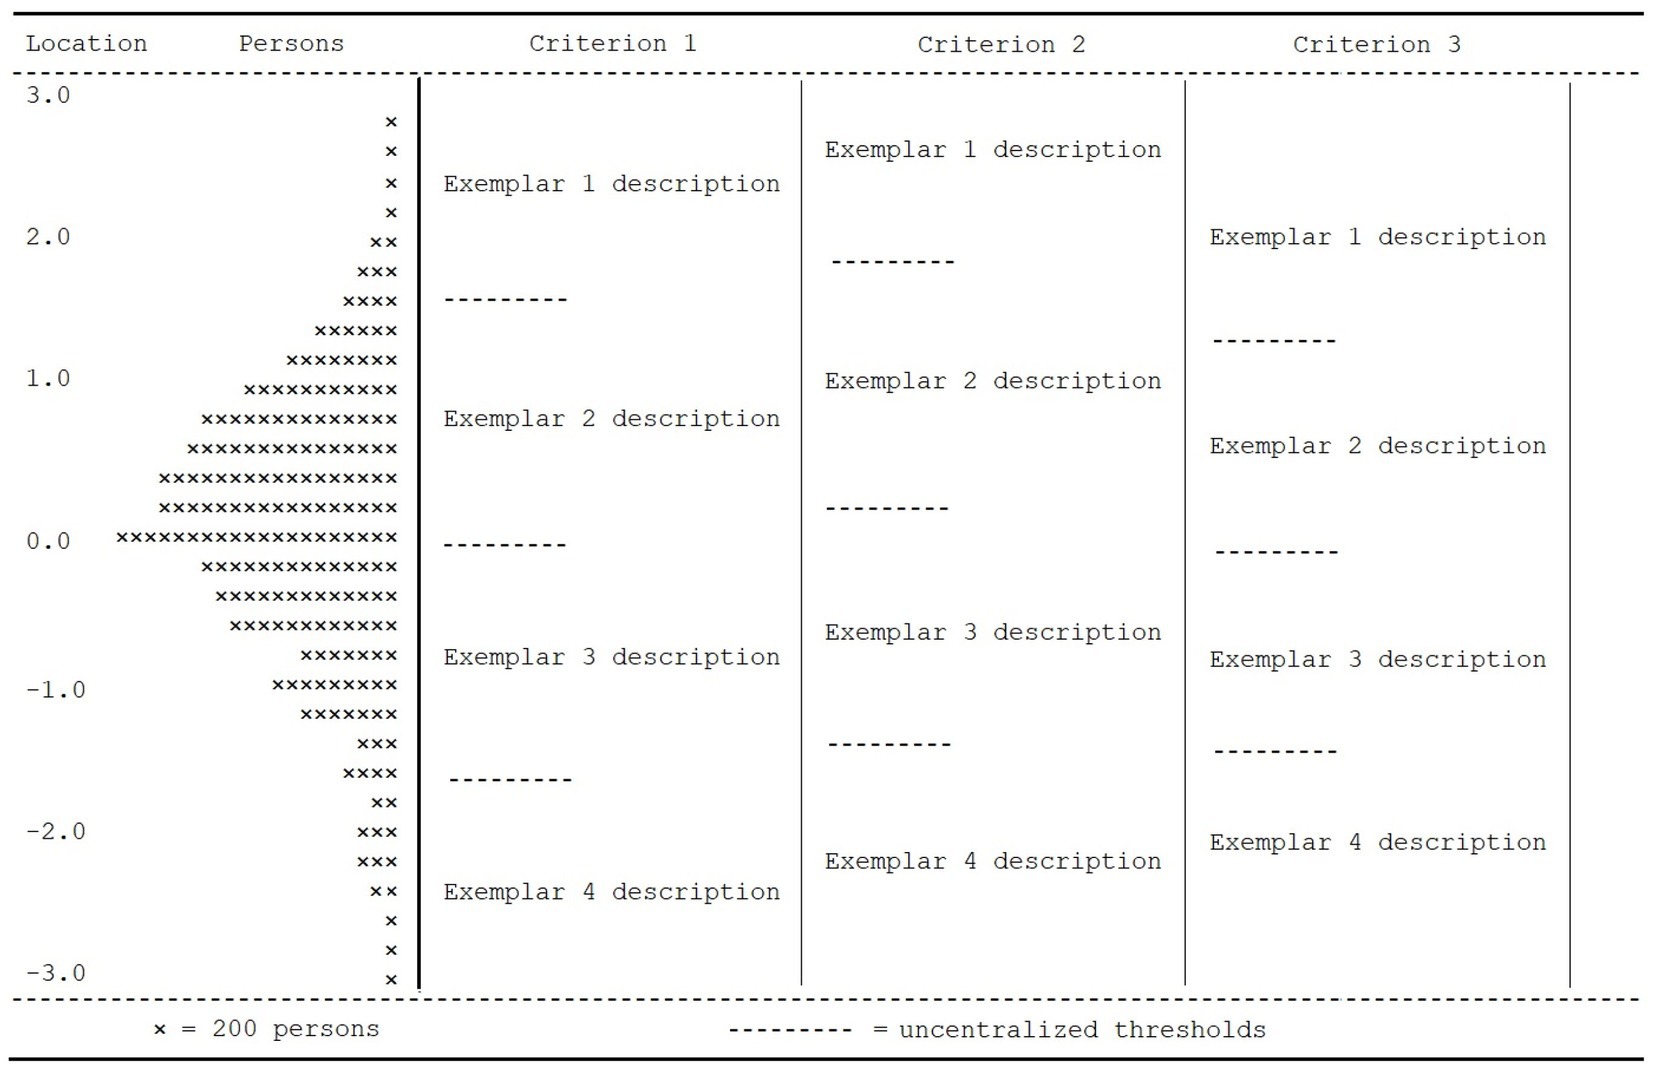
Figure 5. Judgements of similarity Wright Map with exemplar locations.
In articulating and illustrating the distinction between judgements of similarity and difference, it is useful to observe that the two approaches are always related. Judging similarity or difference is a matter of the primary bases for the decision to choose a particular score category. However, in judging whether the level of a performance is similar to an exemplar, an assessor is implicitly judging the level of that performance to differ from exemplars higher and lower on the scale. Similarly, in judging whether the level of a performance is better than other performances, an assessor may have judged that the performance is similar to an exemplar, but is nevertheless forced to choose whether it is better or worse.
Substantive considerations in classification
This article describes the contrast between judgements of similarity and judgements of difference as general concepts and as these concepts relate to the polytomous Rasch model. In a judgement of similarity, when the perceived level of quality of the assessed performance is the same as an exemplar, it is given the score associated with that exemplar. In principle, an assessed performance is most likely to be given the score corresponding to an exemplar when it is most like the exemplar (i.e., when the performance is located in the middle of the score category), between two adjacent thresholds on the continuum. In judgements of difference, when the performance is perceived to be superior to one exemplar, but inferior to the next higher exemplar, the assessed performance is given the score at the threshold, on the continuum between the two categories.
Practical assessment challenges arise in both approaches. For example, in judgements of similarity, when a performance is perceived to lie between exemplars, the assessor can only judge the performance to be more similar to one of the exemplars. If the assessed performance is not similar to either exemplar, the assessor is forced to choose which exemplar the performance is most like. This is a challenge for an assessor when judging similarities. On the other hand, in judgements of difference, if an assessor perceives a performance to be the same as one of the exemplars, the assessor is forced to make a choice between giving the assessed performance the score for the category below the exemplar or the score for the category above it. Simple paired comparisons of one performance against another performance are also judgements of difference that involve this kind of “forced choice.” Practically, these challenges represent “different sides of the same coin,” and may be mitigated by adopting a consistent approach to judgements across categories, reducing the potential for confusion amongst assessors.
Category construction
Clarity on the distinction between judgements of similarity and difference is useful when writing rubric categories. It fosters uniformity in wording, either emphasizing judgements of similarity or difference. This clarity, in turn, helps to ensure that assessors are cognizant of the required judging approach. In the hypothetical case used in this article to illustrate the distinction between the two approaches, it is clear that judgements need to be based exclusively on either one or the other approach. When assessors confound these approaches, either between performances or assessors, it negatively impacts threshold locations and has an unintended impact on parameter estimates.
Distortion can occur in other ways. Suppose that a category requires assessors to judge writing scripts based on similarity using a generalized measure of performance, but also to consider if the performance contains more or less grammatical errors than exemplars. This approach is not ideal because it combines judgements of similarity and difference, and the combination introduces counterproductive complexity for assessors. After addressing the first part of the instruction, if an assessor judges that there are less grammatical errors, it implies that the performance is better than an exemplar; if the assessor judges that there are more grammatical errors, it implies that the performance is inferior to the exemplar. In this circumstance, the category should be divided into two distinct categories, or the instruction should require judgements of similarity for grammatical errors. Therefore, the instruction would require assessors to decide: (i) which exemplar each target performance is most like; and (ii) which exemplar most closely matches the degree of grammatical error observed in each target performance.
Assessment rubrics
Assessment rubrics occasionally include performance exemplars. These exemplars may represent total scores across criteria, but in examples such as the NAPLAN writing assessment (e.g., Australian Curriculum, Assessment, and Reporting Authority, 2016a), each raw score in each criterion is accompanied by at least one exemplar. That is, there are performance exemplars for each raw score in each criterion, such as “audience,” “text structure,” “character and setting,” “vocabulary,” etc. The inclusion of exemplars in rubric designs is useful for explaining the relevance of the distinction between judgements of similarity and judgements of difference. From the preceding analysis, it ought to be clear that an exemplar of a raw score implies judgements of similarity, in the sense that the intention is that an assessor award a score of, say, 2 when the performance assessed is judged similar to the exemplar representing a score of 2. However, this similarities-based approach should always be made clear to assessors.
Often, however, assessment rubrics only contain descriptions of exemplary performances. That is, each score category describes features or qualities of a performance. In such cases, assessors typically judge whether the performance matches the description in a category. This is a similarity judgement, in that assessors judge if a performance contains features or qualities that match those described in a category. More specifically, assessors typically judge which category description the performance is most similar to. Given this, specific descriptions are preferable. The description, “use of grammar is poor,” is less specific than, “grammar contains errors such as lack of punctuation.” In the latter, the subtle inclusion of a written example illustrates what is meant by an otherwise abstract description. Once again, however, assessors should be explicitly informed whether they are required to base judgements on similarity or difference.
Descriptions containing gradations are also problematic. Consider the description, “mostly correct use of punctuation.” Different assessors could interpret the word “mostly” in different ways, and the interpretation of such a description depends on the complexity of sentences. Descriptions may also lead to ambiguity about the aim of a judgement. For example, consider the description, “seldom uses punctuation incorrectly.” This description implies that a performance is different to one that uses punctuation, albeit incorrectly. As such, in general, if categories are designed to describe performances in judgements of similarity, it is preferable to describe features or qualities of performances with as much specificity as possible. Exemplars illustrate what those qualities look like in a real performance, and hence leave less room for confusion and subjective interpretation.
The NAPLAN writing assessment is a useful real-world example of a similarities-based assessment. It includes 10 criteria, each comprising a range of score categories. Assessors reference a rubric guide that includes exemplars for each category (e.g., Australian Curriculum, Assessment, and Reporting Authority, 2016b). No reference is made to using a similarities-based approach. However, a similarities-based approach is strongly implied in the wording of each category description, and via the inclusion of exemplars. For example, in the “audience” criterion, the category description for a raw score of 1 simply states, “contains simple written content” (p. 6). This wording is specific and unambiguous. It indicates that, in order to receive a raw score of 1, the target script should be as described, and as shown in the exemplar. Nevertheless, it would be ideal if assessors were also instructed, both in the rubric instructional text and at the top of each page of the rubric guide, to simply “Judge similarity with rubric categories and exemplars.”
Figure 6 shows the category and threshold locations in the audience and vocabulary criteria. Threshold locations were placed on a common scale by summing the delta-centered and category thresholds (see Australian Curriculum, Assessment, and Reporting Authority, 2016a, pp. C19-C20). As shown in Figure 6, given that the marking guide implies a similarities-based approach, the categories are placed between the threshold locations. These results show a clear difference between categories and thresholds. This is in stark contrast to a differences-based approach, in which categories are located at the thresholds, and where the peak of each CPC holds no substantive meaning.
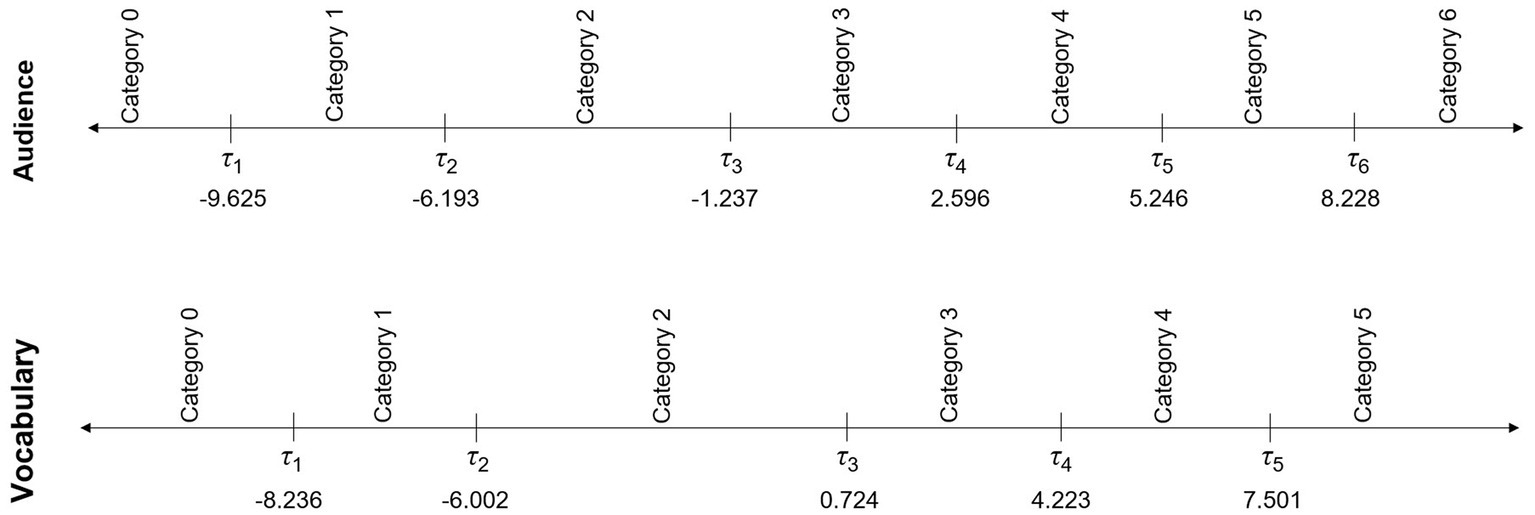
Figure 6. NAPLAN (2016) writing: Category and threshold locations for audience and vocabulary.
Likert-type and rating scales
Likert-type and rating scales typically include statements that describe a self-reported attitude or position toward something. By indicating level of agreement, a respondent communicates how similar the statement is to their own attitude or position, so that these instruments are often implicitly based on judgements of similarity. For example, agreement indicates a position similar to the one described in the statement, and strong agreement indicates a position very similar to it. However, there is also some ambiguity in these kinds of scales, particularly regarding “disagree” and “strongly disagree.” As is well known, respondents may “disagree” because they feel even more positively or negatively disposed towards an attitude or position. For example, a person who is motivated to learn at school may agree with the statement, “I am motivated to learn at school.” However, a person who is highly motivated to learn, may disagree because the statement understates or trivializes their position.
An alternative to Likert-type and rating scales for self-reports is the two-stage approach described by Thurstone (1928). Here pairwise comparisons are used to scale statements from least to most positive on an issue. Thereafter respondents endorse statements that are similar to their attitude or position. This procedure is directly analogous to the presentation of multiple performance exemplars in a rubric used by assessors in writing assessments. Written descriptions replace exemplars and a respondent’s attitude or position replaces the target performance judged by assessors. Compared to Likert-type and rating scales, in Thurstone’s two-stage approach, by selecting a particular statement on the scale, a respondent more directly indicates their attitude or position. For example, suppose a respondent endorses the statement, “I oppose capital punishment.” Suppose also that this statement lies between two other statements: “I vehemently oppose capital punishment” and “On balance, I do not favor capital punishment.” Instead of responding to the first statement on a Likert-type scale between “strongly disagree” and “strongly agree,” selecting of one of the three rank-ordered statements reduces ambiguity by presenting statements that describe specific different positions or attitudes.
Conclusion
One important aspect of judgement-based assessments is that assessors are cognizant of whether they are required to make judgements of similarity or judgements of difference. This article demonstrates that the construction of assessment categories, and the subsequent instructions given to assessors, may have an impact on judgement approaches, including whether assessors adopt a consistent judgement approach. Differences between judgements of similarity and difference are deceptively subtle, but each approach has a distinct impact on parameter estimates and thresholds in the polytomous Rasch model. This article used the CPC as a simple visual reference to demonstrate that, in judgements of similarity, exemplars are located at the peak of the probability curve on the latent scale (i.e., the center of the score category regions), and the thresholds are located between them. In judgements of difference, exemplars are located at the thresholds, and score category regions between them. This is because in judgements of difference the raw score signifies that the target object shows more or less of the latent trait than a specific exemplar on the scale. This fundamental difference means that when the two approaches are confounded, person estimates are mixed in unintended ways, leading to inaccurate parameter estimates and unfair results for some students.
This article also demonstrates that judgements of similarity produce results that are easier to interpret, particularly for inexperienced analysts who are unfamiliar with CPCs, and the difference between the peak of the probability curve and category thresholds. As stated above, judgements of similarity lead to the division of exemplars and thresholds on the latent scale. On the other hand, judgements of difference lead to exemplars and thresholds sharing locations of the latent scale. As such, this latter approach leads to comparatively confusing results. Exemplars and raw scores are intuitively related phenomena; it is natural to associate raw scores with exemplars. As such, it is counterintuitive when these phenomena are separated on the latent scale. Equally, exemplars and category thresholds are intuitively opposing phenomena; exemplars and category thresholds naturally conjure opposing ideas in the mind. In this article, we illustrated this relative advantage of judgements of similarity using an adapted Wright Map. In it, both exemplars and thresholds are reported in their respective positions. As such, each phenomena can be considered in turn, and also compared to person estimates as distinct and separate concepts.
Data availability statement
The original contributions presented in the study are included in the article/supplementary material, further inquiries can be directed to the corresponding author.
Author contributions
All authors listed have made a substantial, direct, and intellectual contribution to the work and approved it for publication.
Conflict of interest
The authors declare that the research was conducted in the absence of any commercial or financial relationships that could be construed as a potential conflict of interest.
Publisher’s note
All claims expressed in this article are solely those of the authors and do not necessarily represent those of their affiliated organizations, or those of the publisher, the editors and the reviewers. Any product that may be evaluated in this article, or claim that may be made by its manufacturer, is not guaranteed or endorsed by the publisher.
References
Andersen, E. B. (1977). Sufficient statistics and latent trait models. Psychometrika 42, 69–81. doi: 10.1007/BF02293746
Andrich, D. (1978a). Relationships between the Thurstone and Rasch approaches to item scaling. Appl. Psychol. Meas. 2, 451–462. doi: 10.1177/014662167800200319
Andrich, D. (1978b). A rating formulation for ordered response categories. Psychometrika 43, 561–573. doi: 10.1007/BF02293814
Andrich, D. (2005). “The Rasch model explained” in Applied Rasch Measurement: A Book of Exemplars (chapter 3). eds. S. Alagumalai, D. D. Durtis, and N. Hungi (Netherlands: Springer), 27–59.
Australian Curriculum, Assessment, and Reporting Authority (2016a). National Assessment Program – Literacy and numeracy (NAPLAN) 2016: Technical Report, ACARA, Sydney.
Australian Curriculum, Assessment, and Reporting Authority (2016b). National Assessment Program – Literacy and numeracy (NAPLAN) 2016: Writing Marking Guide, ACARA, Sydney.
Bradley, R. A., and Terry, M. E. (1952). Rank analysis of incomplete block designs, I. The method of paired comparisons. Biometrika 39, 324–345. doi: 10.1093/biomet/39.3-4.324
Heldsinger, S. A., and Humphry, S. M. (2010). Using the method of pairwise comparison to obtain reliable teacher assessments. Aust. Educ. Res. 37, 1–19. doi: 10.1007/BF03216919
Heldsinger, S. A., and Humphry, S. M. (2013). Using calibrated exemplars in the teacher-assessment of writing: An empirical study. Educ. Res. 55, 219–235. doi: 10.1080/00131881.2013.825159
Humphry, S. M., and Heldsinger, S. A. (2014). Common structural design features of rubrics may represent a threat to validity. Educ. Res. 43, 253–263. doi: 10.3102/0013189X14542154
Michell, J. (1997). Quantitative science and the definition of measurement in psychology. Br. J. Psychol. 88, 355–383. doi: 10.1111/j.2044-8295.1997.tb02641.x
Rasch, G. (1980). “Probabilistic Models for Some Intelligence and Attainment Tests” in Fore- and Afterword; Expended. ed. B. D. Wright (Chicago, IL: University of Chicago Press) (Original work published 1960)
Rasch, G. (1961). “On general laws and the meaning of measurement in psychology” in Proceedings of the Fourth Berkeley Symposium on Mathematical Statistics and Probability. ed. J. Neyman, vol. 4 (Berkeley, CA: University of California Press), 321–334.
Rasch, G. (1977). “On specific objectivity: An attempt at formalizing the request for generality and validity of scientific statements” in Danish Yearbook of Philosophy. ed. M. Blegvad, vol. 14 (Copenhagen: Munksgaard), 58–94.
Thurstone, L. L. (1927). A law of comparative judgement. Psychol. Rev. 34, 273–286. doi: 10.1037/h0070288
Keywords: measurement theory, psychometrics, polytomous Rasch model, ordered response categories, pairwise comparisons, category probability, threshold locations
Citation: Humphry S and Montuoro P (2023) Judging similarity versus judging difference. Front. Educ. 8:1117410. doi: 10.3389/feduc.2023.1117410
Edited by:
Xinya Liang, University of Arkansas, United StatesReviewed by:
Wahyu Widhiarso, Gadjah Mada University, IndonesiaTrevor Bond, James Cook University, Australia
Copyright © 2023 Humphry and Montuoro. This is an open-access article distributed under the terms of the Creative Commons Attribution License (CC BY). The use, distribution or reproduction in other forums is permitted, provided the original author(s) and the copyright owner(s) are credited and that the original publication in this journal is cited, in accordance with accepted academic practice. No use, distribution or reproduction is permitted which does not comply with these terms.
*Correspondence: Paul Montuoro, cGF1bC5tb250dW9yb0B1d2EuZWR1LmF1
†These authors share first authorship