 Zhuoying Wang
 Shifang Tang
 Feng Luo
- 1Sandra Dunagan Deal Center for Early Language and Literacy at Georgia College, Milledgeville, GA, United States
- 2Department of Psychology and Special Education, College of Education and Human Services, Texas A&M University-Commerce, Commerce, TX, United States
- 3The Intensive English Institute, Ball State University, Muncie, IN, United States
Texas–Mexico border region is a unique place where two countries and culture connected. We sought to investigate border school district students’ academic performance as measured by Texas standardized test: the State of Texas Assessments of Academic Readiness (STAAR). To do so, we first used propensity score matching (PSM) techniques to analyze data collected from a public database: Texas Assessment Management System (TAMS). Specifically, we provided a PSM analysis of non-border and border school districts regarding their demographic characteristics [i.e., identified as a rural district, percentage of economically disadvantaged (ED) students, percentage of English learners (ELs), mobility rate, instructional hours, principal experience, teacher experience, teacher–student ratio, and teacher turnover rate]. Then, multiple regression analyses were conducted to compare Texas border and non-border school students’ reading, math, and science achievements, respectively, based on a matching sample with control for demographic variables. The results of the current study indicate that no significant difference was found between border and non-border school districts, regarding students’ academic performance in reading, math, and science, when districts were matched and demographic characteristics were controlled. We further found that demographic variables, such as percent of ED students, principal experience, and teacher turnover rate, significantly impact students’ academic achievement. Such findings have suggested that the achievement gap between border and non-border districts can be closed if extra support can be provided to ED students, and funding could be allocated in border districts to maintain experienced principals and teachers.
Introduction
The U.S.-Mexico border region, also referred to as La Frontera, is home to around 12 million people (Sloat et al., 2007) and it is a unique place for culture, language, and education systems to blend (Orraca et al., 2017). The Texas portion of the U.S. Mexico border is about 1,248 miles, from El Paso in the west to Brownsville in the south, with over 80% Hispanic population (Méndez and Staudt, 2013). Texas–Mexico border region has been one of the fastest-growing communities over the last decade (Martinez, 2010). In order to gain access to a high quality of education, thousands of students cross the border to enter schools in the United States. In 2015, the cross-border student population was nearly 40,000 (Orraca et al., 2017).
Texas–Mexico border-crossing students often face serious challenges that might hinder their preparations for school; possible challenges include language barriers (Peterson et al., 2018), immigration status (Peterson et al., 2018), racism or discrimination (Geenen et al., 2005), and limited access to information (Schneider et al., 2006; Francis et al., 2018). Researchers also indicated that, on Texas–Mexico border, there are high poverty rates, a high concentration of economically disadvantaged students (Anderson and Gerber, 2008; Tessman, 2016; Ostorga and Farruggio, 2020), and a high percentage of students identified as English learners (ELs; Alanís, 2000; Sloat et al., 2007; Richardson and Pisani, 2012; Cashman and McDermott, 2013), which suggested these students are in the process of English acquisition and speak another language as primary language (Texas Education Agency, 2020). All the above challenges and social reality have negatively impacted border-crossing students’ academic success (Sloat et al., 2007; Ostorga and Farruggio, 2020) and hindered teachers’ professional development opportunities to better serve border-crossing students (McRobbie and Villegas, 2004; Sloat et al., 2007).
Schools along the border area vs. non-boarder area are significantly different (Ostorga and Farruggio, 2020), but even within the border area, school districts can be greatly different within 20 miles of the distance. For example, Fort Stockton independent school district (ISD) and Rio Grande City ISD are two typical border school districts, located 20 miles from the Texas–Mexico border. Based on Texas Academic Performance Report (2019), Fort Stockton ISD has a large Hispanic population with 10.1% identified as ELs and 67.5% as economically disadvantaged students. The district’s teacher turnover rate was 25.0%, in 2018–2019. By contrast, Rio Grande City ISD has 71.7% of students identified as ELs and 90% as economically disadvantaged. Their teacher turnover rate is 7.2%, much lower than the state average of 16.5% in 2018–2019.
What actually has impacted students’ academic performance may not be the district physical location, but the demographic characteristics between school districts (Tang et al., 2021a,b). Based on that finding, it was wondered that when district demographic characteristics are similar, is there still an academic gap between border and non-board students. Therefore, in our study, we examine and compare border and non-border school district students’ academic performance in reading, math, and science on a state-mandated, standardized test (STAAR), while using a propensity score matching (PSM) technique to match districts’ demographic characteristics. Specifically, the paper includes (a) PSM of non-border and border school districts in terms of their demographic context and (b) a quantitative data-driven analysis comparing Texas border and non-border school students’ reading, math, and science achievement. Taken together, researchers suggested that students in border school districts showed lower academic performance compared to their peers in non-border school districts (Sloat et al., 2007; Ostorga and Farruggio, 2020).
An overview of the impact of student-, teacher-, and school-level factors on students’ academic achievement
Student/teacher/school-level factors significantly impact students’ academic performance. At the student level, the effect of socioeconomic status (SES) was prevalent (Capraro et al., 2000) and had a significant effect on students’ academic performance (Gieselmann, 2009). It was found, in previous research, that the percentage of economically disadvantaged (ED) students has a strong impact on students’ academic performance (Huff et al., 2011). Compared to peers from more advantaged SES backgrounds, ED students were often observed to underperform (Farooq et al., 2011). Especially in the subject area of science, technology, engineering, and mathematics (STEM), the underachievement of ED students was often related to a lack of favorable environment and support (Banerjee, 2016). Additionally, SES students’ English language proficiency is another significant factor that greatly impacts students’ academic performance. English learners (ELs) were observed to lag behind their non-EL peers in all content subject areas (i.e., reading, math, and science) across all grade levels (National Center for Education Statistics, 2019). Student mobility, defined as students’ transferring from one school to another but not due to grade promotion (Rumberger, 2003), also negatively affected students’ academic performance (Paik and Phillips, 2002; Obradović et al., 2009; Schwartz et al., 2009; Rumberger, 2015).
Beyond student-level factors, multiple well-investigated teacher-and school-level factors affect students’ academic outcomes, including teacher-student ratio (Koc and Celik, 2015), teacher turnover rate (Curtis, 2012; Ronfeldt et al., 2013), teacher experience (Tella, 2008; Ladd and Sorensen, 2017), instructional hours (Huebener et al., 2017), and principal experience (Huff et al., 2011; Dhuey and Smith, 2014). Specifically, the teacher-student ratio, which refers to the average number of students a teacher instructs per class, had a significant negative impact on students’ academic achievement (Koc and Celik, 2015). However, class size reduction could help close students’ academic achievement gap (Bosworth, 2014). The teacher turnover rate, referring to teachers leaving the school or the profession, negatively influenced students’ academic achievement (Carver-Thomas and Darling-Hammond, 2017). Henry and Redding (2020) further identified that students with teachers who left their positions, during the academic school year, had even lower test scores than those whose teachers stayed. Furthermore, the teacher turnover rate varies across subject areas, among which, math and science teachers demonstrated the highest turnover rates (Carver-Thomas and Darling-Hammond, 2017). Math and science teachers’ turnover rate impacted students’ achievement in a more negative manner than English language art teachers’ turnover rate did (Henry and Redding, 2020). Researchers also found that teachers’ years of teaching experience positively impacted students’ academic achievement (Blackmer, 2014; Akello, 2015; Chu et al., 2015; Sauceda, 2017; Walker, 2017). As for the impact of instruction time on students’ academic outcomes, Cattaneo et al. (2017) found that additional instructional time significantly improved students’ achievement, according to Programme for International Student Assessment (PISA) data. However, they also urged that educational institutions be cautious about adding extra instructional hours since the marginal gains of additional hours decreased to 35–50% percent of regular instructional hours.
Principals play a critical role in students’ academic learning (Nichols et al., 2012; Bartanen, 2019). Researchers suggested that principal credentials could be comprehensively evaluated via years of experience as a principal, current school tenure, and the highest education degree (Grissom and Bartanen, 2019). Although the impact of years of principal experience on students’ achievement has been widely examined, researchers’ findings are controversial. For example, Bartanen (2019) found that as principals gain more experience, they become more effective in improving students’ academic achievement. However, Brockmeier et al. (2013) found that although the principal experience did not have a significant impact on students’ academic performance in general, students who went to school with principal experience less than 14 years displayed significantly higher achievement compared to those who went to school with principal experience between 15 and 24 years. Furthermore, at the school level, those identified as rural schools often face a series of challenges to help students improve academic performance, including recruiting and retaining qualified teachers (Sindelar et al., 2018), geographic isolation (Hill and Hirshberg, 2008), and inadequate final resources (Tekniepe, 2015).School district location is a commonly used indicator in educational research, including rural vs. non-rural (i.e., Graham and Provost, 2012; Alea et al., 2020) or border vs. non-border (i.e., Tang et al., 2019a,b). It is also a typical indicator in education policy. For example, in Texas, the Rural Education Achievement Program (REAP) was established to provide financial assistant to address local academic needs (TEA, 2018). However, the design of education policies should take the different demographic context embedded in the individual school districts into consideration (Echazarra and Radinger, 2019) instead of the general geographic classification. It was found in previous research that the academic gap between schools of different locations might disappear after taking other demographic characteristics (i.e., SES, teacher experience, mobility rate, etc.) into consideration (Echazarra and Radinger, 2019; Tang et al., 2021a). Moreover, to better support students from diverse communities and backgrounds, it was suggested in previous research that local contextuality (Gay, 2015; Echazarra and Radinger, 2019), cultural understanding (Gay, 2015), and students’ life outside of school Milner, 2012 should be applied to guide educators’ action, researchers’ evaluation and policy makers’ decision.
Our review of the literature indicates that limited studies have been conducted to investigate the educational development of border-crossing students. Among the available studies, most of them are qualitative studies on the following topics: transnationalism (Brochin Ceballos, 2012; Méndez and Staudt, 2013), bilingualism (Mein and Esquinca, 2014), biliteracy (de La Piedra and Guerra, 2012; Smith and Murillo, 2012), and biculturalism (Arreola, 2005). We only located a few quantitative studies that compare the academic performance of border versus non-border school district students. For example, Dow (2008) conducted a longitudinal study to investigate elementary level English learners’ academic achievement in dual language programs in a border district school. The study’s findings indicated that bilingual programs in border districts were not an obstacle to students’ oral language performance. In addition, ELs’ English oral proficiency increased more compared to their Spanish oral proficiency. It was also found that ELs in the bilingual program performed much better than students in monolingual programs. In addition, Tang et al. (2019a,b) compared the growth trajectory of border and non-border school districts regarding 5th grade students reading performance on the Texas high-stakes test: STAAR. It was found that compared to students from non-border school districts, border school district students lagged behind when STAAR was first administered, with a gap remaining in the following academic years. Wang (2020) also compared border and non-border school districts in terms of kindergarten ELs’ oral language performance, as measured by the Texas English Language Proficiency Assessment System (TELPAS, a standardized test for EL classification and reclassification in Texas). Findings of the study revealed that border ELs underperformed their peers in non-border schools on the TELPAS speaking test. As further suggested in Tang et al. (2021a,b), what actually impacted students’ academic performance was not the physical location, but the demographic context and characteristics associated with that specific location.
Application of propensity score matching technique in educational studies
Randomized controlled trials (RCT) have been, generally, considered as the most powerful gold standard approach to investigating the intervention effect on outcome (Austin, 2011; Lilienfeld et al., 2018). Via randomization, the effect of treatment will not be confounded by observed or unobserved background characteristics (Austin, 2011; Tang et al., 2019a,b). However, it is not always practical or desirable to conduct randomization in educational studies. An alternative approach to eliminating observational data’s confounding effect is the PSM technique (Austin, 2011). Initially proposed by Rosenbaum and Rubin (1983), the PSM approach was developed to examine the treatment effect of observational or nonexperimental data when RCT is not feasible. Specifically, the purpose of conducting propensity score analysis is to achieve a balance on observed covariates, which could recreate a situation expected to achieve conditions similar to RCT (Guo and Fraser, 2014).
Propensity score matching can be a great alternative for balancing the covariate between treatment and comparison groups in educational studies. In educational studies, students’ academic performance might be impacted by many covariates, such as their SES, self-efficacy, mobility, and teacher turnover rate (Adelson, 2013). Compared to the wide use of PSM in medical research, however, in the field of educational research, PSM was mostly applied in special education (Sullivan and Field, 2013; Morgan et al., 2017; Tang et al., 2019a,b) by including the observed variables, such as achievement (Tang et al., 2019a,b), school socioeconomic status (Belfi et al., 2016), gender (Tang et al., 2019a,b), and school size (Wyse et al., 2008). For example, used the PSM technique to match students who did not attend a talent program with 36 students who participated in a talent program based on their major, gender, College Entrance Examination scores, and College English test scores. It was found in the study that after PSM, the talented program still yielded a significant and positive impact on students’ English language proficiency.
This study uses the PSM technique to determine whether there is any significant difference between border and non-border school districts in Texas regarding their students’ academic performance as measured by STAAR. We intended to explore whether the academic gap between border and non-border school districts existed when the observed district characteristics were matched and controlled for, and how these characteristics impacted students’ achievement in STAAR reading, math, and science tests. The following two research questions guided this study:
Research Question 1: After propensity scoring, was there a significant difference between border and non-border school districts, in Texas, regarding the percentage of students achieving grade level in STAAR reading, math, and science tests, when district-level characteristics were controlled for?
Research Question 2: What was the impact of district-level characteristics on students’ performance on the STAAR reading, math, and science tests?
Method
Research design and data collection
The current study utilized the PSM technique to examine differences between border and non-border school district students’ STAAR performance after their demographic characteristics were matched and controlled for. In the school year 2018–2019, there were 1,210 public school districts, among which 63 school districts were classified as border school districts, located at or within 20 miles of the Texas-Mexico border (Sloat et al., 2007). District-level STAAR reading, math, and science data for Grade 5 students were downloaded from the publicly available database, Texas Assessment Management System (TAMS). In addition, district-level demographic characteristics from 2018 to 2019 were collected from Texas Academic Performance Report (TAPR; TEA, 2019). These characteristics included: EL student percentage, ED student percentage, mobility rate, teacher turnover rate, teacher experience, teacher and student ratio, instructional hours, and principal experience.
Measurements
STAAR is a state-mandated testing program administered by Texas to evaluate students’ ability and skills, as defined in the curriculum standards, the Texas Essential Knowledge and Skills (TEKS). STAAR evaluates students’ ability and knowledge in various core subjects at different grade levels, including reading and mathematics for grade 3 to grade 8, writing for grade 4 to grade 7, and science for grade 5 and grade 8. Since 2012, STAAR has been administered across Texas school districts for accountability purposes.
In 2016–2017, Texas Education Agency (TEA) adopted a new four-level rating system to describe students’ performance in STAAR tests: did not meet, approaches, meets, and masters grade level. According to students are classified as “did not meet grade level,” meaning they are unlikely to make academic achievement in the next stage level without effective academic intervention. Students achieving “approaches grade level” indicated that they are likely to make academic achievement in the next stage level with proper academic intervention. Students in this category generally have the ability to apply the TEKS assessed knowledge and skills in family contexts. Students achieving “meets grade level” indicated that they are highly likely to make academic achievement in the next stage level with some academic intervention. Students in this category have the ability to apply TEKS assessed knowledge and skills in the family context and have the ability to think critically. Students achieving “masters grade level” indicated that they are supposed to make academic achievement in the next stage level with limited or no academic intervention support. Students in this category can think critically, and even more, apply TEKS assessed knowledge and skills in various family and unfamiliar contexts. In the current study, we focused on 5th grade students achieving approaches grade level in the STAAR tests. 5th grade Texas students are subject to grade advancement criteria. Specifically, students who passed both grade-level tests (reading and math) meet the criteria for grade advancement. Students categorized as approaches, meets or masters grade level were considered as pass the tests (TEA, 2019).
Data analysis
Propensity score matching
We used PSM to balance the covariate between border and non-border school districts. In the study, 10 variables were included in the matching procedure: border, rural, percentage of economically disadvantaged (ED) students, percentage of English learners, mobility rate, instructional hours, principal experience, teacher experience, teacher-student ratio, and teacher turnover rate. Border is a dichotomous variable that categorizes school districts as “border” or “non-border.” In the current study, border condition are border school districts, which are located at or within 20 linear miles of the Texas-Mexico border (Sloat et al., 2007). Rural is a dichotomous variable that categorizes school districts as “rural school districts” or “non-rural school districts” (TEA, 2019). In this study, rural, percentage of economically disadvantaged students, percentage of English learners, mobility rate, instructional hours, principal experience, teacher experience, teacher-to-student ratio and teacher turnover rate are the nine matching variables, and border is the grouping variable. The percentage of students rated as “approaches grade level” in STAAR reading, math, and science tests, respectively, are the three outcome variables for the comparison analysis.
Hierarchical multiple regression
Hierarchical multiple regression analyses were conducted to determine whether border location could predict student academic performance in reading, math and science, after controlling district demographic characteristics. Variables of district characteristics, including rural district, percentage of students identified as ED, percentage of students identified as EL, mobility rate, principal experience, teacher experience, teacher-student ratio, instructional hours, and teacher turnover rate, were entered into Model 1, followed by the border condition of school districts into Model 2.
: coefficient of district as rural or non-rural
: coefficient of district level percentage of students identified as ED
: coefficient of district level percentage of students identified as EL
: coefficient of district level mobility rate
: coefficient of district level principal experience
: coefficient of district level teacher experience
: coefficient of district level teacher and student ratio
: coefficient of district level average instructional hours
: coefficient of district level teacher turnover rate
: coefficient of district as border or non-border
Results of the PSM procedure
The results in Figure 1 show that matching worked successfully for the following observation. First, before matching, the mean percentage of students identified as ED was 80.05% in border school districts and 59.47% in non-border school districts, and there was a 20.58% difference. However, after matching, the percentage of students identified as ED remained the same in border school districts and increased to 76.77% in non-border school districts. The gap between the border and non-border school districts was significantly reduced to 3.28%. Second, before matching, the percentage of students identified as EL was 28.45% in border school districts and 10.18% in non-border school districts, with an 18.27% difference. After matching, the gap decreased to 7.58%. Third, before matching, the total instructional hours is 58.95 in border school districts and 65.82 in non-border school districts, with a 6.87 difference. After matching, the gap decreased to 0.87.
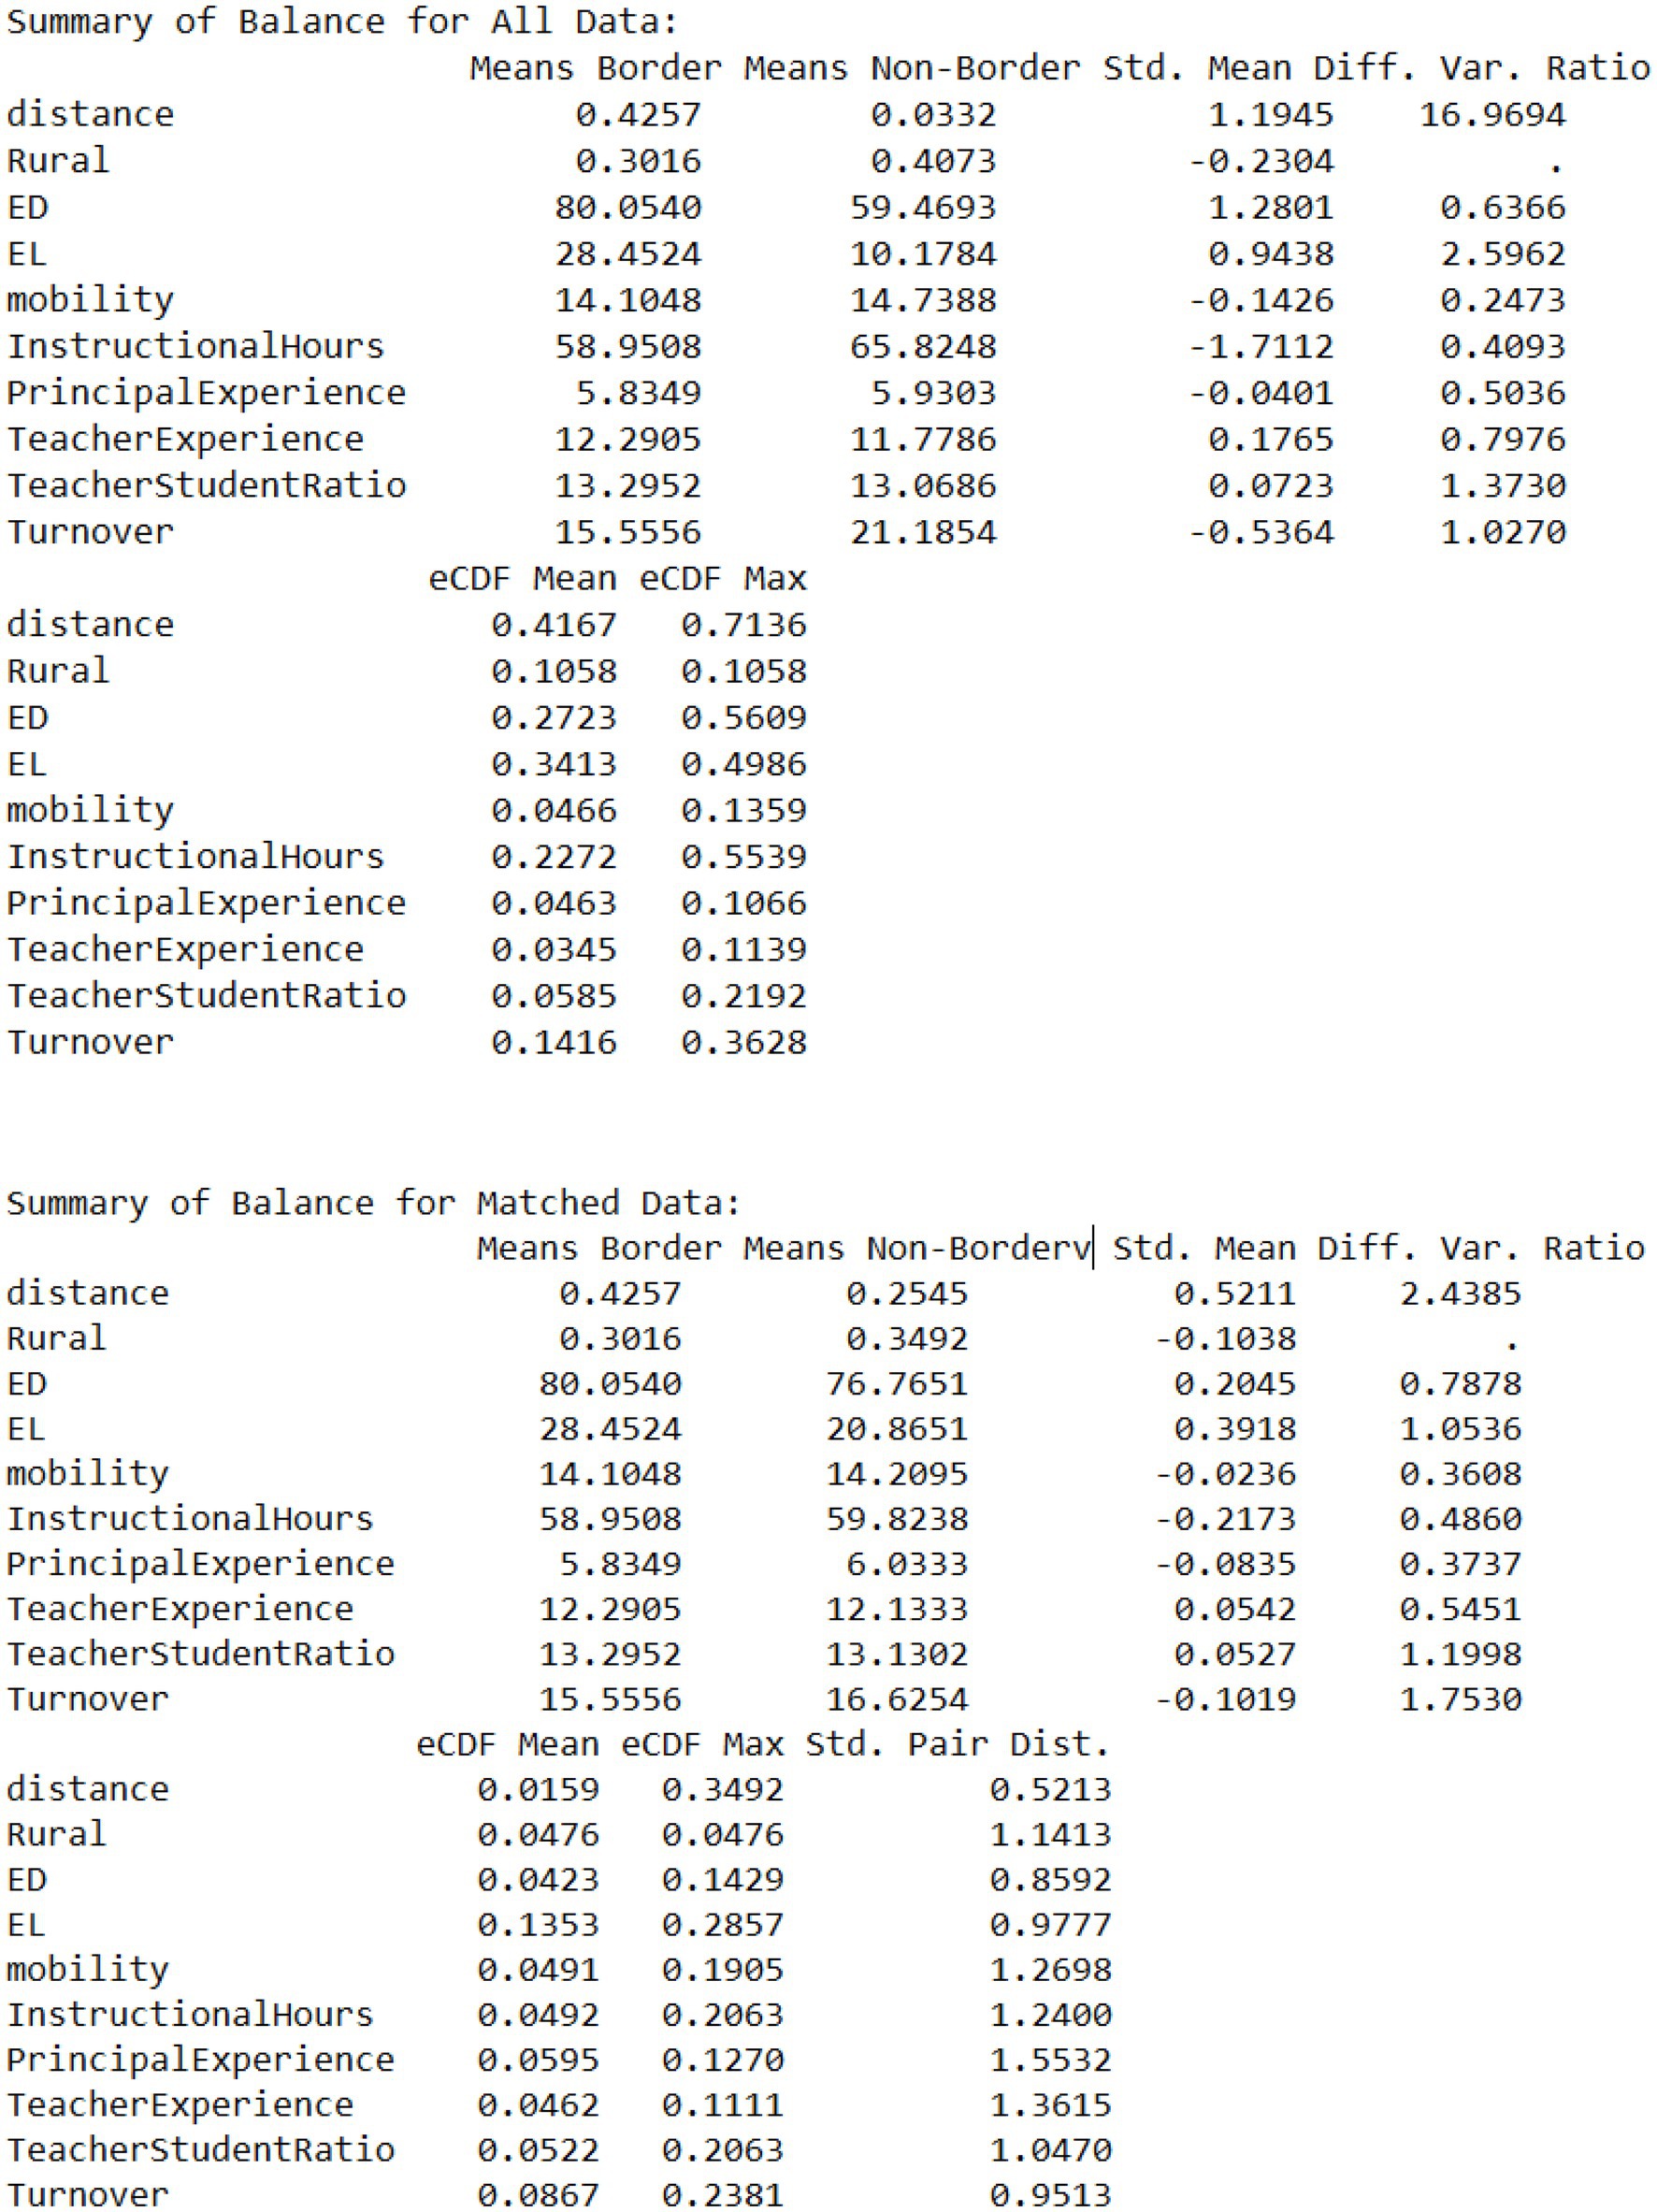
Figure 1. Results of the PSM procedure.
Moreover, before matching, the teacher turnover rate is 15.56 for border school districts and 21.19 for non-border school districts, with a 5.63 difference. After matching, the gap decreased to 1.07. In addition, before matching, non-border school districts had 11% more school districts identified as rural school districts. After matching, the gap decreased to 5%. There was not much difference between border and non-border school districts before and after matching regarding the distribution of mobility, principal experience, teacher experience, and teacher-student ratio. To visualize the matching procedure, we presented Figures 2, 3. As indicated in both figures, the matched border and non-border districts are more similar in the demographic variables (Figures 1–3).
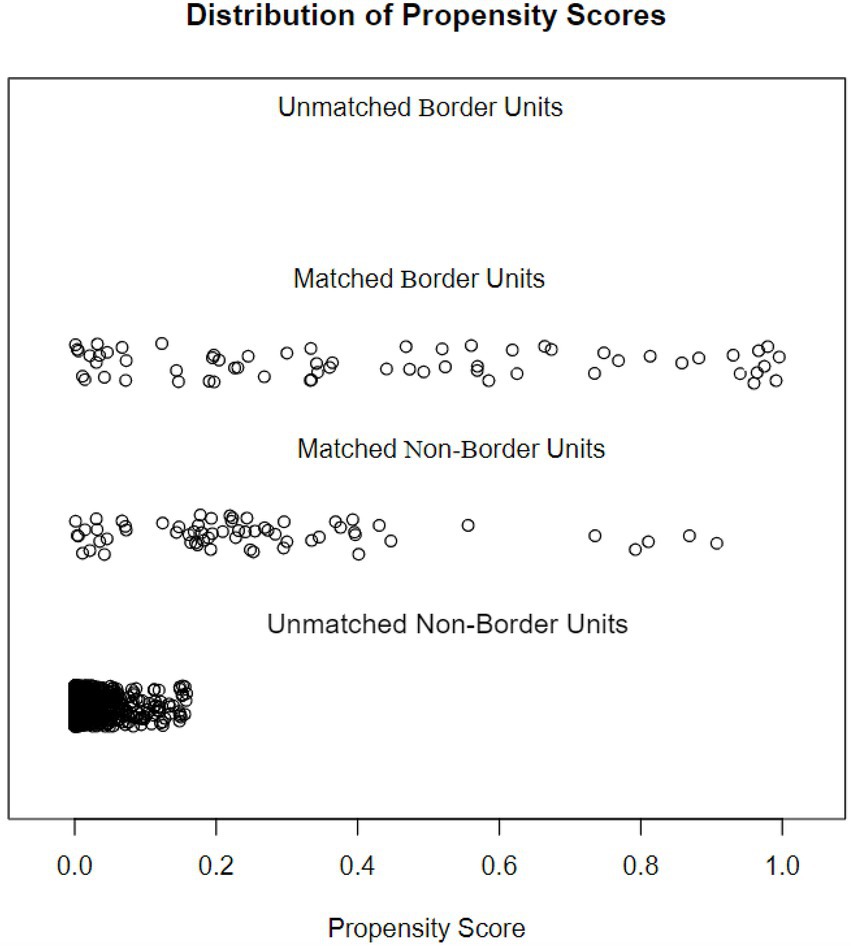
Figure 2. Distribution of propensity scores.
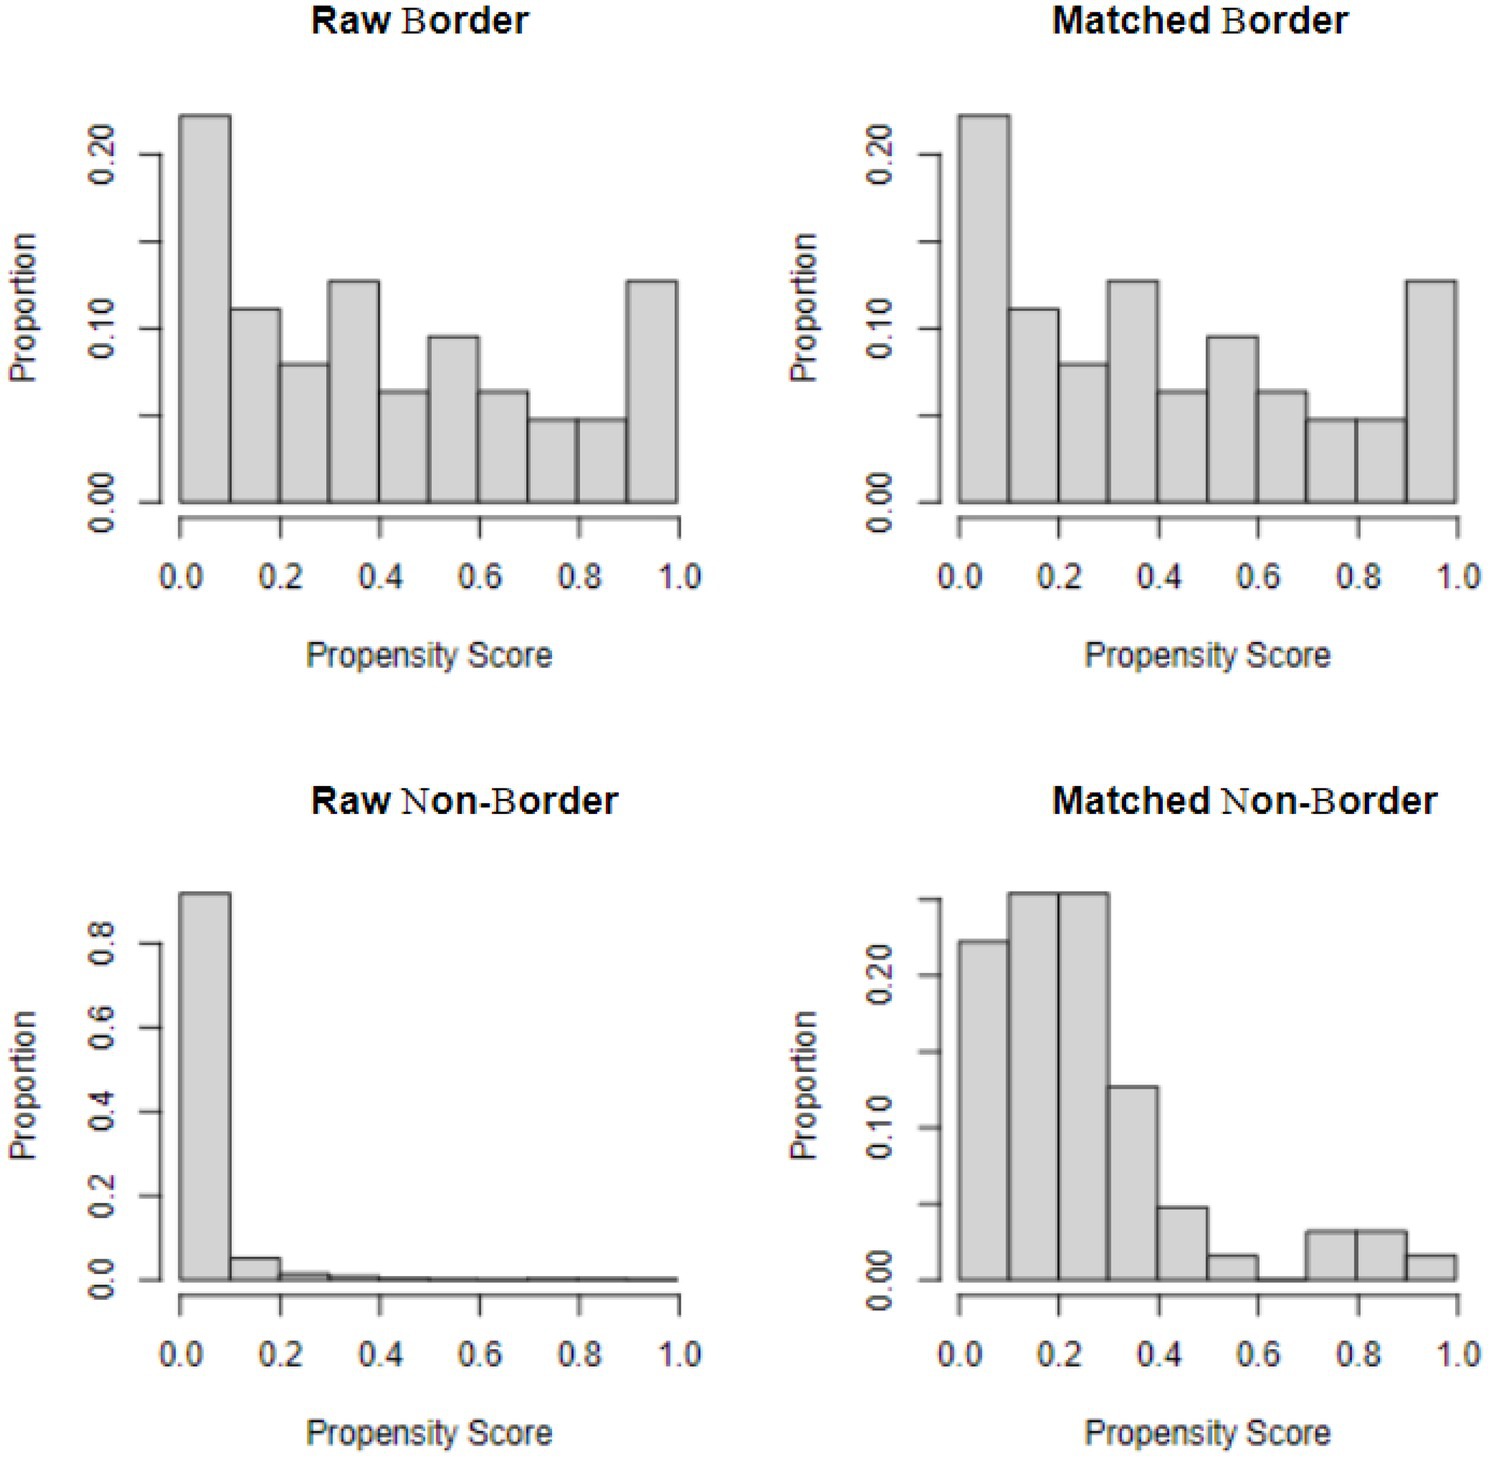
Figure 3. Histograms of propensity score before and after matching by condition.
Results
In the results section, a chi-square test was performed to examine the difference between border and non-border school districts regarding the distribution of rural school districts after matching. The results in Table 1 suggested no statistically significant difference between border and non-border school districts in the distribution of rural school districts (p = 0.568, φ = −0.051). Moreover, independent sample t-tests were conducted to examine the statistical differences between border and non-border school district demographic characteristics after PSM. The results displayed in Table 2 indicated that there was no statistically significant difference between border and non-border school districts in terms of the percentage of students identified as ED, students mobility rate, instructional hours, principal experience, teacher experience, teacher-student ratio, and teacher turnover rate. However, the results indicated that compared with non-border school districts, border school districts still had a higher percentage of students identified as EL (t[124] = 2.23, p = 0.028). These results from the t-test and the chi-square test indicated that the PSM procedure produced a relatively balanced border and non-border school districts sample for further analysis. Table 3 displayed the descriptive statistics of the adjusted STAAR performance of border and non-border school districts.
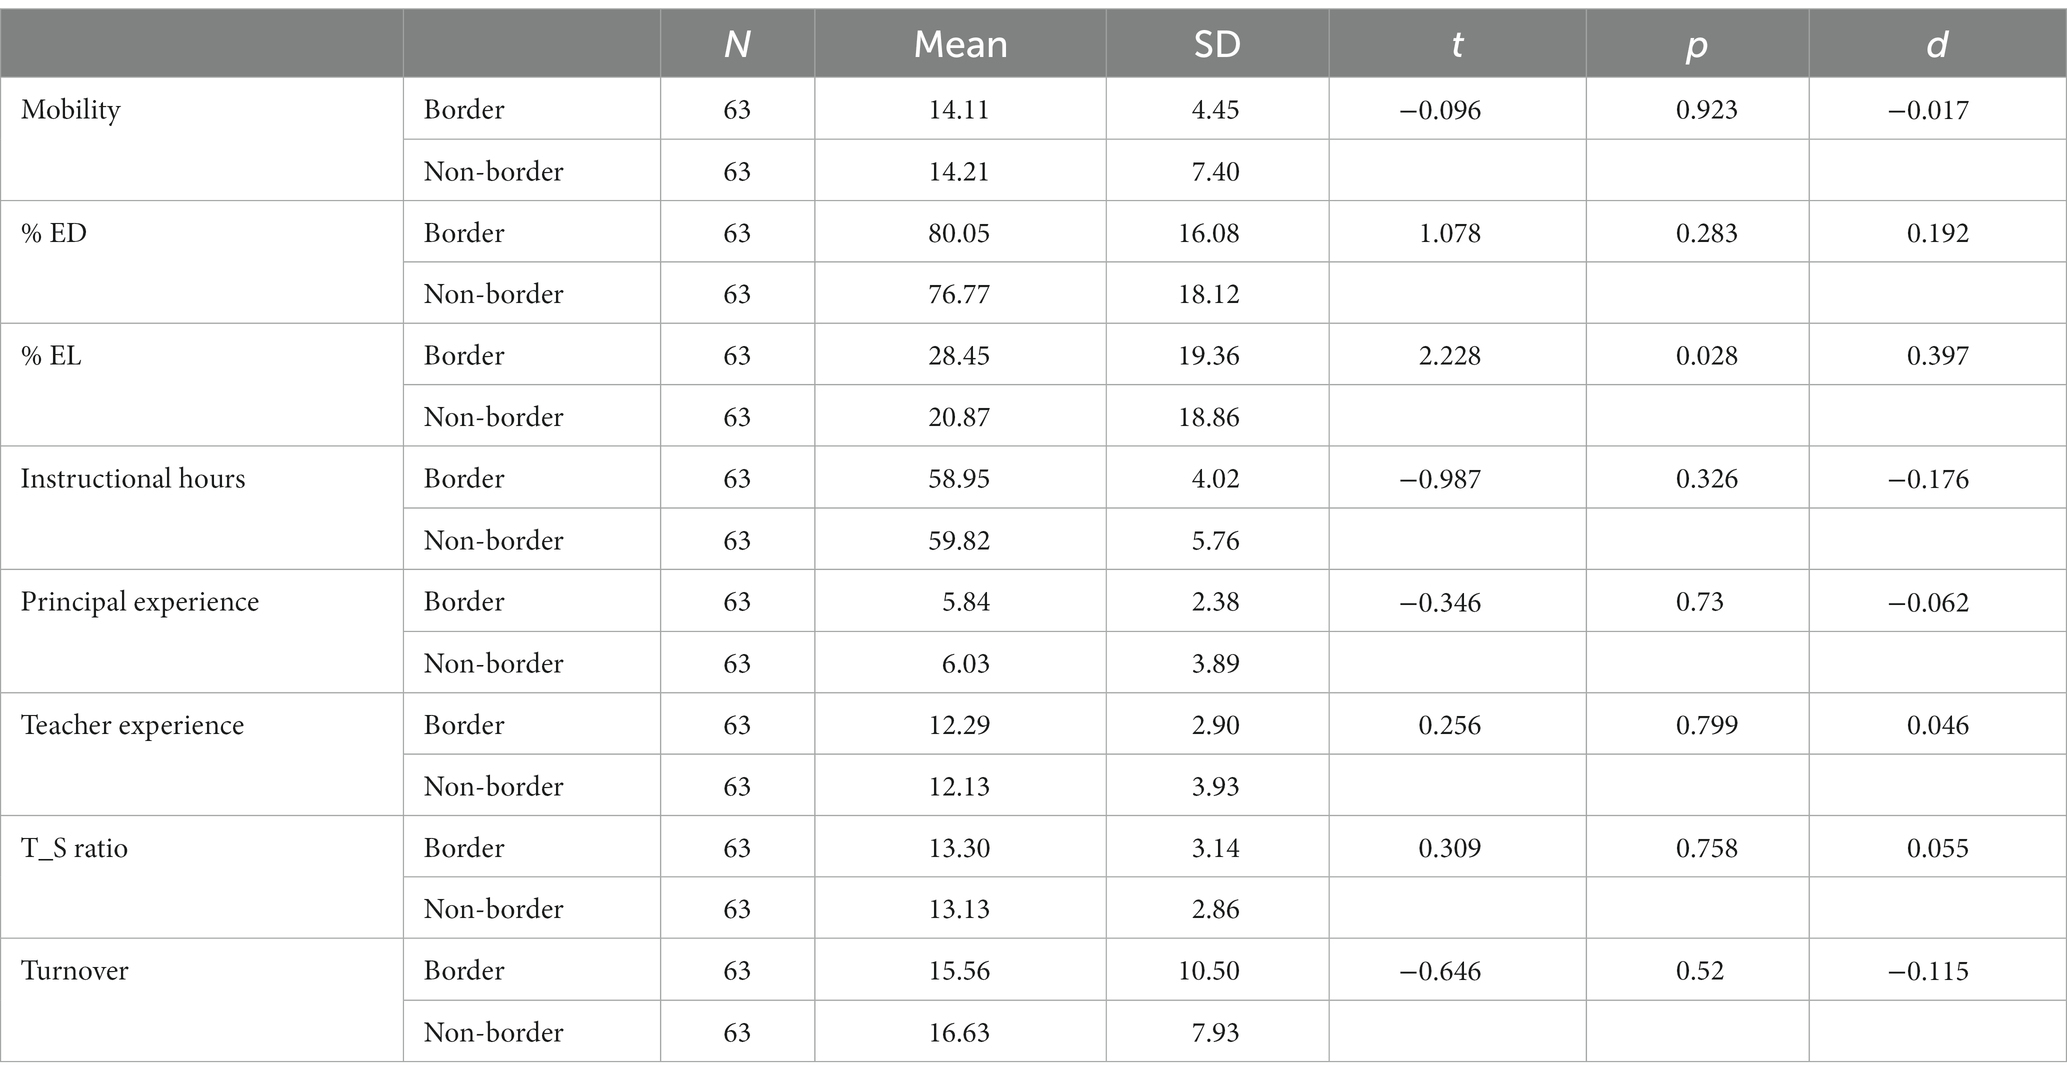
Table 1. The t-test results from comparing border and non-border school districts’ demographic characteristics.
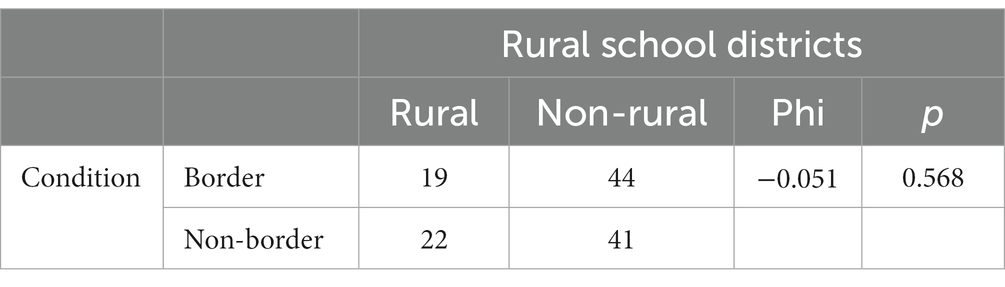
Table 2. Chi-square results from comparing border and non-border school districts’ rural districts.
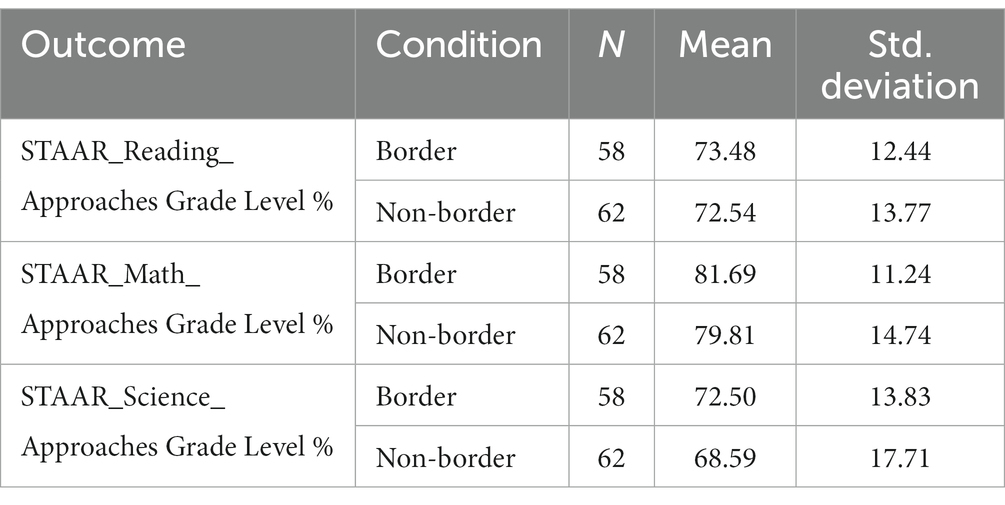
Table 3. Descriptive statistics of adjusted STAAR performance by school district location.
Hierarchical multiple regression was run to determine if border condition of the school districts improved the prediction of the student reading achievement indicated by the percentage of students achieved approaches grade level in G5 STAAR reading test over and above demographic characteristics (i.e., rural, mobility rate, percentage of students identified as EL, percentage of students identified as ED, principal experience, teacher experience, teacher turnover rate, teacher-student ratio, and instructional time). See Table 4 for full details on each regression model. Adding the border condition to predict the percentage of students achieving approaches grade level in 5th Grade STAAR reading test (Model 2) led to an change in R2 of 0.001, ΔF(1,109) = 0.193, p = 0.661. The full model of demographic characteristics and border condition to predict the percentage of students achieving approaches grade level in G5 STAAR reading test (Model 2) was statistically significant, R2 = 0.240, F(10,109) = 3.442, p < 0.01; adjusted R2 = 0.170. Mobility rate and percentage of students identified as ED significantly predicted students reading achievement in the STAAR reading test. Specifically, as the percentage of students identified as ED increased by one point, the expected percentage of students who achieved approaches grade level in G5 STAAR reading test decreased by 0.23 points (p = 0.036), holding the other variables constant. As the mobility rate of students increases by one point, the expected percentage of students who achieve approaches grade level in G5 STAAR reading test decreases by 0.43 points (p = 0.007), holding the other variables constant. In addition, in rural school districts, the percentage of students identified as EL, instructional hours, principal experience, teacher experience, teacher-student ratio, turnover rate, and border condition were not significantly correlated to their reading performance.
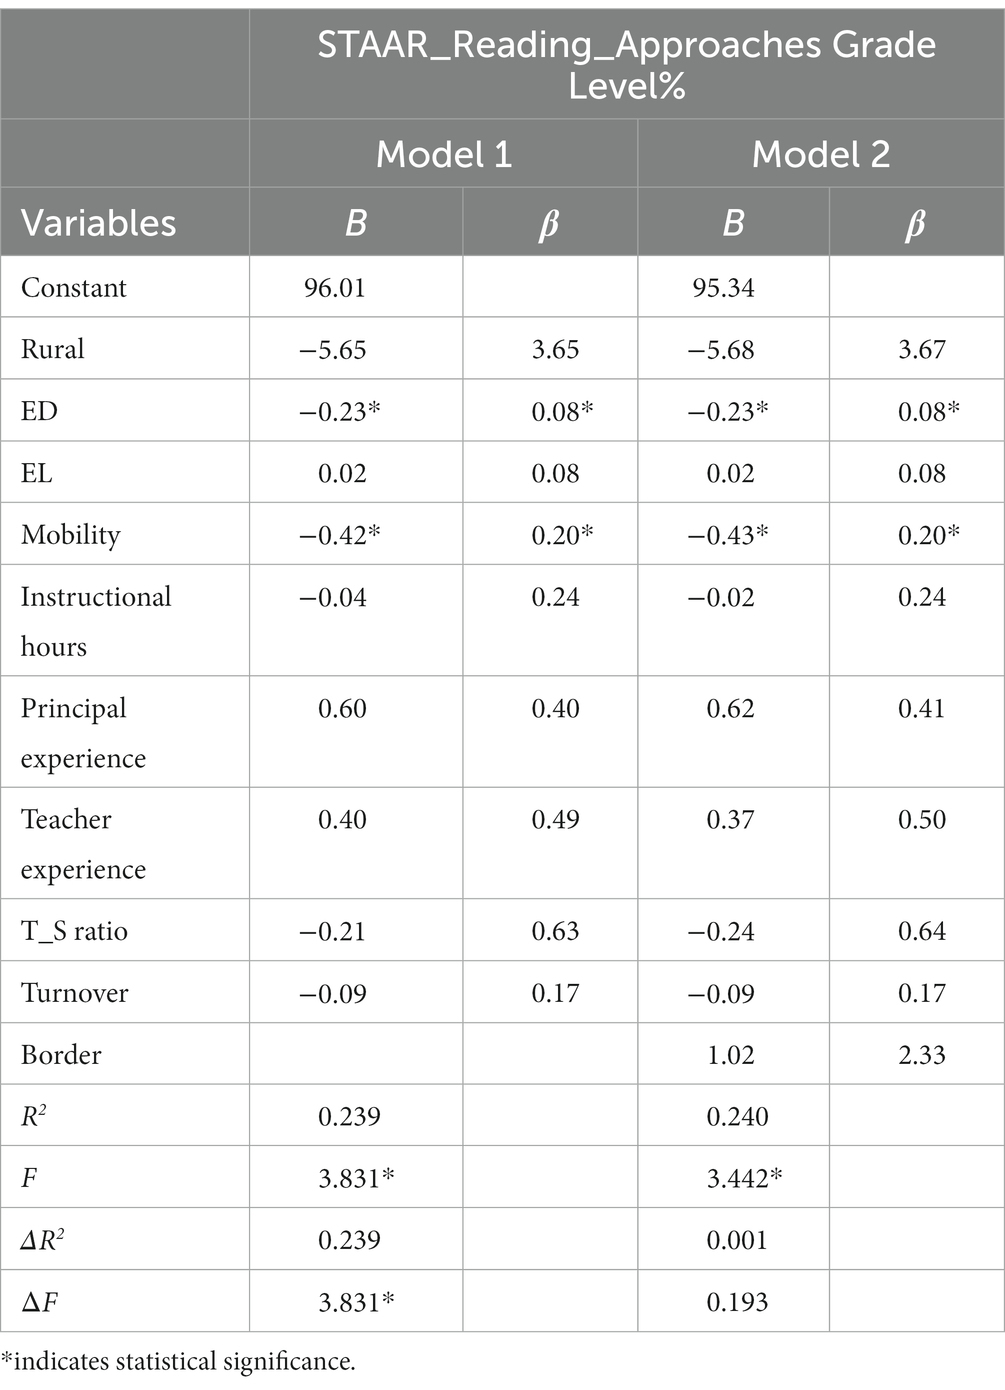
Table 4. Hierarchical multiple regression predicting student reading achievement from demographic characteristics and border condition.
Similar hierarchical multiple regression was run to determine if border conditions of school districts improved the prediction of students math achievement indicated by the percentage of students achieved approaches grade level in G5 STAAR math test over and above demographic characteristics (i.e., rural, mobility rate, percentage of students identified as EL, percentage of students identified as ED, principal experience, teacher experience, teacher turnover rate, teacher-student ratio, and instructional time). See Table 5 for full details on each regression model. Adding the border condition to predict the percentage of students achieving approaches grade level in 5th Grade STAAR math test (Model 2) led to an change in R2 of 0.005, ΔF(1,109) = 0.865, p = 0.354. The full model of demographic characteristics and border condition to predict percentage of students achieving approaches grade level in G5 STAAR math test (Model 2) was statistically significant, R2 = 0.366, F(10,109) = 6.284, p < 0.01; adjusted R2 = 0.308. Rural, mobility rate and principal experience significantly predicted students’ math achievement in STAAR math test. Specifically, non-rural school districts outperformed rural school districts by 8.18 points (p = 0.017) in math when other variables were controlled. As the mobility rate of students increases by one point, the expected percentage of students who achieve approaches grade level in G5 STAAR math test decreases by 0.76 points (p < 0.001), holding the other variables constant. As the principal experience of the district increase by one point, the expected percentage of students who achieve approaches grade level in G5 STAAR math test increases by 0.96 points (p = 0.012), holding the other variables constant. In addition, percentage of students identified as ED, percentage of students identified as EL, instructional hours, teacher experience, teacher-student ratio, turnover rate, and border condition were not significantly correlated to their math performance.
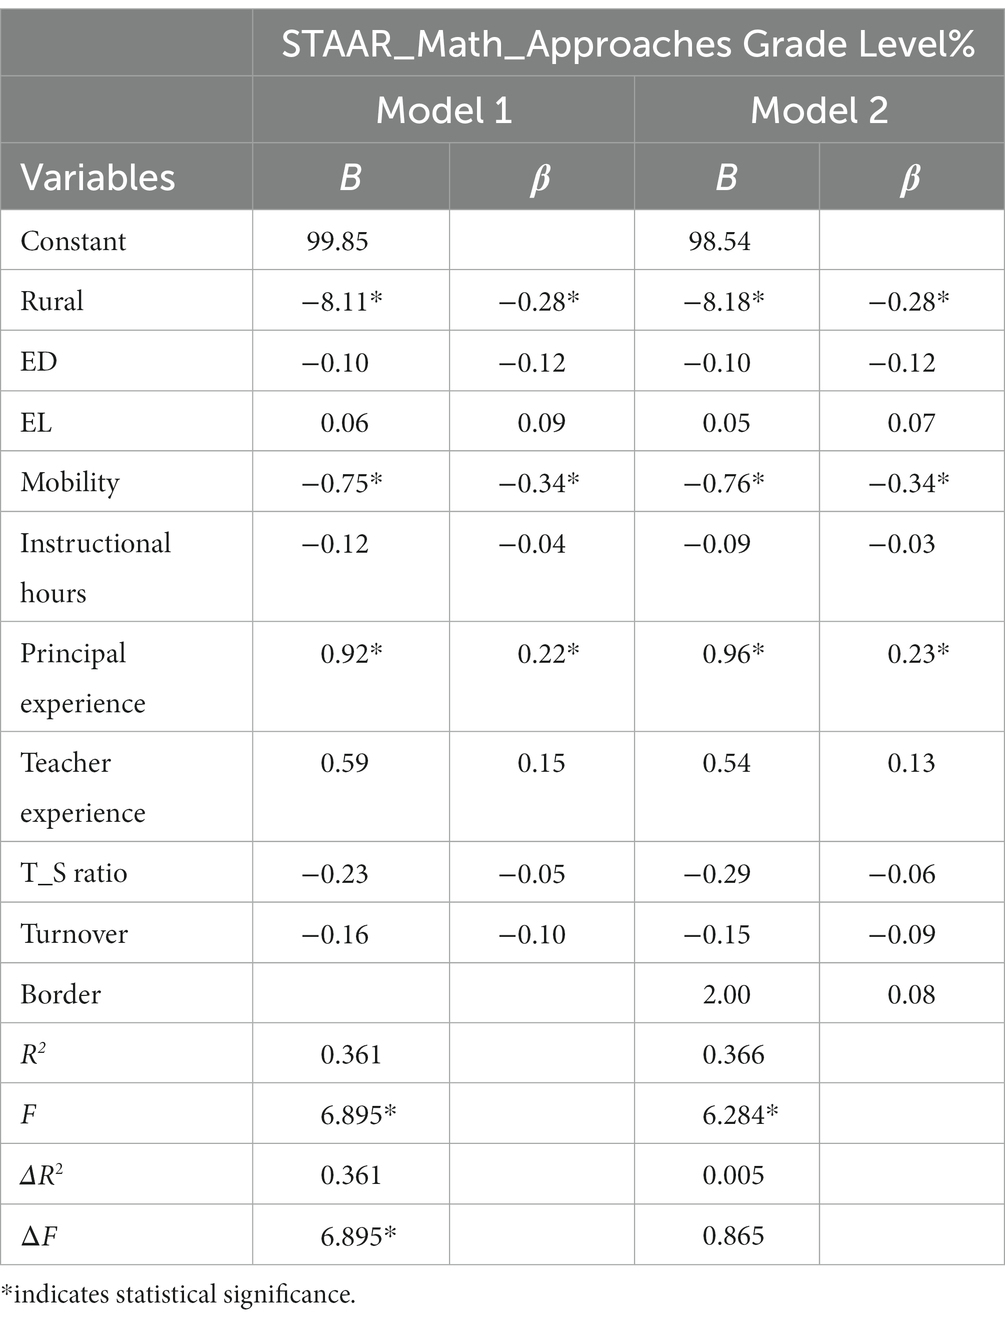
Table 5. Hierarchical multiple regression predicting student math achievement from demographic characteristics and border condition.
We also conducted the hierarchical multiple regression to determine if the border condition of school districts improved the prediction of students science achievement indicated by the percentage of students achieved approaches grade level in G5 STAAR science test over and above demographic characteristics (i.e., rural, mobility rate, percentage of students identified as EL, percentage of students identified as ED, principal experience, teacher experience, teacher turnover rate, teacher-student ratio, and instructional time). See Table 6 for full details on each regression model. The addition of the border condition to predict the percentage of students achieving approaches grade level in the 5th Grade STAAR science test (Model 2) led to an change in R2 of 0.013, ΔF(1,109) = 2.155, p = 0.145. The full model of demographic characteristics and border condition to predict percentage of students achieving approaches grade level in G5 STAAR science test (Model 2) was statistically significant, R2 = 0.325, F(10,109) = 5.256, p < 0.01; adjusted R2 = 0.263. Percentage of students identified as ED, mobility rate, and principal experience significantly predicted student math achievement in STAAR science test. Specifically, as the percentage of students identified as ED increases by one point, the expected percentage of students who achieve approaches grade level in the G5 STAAR science test decreases by 0.25 points (p = 0.011), holding the other variables constant. As the mobility rate of students increased by one point, the expected percentage of students who achieve approaches grade level in G5 STAAR reading test decreased by 0.65 points (p = 0.006), holding the other variables constant. As principal experience of the district increases by one point, the expected percentage of students who achieve approaches grade level in the G5 STAAR science test increases by 1.32 points (p = 0.006), holding the other variables constant. In addition, rural school districts, percentage of students identified as EL, instructional hours, teacher experience, teacher-student ratio, turnover rate, and border condition were not significantly correlated to their science performance.
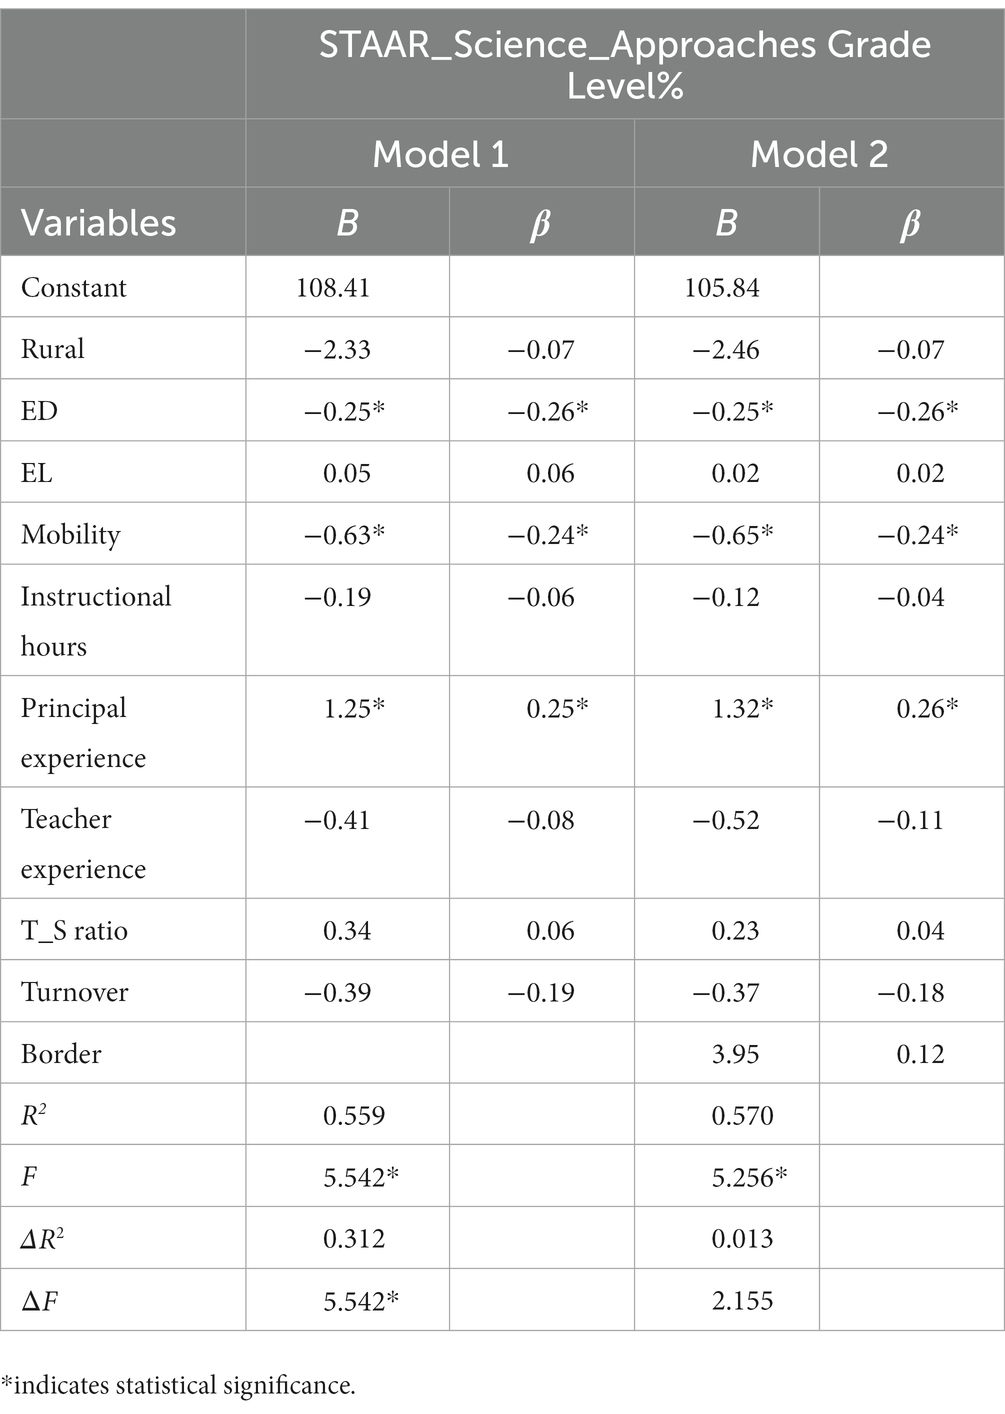
Table 6. Hierarchical multiple regression predicting student science achievement from demographic characteristics and border condition.
Discussion
The study compared Texas border and non-border school districts students’ academic performance in reading, math, and science in state-mandated standardized test, STAAR, after PSM on districts’ demographic context. We further examined whether district demographic characteristics impacted students’ academic performance.
The overall findings indicate that, after PSM, there is no significant difference between the border and matched non-border school districts’ demographic characteristics, including the percentage of EL, percentage of economically disadvantaged students, mobility rate, principal experience, teacher experience, teacher–student ratio, teacher turnover rate, and instructional time. We then compared students’ academic performance and failed to identify significant differences between border and non-border school districts, regarding the percentage of students achieving approaches grade level in STAAR reading, math, and science test. Our finding is consistent with Tang et al. (2021a,b) in that what impacted students’ academic performance was not the location but the demographic factors attached to the school districts. The common criteria applied to categorize a school district are geographic location, population, and student enrollment. However, under the umbrella of district type, there exist vast differences among school districts identified as the same category.
Further, we examined nine district demographic factors affecting students’ academic performance in reading, math, and science. The results indicate that the percentage of students who achieved approaches grade level in reading, math, and mobility rate, consistently showed similar impact in their science testing. Our finding is consistent with previous studies showing students’ mobility rate significantly impacts their academic performance (Mehana and Reynolds, 2004; Paik and Phillips, 2002; Rumberger, 2015). In addition, the percentage of students identified as ED has a significant impact on students’ reading and science performance, principal experience significantly influences students’ math and science performance, and teacher turnover rate greatly impacts students’ science performance. Our findings echo previous studies that the demographic characteristic of a school district had important roles in supporting students’ academic performance, including principal years of experience (Bartanen, 2019) and teacher turnover rate (Henry and Redding, 2020).
The results of this study contribute to the literature by investigating border versus non-border students’ achievement by matching and controlling all district-level characteristics. Despite the existing literature on the differences between border and non-border districts, there has been no research indicating existing achievement gaps, in students’ high-stakes testing, when these differences were matched and controlled. Researchers, who studied students’ achievement in reading, focused on border students only (e.g., Dow, 2008) or only examined the impact of district-level variables on students’ math achievement, without comparison of border versus non-border variables (e.g.,Tang et al., 2021a,b), or they failed to match and control for the pre-existing district-level differences between border and non-border school districts (e.g., Tang et al., 2019a,b). In this study, we addressed these literature gaps (i.e., comparing border versus non-border school districts, involving reading, math, and science as variables, then matching and controlling for pre-existing demographic characteristics), with consideration and examination of any achievement gaps between border and non-border school districts, after controlling for all other variables.
More importantly, based on the results of the study, we suggest that district location should not be applied as a key consideration in terms of education innovation and reform. Policymakers and school systems should provide teachers and students with tailored support based on their demographic contexts. Instead of the district location, empirical evidence and demographic backgrounds should be taken into consideration while educators design and modify curriculum and provide training for practitioners. Thus, both border and non-border school districts could receive the appropriate support to serve the unique academic needs of local schools, teachers, and students. Moreover, taking the specific geographic location into account, inclusive learning environments with equitable state funding levels across districts contextualized policies (Cardichon et al., 2020) and (Echazarra and Radinger, 2019) should be promoted to make schooling accountable for all children.
Limitations and future research
In the current study, we applied PSM to minimize the differences between border and non-border school districts, regarding their demographic characteristics in the school settings. These characteristics were measured and provided by the TEA. However, our PSM model might not have included the variables that influence students’ academic achievement, but are not provided or observed by the TEA. Therefore, our results might still be affected by hidden bias (e.g., from unobserved variables). Although we did match districts on factors (e.g., district-level demographic characteristics) that have been identified in previous studies as being predictive of students’ academic achievement (Tang, 2019a; Tang, 2021a,b), we were unable to account for student-level demographic characteristics or to analyze student-level achievement data. Our study was designed to provide a general or overall estimation of the achievement gap between border and non-border districts, with or without controlling for the district-level demographic characteristics. Further investigation of the difference between border versus non-border school districts, regarding student characteristics on student-level achievement data, is clearly warranted. Although our study included predictors related to teachers (e.g., turnover and teaching experience) and teachers’ instruction (e.g., teacher-student ratio and instructional hours), these variables were aggregated at the district level. Such aggregation may lead to insensitivities in the teacher-related variables’ predictions of students’ academic achievement, especially when the multilevel structure of real-life data (students nested within classrooms; classrooms nested in schools; schools nested in districts) cannot be accounted for in the current study. Future studies need to analyze how district location and district/school/teacher-level variables impact students’ academic achievement, with consideration of the multilevel data structure that naturally exists in all school settings. Our estimates of the differences between border versus non-border districts are limited to Grade 5. Analyses across multiple grade levels may have yielded a more comprehensive estimation.
Data availability statement
Publicly available datasets were analyzed in this study. This data can be found here: https://txreports.emetric.net.
Author contributions
ZW and ST conducted the data collection, data analysis, and manuscript drafting and revision. FL reviewed and refined the language of the manuscript. All authors contributed to the article and approved the submitted version.
Funding
The paper is funded by the Sandra Dunagan Deal Center for Early Language and Literacy at Georgia College.
Conflict of interest
The authors declare that the research was conducted in the absence of any commercial or financial relationships that could be construed as a potential conflict of interest.
Publisher’s note
All claims expressed in this article are solely those of the authors and do not necessarily represent those of their affiliated organizations, or those of the publisher, the editors and the reviewers. Any product that may be evaluated in this article, or claim that may be made by its manufacturer, is not guaranteed or endorsed by the publisher.
References
Adelson, J. L. (2013). Educational research with real-world data: reducing selection bias with propensity score analysis. Pract. Assess. Res. Eval. 18:15. doi: 10.7275/4nr3-nk33
Akello, A. J. (2015). Impact of teacher characteristics on student academic achievement in Kisumu central Sub-County, Kenya. JEPER 2, 47–56.
Alanís, I. (2000). A Texas two-way bilingual program: its effects on linguistic and academic achievement. Biling. Res. J. 24, 225–248. doi: 10.1080/15235882.2000.10162763
Alea, L. A., Fabrea, M. F., Roldan, R. D. A., and Farooqi, A. Z. (2020). Teachers' COVID-19 awareness, distance learning education experiences and perceptions towards institutional readiness and challenges. Int. J. Learn. Teach. Educ. Res. 19, 127–144. doi: 10.26803/ijlter.19.6.8
Anderson, J. B., and Gerber, J. (2008). Fifty Years of Change on the US-Mexico Border: Growth, Development, and Quality of Life. Austin, TX: University of Texas Press.
Arreola, D. D. (2005). Forget the Alamo: the border as place in John Sayles' lone star. J. Cult. Geogr. 23, 23–42. doi: 10.1080/08873630509478230
Austin, P. C. (2011). An introduction to propensity score methods for reducing the effects of confounding in observational studies. Multivar. Behav. Res. 46, 399–424. doi: 10.1080/00273171.2011.568786
Banerjee, P. A. (2016). A systematic review of factors linked to poor academic performance of disadvantaged students in science and maths in schools. Cogent Educ. 3:1178441. doi: 10.1080/2331186X.2016.1178441
Bartanen, B. (2019). Identifying principal improvement. (EdWorkingPaper: 19-136). Available at: http://edworkingpapers.com/ai19-136
Belfi, B., Haelermans, C., and De Fraine, B. (2016). The long-term differential achievement effects of school socioeconomic composition in primary education: a propensity score matching approach. Br. J. Educ. Psychol. 86, 501–525. doi: 10.1111/bjep.12120
Blackmer, L. D. (2014). The relationship between selected teacher characteristics and student achievement in seventh-day adventist elementary schools in the United States. Doctoral dissertation. Retrieved from ProQuest Dissertations and Theses database. (UMI No. 3633934).
Bosworth, R. (2014). Class size, class composition, and the distribution of student achievement. Educ. Econ. 22, 141–165. doi: 10.1080/09645292.2011.568698
Brochin Ceballos, C. (2012). Literacies at the border: transnationalism and the biliteracy practices of teachers across the US–Mexico border. Int. J. Biling. Educ. Biling. 15, 687–703. doi: 10.1080/13670050.2012.699948
Brockmeier, L. L., Starr, G., Green, R., Pate, J. L., and Leech, D. W. (2013). Principal and school-level effects on elementary school student achievement. Int. J. Educ. Leadersh. Prep. 8, 49–61. doi: 10.1080/13670050.2012.699948
Capraro, M. M., Capraro, R. M., and Wiggins, B. B. (2000). An Investigation of the Effects of Gender, Socioeconomic Status, Race and Grades on Standardized Test Scores. Paper presented at Annual Meeting of the Southwest Educational Research Association (SERA), Dallas, Texas.
Cardichon, J., Darling-Hammond, L., Yang, M., Scott, C., Shields, P. M., and Burns, D. (2020). Inequitable Opportunity to Learn: Student Access to Certified and Experienced Teachers. Palo Alto, CA: Learning Policy Institute.
Carver-Thomas, D., and Darling-Hammond, L. (2017). Teacher Turnover: Why It Matters and What We Can do About It. Palo Alto, CA: Learning Policy Institute.
Cashman, T. G., and McDermott, B. R. (2013). International issues, high-stakes testing, and border pedagogy: social studies at border high school. Issues Teach. Educ. 22, 55–68.
Cattaneo, M. A., Oggenfuss, C., and Wolter, S. C. (2017). The more, the better? The impact of instructional time on student performance. Educ. Econ. 25, 433–445. doi: 10.1080/09645292.2017.1315055
Chu, J. H., Loyalka, P., Chu, J., Qu, Q., Shi, Y., and Li, G. (2015). The impact of teacher credentials on student achievement in China. China Econ. Rev. 36, 14–24. doi: 10.1016/j.chieco.2015.08.006
Curtis, C. (2012). Why do they choose to teach--and why do they leave? A study of middle school and high school mathematics teachers. Education 132, 779–789.
de La Piedra, M. T., and Guerra, J. C. (2012). The literacy practices of transfronterizos in a multilingual world. Int. J. Biling. Educ. Biling. 15, 627–634. doi: 10.1080/13670050.2012.699944
Dhuey, E., and Smith, J. (2014). How important are school principals in the production of student achievement? Can. J. Econ. 47, 634–663. doi: 10.1111/caje.12086
Dow, P. A. (2008). Dual-Language Education: A Longitudinal Study of Students' Achievement in an El Paso County, Texas School District. Doctoral Dissertation. The University of Texas at El Paso, El Paso, TX.
Echazarra, A., and Radinger, T. (2019). Learning in rural schools: insights from PISA, TALIS and the literature. OECD Education Working Papers, No, 196, OECD Publishing.
Farooq, M. S., Chaudhry, A. H., Shafiq, M., and Berhanu, G. (2011). Factors affecting students’ quality of academic performance: a case of secondary school level. J. Qual. Technol. Manage. 7, 1–14.
Francis, G. L., Duke, J. M., Brigham, F. J., and Demetro, K. (2018). Student perceptions of college-readiness, college services and supports, and family involvement in college: an exploratory study. J. Autism Dev. Disord. 48, 3573–3585. doi: 10.1007/s10803-018-3622-x
Gay, G. (2015). The what, why, and how of culturally responsive teaching: international mandates, challenges, and opportunities. Multicult. Educ. Rev. 7, 123–139. doi: 10.1080/2005615X.2015.1072079
Geenen, S., Powers, L. E., and Lopez-Vasquez, A. (2005). Barriers against and strategies for promoting the involvement of culturally diverse parents in school-based transition planning. J. Vocat. Spec. Needs Educ. 27, 4–14.
Gieselmann, S. (2009). Principals and school factors that impact elementary school student achievement. Mid-Western Educ. Res. 22, 16–22.
Graham, S. E., and Provost, L. E. (2012). Mathematics achievement gaps between suburban students and their rural and urban peers increase over time. Issue Brief No. 52. Carsey Institute. Available at: https://scholars.unh.edu/carsey/172/
Grissom, J. A., and Bartanen, B. (2019). Principal effectiveness and principal turnover. Education Finance and Policy 14, 355–382. doi: 10.1162/edfp_a_00256
Guo, S., and Fraser, M. W. (2014). Propensity Score Analysis: Statistical Methods and Applications. 11). Thousand Oaks: SAGE Publications.
Henry, G. T., and Redding, C. (2020). The consequences of leaving school early: the effects of within-year and end-of-year teacher turnover. Educ. Finance Policy 15, 332–356. doi: 10.1162/edfp_a_00274
Hill, A., and Hirshberg, D. (2008). Turnover among alaska teachers: Is it changing? Institute of Social and Economic Research, University of Alaska Anchorage. Report: 69. Available at: https://scholarworks.alaska.edu/bitstream/handle/11122/4386/RS69.pdf?sequence=1&isAllowed=y
Huebener, M., Kuger, S., and Marcus, J. (2017). Increased instruction hours and the widening gap in student performance. Labour Econ. 47, 15–34. doi: 10.1016/j.labeco.2017.04.007
Huff, T. S., Brockmeier, L. L., Leech, D. W., Martin, E. P., Pate, J. L., and Siegrist, G. (2011). Principal and school-level effects on student achievement. Nat. Teach. Educ. J. 4, 67–79.
Koc, N., and Celik, B. (2015). The impact of number of students per teacher on student achievement. Procedia Soc. Behav. Sci. 177, 65–70. doi: 10.1016/j.sbspro.2015.02.335
Ladd, H. F., and Sorensen, L. C. (2017). Returns to teacher experience: student achievement and motivation in middle school. Educ. Finance Policy 12, 241–279. doi: 10.1162/EDFP_a_00194
Lilienfeld, S. O., McKay, D., and Hollon, S. D. (2018). Why randomised controlled trials of psychological treatments are still essential. Lancet Psychiatry 5, 536–538. doi: 10.1016/S2215-0366(18)30045-2
Martinez, O. J. (2010). “The U.S.-Mexico border economy” in The Colonias Reader: Economy, Housing, and Public Health in U.S.-Mexico Border Colonias. eds. A. J. Donelson and A. X. Esparza (Tucson, AZ: The University of Arizona Press), 15–29.
McRobbie, J., and Villegas, M.. (2004). La Frontera: Challenges and Opportunities for Improving Education along the US-Mexico Border. San Francisco, CA: WestEd.
Mehana, M., and Reynolds, A. J. (2004). School mobility and achievement: A meta-analysis. Children and Youth Services Review 26, 93–119. doi: 10.1016/j.childyouth.2003.11.004
Mein, E., and Esquinca, A. (2014). Bilingualism as a resource in learning engineering on the US–Mexico border. Action Teach. Educ. 36, 247–260. doi: 10.1080/01626620.2014.917366
Méndez, Z. Y., and Staudt, K. (2013). Transnationalism at the border: students’ experiences in border schools. Int. J. Qual. Stud. Educ. 26, 257–262. doi: 10.1080/09518398.2012.762476
Milner, H. R. (2012). Understanding urban education from the outside in and inside out. Urban Educ. 47, 1019–1024. doi: 10.1177/0042085912463858
Morgan, P. L., Frisco, M. L., Farkas2, G., and Hibel, J. (2017). Republication of “a propensity score matching analysis of the effects of special education services”. J. Spec. Educ. 50, 197–214. doi: 10.1177/0022466916686105
National Center for Education Statistics (2019). The Condition of Education. U.S. Department of Education. Institute of Education Sciences, National Center for Education Statistics. Available at: https://nces.ed.gov/programs/coe/indicator_cgf.asp
Nichols, S., Glass, G., and Berliner, D. (2012). High-stakes testing and student achievement: updated analyses with NAEP data. Educ. Policy Anal. Arch. 20:20. doi: 10.14507/epaa.v20n20.2012
Obradović, J., Long, J. D., Cutuli, J. J., Chan, C. K., Hinz, E., Heistad, D., et al. (2009). Academic achievement of homeless and highly mobile children in an urban school district: longitudinal evidence on risk, growth, and resilience. Dev. Psychopathol. 21, 493–518. doi: 10.1017/S0954579409000273
Orraca, P., Rocha, D., and Vargas, E. (2017). Cross-border school enrolment: associated factors in the US–Mexico borderlands. Soc. Sci. J. 54, 389–402. doi: 10.1016/j.soscij.2017.07.008
Ostorga, A. N., and Farruggio, P. (2020). Preparing bilingual teachers on the US/Mexico border: including the voices of emergent bilinguals. Int. J. Biling. Educ. Biling. 23, 1225–1237. doi: 10.1080/13670050.2018.1438348
Paik, S., and Phillips, R. (2002). Student Mobility in Rural Communities: What Are the Implications for Student Achievement? Naperville, IL: North Central Region Educational Laboratory
Peterson, J., Bruce, J., Patel, N., and Chamberlain, L. J. (2018). Parental attitudes, behaviors, and barriers to school readiness among parents of low-income Latino children. Int. J. Environ. Res. Public Health 15:188. doi: 10.3390/ijerph15020188
Richardson, C., and Pisani, M. J. (2012). The Informal and Underground Economy of the South Texas Border. Austin, TX: University of Texas Press.
Ronfeldt, M., Loeb, S., and Wyckoff, J. (2013). How teacher turnover harms student achievement. Am. Educ. Res. J. 50, 4–36. doi: 10.3102/0002831212463813
Rosenbaum, P. R., and Rubin, D. B. (1983). The central role of the propensity score in observational studies for causal effects. Biometrika 70, 41–55. doi: 10.1093/biomet/70.1.41
Rumberger, R. W. (2003). The causes and consequences of student mobility. J. Negro Educ. 72, 6–21. doi: 10.2307/3211287
Rumberger, R. W. (2015). Student Mobility: Causes, Consequences, and Solutions. Boulder, CO: National Education Policy Center.
Sauceda, A. K. (2017). The Effect of Teacher Degree Level, Teacher Certification, and Years of Teacher Experience on Student Achievement in Middle School Mathematics [dissertation]. Baldwin, Kansas: Baker University.
Schneider, B., Martinez, S., and Owens, A. (2006). Barriers to Educational Opportunities for Hispanics in the United States. Hispanics and the Future of America, Washington, DC: National Academies Press. 179–227.
Schwartz, A. E., Stiefel, L., and Chalico, L. (2009). The Multiple Dimensions of Student Mobility and Implications for Academic Performance: Evidence from New York City Elementary and Middle School Students. New York: Education Finance Research Consortium, New York State Education Department
Sindelar, P. T., Pua, D. J., Fisher, T., Peyton, D. J., Brownell, M. T., and Mason-Williams, L. (2018). The demand for special education teachers in rural schools revisited: an update on progress. Rural Spec. Educ. Q. 37, 12–20. doi: 10.1177/8756870517749247
Sloat, E. F., Makkonen, R., and Koehler, P. (2007). La Frontera: Student Achievement in Texas Border and Nonborder Districts. Washington, DC, USA: National Center for Education Evaluation and Regional Assistance, Institute of Education Sciences, US Department of Education.
Smith, P. H., and Murillo, L. A. (2012). Researching transfronterizo literacies in Texas border colonias. Int. J. Biling. Educ. Biling. 15, 635–651. doi: 10.1080/13670050.2012.699945
Sullivan, A. L., and Field, S. (2013). Do preschool special education services make a difference in kindergarten reading and mathematics skills?: a propensity score weighting analysis. J. Sch. Psychol. 51, 243–260. doi: 10.1016/j.jsp.2012.12.004
Tang, S., Tong, F., and Lu, X. (2019a). Gifted and talented services for EFL learners in China: a step-by-step guide to propensity score matching analysis in R. Data 4:119. doi: 10.3390/data4030119
Tang, S., Wang, Z., and Min, Y. (2019b). Texas–Mexico border vs. non-border school districts’ growth trajectory of high-stakes Reading performance: a multi-level approach. Educ. Sci. 9:38. doi: 10.3390/educsci9010038
Tang, S., Wang, Z., and Sutton-Jones, K. L. (2021a). A multi-level analysis of upper elementary students’ performance on the STAAR reading exam: comparing growth trajectories of rural and non-rural school districts. Educ. Stud., 1–24. doi: 10.1080/03055698.2021.1894414
Tang, S., Wang, Z., and Sutton-Jones, K. L. (2021b). A multilevel study of the impact of district-level characteristics on Texas student growth trajectories on a high-stakes math exam. Mathematics 9:8. doi: 10.3390/math9010008
TEA (2018). Rural Education Initiative or REAP. Available at: https://tea.texas.gov/finance-and-grants/grants/essa-program/title-v-part-b-rural-education-initiative-or-reap
TEA (2019). STAAR Performance Standards. Available at: https://tea.texas.gov/student-assessment/testing/staar/staar-performance-standards
Tekniepe, R. J. (2015). Identifying the factors that contribute to involuntary departures of school superintendents in rural America. J. Res. Rural Educ. 30:1.
Tella, A. (2008). Teacher variables as predictors of academic achievement of primary school pupils mathematics. Int. Electron. J. Elem. Educ. 1, 16–33.
Tessman, D. (2016). Narrations from the US-Mexico Border: Transfronterizo Student and Parent Experiences with American Schools. Tucson, AZ: The University of Arizona Press.
Texas Education Agency (2020). Serving Emergent Bilingual Students. Available at: https://tea.texas.gov/sites/default/files/gen-27-english-learner-support.pdf
Walker, A. C. (2017). A Correlation Study of PK12 Teacher Experience, Education Level, Turnover, and Student Achievement. Doctoral dissertation, Northcentral University.
Wang, Z. (2020). The investigation of effective intervention on Texas border and non-border kindergarten English learners’ English Oral language development. Doctoral dissertation, Texas A&M University
Keywords: 5th grade, academic performance, propensity score matching, Texas–Mexico border, standardized test achievement
Citation: Wang Z, Tang S and Luo F (2023) A comparative study of Texas–Mexico border vs. non-border students’ achievement on high-stakes state test: A propensity score matching method. Front. Educ. 8:1010009. doi: 10.3389/feduc.2023.1010009
Edited by:
David Ansong, University of North Carolina at Chapel Hill, United StatesReviewed by:
Anica Gwenell Bowe, Rutgers University, Newark, United StatesJamal Appiah-Kubi, Ankara Yıldırım Beyazıt University, Türkiye
Copyright © 2023 Wang, Tang and Luo. This is an open-access article distributed under the terms of the Creative Commons Attribution License (CC BY). The use, distribution or reproduction in other forums is permitted, provided the original author(s) and the copyright owner(s) are credited and that the original publication in this journal is cited, in accordance with accepted academic practice. No use, distribution or reproduction is permitted which does not comply with these terms.
*Correspondence: Zhuoying Wang, ✉ emh1b3lpbmd3YW5nMDUzMEBnbWFpbC5jb20=