 Abel Antonio Chávez
Introduction
Many in higher education know the headlines surrounding the handful of metrics Institutions of Higher Education (IHEs) commonly use to tout how well they serve students. In the United States (US) for example that includes the 66% of high school graduates who immediately enroll in postsecondary education upon graduation; 44% in four-year institutions, and 22% in two-year institutions (NCES, 2021). In the bundle of common metrics is also overall first-year retention, or the number of students returning to the same institution for their second year, which is reported as 62%, with notable differences by student and school type, and enrollment intensity (i.e., part-time vs. full-time) (NSCRC, 2019). Persistence, or the number of students returning to any IHE for their second year, hovers around 74%, is also among these common metrics (NSCRC, 2019). Also commonly reported by IHEs are graduation rates, specifically 150% of normal time to completion, currently reported at 64% at four-year institutions and 36% at two-year institutions (NCES, 2022a). These data are certainly flush with opportunities for improvement, and stronger alignment between IHEs, learners, and stakeholders.
Some students and families may monitor and understand the above metrics, but the vast majority of families prioritize a distinct set of performance metrics. Typically, students and families adopt a set of metrics to track their success that include, cost of attendance, student success services provided by an institution, job prospects at graduation, wages at graduation and again at five- and ten-years post completion, among many others. Admittedly, outcomes for any of these metrics vary according to a range of variables, including race/ethnicity, gender, and socio-demographics, to name a few. The thought of IHEs and their customers – students and families – employing a distinct set of “success” metrics presents a clear opportunity at a time where alignment, and agreement, is critically necessary across all stakeholders. Higher education needs a unifying and consensus-building framework that is grounded in institutional data to drive alignment with students and families.
A need to improve higher education
Metrics alignment may be one step in mitigating the growing evidence suggesting the public is down on higher education. Gallup revealed that 46% of parents encourage their students to pursue non-four-year postsecondary pathways (Hrynowski, 2021). This coming on the heels of presumably three triggers; One: the global pandemic has disrupted routines and has clearly reset expectations to the point that many demand convenience, service, and quality; all at low cost; Two: between 2011 and 2021, IHE tuition and fees rose by 7, 9, and 14%, at 2-year, 4-year publics, and 4-year private institutions, respectively (CollegeBoard, 2022); and Three: even though education's payback is clear (CEW, 2021), the public's perception of education's payback is mixed (Dann, 2017). The reality is that our institutions of higher education have a history of working for some. Contrast that to today's rapid shifting in learner profile which is intensifying the need that our institutions must work for all who choose them.
Since 2010, total enrollment in US IHEs has declined 10%, to nearly 19 million (NCES, 2022b). During this time Hispanic enrollment has increased 34%; enrollment of Blacks has decreased by 22%, after a 38% increase between 2000 and 2020; and enrollment of Whites has decreased by 23% (NCES, 2022b). An estimated 56% of students enrolled in US IHEs are first-generation college students; first-generation defined here as students whose parents do not have a bachelor's degree (The Center, 2022). Median household incomes have increased a modest 15% in the last decade (US Census, 2022). Only 47% of all students enrolled in higher education are the traditional 18–24-year-old full-time learner; conversely, nearly 53% of all enrolled students are non-traditional. These non-traditional students are more likely to be commuters, hold one or multiple jobs, be head of households and primary bread-winners, be married and/or parents, and with responsibilities beyond academics (NCES, 2022c). It is reasonable to expect this non-traditional student does not live on-campus, distinctly interacts with the campus and campus-life, and demands a different degree of service from the institutions they attend. In short, serving students today and tomorrow is unlike serving students yesterday, and IHEs must rapidly adapt.
Today's students are vastly more diverse and expect modularization, customization, and personalization of their education and experience, choosing when and how to engage. In a world where most, in and out of academia, expect customization and personalization in one's personal lives, embracing the uniqueness of an increasingly diverse student body and tailoring those experiences along the educational life-cycle will enhance institutional, and student, success. Achieving this sort of coupled success, for the institution and students, will require a robust set of student-centered analytics to rigorously assess institutions, while providing IHEs with a set of diagnostics that more clearly identify the opportunities to serve students, especially those potentially struggling. Said diagnostics for assessment should be holistic, and thus, life-cycle based.
Multidisciplinary insights to improve higher education
In engineering, life-cycle assessments (LCA) are a methodological approach applied for holistically understanding impacts associated with a good or service, from extraction to production to use, or cradle-to-grave. Akin to goods and services, institutions of higher education and their students have corresponding life-cycles, too. Life-cycle thinking should include holistic measurement and tracking of the factors that often impede postsecondary access and matriculation; factors that hinder progress, completion and attainment; and post-graduation outcomes. One can extend this concept one step further and consider the metaphor of a pipeline toward a holistic understanding of our higher education system.
The use of pipelines is everywhere; their networks deliver fuel, energy, and water to our stores, workplaces, and homes. Some pipeline networks are linear, with minimal to no bends — the preferred design to reduce viscous flow — but a linear pipeline is an unreasonable expectation. While the bends in pipelines are necessary, they ultimately reduce efficiency flow. Take for example the bend underneath any kitchen sink, called the trap, that among its purposes is to stop heavy items from entering the plumbing system. Additionally, all pipelines employ the use of valves to regulate liquid flow through the system.
Higher education resembles many of the attributes embedded in life-cycles and pipelines. Coupling the concepts of life-cycles with pipelines yield insights for institutional leaders, governing boards, and governments to lever that understanding to enhance success. Adopting both concepts lend to a much-needed holistic perspective of higher education beginning with pre-access, to matriculation, through completion and attainment, and post-graduation. For example, DFWI courses are a clear display of higher education's flow regulating valve. DFWI courses are those courses with a preponderance and history of learners with D, or F, or W (withdrawal), or I (incomplete) grades; institutional DFWI rates average between 15 and 30% (Attis, 2017), and courses in STEM and English consistently have the highest DFWI rates (Gordon, 2021). Or consider the array of student needs such as food scarcity, housing insecurity, transportation for travel to/from campus, technology to actively engage in or complete coursework, or childcare; like the function of traps in plumbing systems, any of these needs result as common traps for today's students. Lastly, understanding the multitude of reasons for not accessing higher education, perhaps due to an inability to gain decision maker buy in, mother or grandmother in some cultures (Comeaux et al., 2020), gives way to positively affecting all other stages of the life-cycle.
Discussion
Alas, it is incumbent on us, all institutional leaders, to identify, record, and track the factors that impede progress and enhance our ability to measure the myriad of factors as students flow through the metaphorical pipeline, at each life-cycle stage. Hence the need for the Life-Cycle Educational Assessment Pipeline (LEAP) for higher education, a life-cycle based assessment and policy-relevant framework that leverages institutional data already captured by most schools to enhance and drive toward school and student success. The LEAP framework is shown in Figure 1. Adopting LEAP maximizes scarce IHE resources, surgically creates a student-centered approach that serves students while nurturing their success, and enables intentional student support as the diversity of students navigate their realities. This holistic life-cycle based framework, LEAP, will yield institutional, and student, success in three important ways:
1) LEAP will provide institutions with a clear and nuanced understanding of the needs and opportunities to serve their students. For example, as depicted in Figure 1, said needs can be curricular, financial, or social;
2) Institutions will be able to use the power of data to tailor and target services to students, measuring and tracking outcomes over time. LEAP offers specific data-based metrics, such as DFWI courses and time to completion found in the curricular cluster, or food, housing, and transportation located in the needs cluster, that allow for IHE precision; and
3) Ultimately, the above two will reduce the barriers afflicting students throughout the life-cycle, helping drive important gains for IHEs and learners.
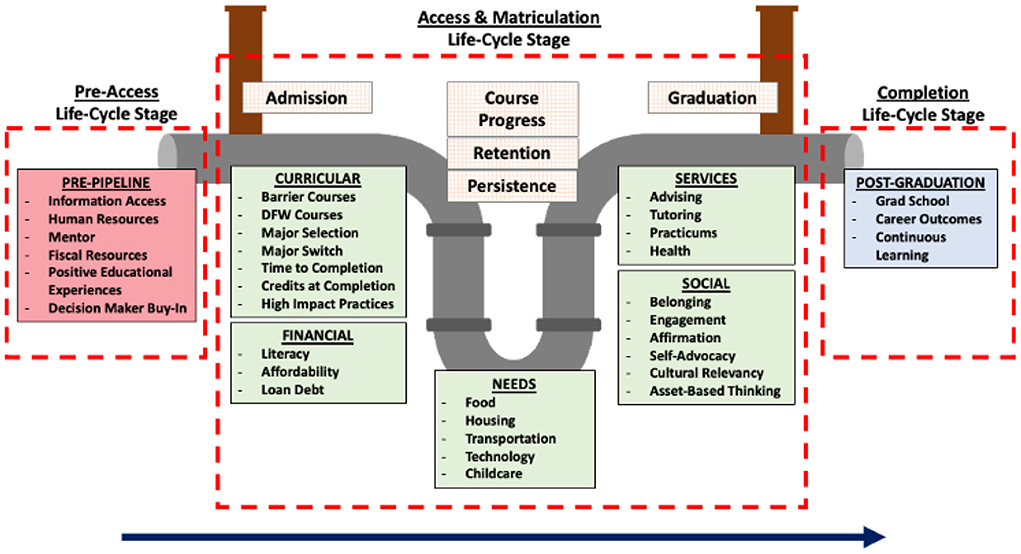
Figure 1. The Life-Cycle Educational Assessment Pipeline (LEAP) is a life-cycle based assessment framework for institutions of higher education to leverage institutional data to enhance and drive toward school and student success. LEAP is comprised of three life-cycle stages: Pre-Access, Access and Matriculation, and Completion. Residing in each life-cycle stage are measurement cluster(s) that track specific school and student success measures. The red box at Pre-Access is the pre-pipeline cluster which captures the factors inhibiting access to higher education. Following access, the green boxes at Access and Matriculation capture the factors affecting student progress, many of which negatively affect retention and persistence. The orange checkered boxes in Access and Matriculation represent the measures typically reported by IHEs. The blue box at Completion is the cluster capturing the post-graduation trackable measures.
LEAP is conceived and intended for IHEs, designed through a school and student centric lens with the intention of propelling higher education into a new era. Subsequent work will apply case-studies to detail each of the proposed measurements (i.e., the colored boxes with sub-items in Figure 1) in a national context. An additional next step includes applying proven frameworks, like the OKR (Objective and Key Results) framework (Panchadsaram, 2022), to formulate institution-specific key results to aid in institutional goal setting and goal achievement that drive the holistic nature of LEAP forward. Finally, institutions should endeavor to understanding the measurement clusters (the colored boxes with sub-items in Figure 1) and their measurements in the context of institution type, e.g., 2-year schools, public 4-year, and private 4-year non-profit, and student variables, e.g., race/ethnicity, gender, and socio-demographics. It is time we align and build consensus for school and student success.
Author contributions
AC conceived the LEAP Framework and is the sole author of this work.
Acknowledgments
I am so deeply grateful to the many individuals who have provided me with their valuable feedback and critiques. Each of you have played an instrumental role in creating LEAP, a framework that will serve as an important catalyst to improving our education system everywhere.
Conflict of interest
The author declares that the research was conducted in the absence of any commercial or financial relationships that could be construed as a potential conflict of interest.
Publisher's note
All claims expressed in this article are solely those of the authors and do not necessarily represent those of their affiliated organizations, or those of the publisher, the editors and the reviewers. Any product that may be evaluated in this article, or claim that may be made by its manufacturer, is not guaranteed or endorsed by the publisher.
References
Attis, D., Delamater, A., Silverman, A., Hinnenkamp, K., and Koproske, C. (2017). The Course Completion Playbook: Analyses and Tools to Improve Student Outcomes in Critical Gateway Courses. Washington, DC: EAB. Available online at: https://umaine.edu/provost/wp-content/uploads/sites/14/2018/12/Course-Completion-Playbook.pdf
CEW (2021). A First Try at ROI: Ranking 4,500 Colleges. CEW Georgetown. Available online at: https://cew.georgetown.edu/cew-reports/collegeroi/ (accessed April 15, 2022).
CollegeBoard (2022). Trends College Pricing – College Board Research. Available online at: https://research.collegeboard.org/trends/college-pricing (accessed April 15, 2022).
Comeaux, E., Chapman, T. K., and Contreras, F. (2020). The college access and choice processes of high-achieving african american students: a critical race theory analysis. Am. Educ. Res. J. 57, 411–439. doi: 10.3102/0002831219853223
Dann, C. (2017). Worth the Price Tag? Americans Split on Value of 4-year College Degree. NBC News. Available online at: https://www.nbcnews.com/politics/first-read/americans-split-whether-4-year-college-degree-worth-cost-n799336 (accessed April 15, 2022).
Gordon, L. (2021). California State University Courses With High Failure and Withdrawal Rates Prompt Calls for Reform. EdSource. Available online at: https://edsource.org/2021/did-failing-a-tough-course-delay-your-csu-graduation-join-the-club/659556 (accessed April 15, 2022).
Hrynowski, Z. (2021). Nearly Half of U.S. Parents Want More Noncollege Paths. Gallup.com. Available online at: https://news.gallup.com/poll/344201/nearly-half-parents-noncollege-paths.aspx (accessed April 15, 2022).
NCES (2021). Immediate College Enrollment Rate. National Center for Education Statistics. Available online at: https://nces.ed.gov/programs/coe/indicator/cpa (accessed April 15, 2022).
NCES (2022a). Graduation and Retention Rates Trend Generator. National Center for Education Statistics. Available online at: https://nces.ed.gov/ipeds/TrendGenerator/app/answer/7/20 (accessed April 15, 2022).
NCES (2022b). Table 306.10. Total Fall Enrollment in Degree-granting Postsecondary Institutions, by Level of Enrollment, Sex, Attendance Status, and Race/Ethnicity or Nonresident Alien Status of Student: Selected Years, 1976 Through 2020. Available online at: https://nces.ed.gov/programs/digest/d21/tables/dt21_306.10.asp?current=yes (accessed April 15, 2022).
NCES (2022c). Table 303.45. Total Fall Enrollment in Degree-granting Postsecondary Institutions, by Level of Enrollment, Sex, Attendance Status, and Age of Student: 2015, 2017, and 2019. Available online at: https://nces.ed.gov/programs/digest/d20/tables/dt20_303.45.asp?current=yes (accessed April 15, 2022).
NSCRC (2019). Persistence and Retention - 2019. National Student Clearinghouse Research Center. Available online at: https://nscresearchcenter.org/snapshotreport35-first-year-persistence-and-retention/ (accessed April 15, 2022).
Panchadsaram, R. (2022). What is an OKR? Definition and Examples. What Matters. Available online at: https://www.whatmatters.com/faqs/okr-meaning-definition-example/ (accessed April 15, 2022).
The Center. (2022). National Data Fact Sheets. Center for First-Generation Student Success. Available online at: https://firstgen.naspa.org/journal-and-research/national-data-fact-sheets-on-first-generation-college-students/national-data-fact-sheets (accessed April 15, 2022).
US Census. (2022). Income and Poverty in the United States: 2020. Census.gov. Available online at: https://www.census.gov/library/publications/2021/demo/p60-273.html (accessed April 15, 2022).
Keywords: higher education, student success, educational equity, educational leadership, life-cycle thinking, data informed leadership
Citation: Chávez AA (2022) Increasing access, reducing barriers, and providing enhanced outcomes: Life-cycle thinking in education. Front. Educ. 7:948399. doi: 10.3389/feduc.2022.948399
Received: 19 May 2022; Accepted: 29 August 2022;
Published: 15 September 2022.
Edited by:
Arkalgud Ramaprasad, University of Illinois at Chicago, United StatesReviewed by:
Liana Beattie, Edge Hill University, United KingdomAshwini Jadhav, University of the Witwatersrand, South Africa
Copyright © 2022 Chávez. This is an open-access article distributed under the terms of the Creative Commons Attribution License (CC BY). The use, distribution or reproduction in other forums is permitted, provided the original author(s) and the copyright owner(s) are credited and that the original publication in this journal is cited, in accordance with accepted academic practice. No use, distribution or reproduction is permitted which does not comply with these terms.
*Correspondence: Abel Antonio Chávez, YWFjaGF2ZXpAb2xsdXNhLmVkdQ==