 Nikola Ebenbeck
 Markus Gebhardt
94% of researchers rate our articles as excellent or good
Learn more about the work of our research integrity team to safeguard the quality of each article we publish.
Find out more
ORIGINAL RESEARCH article
Front. Educ., 23 November 2022
Sec. Assessment, Testing and Applied Measurement
Volume 7 - 2022 | https://doi.org/10.3389/feduc.2022.945733
Introduction: Adaptive tests have advantages especially for children with special needs but are rarely used in practice. Therefore, we have investigated for our web-based progress-monitoring platform
Methods: We used existing items fitted to the Rasch model and data samples of progress monitoring tests (N = 681) for mathematics and reading to create two item pools for adaptive testing. In a simulation study (N = 4,000), we compared different test lengths and test accuracies as stopping rules with regard to an inclusive use of adaptive testing.
Results: The results show an optimal maximum test length of 37 and 24 items, with a target standard error for accuracy of 0.5. These results correspond to an average execution time of about 3 min per test.
Discussion: The results are discussed in terms of the use of adaptive testing in inclusive settings and the applicability of such adaptive tests as screenings, focusing mainly on students with special needs in learning, language, or behavior.
Diagnostic assessments are a relevant part of the education for students with disabilities, which can support teachers in monitoring and assessing students’ learning progress in the classroom (Köller, 2005; Anderson et al., 2020). If used at the beginning of a school year or unit, they can provide teachers with the current learning status of the students. In this way, teachers can base their lessons and support on the students’ existing knowledge or skills to respond in a more individual way to their needs.
All teachers use classroom-based assessments to measure learning levels and progress in order to make data-based support decisions (Guskey, 2003). Normally, teachers assess their students’ abilities themselves and their own judgement is the primary source of information on the learning development of their students. For this purpose, they use many different instruments, such as “oral questioning of students, observation, written work products, oral presentations, interviews, projects, portfolios, tests, and quizzes” (Shepard et al., 2007, S. 275) as well as standardized instruments normalized to the total population (Ferrara and DeMauro, 2006).
Four types of standardized diagnostic assessments (Hasbrouck and Tindal, 2006) can be distinguished. Screenings are short assessments conducted at the beginning of the school year. In order to identify struggling students or students with a risk to struggle, screenings focus on skills that predict their future development of performance in skill areas such as reading. Diagnostic measures are “assessments conducted at any time during the school year when a more in-depth analysis of a student’s strengths and needs is necessary to guide instructional decisions” (Hasbrouck and Tindal, 2006). Tests of this type are also used to determine special needs of students and to decide if students should attend a special or a general school or class. Outcome measures are used to check whether students have met a class or school goal. Progress monitoring measures are short tests that document student learning through regular administration. The results are used to evaluate support or identify students who are not responding to support. Tests with a fixed time limit in which as many tasks as possible must be answered correctly are often used for this purpose (Jungjohann et al., 2018; Anderson et al., 2020). The use of screenings and short reliable tests such as progress monitoring measures have not been widely adopted by the general teaching profession, especially at primary level. Instead, such standardized instruments which take less time to be administered, are clearer to interpret and more comparable are used more frequently by special educators and school psychologists.
Regardless of the test type, most assessments in school are conducted as pencil-paper versions. In part, they are supplemented or replaced by digital testing which can perform complex assessments and evaluations automatically and quickly. Also, digital testing offers new ways of item presentation, test administration, test scoring, test reporting, and interpretation (Green, 1983; Neumann et al., 2019). In the last few years, it could more and more be ascertained that digital testing is more comfortable and motivating for students than paper-pencil tests (Bayazit and Aşkar, 2012; Blumenthal and Blumenthal, 2020). As digital testing reduces additional work connected with test executions and allows for automated interpretation of test results, it can support teachers in carrying out their diagnostic tasks, e.g., in terms of data-based decision making (Blumenthal and Blumenthal, 2020). In any case, the development of digital or computerized testings is currently still in its infancy in schools.
In general, the accuracy of teachers’ assessments fits more roughly than exactly especially when teachers are insufficiently informed about the assessment material. In such cases, the correlations between teachers’ judgement and students’ performance have only a mean effect size of 0.61 (Südkamp et al., 2012). When teachers use standardized instruments, the comparability and reliability of tests are better, but such tools are often not suitable for the use in special and inclusive settings. To measure reliably, standardized instruments must have a certain length. As children with special needs often work more slowly, they need more time to complete the tests. This puts children with attention difficulties, learning disabilities, or concentration problems at a disadvantage and also makes test handling more difficult, as everyday inclusive teaching is characterized by limited time and personnel resources (Pool Maag and Moser Opitz, 2014). Secondly, standardized and norm-oriented tests only measure children whose performance is in the middle range of the norm, i.e., in the 50th percentile, with high discriminatory power. For these children, the tests work well and produce meaningful and reliable results. Children with significantly lower or higher competences record these tests much more inaccurately and unreliably, as there are fewer items in a suitable difficulty for them (Baker, 2001, S. 85–113). The tests are therefore not suitable for this group of students and there is a risk of over- or under-challenging.
Various approaches have been developed to improve this situation. Children with special needs in mental development or learning have limited concentration time. Modern diagnostic views thus focus on short tests and formative assessments, such as screenings and progress monitoring (Berkeley et al., 2009; Voß et al., 2014; Anderson et al., 2020). Within formative assessment, only a few important skills, such as reading competence or mathematical basics, are tested. These tests are repeated regularly and at short intervals in order to have a meaningful basis for educational decisions (Deno, 2016). Short tests with duration of a few minutes are easier to use in everyday teaching and do not put children with concentration difficulties at an additional disadvantage due to a long execution time. An administration time of 3–5 min has proved to be optimal in order to collect enough items for good reliability and to still be within the children’s concentrated processing time (Ebenbeck et al., submitted).1 The exact length depends on various factors, as the tests need to be long enough to measure meaningfully, reliably, and comparably, but short enough to meet special educational objectives and be usable in the classroom (Schurig et al., 2021).
To make testing even more efficient, adaptive testing is another approach, which is more and more considered for assessments in schools. If the exact performance level of the student is unknown, adaptive tests have a clear advantage because they can test multiple domains in less time. Adaptive tests are tests tailored to the student’s circumstances. In a broader sense, the difficulty of the tasks or the tasks themselves is adapted to the student, the context, the time, or the purpose (Frey, 2019; Mislevy, 2019). In a narrower sense, adaptive testing is a type of assessment in which the child is not asked all the questions, but only those that correspond to his or her performance level and are therefore the most meaningful ones. Adaptive testing is more precise and reliable than linear testing, can improve individual learning (Chang, 2015), and allows all students to reach and redefine their potential (Stocking, 1969; Green, 1983).
Analog adaptive testing does exist (Kubinger, 2004; Roid and Barram, 2004), but it has not been able to gain acceptance in practice over linear testing because analog handling of adaptive testing is much more laborious than linear testing. That is why adaptive tests are nowadays mainly computer- or tablet-based (Frey and Hartig, 2013). Digital implementation of adaptive testing relieves teachers in the test situation and allows them to better concentrate on the specific needs and problems of the students (Chang, 2015). In comparison to a paper pencil test, the efficiency (with a balanced relation between length and accuracy) can increase by up to 19% (Ludewig et al., 2022) and the time required to complete a digital adaptive test is reduced by 50% (Weiss, 1985), which is why pupils with concentration difficulties, intelligence deficits, or performance deficits can benefit particularly (Stone and Davey, 2011). The motivation of students with low expectations of success is increased through digital adaptive testing (Asseburg, 2011). Due to the absence of negative test administration effects, an increase in the performance and well-being of the students during the test can also be assumed (Otterpohl and Schwinger, 2015). Overall, digital adaptive testing can be expected to be shorter, more accurate, more reliable, more individualized and less error-prone.
To enable digital adaptive testing, Computerized Adaptive Testing (CAT) based on Item-Response-Theory (IRT) is an often-used procedure (Bulut and Cormier, 2018; Eggen, 2018).
Item-Response-Theory, much as the classical test theory (CTT), is a psychometric theory underlying the creation of items and the interpretation of test scores. The basic idea of IRT is the assumption that the probability of solving an item depends on a person’s ability in the domain being measured and the item’s difficulty. Thus, for each item and person, it can be determined with what probability the item will be solved by that person. A person with higher ability can be assumed to have a higher probability of solving the item. There are different models of the IRT, which can vary in their dimensionality and the assumed item parameters. If, for example, the Rasch model (Rasch, 1960) is used, all items in the item pool measure the same latent characteristic and only differ in their difficulty. The Rasch model assumes that the items are unidimensional and therefore capture only one latent variable. Furthermore, the items are independent of each other.
This interplay of person ability, item difficulty, and resulting solution probability can be used as the basis for CAT. CAT is a type of test in which the student’s response behavior determines the difficulty of the items in the test run. If the answer is correct, a more difficult item is presented, if the answer is incorrect, an easier item is drawn next. In the course of the test, the item difficulty thus levels off at the student’s ability level (Meijer and Nering, 1999). CAT can also be constructed based on CTT or using machine learning.
Basic components of IRT-based CAT are a calibrated item pool, a starting rule for the selection of the first item, the item selection algorithm which selects the following items based on the estimation of the person’s ability, and a stopping rule or multiple stopping rules for the termination of the test run (Thompson and Weiss, 2009). A suitable item pool is an important basis for adaptive testing. A larger item pool is better for CAT, but it also must be well balanced and wide enough to be able to differentiate between different levels of performance. It therefore needs to comprise items of different levels, from very easy to very difficult (Magis and Raîche, 2012). Also, it must be adapted to the target group and the objectives of the test. For example, a test in the field of special education needs to have a larger number of easier items for weak students, to estimate their ability exactly (Gebhardt et al., 2015). Since it is necessary to have separate information for each item, e.g., about its difficulty, the item pool must be calibrated using IRT (Meijer and Nering, 1999). Different starting rules are available to select the very first item of a test run. It is possible to, e.g., include previous information about the test taker, to choose an item whose difficulty is as close as possible to the person’s ability, or to choose randomly from several starting items. The order of the items is determined for each test run based on the students’ answers. The next item selected is always the one that can provide the most information about the person’s ability. To estimate the person’s ability after each response, Bayes estimators, weighted likelihood and maximum likelihood are the ones the most commonly used. To select the next item, various methods are available, with the maximum Fisher information, the Urry’s Rule, the maximum likelihood weighted information, and the maximum posterior weighted information being among the (most) common choices. When using a Rasch-calibrated item pool, the use of maximum Fisher information seems to be the most common and statistically optimal choice (e.g., Lange, 2008; Reckase, 2010; Eggen, 2013). Items are drawn until a stopping rule takes effect or until there are no items left in the pool. For example, CAT can stop after a certain length or with a certain accuracy of the capability estimation being reached.
So, when setting up the CAT algorithm, one needs to define the first item of testing via the starting rule, the estimation of person ability after each item answered and the stop rule for test finishing. For this purpose, various software (for an overview see International Association for Computerized Adaptive Testing, 2022) as well as solutions for the open-source programming language R (e.g., catR—Magis et al., 2018 or mirtCAT—Chalmers and Nordmo, 2021) can be used for the calculation, estimation, and simulation of CAT runs. Simulation studies are used to check the performance of the created CAT or to decide on different possibilities of the CAT algorithm. In this process, response patterns of simulated test persons with random or fixed person parameters are generated (Magis and Raîche, 2012). They can, for example, clarify what precision a CAT can achieve depending on its length (Ludewig et al., 2022) and how many items have to be presented. Often, different stopping rules are compared in, e.g., Monte Carlo simulations (Harrison, 2010; Wang et al., 2019), such as the influence of different maximum standard errors on the accuracy of the test (Tan et al., 2018) or the resulting accuracy with differently set test lengths (Yasuda et al., 2021; Ludewig et al., 2022).
Even though many studies have already dealt with the development of CATs in psychological and educational fields (Wise and Kingsburg, 2000; Verschoor and Straetmans, 2010; Oppl et al., 2017), there are hardly any findings on its applicability for a special needs or inclusive target group. In this study, the following questions are therefore investigated and addressed with regard to the applicability of CAT in special needs education in schools:
1. What are the requirements for an item pool to be used for CAT in special education and inclusive fields? Can one use existing item pools from tests with time limits?
2. What impact has the setting of different stopping rules on the performance of CAT in view of achieving a good balance between test length and test accuracy?
In order to obtain suitable item pools for adaptive testing for experimental purposes, items of several CBM tests of the web-based platform www.levumi.de (Jungjohann and Gebhardt, 2019) are used. The tests’ target population is students between the ages of 8 and 12 at primary and special schools, especially such students with weak abilities in reading and mathematics and special needs in learning. The tests are offered as digital tests. They are designed for progress monitoring and measure the same skill on different difficulties so that stronger or weaker students can be measured repeatedly over time in a reliable manner. They are IRT-based, measure a skill range, and have a maximum working time of 5 min. The time limit is necessary, as students with special needs have limited concentration and working time and the computer administration needs maximum time. The items have a range of difficulties which are managed via difficulty-generating item characteristics and theoretical constructions (Anderson et al., 2022). The tests focus on necessary cultural techniques in reading and mathematics. Due to the digital implementation, the processing time of the students per item can be evaluated (Ebenbeck et al., submitted, see footnote 1). In this study, we worked with tests for addition and subtraction and sentence-based reading comprehension in order to create two different CAT item pools (Table 1).
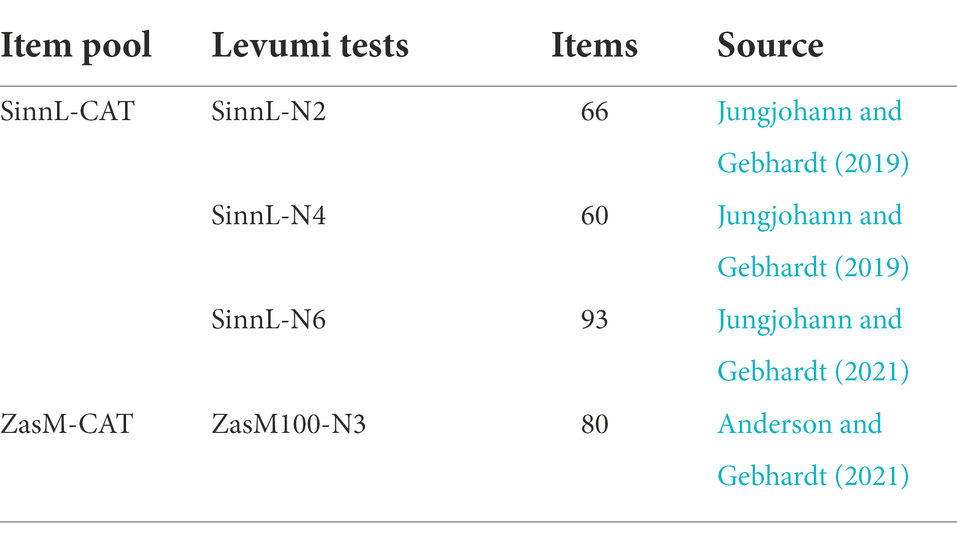
Table 1. Overview of used tests and number of items for the sentence reading CAT (SinnL-CAT) and addition and subtraction CAT (ZasM-CAT).
For a CAT item pool of addition and subtraction tasks (“ZasM-CAT”), data of a school study with 591 s and third grade students were used (Anderson et al., 2022). The tasks ask for additions and subtractions in the hundreds, and the students solve the items using mental arithmetic. The items’ difficulty is influenced by the arithmetic operation, a possible necessary transition to tens, the number of digits of the second term and the addition to the next ten. To create a CAT item pool for reading, we combined a test on three different difficulty levels. Each level can be administered as a single test on our platform. As the reading tests each have more narrow difficulties, the combination of all three of them is necessary to provide a greater difficulty bandwidth. The difficulty levels test sentence-based reading comprehension through cloze sentences, whose gaps must be filled in each case with one of four given words. Item difficulty is varied by the letters used and by the complexity of the omitted structures and sentence connections.
Previous studies have demonstrated the psychometric quality of the tests used regarding item response theory. All items were constructed and calibrated according to the Rasch model (Rasch, 1960). The reading items were tested in school studies with third to eighth grade students at regular and special schools (Jungjohann et al., 2018, 2021; Jungjohann, 2022). In a comparative study, the results correlated with the results of the ELFE II (r = 0.75; Anderson et al., 2020). For the addition and subtraction items, a fit to the Linear Logistic Test Model (Fischer, 1972) could be proven (Anderson et al., 2022). Both item pools are unidimensional.
For the ZasM-CAT, the test results of 591 pupils (282 girls, 209 boys) from 28 classes in second and third grades were obtained (Anderson et al., 2022). 328 pupils had no special needs, while 54 pupils had special needs in behavior, learning, hearing, or language. For each child, the first measuring point of the Levumi test ZasM100-N3 was included in the analysis (N = 591). The mean sum scores of students with and without special needs did not differ significantly [t(70.727) = 2.03, p < 0.05]. To generate samples for the reading tests, a different procedure had to be used. Because items from three difficulty levels were treated as a common item pool for sentence reading, data had to be available from pupils who completed all items in the item pool to estimate the necessary item parameters. The sample was composed of data on test performances of www.levumi.de, so, for the SinnL-CAT, the test results of 90 pupils with and without special needs (37 girls, 49 boys, and four not specified) from 21 classes were obtained. Due to missing values, it was not possible to make a valid statement regarding the grade and the exact number of pupils with special needs. For each child, the first measuring point of each test was included in the analysis. All pupils took the reading tests at intervals of no longer than 3 months. In both reading and mathematics, pupils with and without special needs took the same items.
To check which IRT models the SinnL-CAT and ZasM-CAT item pools best correspond to, depending on the IRT model, the required item parameters are calculated for each item within a value range between -∞ and + ∞ (Partchev, 2004; Yang and Kao, 2014) and the remaining item parameters are set. In addition to the difficulty of the item (bi), the importance of the item for ability estimation (ai), the probability of a correct answer despite too low person ability (ci), and the probability of a wrong answer despite too high person ability (di) are parameters characterizing each item in an IRT model (Magis et al., 2017; Battauz, 2020). The R package TAM is used to check whether the Rasch model (Rasch, 1960) or 2PL model fits the CAT item pools best. Due to the sample size, the 2PL model is only calculated for the ZasM item pool. As each test was created with the assumptions of the Rasch model, a fit to it is expected.
The items were processed with a time limit, which is why some children did not answer the items towards the end of the test (Brandt and Moosbrugger, 2020). For adaptive testing, an evaluation must be made as power tests. Therefore, unanswered items are counted as missing values in the Rasch estimates (Hohensinn and Kubinger, 2011), while right and wrong answers are counted as right and wrong. The analyzed data matrices can be seen in the added osf-project. This procedure results in many missing values in the data set. Therefore, the R package pairwise (Heine, 2021) is used which calculates the item parameters in the Rasch model using the “pairwise item comparison” method (Rasch, 1960; Choppin, 1985). With this method, the item parameters can be determined stably even with comparatively high proportions of missing values (Heine and Tarnai, 2015). The global model fit of the items to the Rasch model is checked with an Andersen Likelihood-Ratio-Test (Andersen, 1973).
The R package catR (Magis et al., 2018) is used for CAT simulations. The estimated bi values of the item pools serve as a basis, supplemented by further item parameters fixed in the Rasch model. bi values can theoretically vary between -∞ and + ∞ in the Rasch model, but lie mostly between −3 and + 3, with negative values indicating easy items and positive values indicating hard items.
The CAT algorithm of catR follows four steps. After the Initial Step where the first item is selected, the following Test Step selects items based on student answers and estimates the student’s ability after each answer. If the given stopping rule is satisfied, the item administration is ended in the Stopping Step. In the Final Step, the final ability is estimated. We configurated our CATs with the following settings: We chose the first item to be one of average difficulty of all items (bi = 0.000), which is the common way to proceed (Weiss, 1985; Magis and Raîche, 2012), since an item with average difficulty is most meaningful at the beginning. The first item is pre-set to ensure the same starting item for each test run. For ability estimation in the Test Step and Final Step, a recommended procedure of Magis et al. (2017) to avoid the problem of infinite estimators for fully correctly or incorrectly answered test items is used. That way, the subsequent item selection within a test run is performed using Fisher information, which is also the most commonly used method of item selection (Barrada et al., 2009) in combination with the Bayesian modal estimator (Birnbaum, 1969) and normal distributed prior distribution. The final ability is estimated using maximum likelihood.
Different stopping rules can be adopted as Stopping Step. A distinction is made between fixed-length and variable-length stopping rules, which have different advantages and disadvantages. If the test is stopped after a fixed length, i.e., after a certain number of items, it may not test accurately enough. If a variable-length test is stopped when certain accuracy is reached, it may take too long to complete the test. In the school context, fixed-length tests are preferred, as this means that each pupil completes the same number of items, the duration of the test is more comparable and the test as a whole can thus be more easily integrated into everyday teaching (Way, 2006).
The catR package allows a combination of several stopping criteria. The aim is to combine accuracy and a length rule in order to be able to use all the advantages. The resulting CATs should have a fixed length for better handling. CAT is supplemented by another accuracy stopping rule. Therefore, the performance of CATs with different variable-length stopping rules is first tested in simulations. catR uses the standard error (SE) stopping rule which ends the test when a specific SE of the person’s ability estimate has been reached (Dodd et al., 1989). An SE between 0.3 and 0.5 is recommended, with SE = 0.3 testing the most accurate, but SE = 0.5 being still acceptable (Forkmann et al., 2013). Based on this, the necessary length of the CATs for an accurate test is determined and checked in a further simulation.
Table 2 gives an overview of all the simulations of this study. To determine the possible precision of a CAT, 1,000 test runs of individuals each with normally distributed θ-values based on the θ-value range of our students are simulated three times for different standard errors as stopping criteria (SE = 0.3, SE = 0.4, SE = 0.5). The change in RSME and bias values as well as the correlation between estimated and actual θ-values is compared. The most appropriate stopping rule is selected to serve as the basis for another simulation of 1,000 individuals whose length and standard error are fixed as stopping criteria. This procedure is performed for the SinnL-CAT and the ZasM-CAT, respectively. CAT conditions are compared based on RMSE, Bias values, length, duration, and the correlation between estimated and true theta values.
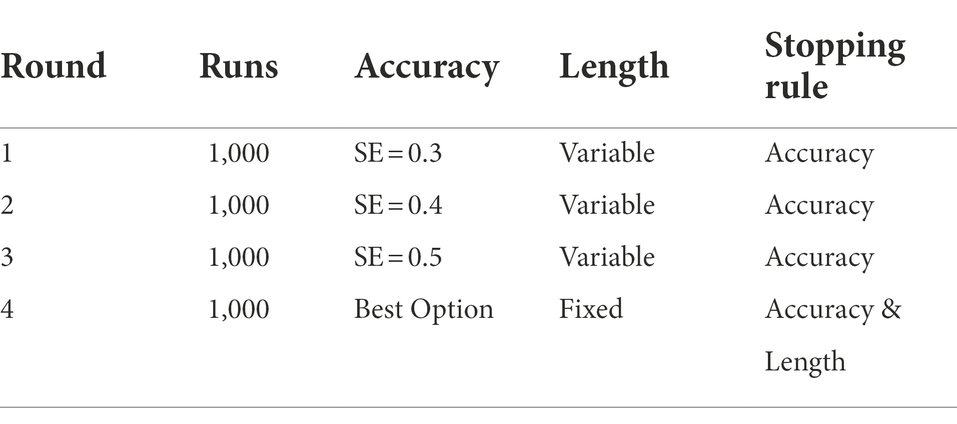
Table 2. Simulation rounds for each SinnL-CAT and ZasM-CAT for each 1,000 replications.
For the Rasch analysis, 45 items of the SinnL-CAT item pool had to be excluded because no answers were available for them. The 45 items were all taken from the SinnL-N6 test. Thus 66 items from SinnL-N2, 60 items from SinnL-N4 and 48 items from SinnL-N6 were included. In the ZasM-CAT item pool, 13 items were excluded because of missing answers, leading to 67 remaining items in the item pool.
Both SinnL-CAT and ZasM-CAT fit to the Rasch model (Table 3) significantly better than to the 2PL model [F(2, 173) = 334.26, p < 0.001 and F(2, 50) = 113.71, p < 0.001] and the 3PL model [F(2, 174) = 329.14, p < 0.001 and F(2, 51) = 114.79, p < 0.001]. In addition, the Akakike Information Criterion (AIC) and the Bayesian Information Criterion (BIC) were used for selecting the most suitable model. Both criteria have advantages and disadvantages. The AIC tends to overfitting and is more accurate with larger samples. The BIC tends to underfitting and preferring a simpler model. Therefore, both criteria are considered to assess the model fit. A lower value indicates a better model fit. The Rasch model is chosen based on the lower BIC values for both item pools.
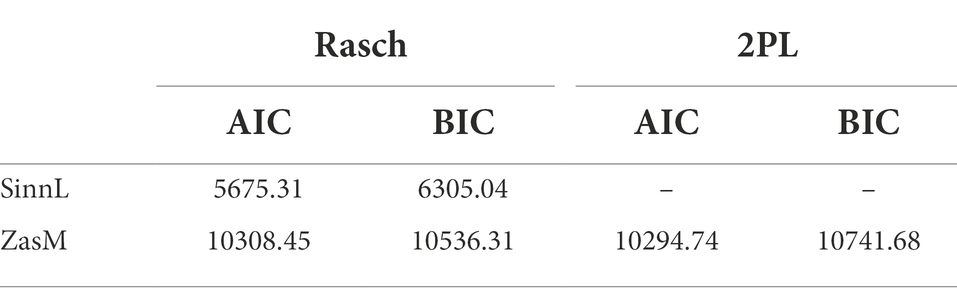
Table 3. AIC and BIC model fit for scaling the SinnL and ZasM items as Rasch, 2PL and 3PL model.
The ZasM-CAT item pool covers a larger range of the logit scale than the SinnL-CAT item pool (Figure 1), i.e., the ZasM-CATs item difficulties are wider (Mbi = 0, SDbi = 1.07) than the SinnL-CATs (Mbi = 0, SDbi = 0.37). Both item pools have good item fit statistics (SEL: M infit = 0.84, SD infit = 0.36; M outfit = 0.81, SD outfit = 1.5; ZASM: M infit = 0.84, SD infit = 0.28, M outfit = 0.80, SD outfit = 0.56). For both item pools, a global model fit to the Rasch model is achieved, as the Andersen Test is not significant. Both item pools cover a relatively narrow range of competencies because they were constructed and administered as progress monitoring tests. Such items must have a difficulty that is as comparable as possible, since processing speed is added as an additional variable of performance.
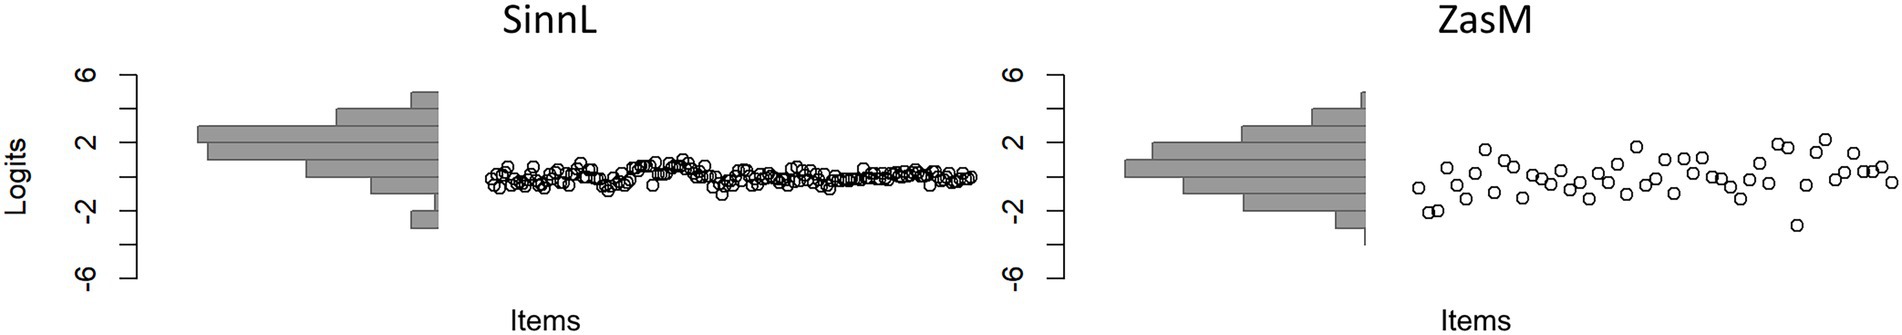
Figure 1. Wright map (Lunz, 2010) of the item pools (x axis stating the progress of items, test run with each dot being one item, and y axis stating the item difficulty. The histogram displays the person parameters).
For SinnL, the mean θ is 1.588 with a SD of 1.546. For ZasM, the mean θ is 0.594 with a SD of 1.637. From this follows, that the persons taking SinnL showed in average higher abilities than the persons taking ZasM. This circumstance is not relevant for the simulations themselves, but the final estimated θ value ranges have to be estimated with this background.
The simulation of different stopping rules provides information about the achievable correlations between estimated and actual θ-, RMSE- and bias-values (Table 4). A shorter implementation with fewer items is shown with increasing SE, which is correspondingly shorter in its implementation time. The correlation between estimated θ- and actual θ- as well as RMSE and bias values decrease with increasing SE but are still considered high even at SE = 0.5.
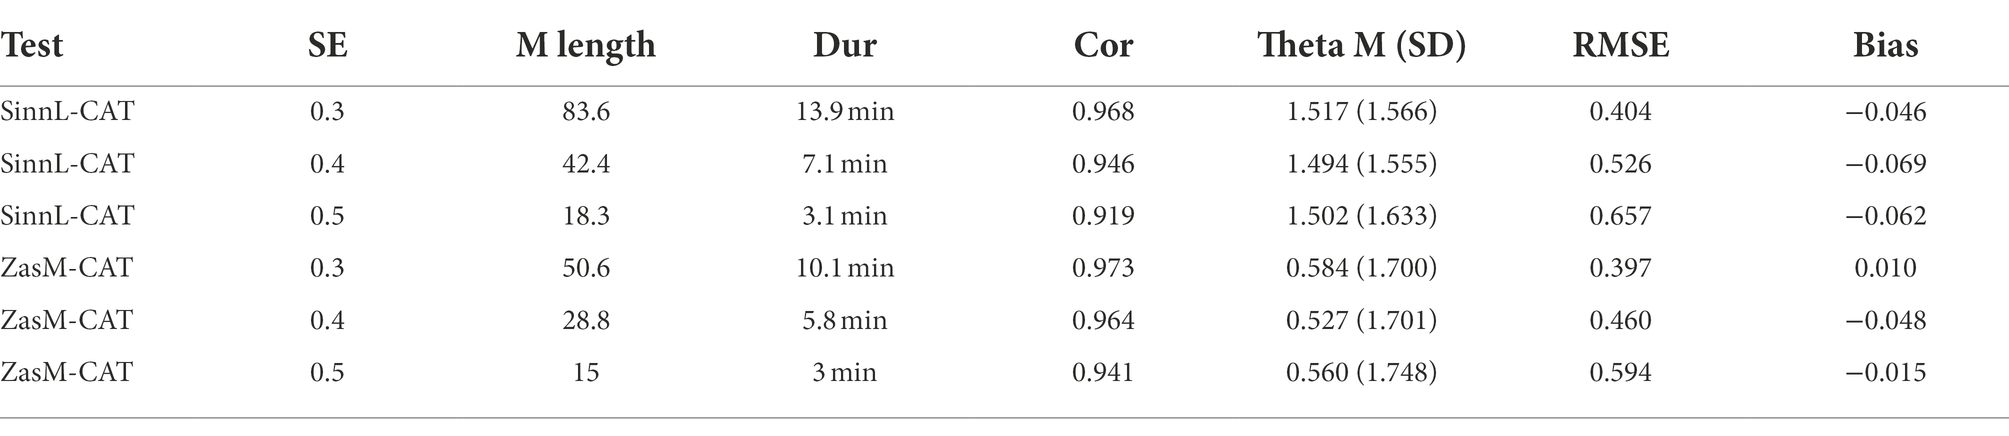
Table 4. Results of CAT simulations of different standard errors (SE = 0.3, SE = 0.4, SE = 0.5) with 1,000 simulees each and the resulting test lengths in items and minutes, the correlation between estimated θ- and actual θ-values, the mean and standard deviation of the estimated θ-values as well as RMSE- and bias values.
Due to the results, the implementation time, the high correlation and the acceptable RMSE and bias values, SE = 0.5 was chosen as the stopping rule. The SinnL-CAT thus reaches an average length of approximately 18 items, which corresponds to a test time of 3 min with an average processing time of 10 s per item. The ZasM-CAT reaches a length of approximately 15 items, which also corresponds to a test time of 3 min with an average processing time of 12 s per item.
For a further simulation, an additional stopping rule should be added, as, for a more practical usability, the test run has to stop at a given point. The simulation of 1,000 examinees is done by catR in 10 steps, with simulating 100 examinees each. In these 10 steps, 10 mean lengths of the simulation rounds are calculated by catR. They range for SinnL-CAT between a mean length of 13 and 37 items and for ZasM-CAT between a mean length of 13 and 24. In order to ensure that also examinees who need more items obtain an accurate estimate of their ability, the upper mean values of 37 items for SinnL-CAT and 24 for ZasM-CAT are set as the maximum length. The test ends when one of the two stop criteria is met (Table 5).
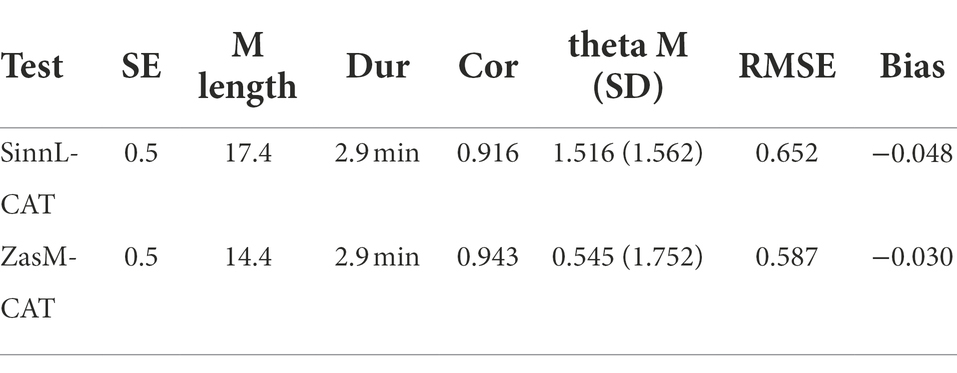
Table 5. Results of CAT simulations of fixed length and fixed SE stopping rules with 1,000 test executions each and the resulting test lengths in items and minutes, the correlation between estimated θ- and actual θ- as well as RMSE- and bias values.
95% of the simulations of both CATs were stopped at less than the maximum number of items specified, so the SE criterion was applied here (Figures 2, 3) so that the measurement may be assumed to be accurate. Instead, the remaining simulations were stopped because of the maximum length reached. The accuracy of the tests is particularly strong in the middle ranges for θ-values between −2.5 and + 2.5, while values smaller than −2.5 or higher than 2.5 cannot be tested well enough. The items do not cover this range. The test is therefore too difficult or not appropriate for a person’s ability <−2.5 or > 2.5 to test accurately enough.
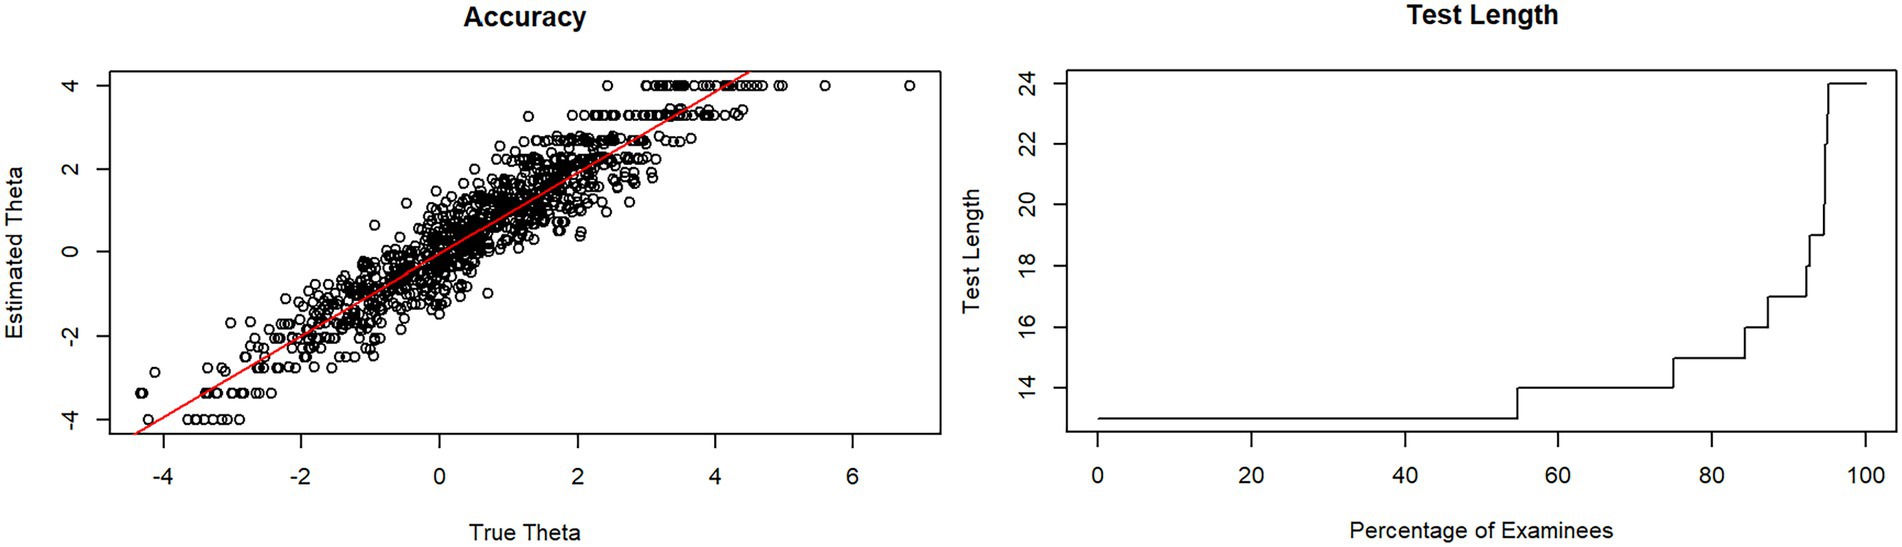
Figure 2. Test length and accuracy of ZasM-CAT in a simulation of 1,000 test executions with stopping rules SE = 0.5 and length = 24 items.
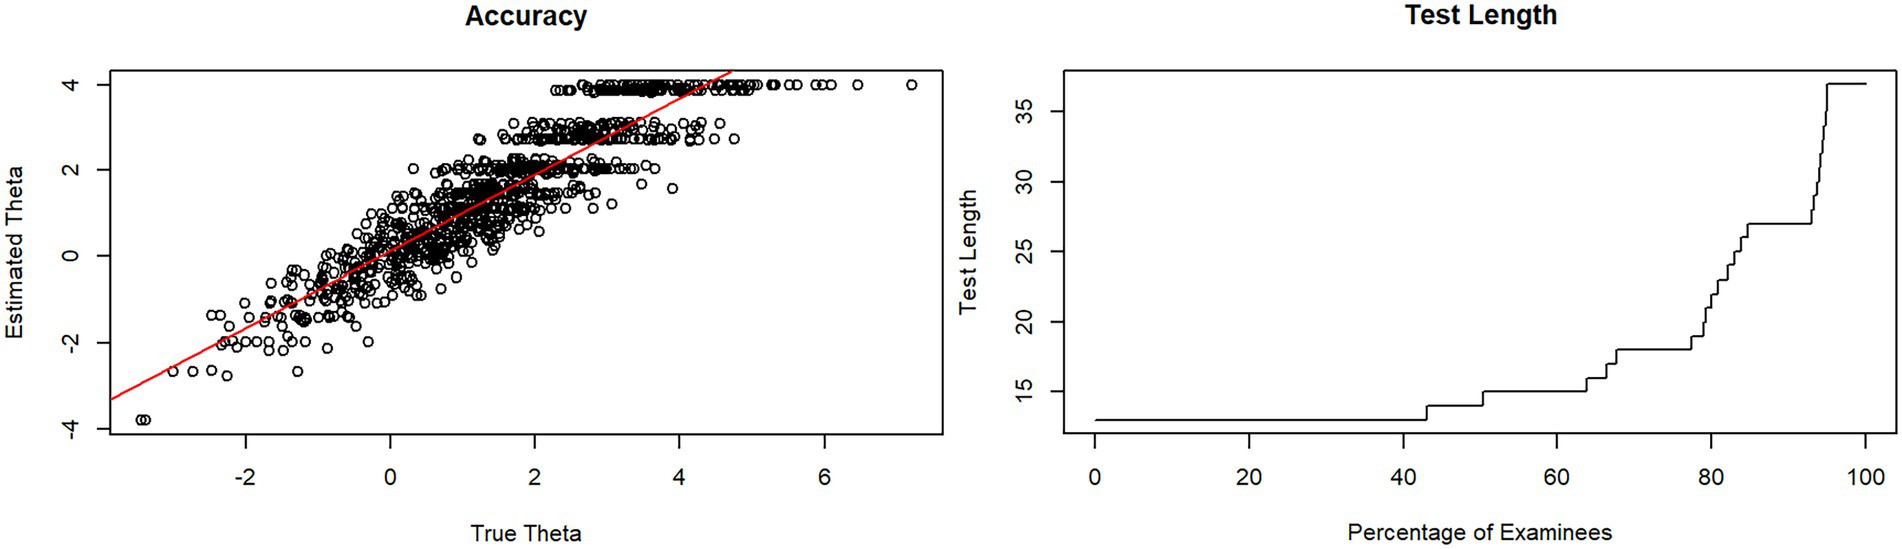
Figure 3. Test length and accuracy of SinnL-CAT in a simulation of 1,000 test executions with stopping rules SE = 0.5 and length = 37 items.
Constructing a new adaptive test from Levumi’s inclusive time limit tests for progress monitoring is generally reasonable and possible according to the analyses. The item pools meet the requirements of the IRT and therefore computerized adaptive testing can be applied. Such an adaptive test can shorten the test time with the same reliability from 5 min to less than 3 min, which can be seen as a prerequisite for fair and inclusive testing suitable for everyday teaching and progress monitoring as well as for the usage of a short class-based screening.
The two simulated CATs for reading and mathematics are more efficient than the linear implementation of the items. The tests adopted from www.levumi.de measure a narrow range of competencies in reading and have a completion time of 5 min, as, after this time, most students with and without disabilities can be assumed to have completed enough items (Ebenbeck et al., submitted, see footnote 1; Schurig et al., 2021). We analyzed the case of combining three of these tests to form a wider test. The use of adaptive tests has the advantage that the total processing time can be reduced again to average 2.9 min. The duration of the adapted maths test for addition and subtraction could only be reduced from 5 to 2.9 min, which means to nearly half the duration. When the test time limit is shorter than 5 min, it may well be that the reduction of the test time is less than 2.9 min.
Also, the simulation studies showed a greater accuracy of ability estimation even with short test runs. The length of the adaptive test is determined by the maximum number of items that can be processed during one run. This maximum number was set to 24 or 37 items in our CAT simulations. This length is comparable to the assumed length of similar simulations (Ludewig et al., 2022) that have comparably good standard error values. However, 95% of the simulated persons achieve the targeted accuracy with fewer items, raising the expectation for an even shorter implementation time to ensure accurate ability estimation as well. The accuracy of the ability estimation correlates highly with the actual people’s abilities, even with the short implementation time. In comparable simulations (Ludewig et al., 2022), a reliability of 0.91 could be demonstrated. Adaptive tests thus estimate students’ ability more accurately than the teacher (Südkamp et al., 2012). This advantage can be fed back to teachers through a qualitative evaluation of the results based on error patterns and characteristics of incorrectly answered items. It would be conceivable to sum up the solved and unsolved items from the different item groups and sub-dimensions. Also, the use of DGICs in the maths item pool and the corresponding student results could be analyzed in more detail by fitting a multidimensional Rasch model and run simulations within a multidimensional framework. That way, teachers could detect specific errors more easily to provide better fitting support. If the underlying rules of the tests are communicated as accurately as possible, they can simplify the derivation of support and contribute to its precision and individuality and thus provide a more precise, accurate and reliable basis for support planning.
Shortening tests while maintaining accuracy is particularly relevant for children with special needs. The adaptive drawing procedure enables to propose both suitably difficult tasks and a short testing time to students, which minimizes the duration of concentration required, and potentially reduces the risk of under- and over-testing and subsequent frustration and loss of motivation. In addition, matching items are presented to students even if the teacher cannot yet sufficiently assess students’ abilities. From this, we deduce that adaptive testing can be a good approach for screening procedures that are used for ability assessment at the beginning of the school year.
In order to function as a screening, the current item pool is suitable from a technical point of view. However, from a psychological point of view, expanding the item pool makes sense to ensure tailored testing also for students with low abilities. The item pools of SinnL-CAT and ZasM-CAT were created as tests with a time limit on the first hand. They measure only a narrow range of competencies. Anyway, their difficulty is not as wide as it would be recommended for adaptive testing (Magis and Raîche, 2012; Gebhardt et al., 2015). Accordingly, they measure the low and high ability range only inadequately. In order to be able to use existing item pools for adaptive testing, it is (therefore) necessary to precisely control their width. In this case, the SinnL-CAT item pool would have to be supplemented with additional items. This could be achieved by adding more sentence-based reading comprehension tests to the item pool. Since the target group of the test is children with learning disabilities or weak reading skills, the focus should be on easier items to be able to better differentiate in this ability area. If the item pool is wide enough, a resulting adaptive test can cover an entire competence area. That way, competencies of primary school students in general schools, special schools, and inclusive schools can be accurately tested and differentiated. The strengths of the instrument can (therefore) be seen especially in classes with a heterogeneous performance profile, as the same test can be used for all pupils. From a special educational perspective, when expanding the item pool, care must be taken nonetheless to ensure that only one type of task instruction is used. For students with special needs, different instructions that are required alternately present a particular challenge. Therefore, easier items that are added must have the same task instruction and must not vary by their difficulty.
The main limitations of our study result from the sample generated from the data of the platform www.levumi.de. Especially in the sample of reading data, the data show a high number of missing values, which is why the sample cannot be checked in this respect. Furthermore, the sample of the reading tests is not uniform, as the students attend different classes and schools, with different test administrators holding the tests. However, since the data of the reading tests were collected in real everyday school life and thus reflects a realistic performance profile of the test users, it was possible to include sufficient data in the analysis despite the lack of data without having to conduct the tests in schools. Also the simulations may show different results when they are conducted based on a larger sample size than 90. This question should be addressed in a follow-up study to compare the CAT performance based on different sample sizes.
Another limitation results from the technical possibilities of the simulation. Especially in schools, adaptive testing requires educational guidance, supervision, and evaluation. At the moment, the analyzed adaptive tests in this study cannot automatically stop after less than 24 or 35 items if the ability is too low. It is therefore the pedagogical task of the teacher to supervise the class during the test and, if necessary, to manually stop the test early if the person’s ability is obviously too low (e.g., if there is a lack of mechanical reading competence). For an implementation of adaptive tests on www.levumi.de, an additional early drop-out criterion should be considered for such cases in order to achieve a fully student-centered testing, to relieve the teacher and to avoid overtaxing the students by inappropriate items.
Publicly available datasets were analyzed in this study. This data can be found at: https://osf.io/bamk3/.
NE and MG: conceptualization: NE: methodology, analysis, original draft preparation, and visualization. MG: review and editing and supervision. All authors contributed to the article and approved the submitted version.
The project on which this article is based is funded by the German Federal Ministry of Education and Research under the funding code 01NV2116D.
The authors declare that the research was conducted in the absence of any commercial or financial relationships that could be construed as a potential conflict of interest.
All claims expressed in this article are solely those of the authors and do not necessarily represent those of their affiliated organizations, or those of the publisher, the editors and the reviewers. Any product that may be evaluated in this article, or claim that may be made by its manufacturer, is not guaranteed or endorsed by the publisher.
1. ^Ebenbeck, N., Jungjohann, J., Mühling, A., Gebhardt, M. (submitted). Die Bearbeitungsgeschwindigkeit von Kindern mit Lernschwierigkeiten als Grundlage für die Testentwicklung von Lernverlaufsdiagnostik.
Andersen, E. B. (1973). A goodness of fit test for the Rasch model. Psychometrika 38, 123–140. doi: 10.1007/BF02291180
Anderson, S., and Gebhardt, M. (2021). ZaM100-Levumi N3 - tests zu Rechenoperationen als Lernverlaufsdiagnostik – Zahlen addieren (Zahlenraum 100) der Onlineplattform www.levumi.de. ZaM100-Levumi N3 - tests on arithmetic operations as learning progress diagnostics – adding numbers (number range 100) of the online platform www.levumi.de]. Available at: https://epub.uni-regensburg.de/50954/1/ZaM100_Addieren_Anderson.pdf
Anderson, S., Jungjohann, J., and Gebhardt, M. (2020). Effects of using curriculum-based measurement (CBM) for progress monitoring in reading and an additive reading instruction in second classes. Zeitschrift für Grundschulforschung 13, 151–166. doi: 10.1007/s42278-019-00072-5
Anderson, S., Sommerhoff, D., Schurig, M., Ufer, S., and Gebhardt, M. (2022). Developing learning progress monitoring tests using difficulty-generating item characteristics: an example for basic arithmetic operations in primary schools. J. Educ. Res. Online 2022, 122–146. doi: 10.31244/jero.2022.01.06
Asseburg, R. (2011). Motivation zur Testbearbeitung in adaptiven und nicht-adaptiven Leistungstests. [Motivation for test-taking in adaptive and non-adaptive achievement tests.] Dissertation. University of Kiel. Available at: https://macau.uni-kiel.de/receive/diss_mods_00006627?lang=en
Barrada, J. R., Olea, J., Ponsoda, V., and Abad, F. J. (2009). Item selection rules in computerized adaptive testing. Methodology 5, 7–17. doi: 10.1027/1614-2241.5.1.7
Battauz, M. (2020). Regularized estimation of the four-parameter logistic model. Psychology 2, 269–278. doi: 10.3390/psych2040020
Bayazit, A., and Aşkar, P. (2012). Performance and duration differences between online and paper–pencil tests. Asia Pac. Educ. Rev. 13, 219–226. doi: 10.1007/s12564-011-9190-9
Berkeley, S., Bender, W. N., Gregg Peaster, L., and Saunders, L. (2009). Implementation of response to intervention: a snapshot of progress. J. Learn. Disabil. 42, 85–95. doi: 10.1177/0022219408326214
Birnbaum, A. (1969). Statistical theory for logistic mental test models with a prior distribution of ability. J. Math. Psychol. 6, 258–276. doi: 10.1016/0022-2496(69)90005-4
Blumenthal, S., and Blumenthal, Y. (2020). Tablet or paper and pen? Examining mode effects on German elementary school students’ computation skills with curriculum-based measurements. Int. J. Educ. Methodol. 6, 669–680. doi: 10.12973/ijem.6.4.669
Brandt, H., and Moosbrugger, H. (2020). “Planungsaspekte und Konstruktionsphasen von tests und Fragebogen. [Planning aspects and construction phases of tests and questionnaires.],” in Lehrbuch. Testtheorie und Fragebogenkonstruktion [Planning Aspects and Construction Phases of Tests and Questionnaires]. 3rd Edn. eds. H. Moosbrugger and A. Kelava (Basel, CH: Springer), 41–64.
Bulut, O., and Cormier, D. C. (2018). Validity evidence for Progress monitoring with star Reading: slope estimates, administration frequency, and number of data points. Front. Educ. 3:68. doi: 10.3389/feduc.2018.00068
Chalmers, P., and Nordmo, M. (2021). Computerized adaptive testing with multidimensional item response theory. Available at: https://cran.r-project.org/web/packages/mirtCAT/mirtCAT.pdf
Chang, H.-H. (2015). Psychometrics behind computerized adaptive testing. Psychometrika 80, 1–20. doi: 10.1007/s11336-014-9401-5
Choppin, B. (1985). A fully conditional estimation procedure for Rasch model parameters. Eval. Educ. 9, 29–42.
Deno, S. L. (2016). “Data-based decision-making,” in Handbook of Response to Intervention: The Science and Practice of Assessment and Intervention. eds. S. R. Jimerson, M. K. Burns, and A. M. VanDerHeyden (Basel, CH: Springer), 9–28.
Dodd, B. G., Koch, W. R., and de Ayala, R. J. (1989). Operational characteristics of adaptive testing procedures using the graded response model. Appl. Psychol. Meas. 13, 129–143. doi: 10.1177/014662168901300202
Eggen, T. J. H. M. (2013). Computerized classification testing with the Rasch model. Educ. Res. Eval. 17, 361–371. doi: 10.1080/13803611.2011.630528
Eggen, T. J. H. M. (2018). Multi-segment computerized adaptive testing for educational testing purposes. Front. Educ. 3:111. doi: 10.3389/feduc.2018.00111
Ferrara, S., and DeMauro, G. E. (2006). Standardized assessment of individual achievement in K-12. Available at: https://www.researchgate.net/publication/288962444_Standardized_assessment_of_individual_achievement_in_K-12
Fischer, G. H. (1972). Conditional maximum-likelihood estimations of item parameters for a linear logistic test model. University of Vienna, Psychological Institute.
Forkmann, T., Kroehne, U., Wirtz, M., Norra, C., Baumeister, H., Gauggel, S., et al. (2013). Adaptive screening for depression—recalibration of an item bank for the assessment of depression in persons with mental and somatic diseases and evaluation in a simulated computer-adaptive test environment. J. Psychosom. Res. 75, 437–443. doi: 10.1016/j.jpsychores.2013.08.022
Frey, J. R. (2019). Assessment for special education: diagnosis and placement. Ann. Am. Acad. Pol. Soc. Sci. 683, 149–161. doi: 10.1177/0002716219841352
Frey, A., and Hartig, J. (2013). Wann sollten computerbasierte Verfahren zur Messung von Kompetenzen anstelle von papier- und bleistift-basierten Verfahren eingesetzt werden? [when should computer-based procedures be used to measure competences instead of paper and pencil-based procedures?]. Z. Erzieh. 16, 53–57. doi: 10.1007/s11618-013-0385-1
Gebhardt, M., Heine, J.-H., Zeuch, N., and Förster, N. (2015). Lernverlaufsdiagnostik im Mathematikunterricht der zweiten Klasse: Raschanalysen und Empfehlungen zur adaptation eines Testverfahrens für den Einsatz in inklusiven Klassen. [Learning development diagnostics in second grade mathematics teaching: rapid analyses and recommendations for adapting a test procedure for use in inclusive classes]. Emp. Sonderpädag. 3, 206–222. doi: 10.25656/01:11383
Green, B. F. (1983). “The promise of tailored tests,” in Principals of Modern Psychological Measurement: A Festschrift for Frederic M. Lord. ed. H. Wainer (Mahawa, New Jersey: Erlbaum), 69–79.
Harrison, R. L. (2010). Introduction to Monte Carlo simulation. AIP Conf. Proc. 1204, 17–21. doi: 10.1063/1.3295638
Hasbrouck, J., and Tindal, G. A. (2006). Oral Reading fluency norms: a valuable assessment tool for Reading teachers. Read. Teach. 59, 636–644. doi: 10.1598/RT.59.7.3
Heine, J.-H. (2021). Pairwise: Rasch model parameters by pairwise algorithm. R package version 0.5.0-2. Available at: http://CRAN.R-project.org/package=pairwise
Heine, J.-H., and Tarnai, C. (2015). Pairwise Rasch model item parameter recovery under sparse data conditions. Psychol. Test Assess. Model. 57, 3–36.
Hohensinn, C., and Kubinger, K. D. (2011). On the impact of missing values on item fit and the model validness of the Rasch model. Psychol. Test Assess. Model. 53, 380–393.
International Association for Computerized Adaptive Testing (2022). CAT software. Available at: http://www.iacat.org/content/cat-software
Jungjohann, J. (2022). Komplexe Nebensätze, Kohärenz- oder Inferenzbildung: Unterschiede im Satzverständnis von Jugendlichen mit sonderpädagogischem Unterstützungsbedarf im Bereich Sprache. [Complex subordinate clauses, coherence or inference formation: Differences in sentence comprehension of young people with special educational needs in the area of language]. Forschung Sprache.
Jungjohann, J., DeVries, J. M., Mühling, A., and Gebhardt, M. (2018). Using theory-based test construction to develop a new curriculum-based measurement for sentence Reading comprehension. Front. Educ. 3:115. doi: 10.3389/feduc.2018.00115
Jungjohann, J., and Gebhardt, M. (2019). Tests zum sinnkonstruierenden Lesen als Lernverlaufsdiagnostik—Sinnkonstruierendes Satzlesen der Onlineplattform www.levumi.de tests on sense-constructing reading as a learning progress diagnostic—sense-constructing sentence reading of the online platform www.levumi.de]. Available at: https://www.testarchiv.eu/de/test/9007837
Jungjohann, J., and Gebhardt, M. (2021). SinnL-Levumi N6—tests zum sinnkonstruierenden Lesen als Lernverlaufsdiagnostik—Sinnkonstruierendes Satzlesen der Onlineplattform www.levumi.de SinnL-Levumi N6—tests for sense-constructing reading as learning progress diagnostics—sense-constructing sentence reading of the online platform www.levumi.de]. Available at: https://epub.uni-regensburg.de/47877/1/2021_Jungjohann%20Gebhardt_SinnL_N6_Testbeschreibung.pdf
Jungjohann, J., Schurig, M., and Gebhardt, M. (2021). Fachbeitrag: Pilotierung von Leseflüssigkeits- und Leseverständnistests zur Entwicklung von Instrumenten der Lernverlaufsdiagnostik. Ergebnisse einer Längsschnittstudie in der 3ten und 4ten Jahrgangsstufe [technical paper: piloting reading fluency and reading comprehension tests for the development of instruments for learning progress diagnostics. Results of a longitudinal study in the 3rd and 4th grade]. Vierteljahress. Heilpädag. Nachbarg. doi: 10.2378/vhn2021.art12d
Köller, O. (2005). Formative assessment in classrooms: a review of the empirical German literature. Available at: https://www.oecd.org/education/ceri/35337965.pdf
Kubinger, K. D. (2004). On a practitioner’s need of further development of Wechsler scales. Adaptive intelligence Diagnosticum (AID 2). Span. J. Psychol. 7, 101–111. doi: 10.1017/S1138741600004807
Lange, R. (2008). Binary items and beyond: a simulation of computer adaptive testing using the Rasch partial credit model. J. Appl. Meas. 9, 81–104.
Ludewig, U., Trendtel, M., Schlitter, T., and McElvany, N. (2022). Adaptives Testen von Textverständnis in der Grundschule: Entwicklung eines CAT-optimierten Itempools [adaptive testing of text comprehension in primary school: development of a CAT-optimised item pool]. Diagnostica 68, 39–50. doi: 10.1026/0012-1924/a000279
Lunz, M. E. (2010). Using the very useful Wright map. Measurement Research Associated Test Insights. Available at: https://www.rasch.org/mra/mra-01-10.htm
Magis, D., and Raîche, G. (2012). Random generation of response patterns under computerized adaptive testing with the R package catR. J. Stat. Softw. 48, 1–31. doi: 10.18637/jss.v048.i08
Magis, D., Raîche, G., and Barrada, J. R. (2018). catR: generation of IRT response patterns under computerized adaptive testing. Available at: https://cran.r-project.org/web/packages/catR/index.html
Magis, D., Yan, D., and von Davier, A. A. (2017). Computerized Adaptive and Multistage Testing With R: Using Packages catR and mstR. Basel, CH: Springer.
Meijer, R. R., and Nering, M. L. (1999). Computerized adaptive testing: overview and introduction. Appl. Psychol. Meas. 23, 187–194. doi: 10.1177/01466219922031310
Mislevy, R. J. (2019). Advances in measurement and cognition. Ann. Am. Acad. Pol. Soc. Sci. 683, 164–182. doi: 10.1177/0002716219843816
Neumann, M. M., Anthony, J. L., Erazo, N. A., and Neumann, D. L. (2019). Assessment and technology: mapping future directions in the early childhood classroom. Front. Educ. 4:116. doi: 10.3389/feduc.2019.00116
Oppl, S., Reisinger, F., Eckmaier, A., and Helm, C. (2017). A flexible online platform for computerized adaptive testing. International journal of educational technology. High. Educ. 14, 1–21. doi: 10.1186/s41239-017-0039-0
Otterpohl, N., and Schwinger, M. (2015). Nur ein Test? – Auswirkungen nicht unterstützenden Testleiterverhaltens bei Intelligenztestungen auf den Selbstwert [Just a test? - Effects of unsupportive test administrator behaviour in intelligence testing on self-esteem]. Emp. Sonderpädag. 4, 283–299. doi: 10.25656/01:11452
Partchev, I. (2004). A visual guide to item response theory. Friedrich-Schiller-Universität Jena. Available at: https://www.stat.cmu.edu/~brian/PIER-methods/For%202013-02-28/Readings/Interactive%20pdf%20on%20Item%20Response%20Theory.pdf
Pool Maag, S., and Moser Opitz, E. (2014). Inklusiver Unterricht – grundsätzliche Fragen und Ergebnisse einer explorativen Studie [inclusive teaching - basic questions and results of an explorative study]. Emp. Sonderpädag. 2, 133–149. doi: 10.25656/01:9249
Rasch, G. (1960). Probabilistic Models for Some Intelligence and Attainment Tests. Copenhagen, DNK: Copenhagen Danmarks pædagogiske Institut.
Reckase, M. D. (2010). Designing item pools to optimize the functioning of a computerized adaptive test. Psychol. Test Assess. Model. 52, 127–141.
Roid, G. H., and Barram, R. A. (2004). Essentials of Stanford-Binet Intelligence Scales (SB5) Assessment. Essentials of Psychological Assessment Series. Hoboken, New Jersey: John Wiley & Sons.
Schurig, M., Jungjohann, J., and Gebhardt, M. (2021). Minimization of a short computer-based test in Reading. Front. Educ. 6:684595. doi: 10.3389/feduc.2021.684595
Shepard, L., Hammerness, K., Darling-Hammond, L., and Rust, F. (2007). “Assessment,” in Preparing Teachers for a Changing World. eds. L. Darling-Hammond and J. Bransford (Hoboken, New Jersey: Wiley), 275–326.
Stocking, M. (1969). Short tailored tests. ETS Res. Bull. Ser. 1969, i–13. doi: 10.1002/j.2333-8504.1969.tb00741.x
Stone, E., and Davey, T. (2011). Computer-adaptive testing for students with disabilities: a review of the literature. ETS Res. Rep. Ser. 2011, i–24. doi: 10.1002/j.2333-8504.2011.tb02268.x
Südkamp, A., Kaiser, J., and Möller, J. (2012). Accuracy of teachers’ judgments of students’ academic achievement: a meta-analysis. J. Educ. Psychol. 104, 743–762. doi: 10.1037/a0027627
Tan, Q., Cai, Y., Li, Q., Zhang, Y., and Tu, D. (2018). Development and validation of an item Bank for Depression Screening in the Chinese population using computer adaptive testing: a simulation study. Front. Psychol. 9:1225. doi: 10.3389/fpsyg.2018.01225
Thompson, N. A., and Weiss, D. J. (2009). “Computerized and adaptive testing in educational assessment,” in The Transition to Computer-Based Assessment. New Approaches to Skill Assessment and Implications for Large-scale Testing. eds. F. Scheuermann and J. Björnsson, 120–126.
Verschoor, A. J., and Straetmans, G. J. J. M. (2010). “MATHCAT: a flexible testing system in mathematics education for adults,” in Statistics for the Social and Behavioral Sciences. Elements of Adaptive Testing. eds. W. J. Linden, C. A. van der Glas and C. A. W. Glas (Basel, CH: Springer), 137–149.
Voß, S., Blumenthal, Y., Sikora, S., Mahlau, K., Diehl, K., and Hartke, B. (2014). Rügener Inklusionsmodell (RIM)—Effekte eines Beschulungsansatzes nach dem response to intervention-ansatz auf die Rechen- und Leseleistungen von Grundschulkindern [Rügen inclusion model (RIM)—effects of a schooling approach according to the response to intervention approach on the numeracy and reading achievement of primary school children]. Emp. Sonderpädag. 6, 114–132. doi: 10.25656/01:9248
Wang, C., Weiss, D. J., and Shang, Z. (2019). Variable-length stopping rules for multidimensional computerized adaptive testing. Psychometrika 84, 749–771. doi: 10.1007/s11336-018-9644-7
Way, W. D. (2006). Practical questions in introducing computerized adaptive testing for K-12 assessments.
Weiss, D. J. (1985). Adaptive testing by computer. J. Consult. Clin. Psychol. 53, 774–789. doi: 10.1037/0022-006X.53.6.774
Wise, S. L., and Kingsburg, G. G. (2000). Practical issues in developing and maintaining a computerized adaptive testing program. Psicológica 21, 135–155.
Yang, F. M., and Kao, S. T. (2014). Item response theory for measurement validity. Shanghai Arch. Psychiatry 26, 171–177. doi: 10.3969/j.issn.1002-0829.2014.03.010
Keywords: computerized adaptive testing, inclusive, diagnostics, assessment, formative
Citation: Ebenbeck N and Gebhardt M (2022) Simulating computerized adaptive testing in special education based on inclusive progress monitoring data. Front. Educ. 7:945733. doi: 10.3389/feduc.2022.945733
Edited by:
Sedat Sen, Harran University, TurkeyReviewed by:
Mark D. Reckase, Michigan State University, United StatesCopyright © 2022 Ebenbeck and Gebhardt. This is an open-access article distributed under the terms of the Creative Commons Attribution License (CC BY). The use, distribution or reproduction in other forums is permitted, provided the original author(s) and the copyright owner(s) are credited and that the original publication in this journal is cited, in accordance with accepted academic practice. No use, distribution or reproduction is permitted which does not comply with these terms.
*Correspondence: Nikola Ebenbeck, bmlrb2xhLmViZW5iZWNrQHBhZWRhZ29naWsudW5pLXJlZ2Vuc2J1cmcuZGU=
Disclaimer: All claims expressed in this article are solely those of the authors and do not necessarily represent those of their affiliated organizations, or those of the publisher, the editors and the reviewers. Any product that may be evaluated in this article or claim that may be made by its manufacturer is not guaranteed or endorsed by the publisher.
Research integrity at Frontiers
Learn more about the work of our research integrity team to safeguard the quality of each article we publish.