 Boris Forthmann
 Natalie Förster
 Elmar Souvignier
- Institute of Psychology in Education, University of Münster, Münster, Germany
Reliable learning progress information is crucial for teachers’ interpretation and data-based decision making in everyday classrooms. Slope estimates obtained from simple regression modeling or more complex latent growth models are typically used in this context as indicators of learning progress. Research on progress monitoring has used mainly two ways to estimate reliability of learning progress, namely (a) split-half reliability and (b) multilevel reliability. In this work we introduce empirical reliability as another attractive alternative to quantify measurement precision of slope estimates (and intercepts) in learning progress monitoring research. Specifically, we extended previous work on slope reliability in two ways: (a) We evaluated in a simulation study how well multilevel reliability and empirical reliability work as estimates of slope reliability, and (b) we wanted to better understand reliability of slopes as a latent variable (by means of empirical reliability) vs. slopes as an observed variable (by means of multilevel reliability). Our simulation study demonstrates that reliability estimation works well over a variety of different simulation conditions, while at the same time conditions were identified in which reliability estimation was biased (i.e., with very poor data quality, eight measurement points, and when empirical reliability was estimated). Furthermore, we employ multilevel reliability and empirical reliability to estimate reliability of intercepts (i.e., initial level) and slopes for the quop-L2 test. Multilevel and empirical reliability estimates were comparable in size with only slight advantages for latent variable scores. Future avenues for research and practice are discussed.
Introduction
Evaluation of student learning is a crucial component to inform progress monitoring (Silberglitt and Hintze, 2007). Progress monitoring has been connected in particular with curriculum-based measurement (CBM) as a well-known formative assessment approach in special education (Deno, 1985, 1987). However, progress monitoring approaches for the entire classroom such as learning progress assessment exist (Souvignier et al., 2021). The overarching goal of progress monitoring is learning growth which is commonly assessed in the literature by estimating the linear slope (Silberglitt and Hintze, 2007) across multiple assessment points (e.g., weekly measurements in CBM). Given the importance of these growth estimates for progress monitoring it is clear that their reliability needs to be as high as possible to most accurately inform teachers’ instructional decisions.
Hence, issues related to the reliability of progress monitoring slopes such as schedule and duration (i.e., number of occasions per week and overall number of weeks of data collection), or dataset quality (as operationalized by the amount of residual variance in growth models) have been extensively examined in simulation studies (Christ et al., 2012, 2013a; Van Norman et al., 2013). One major dependent variable in such simulation studies is the true reliability of slope estimates (i.e., the squared correlation between estimated slopes and their true values). These studies have shown that acceptable levels of slope reliability (i.e., 0.70) can only be achieved for data collection durations of at least 6 or 8 weeks (depending further on the schedules; e.g., Christ et al., 2013a). A conclusion that was later backed-up with empirical data (Thornblad and Christ, 2014). For empirical data, however, the true slope values are not known and reliability of slopes can only be estimated. Yet, little is known on how well reliability estimation methods quantify true reliability. This question has not been in the focus of previous work on the reliability of progress monitoring slopes and here we seek to address this gap in the literature.
Furthermore, Van Norman and Parker (2018), for example, compared two commonly used methods to estimate slope reliability, namely split-half reliability and multilevel reliability. Both methods aim at quantifying reliability of slopes as an observed variable (i.e., not as latent variable). Slopes as a latent variable, however, can be obtained by means of empirical Bayes estimates, for example, and one might think that these latent variable estimates are more reliable as compared to slope estimates as an observed variable. Hence, we extend the set of used reliability estimation methods by examining empirical reliability which quantifies reliability of progress as a latent variable. Empirical reliability is borrowed from the item-response theory literature (Green et al., 1984; Brown and Croudace, 2015) and shares with multilevel reliability the feature that it is easy to calculate. In fact, multilevel reliability and empirical reliability can be estimated even in case that only few measurement points are available which prevents estimation based on the split-half method (e.g., for only three measurement points). Thus, the aim of our study was twofold: (a) we wanted to know how well reliability estimates actually quantify true reliability, and (b) we wanted to know how reliability estimated for slopes as a latent variable performs in comparison to reliability estimated for slopes as an observed variable.
Reliability of growth in progress monitoring
Progress monitoring requires multiple measurement points over time. Hence, factors that undermine comparisons of test results across time potentially undermine reliability of progress monitoring estimates. For example, Van Norman and Parker (2018) outline lack of measurement invariance (i.e., parallel test forms should display equal difficulty), characteristics of the data collection procedure (e.g., used instructions, changing test administrators, or varying testing environments), and the testing schedule (i.e., number of measurement points within a given period of time) as potentially influencing factors. To study these influencing factors and their potential link with growth reliability, reliability must be estimated. Yet, the statistical methods used to estimate growth reliability can also be a source of heterogeneity in reliability findings (Van Norman and Parker, 2018). The focus in previous work (see above), however, was on the method of growth estimation (e.g., differences in true reliability between various slope estimators; Bulut and Cormier, 2018) rather than the estimation of growth reliability (i.e., which method of estimating reliability best quantifies true reliability). Hence, this work seeks to address this gap in the literature.
Methods of assessing reliability of slopes
Perhaps most often researchers use the split-half odd-even method to estimate the reliability of student growth estimates (VanDerHeyden and Burns, 2008; Christ et al., 2013b; Van Norman et al., 2013). This method requires measurement timepoints to be splitted into the odd and even timepoints. Learning growth is then estimated separately by ordinary least squares regression, for example, for each set of timepoints and each student. Analogous to classical test theory in which reliability is conceptualized as test-test correlation (e.g., Haertel, 2006), split-half reliability is obtained from the correlation between slopes based on the odd measurement points (e.g., measurement points 1, 3, and 5) and the slopes based on the even measurement points (e.g., measurement points 2, 4, and 6).
Among other outcomes, previous simulation studies typically focus on true reliability as well as estimated split-half reliability (Christ et al., 2012, 2013b) and, thus, split-half reliability is the only method for which we know how well it works. The match between estimated split-half reliability and true reliability decreased as a function of number of measurement timepoints as well as data quality (operationalized as the amount of residual variance). Presumably, conditions with few measurement points or large residual variance are more likely to yield violations of the assumptions underlying split-half reliability, namely equal true-score and error variances between the test-halves (e.g., Haertel, 2006). However, while split-half reliability is among the recommended methods for the evaluation of slope reliability (National Center on Intensive Intervention, 2014), we do not focus on the method in this work as it requires at least six measurement timepoints which limits its range of application.
Another method relies on the ratio of true slope variability and overall variability of (OLS) slopes (e.g., Raudenbush and Bryk, 2002; Snijders and Bosker, 2012). This method has been also referred to as multilevel reliability (e.g., Schatschneider et al., 2008; Van Norman and Parker, 2018). Multilevel reliability tends to go to one when the number of measurement points is large (relating to collection duration and schedules) or in case strong inter-individual differences in learning progress exist (e.g., Raudenbush and Bryk, 2002). Van Norman and Parker used a random-intercept-random-slope model (e.g., Snijders and Bosker, 2012) to estimate between-student learning growth variance (i.e., true slope variability) and the variance of OLS slopes obtained for each child (i.e., observed slope variability). They found that multilevel reliability was larger than uncorrected split-half reliability for all examined levels of duration. Yet, given that uncorrected split-half refers to reliability of slopes based on only half the timepoints, this is not surprising. True reliability of OLS slopes has also been quantified in simulation studies on learning growth in the context of curriculum-based measurement as the squared correlation between estimated and true learning growth (Christ et al., 2012, 2013b). However, these studies did not estimate multilevel reliability. Thus, simulation studies on learning progress estimation have thus far not looked at how well multilevel reliability works as an estimate of the reliability of OLS slope. We address this gap in the current work.
Finally, it should be noted that the estimate of learning progress as a latent variable is used for estimation of multilevel reliability (National Center on Intensive Intervention, 2014; Van Norman and Parker, 2018), yet latent variable scores can also be obtained from random-intercept-random-slope models. For example, the R package lme4 (Bates et al., 2015)—which is often used in the progress monitoring literature (e.g., Parker et al., 2011; McMaster et al., 2017; Van Norman and Parker, 2018)—provides values for the unknown unobserved latent variable by means of conditional modes given the observed data and estimated other parameter values (Bates et al., 2015). Reliability of such latent variable scores (i.e., the squared correlation between the estimated scores and the true scores) can be estimated by marginal or empirical reliability (Green et al., 1984; Brown and Croudace, 2015). Empirical reliability is widely used in item-response theory applications (e.g., Forthmann et al., 2020b,c; Beisemann, 2022), for example.
Aim of the current work
The reliability of learning progress estimates (i.e., slopes) is critically important for progress monitoring assessment. The known and used methods to quantify slope reliability in the field of progress monitoring may not be applicable to all contexts. For example, split-half reliability cannot be used when only three measurement points are available. Furthermore, multilevel reliability as the ratio of the estimated slope variance across students (i.e., an estimate of “true” variance) to the OLS slope variance provides an estimate of OLS slope reliability. OLS slopes, however, are not always the best choice (e.g., when outliers are present; Bulut and Cormier, 2018). When data at hand require more complex modeling choices with respect to progress monitoring, empirical reliability might be another reasonable choice for slope reliability estimation. Empirical reliability—like multilevel reliability—can be used with at least three measurement points and can be understood as an estimate of the squared correlation between slope estimates and their unknown true values. In other words, it provides an estimate of slopes as a latent variable. Hence, increasing the awareness of researchers in the field that this approach to estimate reliability is available and provides useful psychometric information is the main aim of our paper. In accordance with this aim, we sought to complement existing simulation studies in the field of progress monitoring by examining how well multilevel reliability estimation (as an established method for learning progress reliability estimation; National Center on Intensive Intervention, 2014) and empirical reliability estimation work in a range of conditions used in previous simulation studies (Christ et al., 2012, 2013a; Van Norman et al., 2013). Finally, for illustration purposes, we apply the reliability estimation to real data using the quop-L2 test which is used in the context of learning progress assessment in everyday school contexts (Souvignier et al., 2021).
Simulation study
Simulation design
The simulation design is adapted from Christ et al. (2012) to connect with previous simulation studies. The design was based on the factors sample size with four levels (N = 125, N = 250, N = 500, and N = 1,000), data quality with the levels very poor and very good (referring to residual variances of and , respectively), and number of timepoints (T = 8 and T = 20). Simulations were based on the following latent growth model:
with Yij being the test performance of child i (i = 1,…,N) at timepoint j (j = 1,…,T), latent variable means β0 (i.e., the average intercept) and β1 (i.e., the average slope), latent variable values b0i (i.e., a child’s deviation from the average intercept) and b1i (i.e., a child’s deviation from the average slope), and residual term ϵij. Latent variables were bivariate normal with μ = (β0,β1) and covariance matrix . Average intercept and average slope were set to β0 = 40 and β1 = 1.5 with variances = 150 and = 0.40, respectively. The correlation between intercept and slope was set to 0.20 for all simulations. Simulations were run by means of the R package simsem (Pornprasertmanit et al., 2020). We ran 1,000 replications for each cell of the simulation design. The R code is openly available in the Open Science Framework1.
Dependent variables
We analyzed the following dependent variables:
• True reliability: The squared correlation between the true latent variables and their estimated values (i.e., either latent or observed).
• Estimated reliability: The estimated reliability by either empirical or multilevel reliability estimates.
• Bias: The difference between estimated and true reliability.
• RMSE (root mean squared error): The square-root of the squared difference between estimated and true reliability divided by the number of replications.
We mainly display simulation results graphically.
Results and discussion
Figure 1 displays true (left side) and estimated (right side) intercept reliability. Overall, true reliability for intercepts was substantially stronger for very good data quality as compared to very bad data quality. We also found that true intercept reliability increased with the number of measurement points, yet this effect was clearly better visible for very poor data quality compared to very good data quality, and for multilevel reliability compared to empirical reliability. Sample size further decreased the variability of true intercept reliability. Again, this effect was clearly better visible for very poor data quality compared to very good data quality and for multilevel reliability compared to empirical reliability. As expected, the difference between empirical and multilevel reliability decreased as a function of data quality and number of measurement points. For example, for very good data quality and 20 measurement points reliabilities were clearly on par (see bottom-left in Figure 1), yet when looking at poor data quality and eight measurement points empirical reliability (i.e., the squared correlation between latent variable estimates and the true values) was substantially higher as compared to multilevel reliability (i.e., the squared correlation between OLS estimates and the true values; see top-left in Figure 1). Finally, it should be noted that with respect to true reliability we found that intercept reliability was below 0.70 only for very poor data quality and when multilevel reliability was estimated. The right side in Figure 1 demonstrated that estimated intercept reliability worked quite well. Indeed, estimated reliability pretty much mimicked the findings for true reliability pointing toward unbiased estimation of intercept reliability.
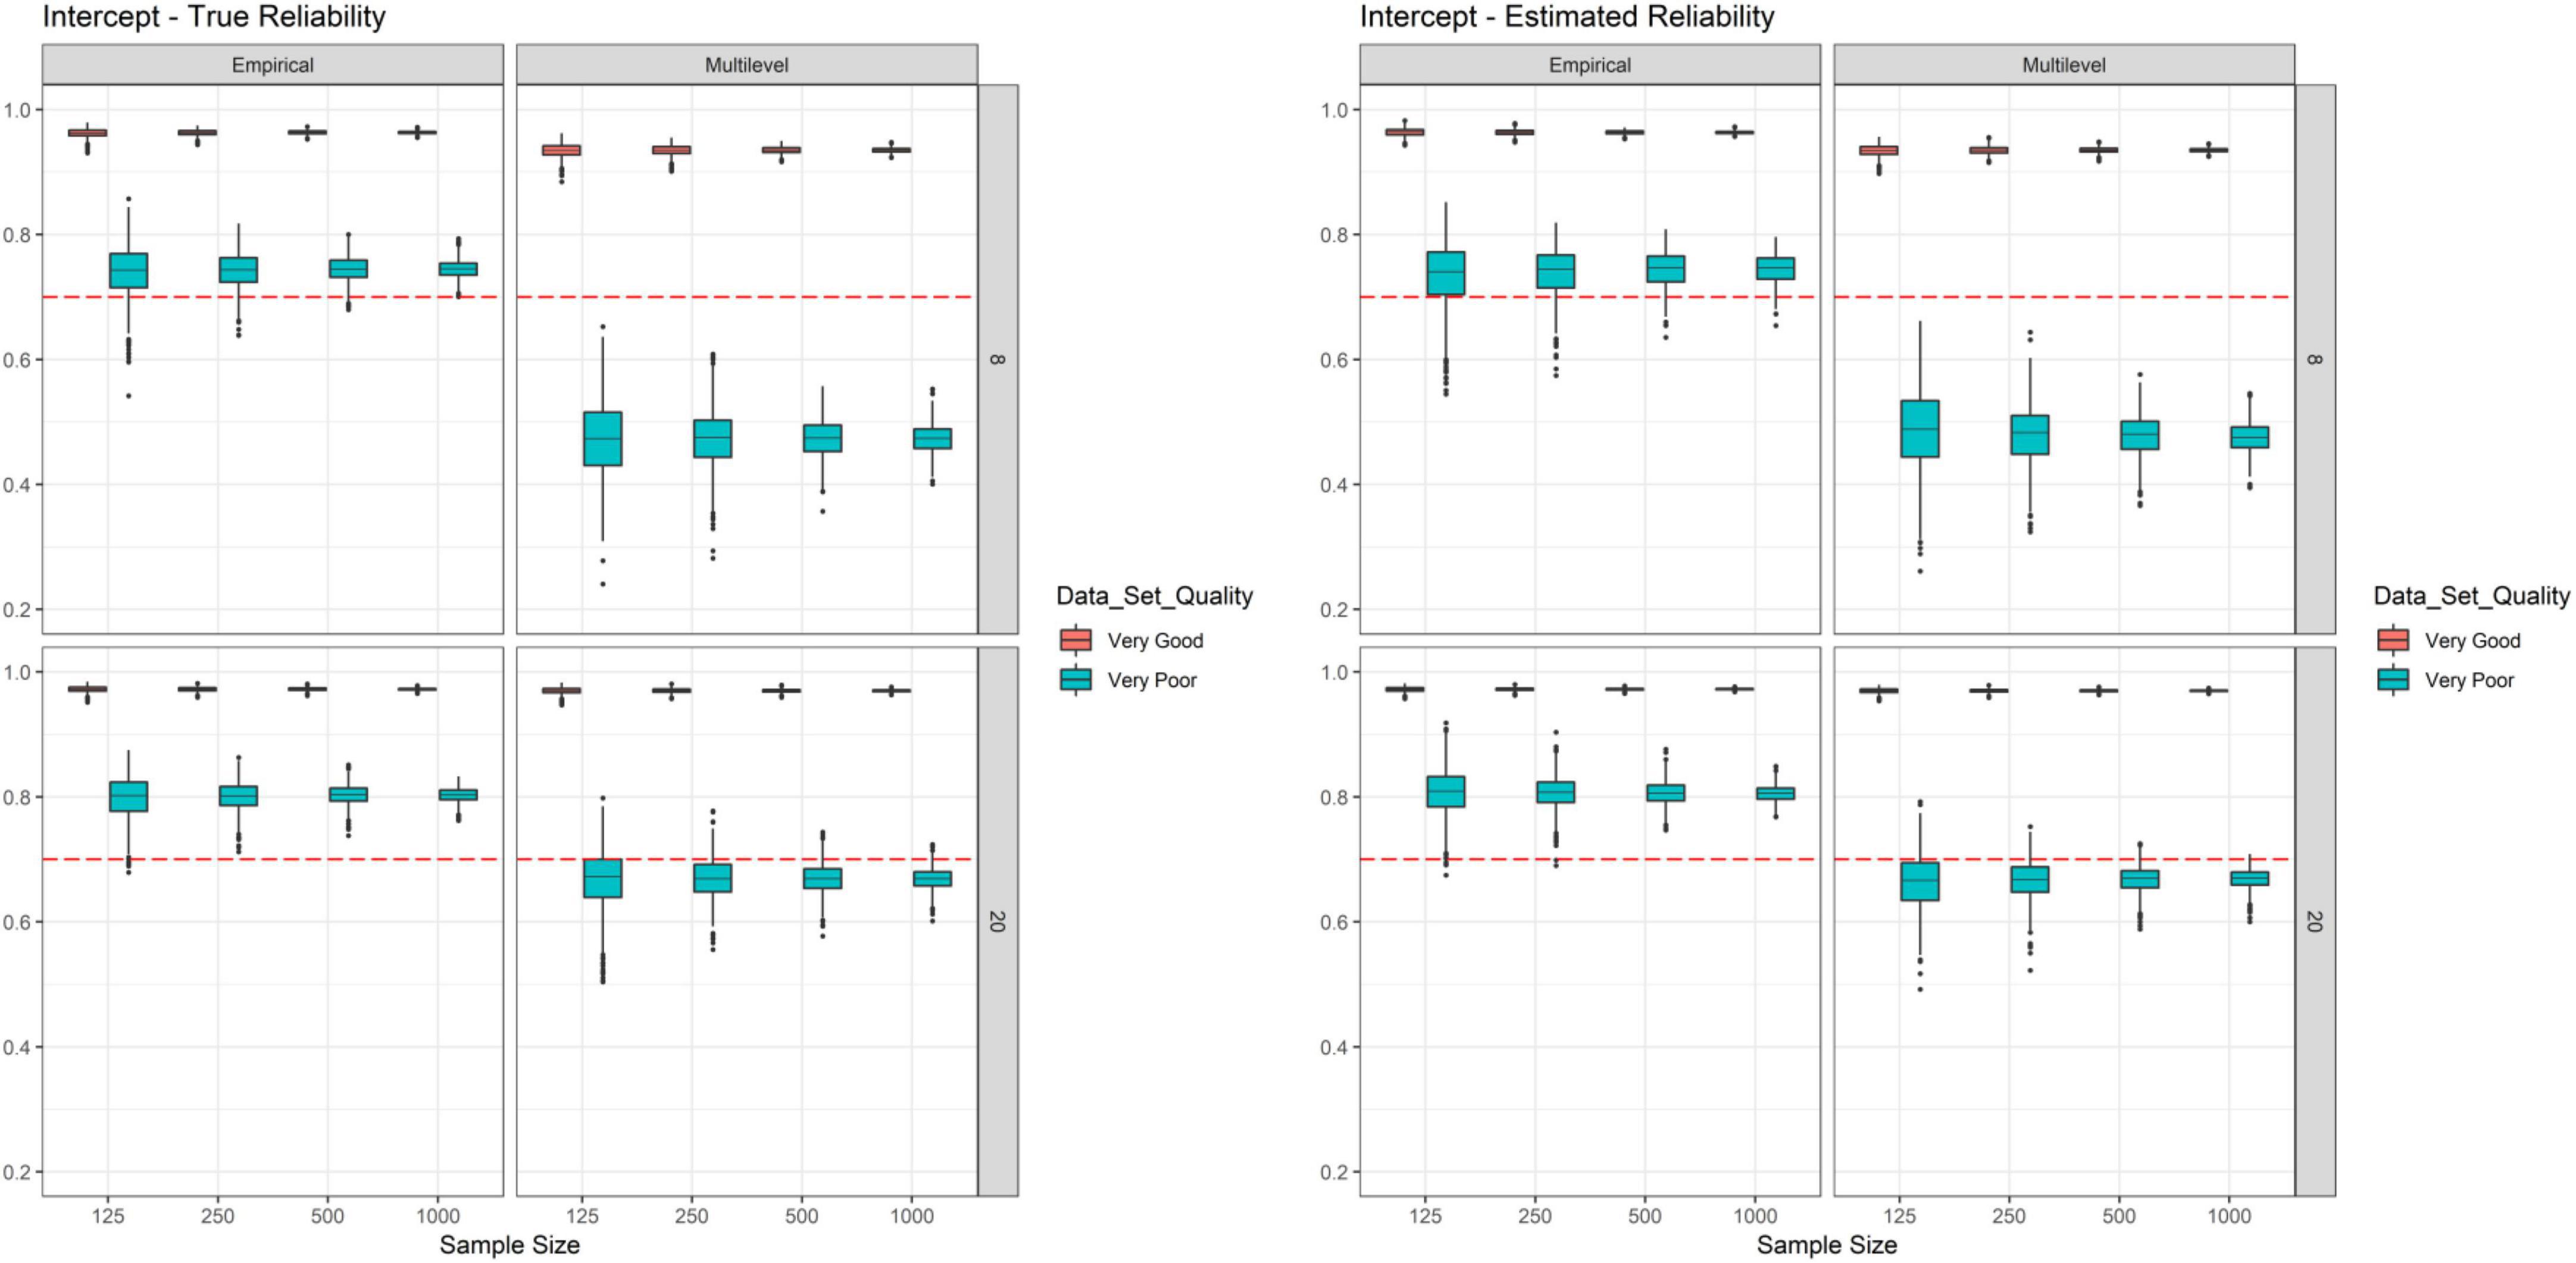
Figure 1. Simulation study–true reliability and estimated reliability of intercepts. Each box represents one cell of the simulation design and is based on 1,000 replications.
However, for true slope reliability (see left side in Figure 2) we found that reliabilities were only higher than 0.70 for very good data quality and when 20 measurement points were used. The average true multilevel reliabilities replicated the findings of Christ et al. (2012) well. For example, for very poor data quality and eight measurement points we found an OLS slope reliability of 0.40 for all sample size conditions, Christ et al. found 0.38 (the slight difference can be explained by their much smaller simulated sample size), whereas for very good data quality and 20 measurement points we found a reliability of 0.91 (across all simulated sample sizes) and Christ et al. also reported 0.91. These observations emphasize that our simulation setup is well linked to previous simulation studies. In addition, as for intercept reliability a clear main effect of data quality was observed (see red vs. cyan colored boxes on the left side in Figure 2). We further observed a clear main effect of measurement timepoints. The difference between empirical and multilevel reliability was not as strong for slope reliability as compared to intercept reliability (still the difference was stronger for very poor data quality vs. very good data quality, but also for 8 measurement points vs. 20 measurement points). Yet, as expected, again empirical reliability tended to be higher than multilevel reliability. Similarly, sample size had an effect on variability of true slope reliabilities. Estimated slope reliabilities, however, did not follow the true slope reliability findings and thus differed to intercept reliability findings above. Especially empirical reliability with very poor data quality and eight measurement points was heavily positively biased, i.e., true reliability was found to be strongly overestimated. Differences between true and estimated slope reliability were not as extreme for multilevel reliability. These observations are further illustrated in Figure 3 which depicts the bias of the estimates. There are several other conditions associated with very poor data quality and the smallest sample size in which reliability tended to be overestimated (also for multilevel reliability and intercept reliability; see Figure 3). Thus, under certain conditions empirical reliability will provide a far too optimistic estimation of slope reliability, whereas multilevel reliability will provide a conservative estimate. Other biases tended to be negligible.
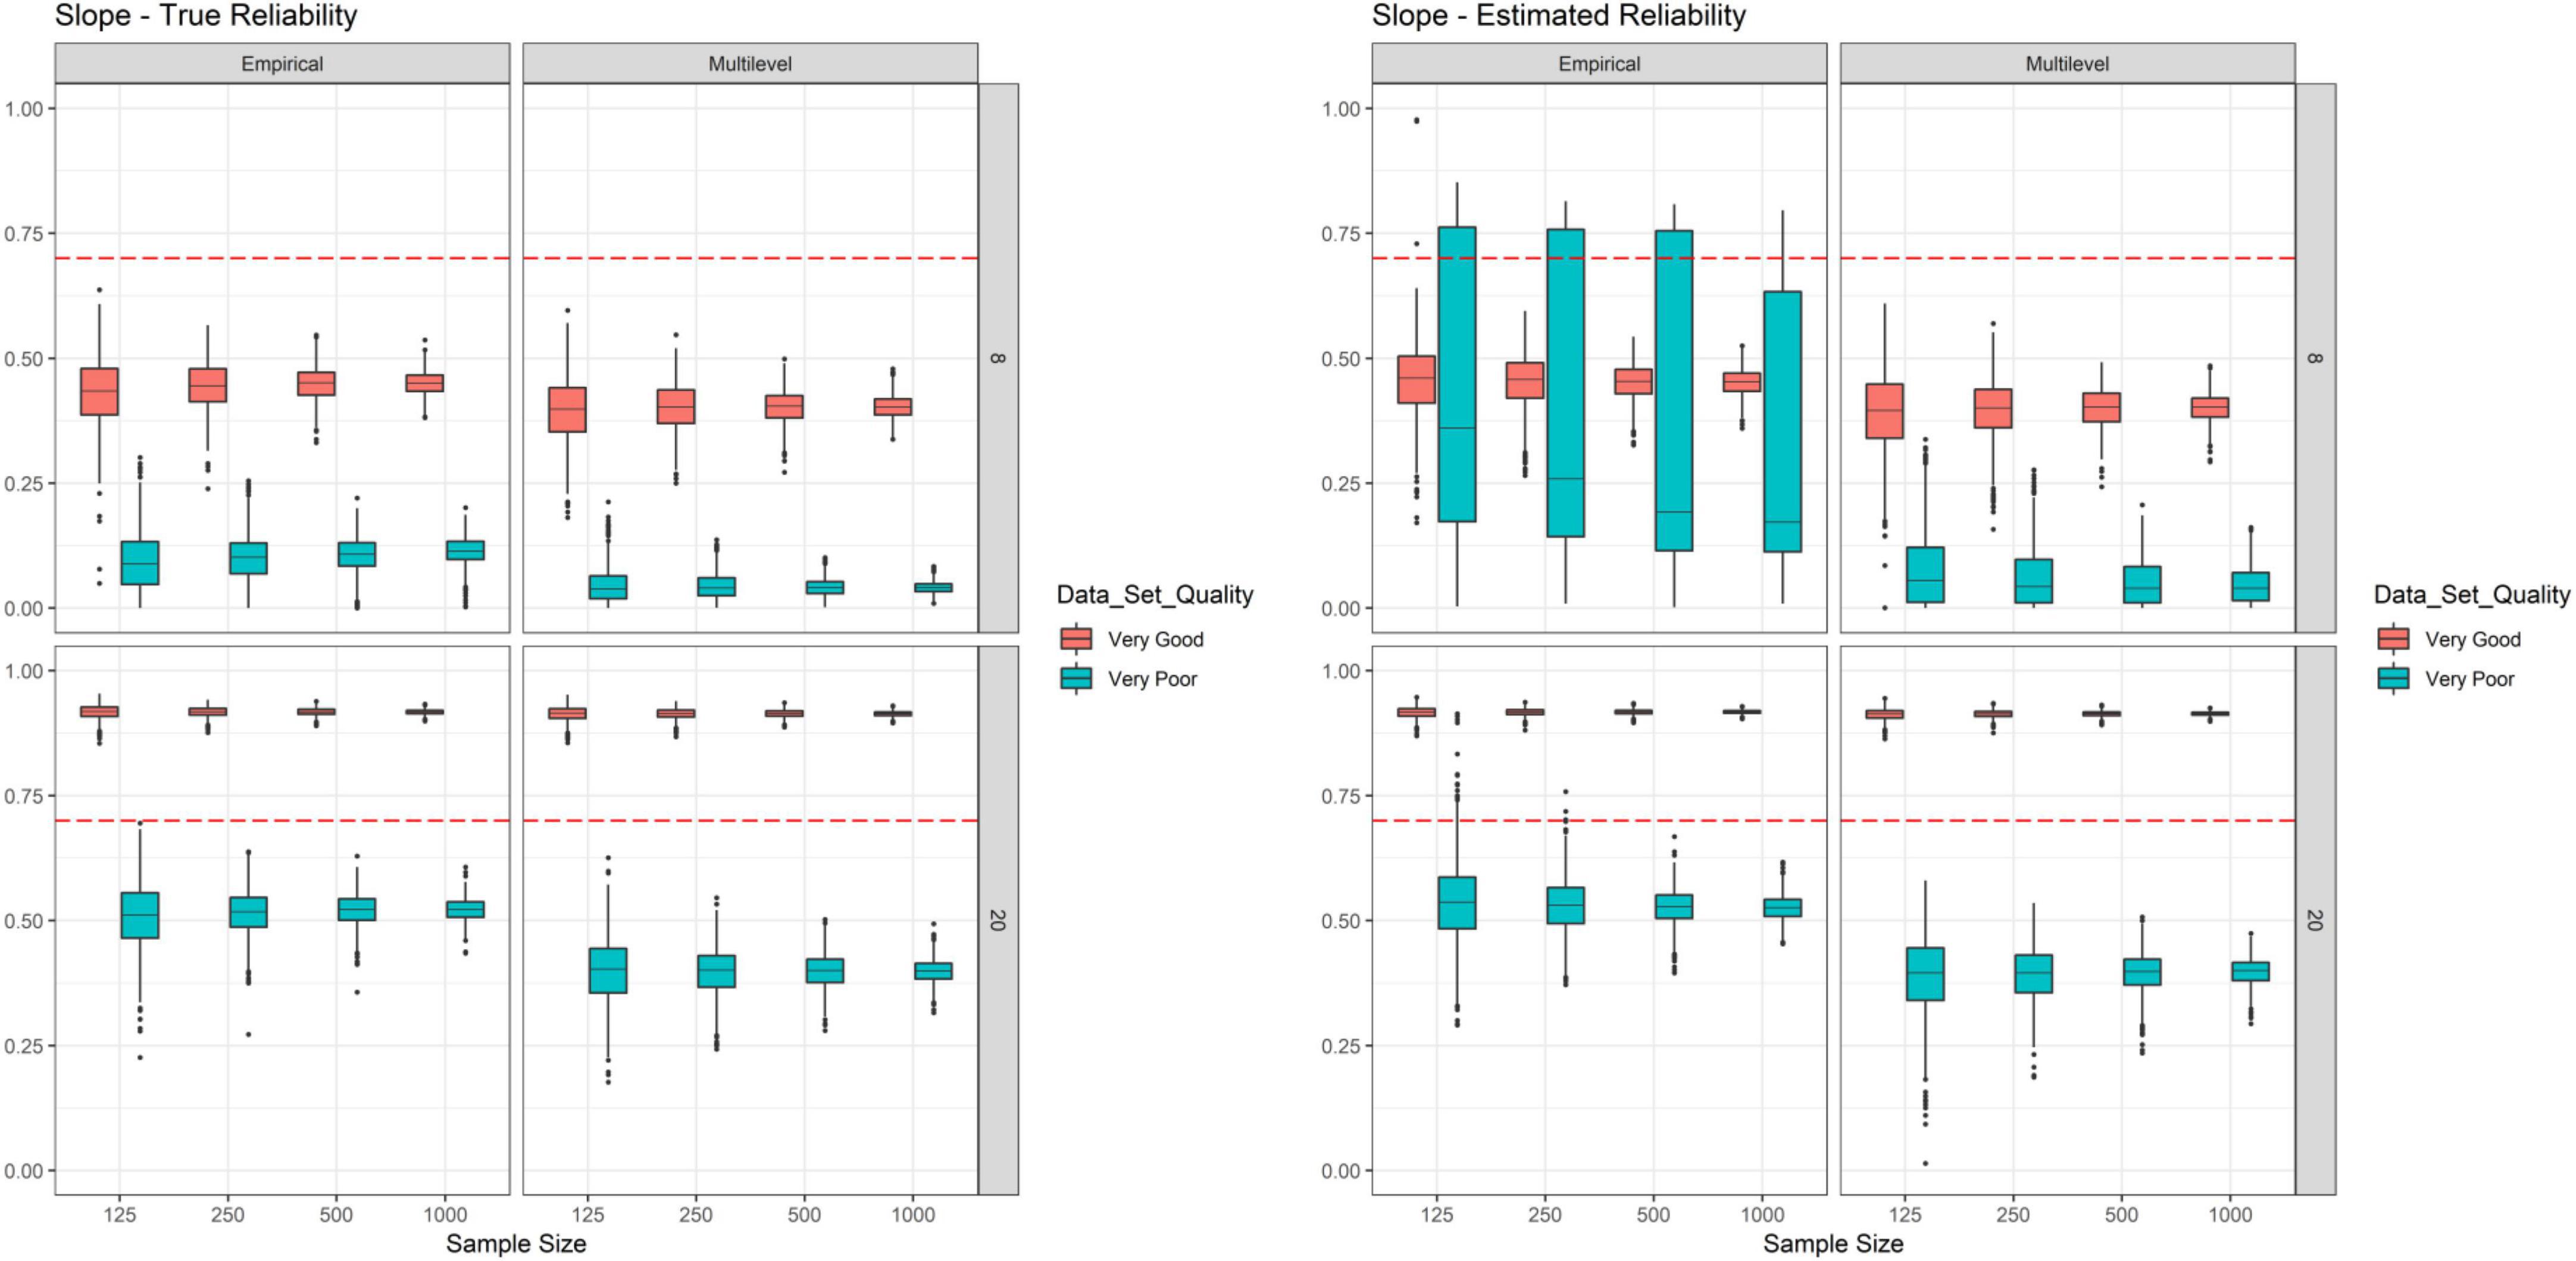
Figure 2. Simulation study–true reliability and estimated reliability of slopes. Each box represents one cell of the simulation design and is based on 1,000 replications.
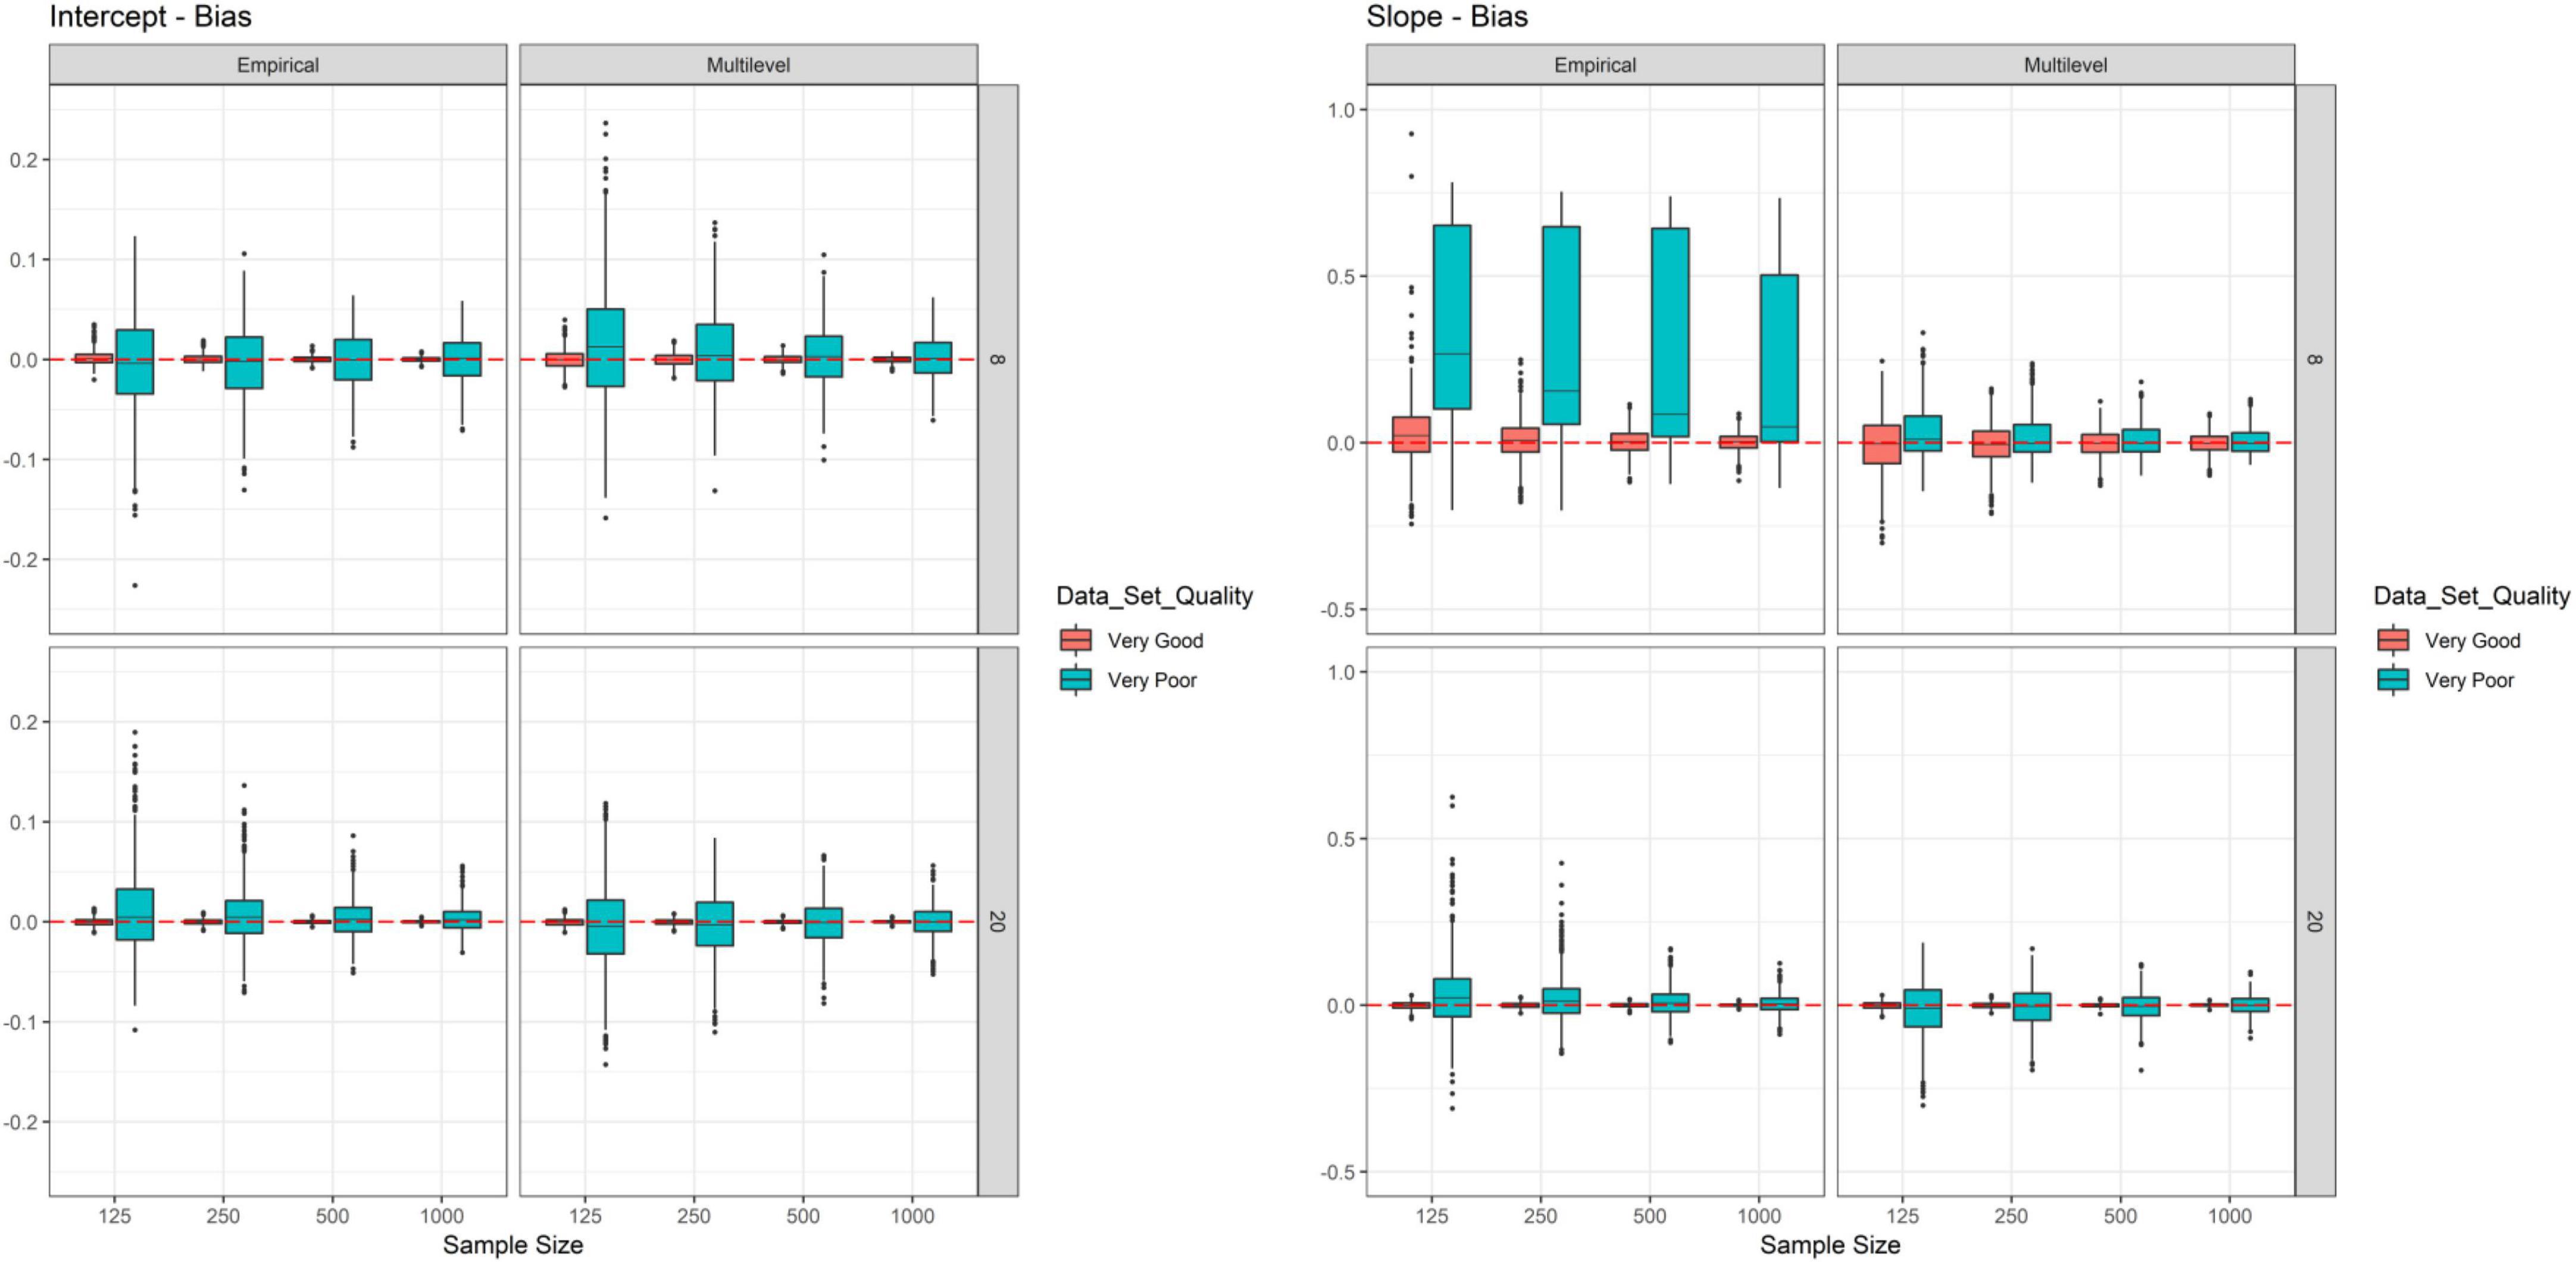
Figure 3. Simulation study–bias results. Each box represents one cell of the simulation design and is based on 1,000 replications.
Finally, we evaluated RMSE as another measure of reliability estimation accuracy (see Figure 4). It should be noted that RMSEs for intercepts and slopes cannot be directly compared because both are per design on a different scale. RMSE was again a function of data quality with smaller values resulting for very good data quality (vs. very poor data quality). The only exception from this observation was for slope multilevel reliability with eight measurement points. Here, the differences were only negligible small and the amount of the difference depended on sample size (ranging from no difference for N = 125 to the highest difference for N = 1,000). This pattern can be explained by the known outlier sensitivity of the RMSE as a measure of accuracy and the findings obtained for true and estimated slope multilevel reliability as shown in Figure 2. For example, estimated reliability for the sample size of N = 125 had much more extreme points at the lower tail of the distribution when data quality was very good (red-colored box), whereas much more extreme points at the upper tail of the distribution were observed for very poor data quality (cyan-colored box). These extreme values at the respective tails of the distributions of estimated slope multilevel reliabilities surpassed the respective tails of the distributions of true reliabilities. Overall, this pattern resulted in highly similar RMSEs. This pattern diminished with increasing sample sizes, but was still clearly observable for N = 250 and N = 500.
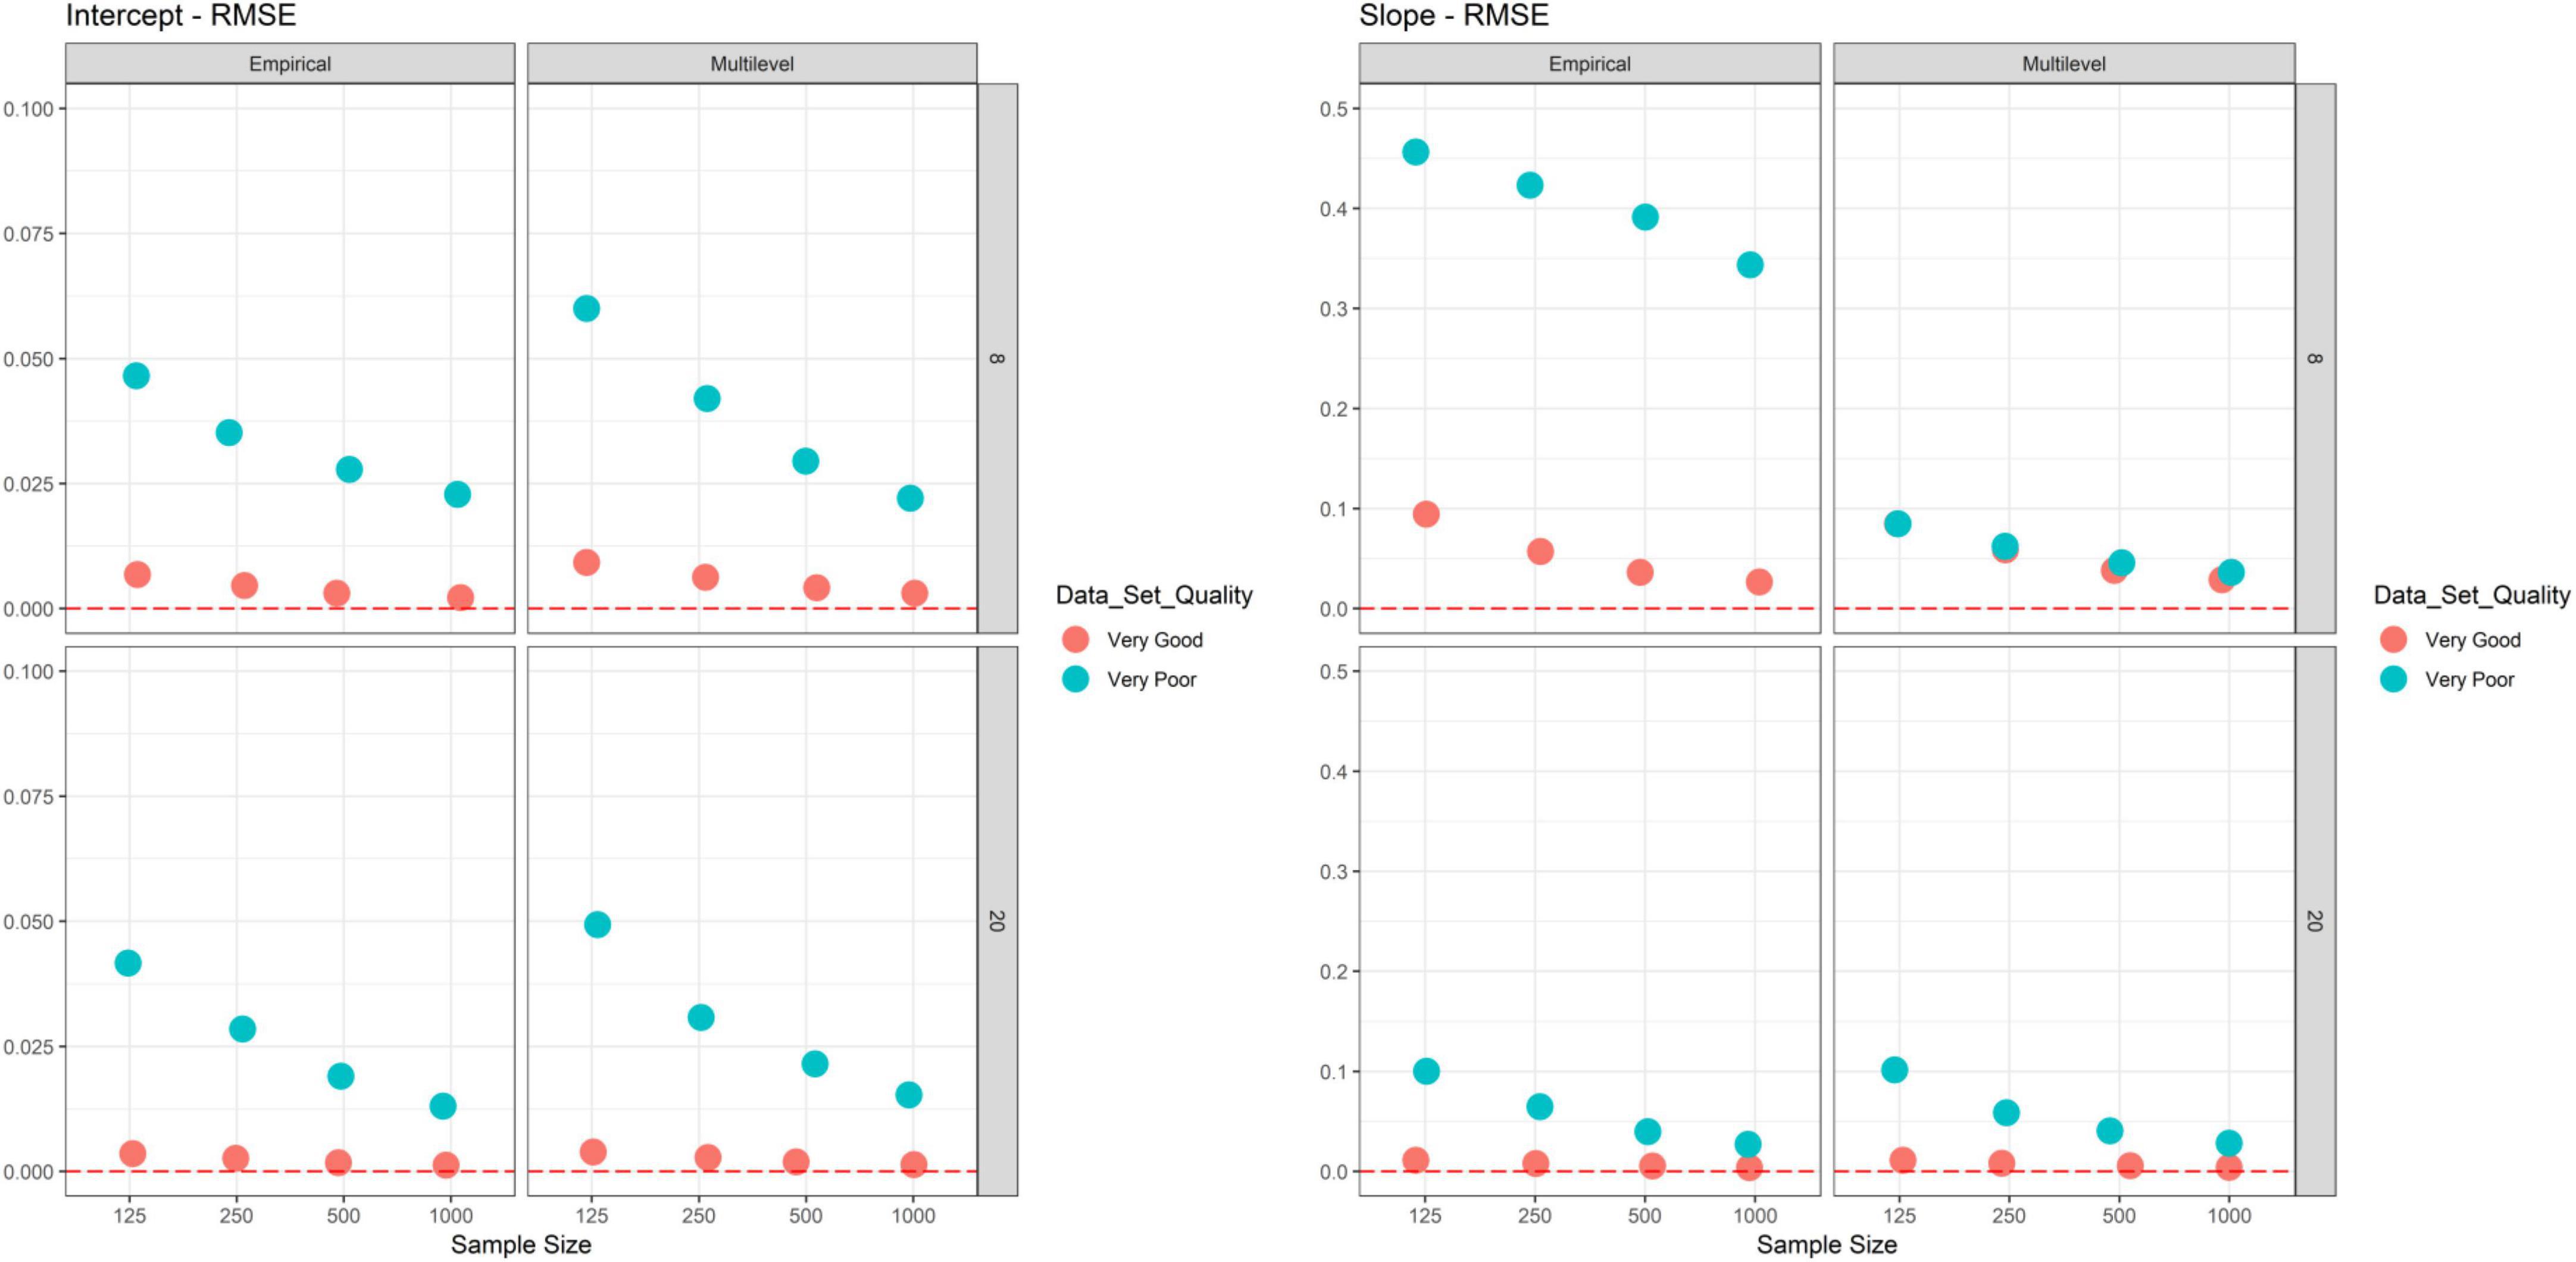
Figure 4. Simulation study–RMSE results. Displayed is the RMSE for each cell of the design (1,000 replications).
Empirical illustration
Materials and methods
Participants
The sample used in this work comprised of N = 4,970 second-grade school students (nested in 298 classes) taken from the 2018 cohort (i.e., school year 2018/2019) which were assessed by the quop-L2 test series (Förster and Kuhn, 2021; Förster et al., 2021). The students in the final sample had a mean age of 7.95 years (SD = 0.48), 53% were boys and 47% were girls, and 81% did not have a migration background whereas 19% had a migration background. Notably, the cohort included initially 6,000 students, yet 1,030 were excluded for various reasons (students from international schools: n = 140; students from a different grade level who were assigned to quop-L2: n = 227; students with an age below 6 years: n = 3; students with an age above 12: n = 94; students with missing values on all measurement points: n = 333; and duplicate cases: n = 233). The same sample has been used in a recent study with a different focus (Forthmann et al., 2022).
The quop-L2 test series for progress monitoring in reading
The quop-L2 test for reading achievement is comprised of four short equivalent versions with subscales at the word, sentence, and text level. The items of the tests were constructed based on three dichotomous item-features that determine item difficulty to a great extent. At the word level items were word/pseudoword discrimination tasks (item features were number of syllables, word frequency, and the number of orthographic neighbors), sentence level items were sentence verification tasks (item features were propositional density, associations between target words, and complexity of the sentence structure), and items at the text level required a decision if a third sentence fits a story based on two initially presented sentences (item features were use of personal pronouns, content, and the presence of causal relationships). Each of the four tests included 20 word level items, 13 sentence-level items, and 13 text-level items. Each test was administered two times throughout the school year (i.e., there were eight measurement points). Students were randomly assigned to groups which received different combinations of test halves to prevent confounding of items and measurement points (Klein Entink et al., 2009). The eight measurement points of quop-L2 assessments were administered via the computerized quop assessment system (Souvignier et al., 2021). The tests were completed when students were studying on their own or in group sessions throughout the schoolyear. The quop-L2 tests displayed acceptable to excellent psychometric properties (Förster et al., 2021).
Analytical approach
All data and the analysis script to reproduce the reported findings in this work are openly available via a repository in the Open Science Framework2.
To correct for fast guessing (Wise and DeMars, 2010; Wise, 2017) and inacceptable slow responding we used subscale specific quantiles as cut-offs for valid response behavior (fast guessing: 5%-quantile; slow responding: 99.5%-quantile). We obtained these quantiles across all items of each of the respective subscales (word level: lower bound = 1362.98 ms, upper bound = 41032.86 ms; sentence level: lower bound = 1427.02 ms, upper bound = 53742.18 ms; text level: lower bound = 877.36 ms, upper bound = 85836.71 ms). Item accuracy was scored after taking these cut-offs into account. The CISRT efficiency scoring was used to reflect reading achievement beyond accuracy (Maris and van der Maas, 2012). CISRT scoring requires item timing, but here assessment was untimed. Hence, the time cut-offs were used for CISRT scoring. Item scores were averaged for each subscale (i.e., word, sentence, and text level) and scaled to be in the range from 0 to 10.
The quop-L2 test series allows to model reading achievement as a higher-order factor based on word, sentence, and text level scores as observed indicators (Forthmann et al., 2022). Such an approach was also employed in the current work for the evaluation of longitudinally strong measurement invariance (Vandenberg and Lance, 2000) prior to growth modeling which is recommended in the progress monitoring literature (Schurig et al., 2021). This way comparisons across timepoints are not confounded by psychometric properties. Specifically, we evaluated three levels of measurement invariance: (a) configural invariance, (b) weak invariance, and (c) strong invariance. First, a configural model was evaluated. Reading achievement was modeled as a latent variable at each of the eight measurement points by the three observed scores at word, sentence, and text level. For model identification purposes the loading of the sentence level score was fixed to one. Residuals of the observed scores were not allowed to covary, but all latent variable latent covariances were freely estimated. Next, this configural model (Model 1) was compared to two alternative configural models. In an alternative configural model (Model 2) we allowed residuals of the scores at the same level of language to covary (e.g., the residuals of all sentence scores were allowed to covary). However, the modeling of residual covariances for sentence level scores was empirically not supported and, hence, another configural model with residual covariances only at the word and text levels were considered (Model 3). This final model on which measurement invariance testing was based is depicted in Figure 5.
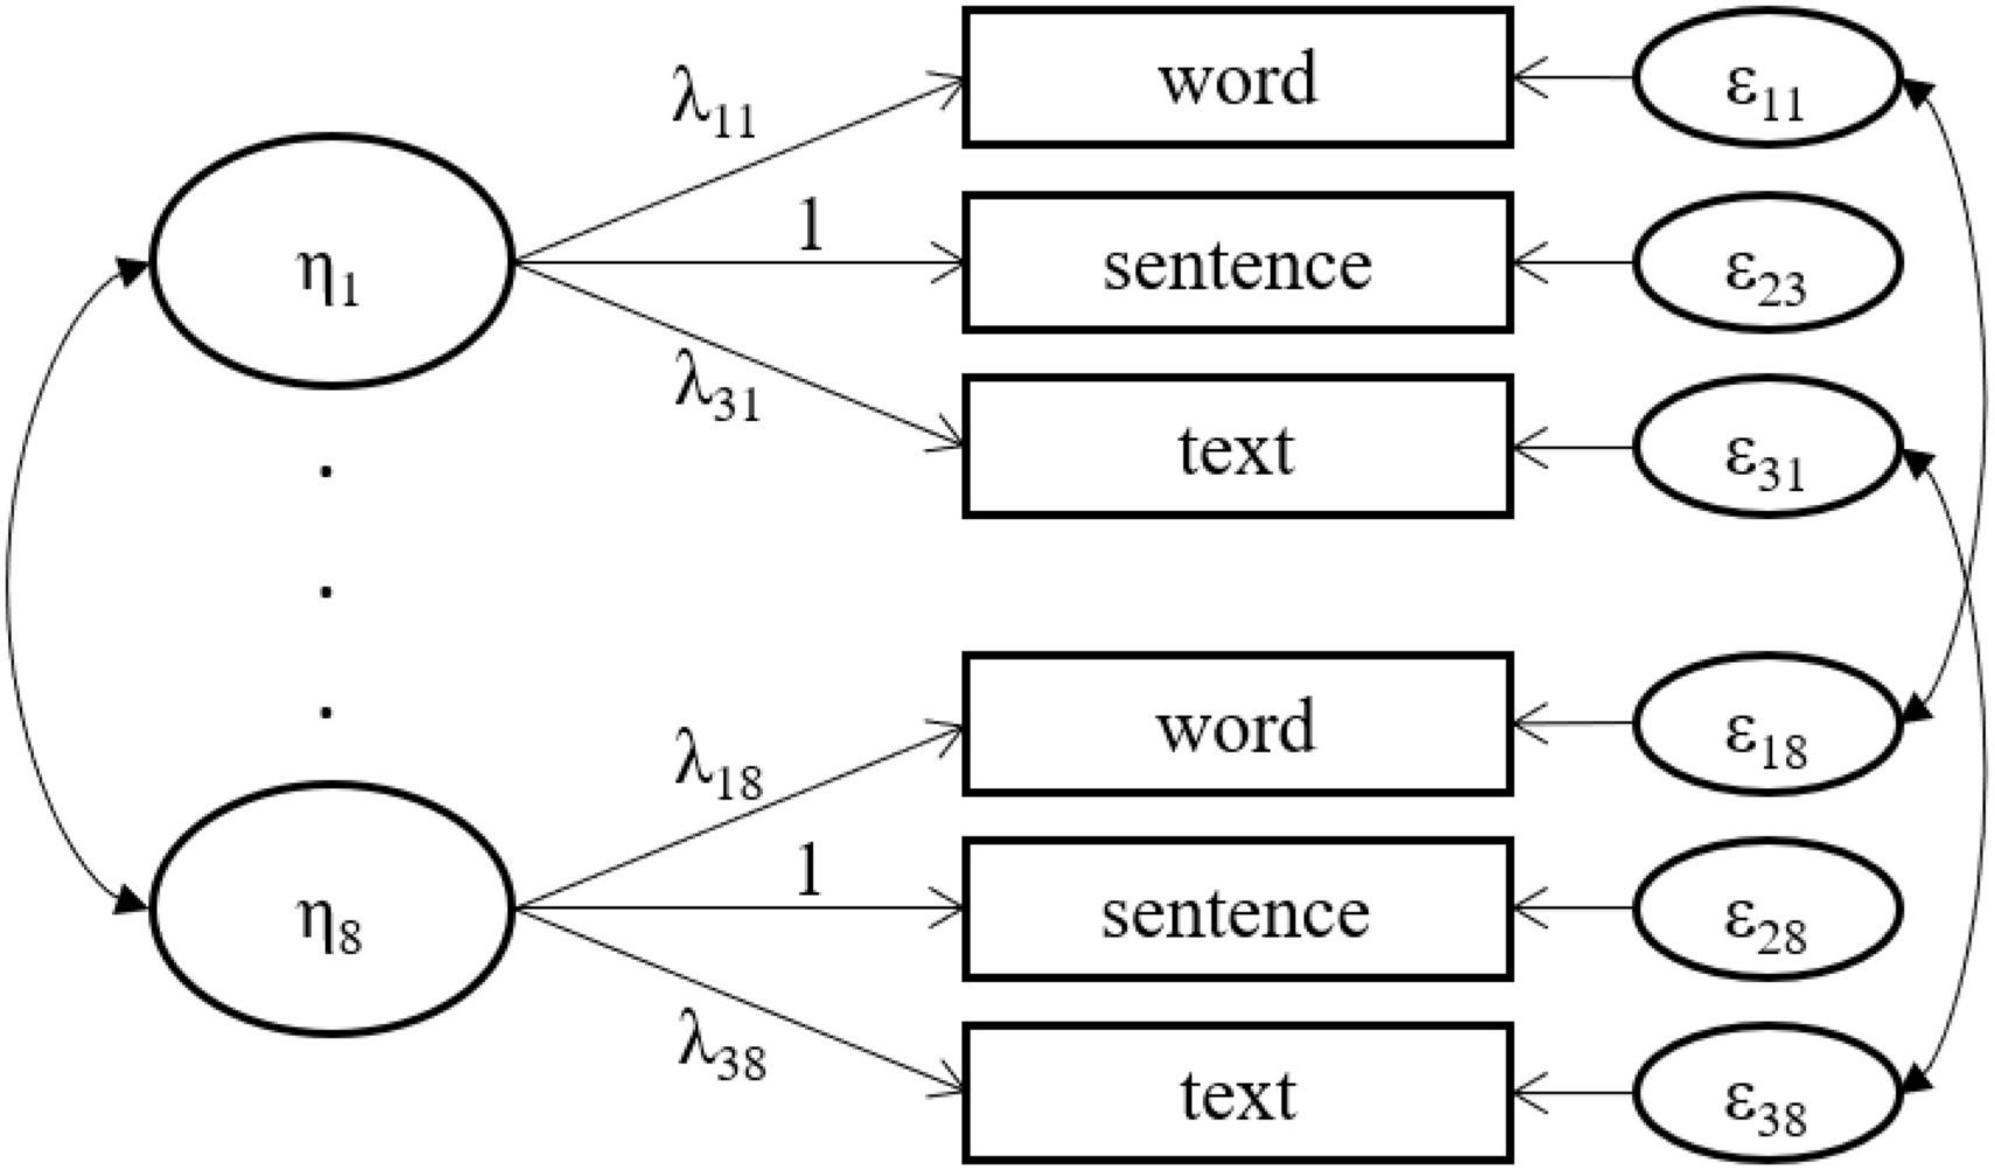
Figure 5. Longitudinal confirmatory factor analysis model. ηt denotes a latent reading achievement variable measured at time t. λit indicates a factor loading (fixed to 1 for sentence-level indicators). For simplicity, item and factor intercepts are omitted from the path model.
The statistical software R was used for data analysis (R Core Team, 2021). We used the lavaan package (Rosseel, 2012) for measurement invariance testing. Robust full information maximum likelihood estimation was employed for two reasons: (a) multivariate normality was violated, and (b) missing values were present in the data. Model fit was evaluated based on common cut-offs in the literature (West et al., 2012). Evidence in favor of strong measurement invariance for efficiency was already reported in detail by Forthmann et al. (2022) and we do not repeat the statistics here. Consequently, reading achievement as modeled in this work based on quop-L2 displayed time-invariant loadings and intercepts of observed indicators.
The Bartlett-method (DiStefano and Zhu, 2009) was used to estimate factor scores based on the longitudinally strong invariance models (i.e., one set of factor scores for each scoring). Factor determinacy indices (FDI) (Ferrando and Lorenzo-Seva, 2018), Cronbach’s α (Cronbach, 1951), and Bollen’s ω1 (Bollen, 1980; Raykov, 2001) were further estimated and are reported in Table 1. The latter two coefficients were estimated by means of the semTools package (Jorgensen et al., 2021). Reliability of efficiency scores at each timepoint was larger than 0.70 as a recommended cut-off for low-stakes decisions (Christ et al., 2005) and all FDIs were greater than 0.80 see Ferrando and Lorenzo-Seva (2018).
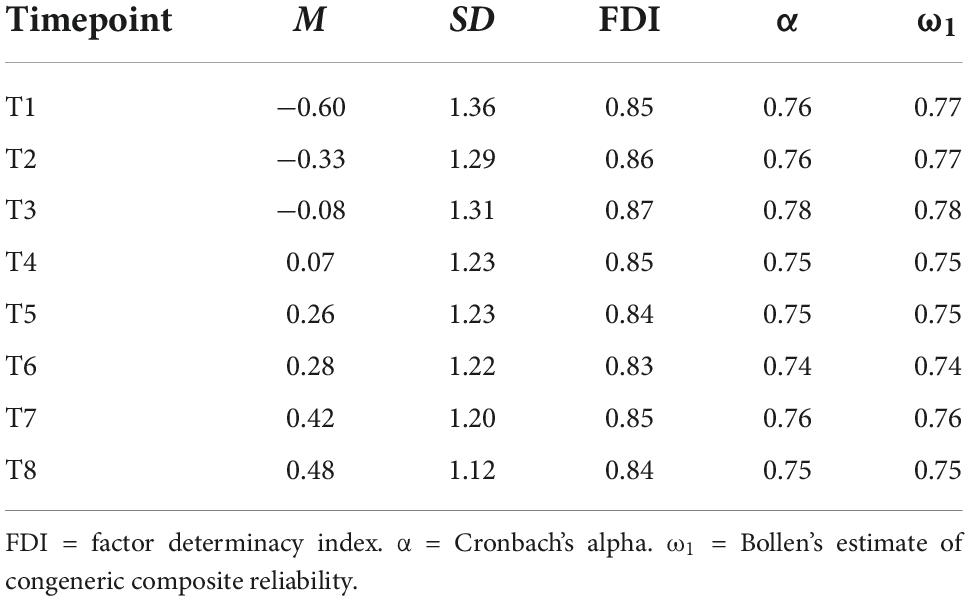
Table 1. Descriptive statistics and reliability estimates for reading achievement at each measurement timepoint.
In a next step, we subjected the factor scores to linear latent growth modeling (i.e., a random-intercept-random-slope model) which was estimated by means of the lme4 package (Bates et al., 2015). Intercept and slope varied across students. The timepoint variable in the analyses was coded in a way that allows to interpret the intercept as the initial level of reading achievement in the schoolyear (i.e., the first timepoint was coded as zero). Multilevel reliability was calculated as the ratio of estimated slope variance to observed variance (i.e., the variance of individual OLS slope estimates; Van Norman and Parker, 2018). Finally, we obtained the slope variance from the estimated growth models and the average squared standard error of learning progress estimates for estimating empirical reliability (Brown and Croudace, 2015): Empirical Reliability = . For completeness, we also assess reliability of the initial level estimates.
Results and discussion
Efficiency scores increased on each subsequent measurement point (see Table 1), while the standard deviation decreased over time. Figure 6 provides a graphical illustration of individual learning progress and the average growth which was slightly non-linear.
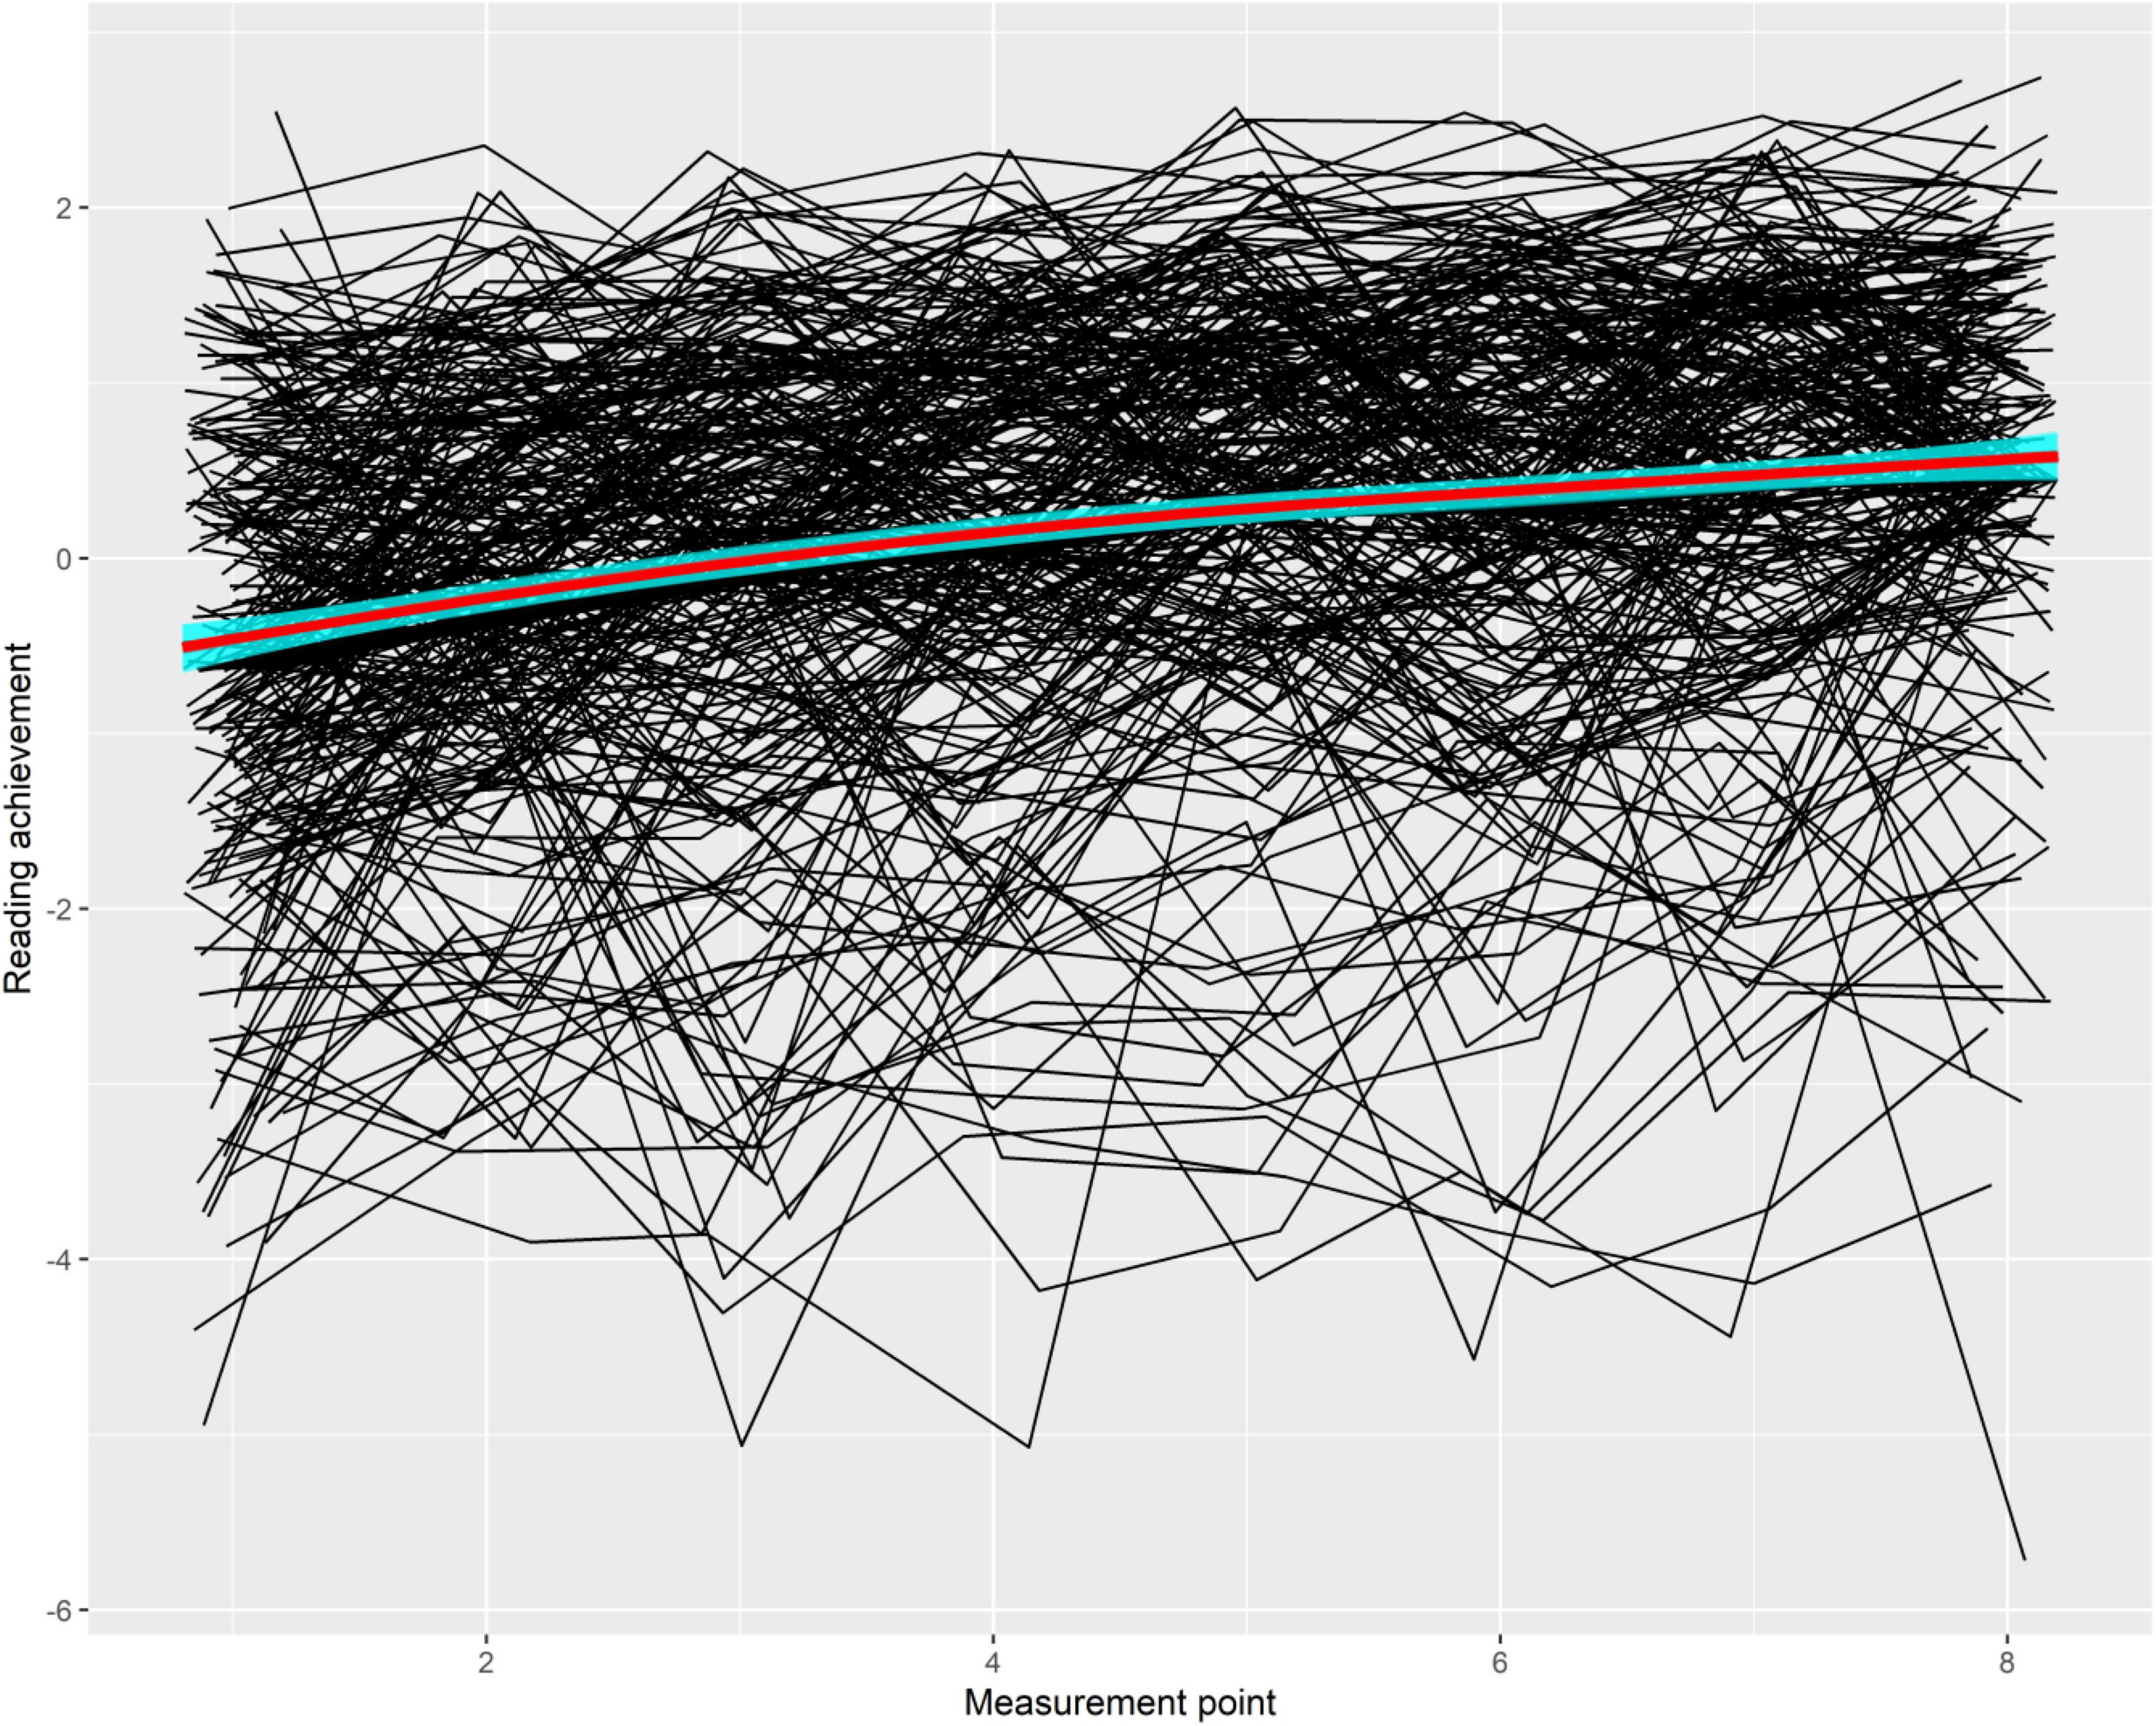
Figure 6. Spaghetti plot for learning growth trajectory of students. We chose trajectories of n = 300 students at random to increase the interpretability of the plot. Red line represents LOESS-smoothed average growth trajectory. Standard error band is shown in cyan.
Initial level and slope reliability findings
The estimates of the random-intercept-random-slope model revealed an average intercept of −0.46 and an average slope of 0.15. Intercept and slope variances are reported in Table 2, with much higher intercept variation across students as compared to slope variation. The latent variable correlation between initial level and learning progress was found to be r = −0.55. Table 2 summarizes the initial level and slope reliability estimates. Reliability of intercept estimates was generally good to excellent, whereas slope reliability was comparably lower and below proposed cut-offs (e.g., 0.70). Then, as expected, it was further observed that multilevel reliability estimates were smaller as compared to empicial reliability. Yet, the observed differences were not large. In other words, latent variable scores were not much more reliable than observed OLS estimates.
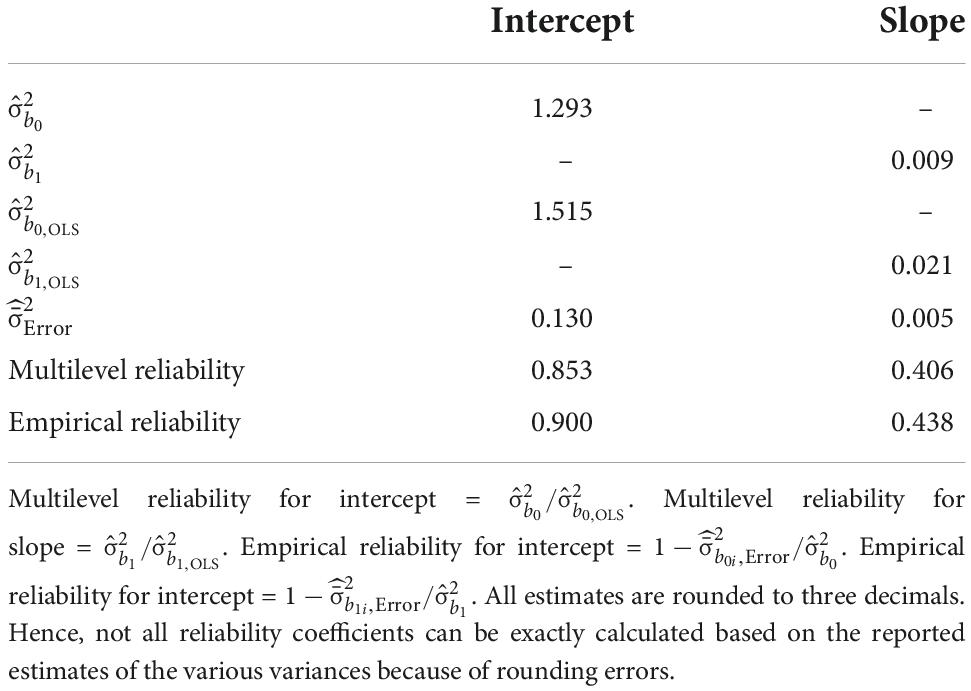
Table 2. Reliability estimates at the student level and at the class level.
To further check the trustworthiness of these reliability estimates, we reran the simulation based on the parameters obtained for the quop-L2 scores. As in the simulation study reported above, we ran 1,000 replications (the file to run this simulation is also available in the OSF repository). True multilevel reliability for intercept (0.85) and slope (0.41), as well as true empirical reliability for intercept (0.90) and slope (0.44) were highly comparable with the estimates obtained for the empirical data. In addition, estimated reliability for the simulated data matched true reliability very well. This was the case for intercept (0.85) and slope (0.41) multilevel reliability, as well as intercept (0.90) and slope (0.41) empirical reliability estimates. Thus, for the parameter estimates and the sample size of the quop-L2 data in this work, reliability estimation can be considered unbiased. In addition, the fact that reliability estimates obtained for the empirical data matched the simulation well further corroborates the impression of accurate reliability estimation for these data.
Discussion
In this study, we examined how well reliability estimates actually quantify true reliability in a simulation study, and we evaluated more closely how reliability estimated for slopes as a latent variable performs in comparison to reliability estimated for slopes as an observed variable. Our simulation study revealed that estimation of multilevel as well as empirical reliability works well across a variety of conditions. Yet, especially conditions affected by very poor data quality, small sample size (i.e., N = 125), and or rather few measurement points (i.e., eight measurement points) were found to result in slightly biased reliability estimation. In particular, empirical reliability estimates of learning progress was found to be upwardly biased when dataset quality was very poor and when only eight measurement points were available. Increasing sample size under such conditions did not remedy the observed bias. We recommend that researchers use the openly available R scripts that come along with this paper to run a simulation based on obtained parameters for a given dataset. This should be especially done when data are found to be similar to the conditions in which reliability estimation was biased in our study. Overall, however, we conclude that reliability estimation works across a variety of simulation conditions used in previous work (Christ et al., 2012).
In addition, we estimated multilevel and empirical reliability for the quop-L2 reading test series which allows for progress monitoring in everyday classrooms (Förster et al., 2021; Souvignier et al., 2021). We found that multilevel and empirical reliability findings were similar in size to true and simulated reliability for eight measurement points and very good data quality in our simulation study. Relatedly, previous work estimated true multilevel reliability in simulation studies on slope estimation methods in the progress monitoring literature (Christ et al., 2012, 2013b; Christ and Desjardins, 2018). The squared correlation between estimated slopes and their true values (i.e., reliability) has been commonly used as dependent variable in these simulation studies which is conceptually the same quantity that one is trying to estimate by multilevel reliability. These findings serve further as a benchmark for interpretation of the current findings. For example, researchers found a range for simulated good quality data and 8 weeks time schedule of 0.10 to 0.45 (Christ et al., 2012, 2013b). In light of these previous results one can again conclude that the findings in this study with a multilevel reliability of 0.41 again imply that reliability findings for quop-L2 provides are in accordance with reliability findings for progress monitoring data of good to very good quality.
Limitations and future directions
The main aim of this research was to extend previous work on the reliability of learning progress estimates by evaluating how well multilevel and empirical reliability work. Notably, empirical reliability as a way to quantify measurement precision has wide potential for applications in progress monitoring beyond the used simulation model and data used for illustration in this work. Yet, concrete findings reported here are limited to the conditions of our simulations and data which represent learning progress assessment as a form of progress monitoring in everyday school contexts. While this limitation is important when it comes to interpretations of the empirical findings in this work, we do not see that application of the approach in other forms of progress monitoring is undermined. Empirical reliability can readily be calculated as long as individual progress estimates and associated standard errors are available (e.g., when latent growth modeling is used).
We have discussed above findings from simulation studies on slope estimation approaches in the CBM literature. These findings might serve as a benchmark for the findings in this work. In a sense, partially replicating previous work emphasizes their validity. However, it should not be overlooked that these simulations—and, hence, also the simulation study reported in this work—specify a set of population parameters for simulation that is informed by CBM research and not by learning progress assessment research. However, with this work, we provide open material that facilitates data simulations of progress monitoring data. Hence, we recommend running new simulations for other learning progress assessment conditions to complement interpretation of reliability estimates. Such a step is illustrated in this work and can be understood as a check of model fit. If simulated true and estimated reliabilities are far off the estimates obtained for a data set a cautious interpretation of findings is needed.
Conclusion
In this work we extended previous simulation studies on the reliability of learning progress assessment. First, previous work focused mainly on true reliability, whereas here we focused on how well reliability estimation works. Second, we additionally focused on empirical reliability as a way to quantify measurement precision of latent variable scores obtained from latent growth modeling. Overall, we found that reliability estimation works for a variety of conditions and recommend to check this locally by adapting our openly available simulation material. In addition, empirical vs. multilevel results may provide critical information to decide which estimate should be used in research and practice. For example, when OLS estimates turn out to be unreliable, latent variable estimates of learning progress might still be a useful option. For future work we recommend to estimate both types of reliabilities to be maximally informed.
Data availability statement
The datasets presented in this study can be found in online repositories. The name of the repository and accession number can be found below: Open Science Framework; https://osf.io/mn5hx/.
Ethics statement
This study was carried out in accordance with the recommendations by the Ethics Committee of the Department of Psychology of the University in Münster. Ethical review and approval was not required for the study on human participants in accordance with the local legislation and institutional requirements. For participants involved in this study, either informed consent was obtained from their parents or their participation was regulated based on a contractual regulation that allowed us to use participant data in an anonymized form for scientific purposes.
Author contributions
BF had the idea for the research reported in this work, analyzed the data, and wrote a first draft. NF was responsible for the development and research design of the quop-L2 test series. NF and ES contributed in commenting, editing, and writing to the manuscript. ES provided relevant resources. All authors contributed to the article and approved the submitted version.
Acknowledgments
We express our gratitude to Mathis Erichsen who developed parts of our data preparation R script. We would further like to thank Ethan R. Van Norman for sharing his R code on how to calculate multilevel reliability and Chris Schatschneider for sharing detailed information on how he calculated multilevel reliability in his work. Finally, we acknowledge support from the Open Access Publication Fund of the University of Münster.
Conflict of interest
The authors declare that the research was conducted in the absence of any commercial or financial relationships that could be construed as a potential conflict of interest.
Publisher’s note
All claims expressed in this article are solely those of the authors and do not necessarily represent those of their affiliated organizations, or those of the publisher, the editors and the reviewers. Any product that may be evaluated in this article, or claim that may be made by its manufacturer, is not guaranteed or endorsed by the publisher.
Footnotes
References
Bates, D., Martin, M., Ben, B., and Steve, W. (2015). Fitting linear mixed-effects models using LME4. J. Stat. Softw. 67, 1–48. doi: 10.18637/jss.v067.i01
Beisemann, M. (2022). A flexible approach to modelling over-, under- and equidispersed count data in IRT: The two-parameter conway-maxwell-poisson model. Br. J. Math. Stat. Psychol. 75, 411–443. doi: 10.1111/bmsp.12273
Bollen, K. A. (1980). Issues in the comparative measurement of political democracy. Am. Sociol. Rev. 45:370. doi: 10.2307/2095172
Brown, A., and Croudace, J. T. (2015). “Scoring and Estimating Score Precision Using Multidimensional IRT Models,” in Multivariate Applications Series. Handbook of Item Response Theory Modeling: Applications to Typical Performance Assessment, eds P. Steven, Reise and A. Dennis Revicki (Routledge/Taylor & Francis Group), 307–333.
Bulut, O., and Cormier, D. C. (2018). Validity evidence for progress monitoring with star reading: Slope estimates, administration frequency, and number of data points. Front. Educ. 3:68. doi: 10.3389/feduc.2018.00068
Christ, T. J., and Desjardins, C. D. (2018). Curriculum-based measurement of reading: An evaluation of frequentist and bayesian methods to model progress monitoring data. J. Psychoeduc. Assess. 36, 55–73. doi: 10.1177/0734282917712174
Christ, T.J., Johnson-Gros, K.N., and Hintze, J.M. (2005). An examination of alternate assessment durations when assessing multiple-skill computational fluency: The generalizability and dependability of curriculum-based outcomes within the context of educational decisions. Psychol. Sch. 42, 615–622. doi: 10.1002/pits.20107
Christ, T. J., Monaghen, B. D., Zopluoglu, C., and Van Norman, E. R. (2013a). Curriculum-based measurement of oral reading: Evaluation of growth estimates derived with pre–post assessment methods. Assess. Effect. Interv. 38, 139–153. doi: 10.1177/1534508412456417
Christ, T. J., Zopluoglu, C., Long, J. D., and Monaghen, B. D. (2012). Curriculum-based measurement of oral reading: Quality of progress monitoring outcomes. Except. Children 78, 356–373. doi: 10.1177/001440291207800306
Christ, T. J., Zopluoglu, C., Monaghen, B. D., and Van Norman, E. R. (2013b). Curriculum-based measurement of oral reading: Multi-study evaluation of schedule, duration, and dataset quality on progress monitoring outcomes. J. Sch. Psychol. 51, 19–57. doi: 10.1016/j.jsp.2012.11.001
Cronbach, L. J. (1951). Coefficient alpha and the internal structure of tests. Psychometrika 16, 297–334. doi: 10.1007/BF02310555
Deno, S. L. (1985). Curriculum-based measurement: The emerging alternative. Except. Children 52, 219–232. doi: 10.1177/001440298505200303
Deno, S. L. (1987). Curriculum-based measurement. Teach. Excep. Children 20, 40–42. doi: 10.1177/004005998702000109
DiStefano, C., and Zhu, M. (2009). Understanding and using factor scores: Considerations for the applied researcher. Pract. Assess. Res. Eval. 14:20. doi: 10.7275/da8t-4g52
Ferrando, P. J., and Lorenzo-Seva, U. (2018). Assessing the quality and appropriateness of factor solutions and factor score estimates in exploratory item factor analysis. Educ. Psychol. Measur. 78, 762–780. doi: 10.1177/0013164417719308
Förster, N., Erichsen, M., and Forthmann, B. (2021). Measuring reading progress in second grade: Psychometric properties of the Quop-L2 test series. Eur. J. Psychol. Assess. [Epub ahead of print]. doi: 10.1027/1015-5759/a000688
Förster, N., and Kuhn, J.-T. (2021). Ice is hot and water is dry: Developing equivalent reading tests using rule-based item design. Eur. J. Psychol. Assess. [Epub ahead of print]. doi: 10.1027/1015-5759/a000691
Forthmann, B., Förster, N., and Souvignier, E. (2022). Shaky student growth? a comparison of robust bayesian learning progress estimation methods. J. Intell. 10:16. doi: 10.3390/jintelligence10010016
Forthmann, B., Gühne, D., and Doebler, P. (2020b). Revisiting dispersion in count data item response theory models: The conway–maxwell–poisson counts model. Br. J. Math. Stat. Psychol. 73, 32–50. doi: 10.1111/bmsp.12184
Forthmann, B., Paek, S. H., Dumas, D., Barbot, B., and Holling, H. (2020c). Scrutinizing the basis of originality in divergent thinking tests: On the measurement precision of response propensity estimates. Br. J. Educ. Psychol. 90, 683–699. doi: 10.1111/bjep.12325
Green, B. F., Bock, R. D., Humphreys, L. G., Linn, R. L., and Reckase, M. D. (1984). Technical guidelines for assessing computerized adaptive tests. J. Educ. Measur. 21, 347–360. doi: 10.1111/j.1745-3984.1984.tb01039.x
Haertel, E. H. (2006). “Reliability,” in Educational measurement, ed. R. L. Brennan (Westport, CT: Praeger Publishers), 65110.
Jorgensen, T. D., Sunthud, P., Alexander, M. S., and Yves, R. (2021). SemTools : Useful Tools for Structural Equation Modeling. Available online at: https://cran.r-project.org/package=semTools (accessed September 7, 2022).
Klein Entink, R. H., Kuhn, J.-T., Hornke, L. F., and Fox, J. P. (2009). Evaluating cognitive theory: A joint modeling approach using responses and response times. Psychol. Methods 14, 54–75. doi: 10.1037/a0014877
Maris, G., and van der Maas, H. (2012). Speed-accuracy response models: Scoring rules based on response time and accuracy. Psychometrika 77, 615–633. doi: 10.1007/s11336-012-9288-y
McMaster, K. L., Shin, J., Espin, C. A., Jung, P.-G., Wayman, M. M., and Deno, S. L. (2017). Monitoring elementary students’ writing progress using curriculum-based measures: Grade and gender differences. Read. Writ. 30, 2069–2091. doi: 10.1007/s11145-017-9766-9
National Center on Intensive Intervention (2014). Progress monitoring technical review committee: Frequently asked questions. American Institutes for Research. Available online at: https://intensiveintervention.org/sites/default/files/APM_FAQs_2014.pdf
Parker, D. C., McMaster, K. L., Medhanie, A., and Silberglitt, B. (2011). “Modeling early writing growth with curriculum-based measures.”. Sch. Psychol. Q. 26, 290–304. doi: 10.1037/a0026833
Pornprasertmanit, S., Miller, P., Schoemann, A., and Jorgensen, T. D. (2020). “Simsem: SIMulated Structural Equation Modeling.” R package version 0.5-15. Available online at: https://CRAN.R-project.org/package=simsem (accessed September 7, 2022).
R Core Team (2021). R: A Language and Environment for Statistical Computing. Vienna: R Foundation for Statistical Computing.
Raudenbush, S. W., and Bryk, A. S. (2002). Hierarchical linear model: Applications and data analysis methods, 2nd Edn. Los Angeles, CA: SAGE.
Raykov, T. (2001). Estimation of congeneric scale reliability using covariance structure analysis with nonlinear constraints. Br. J. Math. Stat. Psychol. 54, 315–323. doi: 10.1348/000711001159582
Rosseel, Y. (2012). Lavaan : An R package for structural equation modeling. J. Stat. Softw. 48, 1–36. doi: 10.18637/jss.v048.i02
Schatschneider, C., Wagner, R. K., and Crawford, E. C. (2008). The importance of measuring growth in response to intervention models: Testing a core assumption. Learn. Individ. Dif. 18, 308–315. doi: 10.1016/j.lindif.2008.04.005
Schurig, M., Jungjohann, J., and Gebhardt, M. (2021). Minimization of a short computer-based test in reading. Front. Educ. 6:684595. doi: 10.3389/feduc.2021.684595
Silberglitt, B., and Hintze, J. M. (2007). How Much growth can we expect? a conditional analysis of r—cbm growth rates by level of performance. Excep. Children 74, 71–84. doi: 10.1177/001440290707400104
Snijders, T. A. B., and Bosker, R. J. (2012). Multilevel Analysis: An Introduction to Basic and Advanced Multilevel Modeling, 2nd Edn. Los Angeles: Sage.
Souvignier, E., Förster, N., Hebbecker, K., and Schütze, B. (2021). “Using Digital Data to Support Teaching Practice - Quop: An Effective Web-Based Approach to Monitor Student Learning Progress in Reading and Mathematics in Entire Classrooms,” in International Perspectives on School Settings, Education Policy and Digital Strategies. A Transatlantic Discourse in Education Research, eds S. Jornitz and A. Wilmers (Leverkusen: Budrich), 283–298.
Thornblad, S. C., and Christ, T. J. (2014). Curriculum-based measurement of reading: Is 6 weeks of daily progress monitoring enough?” edited by christy walcott. Sch. Psychol. Rev. 43, 19–29. doi: 10.1080/02796015.2014.12087451
Van Norman, E. R., Christ, T. J., and Zopluoglu, C. (2013). The effects of baseline estimation on the reliability, validity, and precision of cbm-r growth estimates. Sch. Psychol. Quart. 28, 239–255. doi: 10.1037/spq0000023
Van Norman, E. R., and Parker, D. C. (2018). A comparison of split-half and multilevel methods to assess the reliability of progress monitoring outcomes. J. Psychoeduc. Assess. 36, 616–627. doi: 10.1177/0734282917696936
Vandenberg, R. J., and Lance, C. E. (2000). A review and synthesis of the measurement invariance literature: Suggestions, practices, and recommendations for organizational research. Organ. Res. Methods 3, 4–70. doi: 10.1177/109442810031002
VanDerHeyden, A. M., and Burns, M. K. (2008). Examination of the utility of various measures of mathematics proficiency. Assess. Effect. Interv. 33, 215–224. doi: 10.1177/1534508407313482
West, S. G., Taylor, A. B., and Wu, W. (2012). “Model Fit and Model Selection in Structural Equation Modeling,” in Handbook of Structural Equation Modeling, ed. R. H. Hoyle (The Guilford Press), 209–231.
Wise, S. L. (2017). Rapid-guessing behavior: Its identification, interpretation, and implications. Educ. Measur. 36, 52–61. doi: 10.1111/emip.12165
Keywords: progress monitoring, slope, growth, reliability, simulation, formative assessment
Citation: Forthmann B, Förster N and Souvignier E (2022) Multilevel and empirical reliability estimates of learning growth: A simulation study and empirical illustration. Front. Educ. 7:920704. doi: 10.3389/feduc.2022.920704
Received: 14 April 2022; Accepted: 28 September 2022;
Published: 03 November 2022.
Edited by:
Stefan Blumenthal, University of Rostock, GermanyReviewed by:
Jürgen Wilbert, University of Potsdam, GermanyJeffrey M. DeVries, Technical University Dortmund, Germany
Copyright © 2022 Forthmann, Förster and Souvignier. This is an open-access article distributed under the terms of the Creative Commons Attribution License (CC BY). The use, distribution or reproduction in other forums is permitted, provided the original author(s) and the copyright owner(s) are credited and that the original publication in this journal is cited, in accordance with accepted academic practice. No use, distribution or reproduction is permitted which does not comply with these terms.
*Correspondence: Boris Forthmann, Ym9yaXMuZm9ydGhtYW5uQHd3dS5kZQ==