 Jana Jungjohann
 Markus Gebhardt
 David Scheer
- 1Department of Education Science II, University of Regensburg, Regensburg, Germany
- 2Faculty for Special Needs Education, Ludwigsburg University of Education, Ludwigsburg, Germany
In the educational context, graph literacy describes the competence to read, comprehend, and interpret formative assessment data in terms of data-based decision-making (DBDM) in order to derive and justify individual adaptations of instruction based on them. Since misconceptions may arise in predicting a future learning progress due to the characteristics of the data base as well as the approach to graph literacy, effective supports are needed, especially for inexperienced teachers. We present two interrelated studies to broaden the field of support in graph literacy. In Study I, graph literacy procedures are collected from N = 196 university student teachers using an online survey that includes six case vignettes with learning progress prediction tasks. Results show that both regular and special education student teachers intuitively neglect important data points in interpretation and they do not use a consistent strategy in prediction across the case vignettes (Fleiss’ κ = 0.071; p < 0.001). Building on the results of Study I, a 3-min video intervention for linear trend identification using Tukey Tri-Split was developed. Study II tested the efficacy of the video intervention on the accuracy of future learning progress among student teachers and in-service teachers (N = 198) using randomized group assignment compared to a brief text hint. With a large effect size of Cohens’ f = 0.39, the video instruction shows high efficacy compared to the text hint. The increasing importance of DBDM in inclusive and special education is discussed.
Introduction
Teachers’ graph literacy is a widely neglected skill that influences decision-making performance (Okan et al., 2012; Oslund et al., 2021). It matters as a core component of data literacy for all teachers. Following Mandinach and Gummer (2016), it is defined as the need of knowledge of “how to use data displays because data are often graphically depicted, in chart, tables, graphs, and other displays” (p. 371). This definition is broad and refers to both qualitative and quantitative data generated in the school context. In inclusive and special education, the use of formative assessment is widespread in order to use quantitative data to discover learning problems and to adapt instruction to meet children’s needs in the sense of data-based decision-making (DBDM; Espin et al., 2021). Therefore, in this paper, graph literacy is considered in terms of quantitative data only.
Formative assessments are used primarily in multi-tiered systems of support in different learning areas such as reading, writing and mathematics (Fien et al., 2021) and as a supplement to cross-sectional status tests in the area of instruction planning around the world (e.g., Fuchs, 2017; Jungjohann et al., 2018a; Ahmed, 2019). Especially in school systems without an implemented multi-tiered system of supports such as Germany, there is a lack of standardized and effective training and further education for teachers (Blumenthal et al., 2021).
The goal of using formative assessment data is for teachers to make informed decisions based on student data to achieve a better fit between learning needs and instruction and therefore to achieve a higher students’ achievement outcome. For this, teachers collect ongoing diagnostic data by using formative tests to measure learning growth and identify students who need support at Tier 2 or Tier 3 (Lane et al., 2014). In the formative assessment approach, formal and informal formative measures can be distinguished. Formal tests produce mostly quantitative data from standardized assessments and informal tests collect both qualitative and quantitative data from homework assignments or in-class activities. Standardized tests for learning progress monitoring are used at high frequency up to weekly during lessons, take only a few minutes, and are based on specific quality criteria (Good and Jefferson, 1998). The tests must be reliable, on the one hand, and short enough, on the other hand, to use little learning time, be easy to use in the classroom, and not overload the students (Schurig et al., 2021). In most cases, these quantitative measures are designed and scored as simple speed tests. This means that the students work on as many tasks as they can manage in the fixed test time (Kubinger, 2005). The outcome variable is traditionally the sum of all correctly solved tasks. It is usually visualized in a computer-based or drawn by hand graph as the student’s learning growth (i.e., slope or rate of improvement) with the assumption that visual representations of numeric data facilitate inferences about conceptual relationships (Kosslyn, 2006). Therefore, on the graph’s x-axis, the progression over time as the number of school weeks is shown. Here, teachers can read the single measurement points and the time intervals of the learning progress tests performed (Jungjohann et al., 2018c). The y-axis shows the outcome variable. If several test results are available, they are connected with a line to form a learning slope. The slope is one key component of the output of progress monitoring tests because it alerts teachers when students are not progressing successfully (Fuchs and Fuchs, 2001; Stecker et al., 2008). To prevent potential school failure, teachers use the measured outcome for both justing adaptions to individual instruction and predicting the most likely future learning growth slope.
The use of formative assessment is particularly effective in supporting at-risk students and with difficulties in learning such as students with special educational needs (Bennett, 2011) because students achieve higher when their learning growths are monitored and reported to the teacher (Carlson et al., 2011; Anderson et al., 2020; McMaster et al., 2020). However, DBDM is only sporadically used by teachers and has not yet been adequately supported, required, and encouraged in many school systems (Blumenthal et al., 2021). Despite the positive impact of DBDM on student learning, Gleason et al. (2019) demonstrated that it takes a lot of effort to motivate in-service teachers to use DBDM. In their intervention study, 470 teachers from 102 American schools from 12 districts participated. Although they initiated an extensive support for DBDM (i.e., hiring data coaches, informing teachers in data-driven instruction, initiating data-focused teacher team meetings) on school level, no increase of teachers’ data use or a change in teachers’ instructional practices could be observed. A complementary research approach at teacher level focuses on promoting accurate visual analysis to strengthen the impact of DBDM. On the one hand, researchers try to better understand teachers’ understanding of progress monitoring graphs (Espin et al., 2017; Klapproth, 2018) and, on the other hand, support measures for improved interpretation and prediction of learning are developed (Wagner et al., 2017; van den Bosch et al., 2019). It is necessary to take a closer and simultaneous look at both teachers’ approach to interpreting the data in the graphs and the design of supporting materials. This is because only with a firm understanding of the current approach could support measures for teachers be developed and used effectively.
Graph literacy
For graph literacy, also known as graph comprehension, no universal definition exists. In accordance with Oslund et al. (2021) and with regard to quantitative progress monitoring data, graph literacy can be understood as multiple levels of reading and comprehension data and interpreting the graphs’ slope. For evaluating the effectiveness of instructional programs, teachers do multiple steps. They interpret the actual learning development of individuals based on the progress monitoring data, link the individual growth with the instructional programs, and predict a possible growth. Zeuch et al. (2017) describe three levels of graph literacy: (1) reading the data: notice the relevant data points and trends, (2) reading between the data: recognize relations between the developments of sub-competencies, and (3) read beyond the data: infer assumptions about further progress, possible deficits, and adequate instructional strategies for students. These three levels are hierarchical and build on each other. Reading the data level is of particular importance in graph literacy, as it is the foundation for interpretation. In this level, teachers decide which parts of the available data base they will include in their interpretation and which strategy they will use to arrive at their prediction. To reach the highest level of graph literacy to take full advantage of the potential of learning progress data, teachers must still combine all individual levels.
Graph literacy in the sense of DBDM is complex and requires teachers’ diagnostic and pedagogical competencies to provide overlooking individual learning difficulties and profiles. There is a large evidence that teachers have multiple difficulty using quantitative data to inform and guide their instruction, especially in the areas of reading data concerning the data base under consideration (e.g., Keuning et al., 2017; Gesel et al., 2021). Teachers can have difficulties on the lowest interpretation level, when they focus on a single or irrelevant data points and disregard important information. Additionally, visual support within the graphs (e.g., linear trend line, goal lines, vertical border lines between interventions) can even distract the interpretation (Newell and Christ, 2017). On the intermediate interpretation level, data characteristics bias data prediction (Klapproth, 2018). For example, extreme values, high data variability, and a flat improvement cause a more positive prediction.
In addition to graph’s layout, data base under consideration and interpretation strategies, the viewer’s prior knowledge and the educational content of the graph can challenge the interpretation (Glazer, 2011). For instance, Wagner et al. (2017) compared the graph interpretation strategies of student teachers in special education and scholars in DBDM with think aloud procedure twice, just before and after completing student teaching. Measured by the number of words and statements, student teachers interpreted the graphs with lower coherence, specificity, reflection and accuracy than experts. The results suggest that graph literacy can be increased by specific training. In addition, Oslund et al. (2021) examined the influence that affective variables (i.e., teacher experience, hours of teacher training in data use and response-to-intervention approaches, and confidence on graph literacy) have on DBDM in the context of reading fluency tests. With a sample of 309 K-12 teachers, they found that both teachers’ experience and confidence had an effect on teachers’ graph literacy while the variable hours of teacher training did not. These results strengthen the assumption that graph interpretation can be trained on the basis of teachers’ prior knowledge and experience, and that training success depends on content rather than time.
Intervention on graph reading
To ensure a competent use of progress monitoring graphs, teachers need effective support (Ardoin et al., 2013). Gesel et al. (2021) concluded in their meta-analyses on the impact of DBDM training (i.e., data collection, analysis, data-based adaptions) targeting on teacher-level DBDM outcome (i.e., DBDM knowledge, skill and/or self-efficacy) a mean effect size of g = 0.57 for student teachers and in-service K-12 teachers in different school settings. Compared to Gleason et al. (2019) findings that even extensive support for DBDM including multiple aspects of teachers’ trainings related to DBDM does not lead to changes in teacher behavior, the effects Gesel et al. (2021) found seem promising. These findings suggest that individual interventions can increase teachers’ understanding of learning progress data. However, Espin et al. (2021) noted that teacher training and supporting materials must explicitly focus on DBDM procedures for positive effects.
In the context of teacher professional development, science video-based interventions are often used for multiple reasons. Video-based interventions are effective, have a simple and flexible handling and can have low production costs. Boy et al. (2020) distinguish four types of science videos: presentation videos, expert videos, animation videos and narrative explanatory videos. They investigated differences in knowledge transfer by multiple-choice tests and revealed a small benefit of narrative explanatory and animation videos. Animation videos present the relevant information in an audio channel through an off-screen invisible narrator and punctuate the information with artificial moving images. The advantage of these videos is that they can be very short and are suitable for explaining simple facts. Narrative explanatory videos are much more complex. They combine moving images with moderation or interview elements to provide comprehensive answers to complex questions. van den Bosch et al. (2019) used animated videos as video interventions in which a teacher presents the case of Sander and his reading difficulties. Their study indicated that teachers’ graph literacy can be improved by animated video interventions. They used a pre-post-design with three different animated video interventions focused on basic knowledge, interpretation knowledge, and interpretation and linking knowledge that lasted between 20 and 45 min to deliver multiple instructional approaches and one control condition. Graph literacy was measured by a graph description task. In this task, teachers were asked to say out loud everything they saw in the graphs and interpret them as if they were talking to parents. With all three animated video intervention conditions teachers improved their graph literacy.
However, little is known, especially in the German-speaking education system, about the strategies teachers use to approach the interpretation of learning progression graphs or about their prior knowledge in this regard (Blumenthal et al., 2021). At the same time, we argue that an essential basic skill for all three levels of graph interpretation is the recognition and continuation of linear development trends. Despite this, it is not practical for teachers to estimate slope coefficients based on linear regressions in the context of data-based decisions in everyday pedagogy, especially as teacher training usually does not contain sufficient statistics courses for using robust regression. Rather, what is needed is a graphically implementable method that can be quickly learned by teachers. One such method is Tukey Tri-Split (Tukey, 1977). Such an approach to interpretation can strengthen transparent and rational interpretation. Additionally, it can reduce intuitive guided and teacher-dependent interpretations, as observed in the context of high-stakes decisions (Vanlommel and Schildkamp, 2019). Nevertheless, it can currently only be assumed that an instruction to perform Tukey Tri-Split actually increases the ability to predict future learning. Thus, one aim of our paper is to contribute to this desiderate.
Tukey Tri-Split: A non-arithmetic method for determining the slope of a learning progress graph
The Tukey Tri-Split (Tukey, 1977), also referred to as the Median Based Slope, is a graphical method by which a trend line can be plotted based on the first and third segments of a dot-line plot divided into three sections. This fairly simple-to-implement and non-arithmetic approach is widely used in school-based single case research (Vannest et al., 2013; Parker et al., 2014) and is also generally recommended when interpreting learning progress data for the purpose of making educational support decisions (Hosp et al., 2007; Fuchs and Fuchs, 2011). The basic idea behind this is that teachers can use this guided approach to determine the slope of learning development graphically and without numerical calculations. To do this, they proceed as follows:
1. The existing learning progress graph is divided into three equal-sized sections. If the number of measurement time points is not divisible by three, the division is made in such a way that the first and third segments are of equal length and the middle segment is the longest (see Figure 1, step 1).
2. The median is determined graphically for the first and third segments (see Figure 1, steps 2–3). To do this, the intersection point of the y-axis is exceeded and undershot by an identical number of points of the corresponding segment. The median of the segment is marked in the middle of the segment in relation to the x-axis.
3. The trend line (slope) results from the connection of the two markings in the two segments (see Figure 1, step 4).
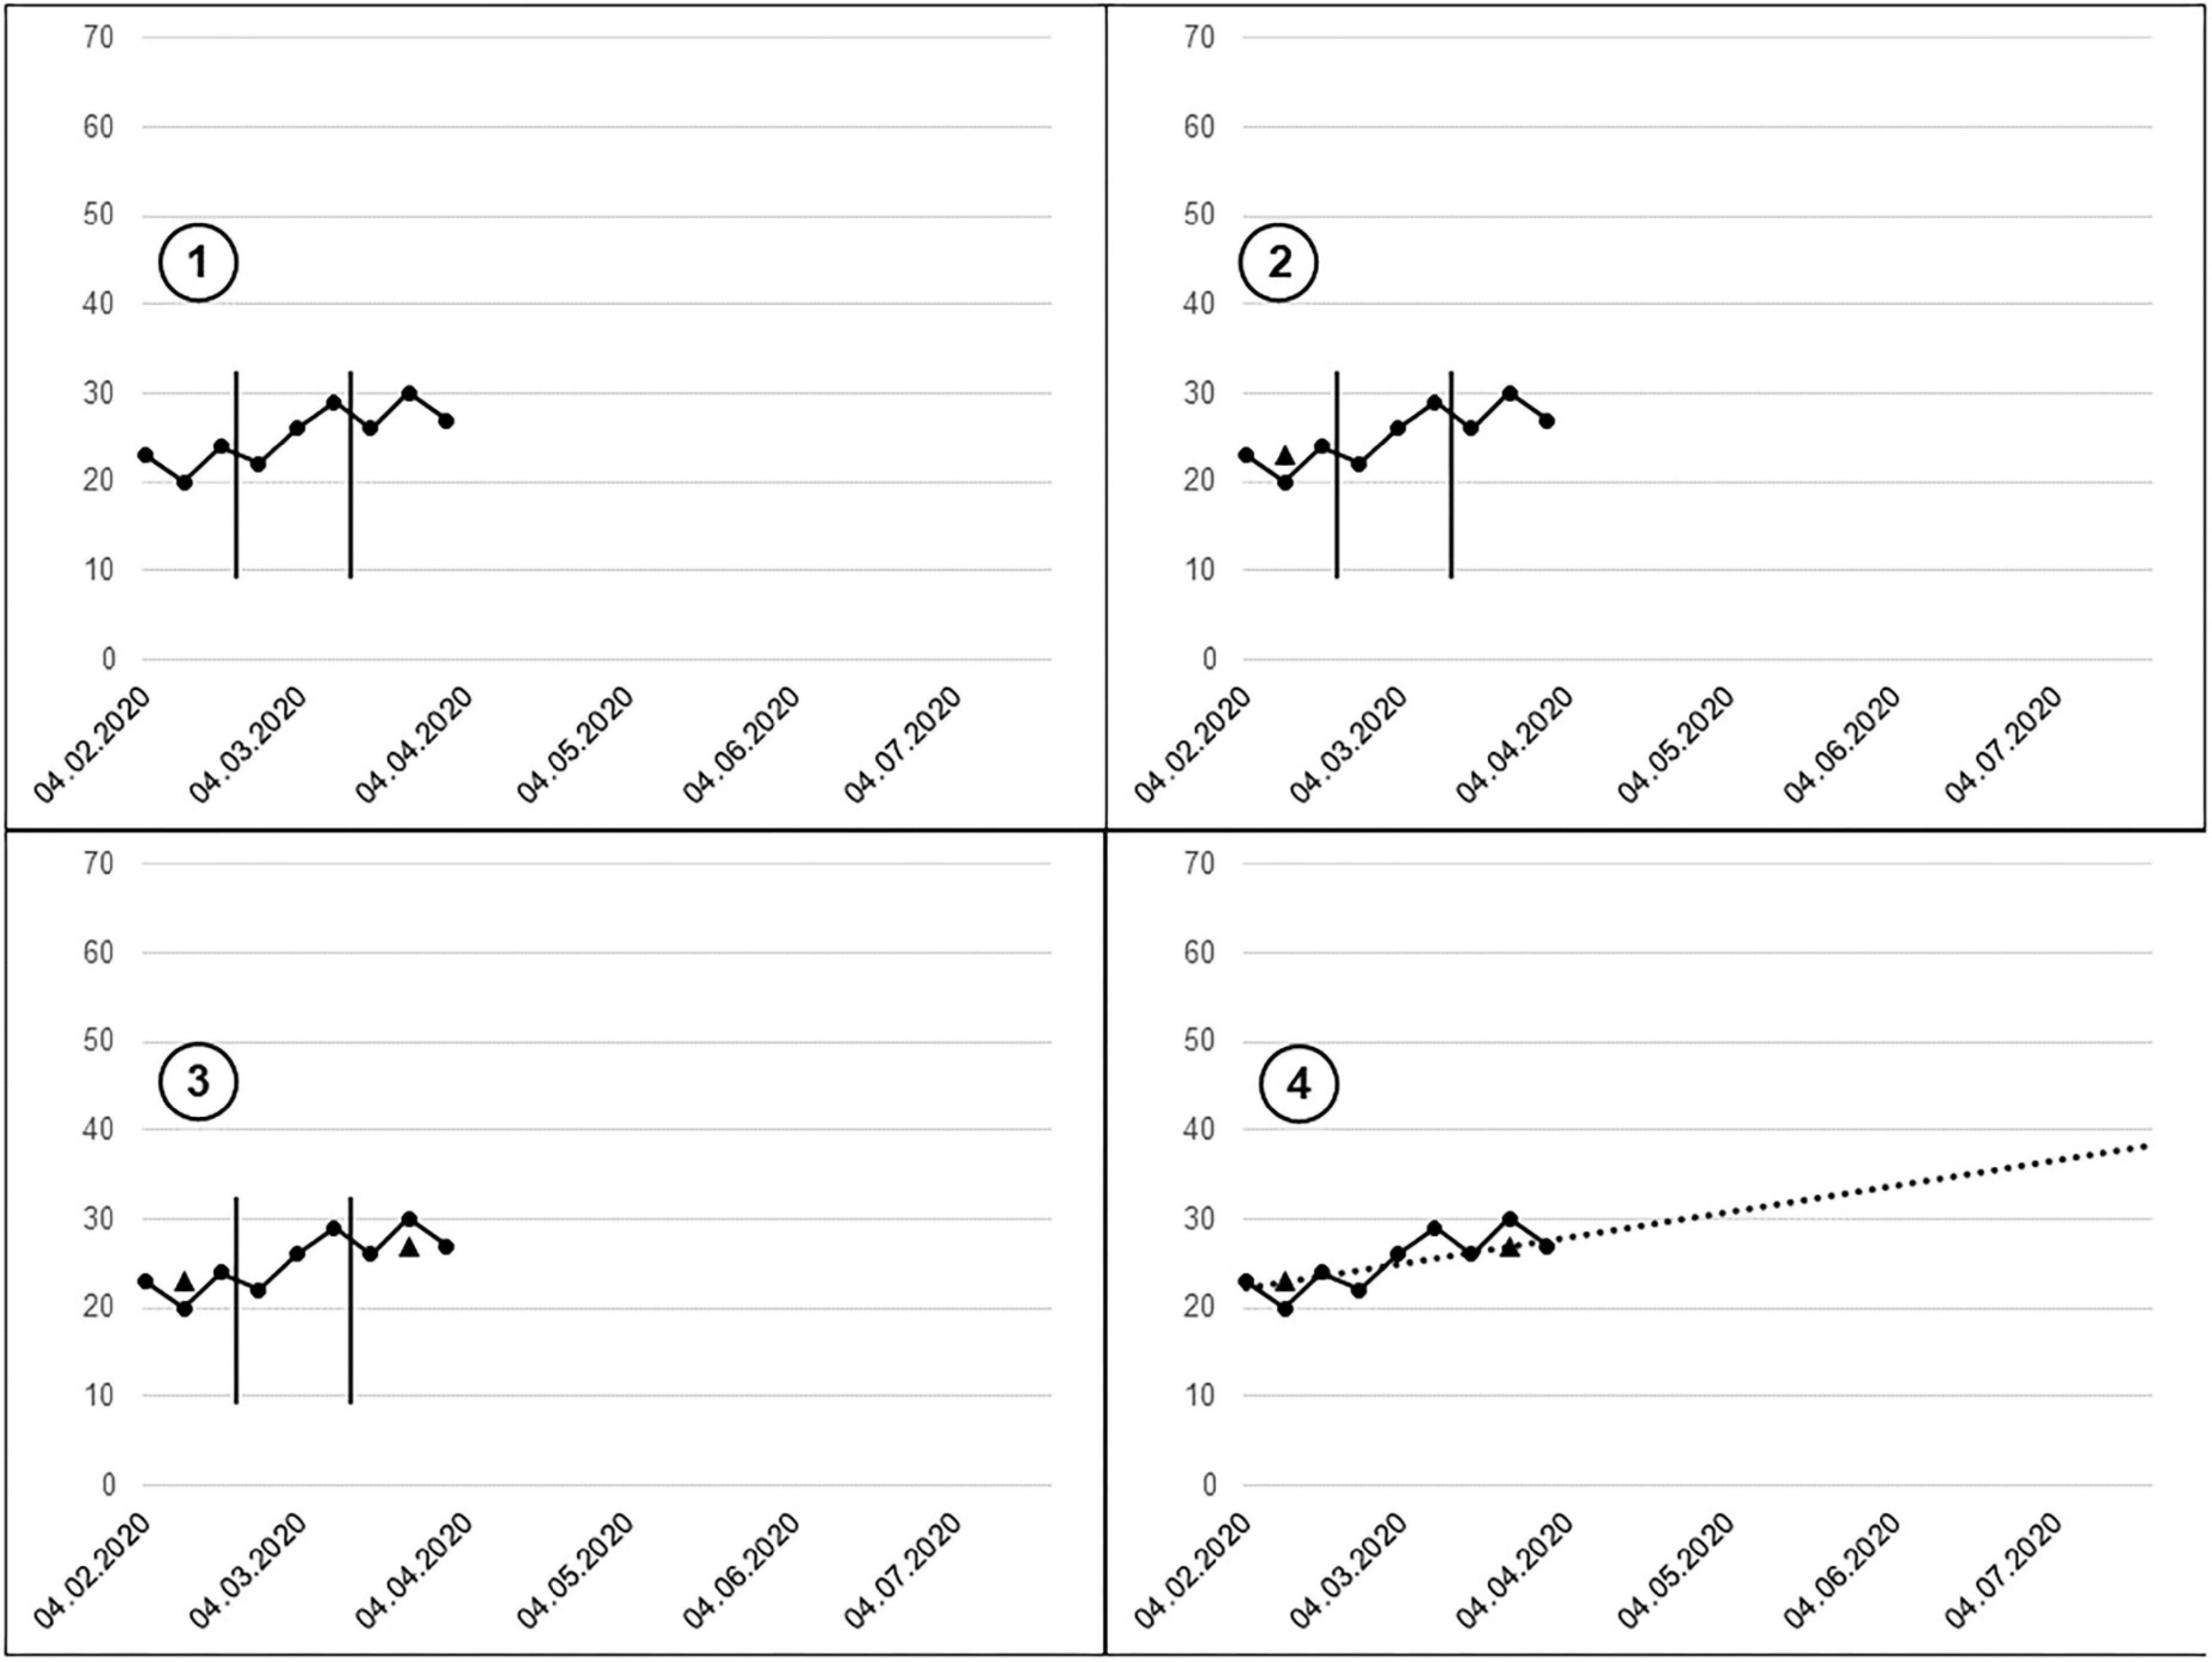
Figure 1. Demonstration of the Tukey Tri-Split (Scheer, 2021).
The trend line emerging from the tri-split can be used as a guide to estimate future learning development, provided that instruction is assumed to remain unchanged.
Present study
In this paper, we present two interrelated studies in the area of graph literacy. The overarching goal is to gain a detailed look into the process of interpreting learning progress graphs of inexperienced university student teachers in the first phase of teacher training in order to develop and evaluate a targeted intervention based on these findings for novices. The lowest level of graph literacy (i.e., read the data; Zeuch et al., 2017) will be given special focus in order to design a low-threshold intervention for this target group. Therefore, the sample considers student teachers and in-service teachers from Germany, a country without an implemented MTSS school system. From this combination, information can be derived to sharpen the content of the intervention for novices. In Study I, we ask which data base and which interpretation strategy student teachers use to predict a future learning progress depending on multiple graphs’ characteristics. Consistent with the considerations about the state of the German school system, Study I (see section “Results” in this paper) showed that participants used a rather narrow and inconsistent data base to predict future learning developments. Thus, in Study II, student teachers and in-service teachers are trained to accurately predict learning progress with a 3-min video-based intervention. We adopt the graphs based on the results of Study I and create a short video tutorial about how to predict a further learning outcome relating on formative data. Research questions and methods are described for each study separately in the following sections.
Study I: Student teachers’ approach to graph literacy
Research questions
Study I focuses on intuitive graph literacy by untrained student teachers. Previous research suggests that inexperienced teachers, on the one hand, do not have a consistent approach to reading formative data (Wagner et al., 2017; Blumenthal et al., 2021) and, on the other hand, that the structure of the data can influence the prediction of future progress (e.g., Keuning et al., 2017; Klapproth, 2018). However, it is unknown what specific data they focus on and what strategy they intuitively use without specific instruction. Therefore, we ask three research questions:
1. How distinctive is prior knowledge of formative assessments and mathematical skills of student teachers?
2. Which approach regarding data base and interpretation strategy do untrained student teachers use to predict a future learning progress depending on multiple graphs’ characteristics most often?
3. How stable are student teachers’ decisions regarding their chosen data base and interpretation strategy across multiple graphs?
Methods
Sample and procedure
German student teachers enrolled in a primary, secondary or special school teacher education program were recruited via social media platforms. The study was realized as a standardized web-based survey platform called limesurvey.org. The survey was online for 6 weeks.
In total, N = 349 student teachers participated. For data cleaning, participants who did not answer any question about the data prediction were removed. Thus, data from N = 196 participants from four German federal states [i.e., North Rhine-Westphalia (82.2%), Lower Saxony (14.8%), Saxony (1.5%), and Bremen (0.5%)] were analyzed. Most of the participants were female (82.1%), aged between 21 and 24 years (59.7%) and enrolled in the Bachelor’s program (67.9%). They aimed to graduate in elementary school (20.9%), secondary school (27.6%) or special education school (50.5%) teacher programs.
Instrument
The web-based survey included a formal instruction, questions about background variables, four questions about prior knowledge regarding graph literacy, one example and six graphs (i.e., case vignettes). All case vignettes were presented to the participants in the same order and on the same screen with the questions about prediction and graph literacy.
Prior knowledge and skills
Participants were asked to self-assess their prior knowledge regarding (1) the approach of formative assessment and (2) graph reading in an educational context both with a four-point rating scale (responses ranged from [1] “no prior knowledge” to [4] “a large amount of both theoretical and practical application knowledge”). In addition, they were asked to assess their skills in (3) mathematical competencies and (4) graph reading in mathematical contexts (six-point rating scale, responses ranged from [1] “very good” to [6] “very bad”).
Case vignettes
Each case vignette displays a learning progress graph. All graphs were constructed and manipulated following the study material of Klapproth (2018). Figure 2 shows the first case vignette. The x-axis represented 14 school weeks as time line. At the y-axis, the number of correct read words per minute (WRC) were marked. The first eleven data points were given, which were separated into three graph sections: baseline including three data points, 1st intervention phase and 2nd intervention phase including each four data points. For each graph section, a separate linear trend line was presented. For this study, the graphical subdivisions and the addition of the trend lines were necessary to gain insight into the data base and strategies used. Additionally, the baseline of the peers and a theoretical maximum were given. All six graphs were based on the following linear function: WRC = bx + a with b representing the slope, x the school week, and the intercept. The graphs were manipulated in two aspects. First, the graphs differ in a low, middle and high rate of improvement (i.e., b or 1.3*b or 3.4*b). Second, the variation of the data points was either low or high (i.e., b or 2*b). All experimental data points were calculated according to progress monitoring data of German second graders in reading (Anderson et al., 2020). Participants were asked to predict the data points for weeks 12 and 13 as numerical values based on the available data for each case vignette.
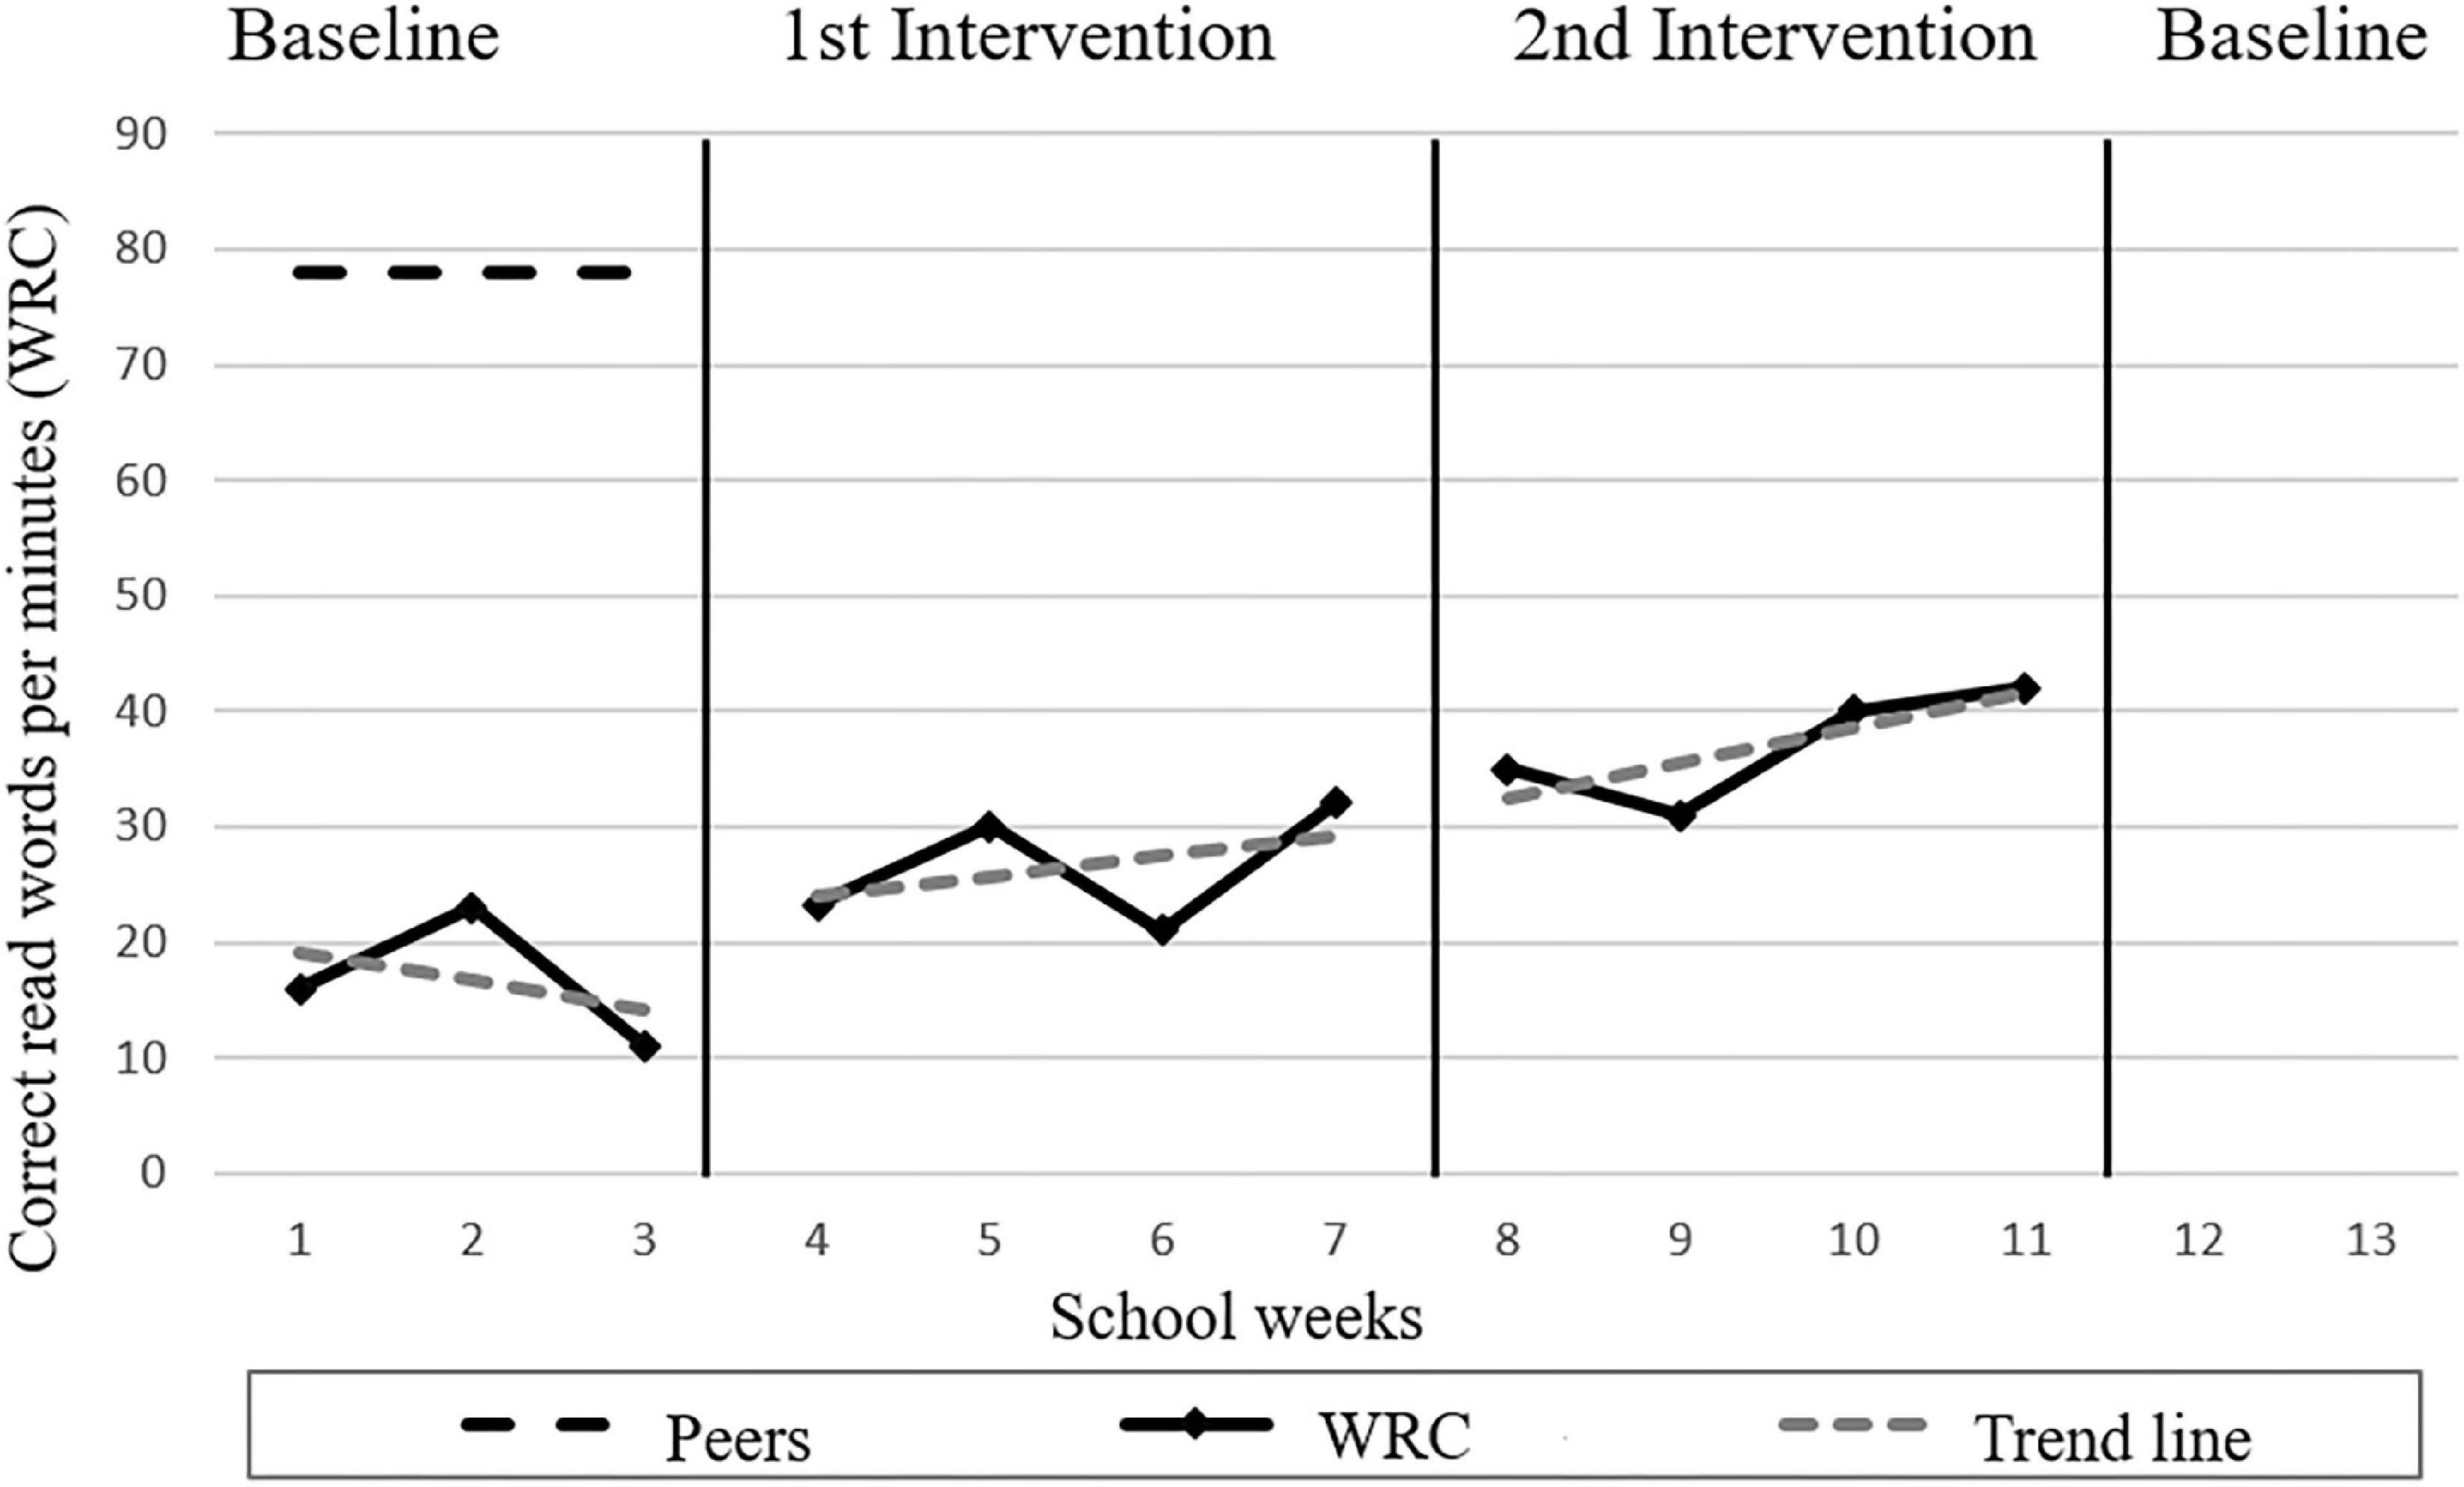
Figure 2. First case vignette in Study I.
Graph literacy
In a closed-response and single-choice format, participants were asked for each case vignette which data base (Which data did you use for your prediction?) and which interpretation strategy (How did you predict the learning growth?) they used. The given answers were initially based on a preliminary exploratory study with special education student teachers, which clustered possible strategies by a content analysis according to Mayring (2014). In a second step, the clustered answers were cross-referenced with models of graph literacy (Zeuch et al., 2017) and with possible influencing variables that might condition errors in predicting a learning growth (Keuning et al., 2017; Newell and Christ, 2017). The following answers regarding the data base used were available for selection: (1) baseline, (2) 1st intervention phase, (3) 2nd intervention phase, (4) both intervention phases, (5) baseline and both intervention phases, (6) other time period (i.e., outside the specified phases), and (7) no time period (i.e., single data points). In this context, the first four and seventh responses represent a disregard of important information because not all available data were considered for interpretation. For answer six, there was an opportunity to describe the self-selected time period in more detail. The strategy used was inquired with the following contents provided: (1) concrete data points, (2) trend line, (3) pattern of the learning growth, (4) general instruction assumptions, (5) guessed, and (6) other strategy. The first four responses represent the Zeuch et al. (2017) levels, with the first and second responses being assigned to the reading the data level. All responses to this question were formulated as complete sentences to inquire the priority course of action. Therefore, the first four answers were worded with the addition “mainly.” The guessing strategy was derived from the qualitative responses of the preliminary study. Participants had the opportunity to describe their other strategy in writing.
Data analysis
Self-assessment differences on the four variables in prior knowledge and mathematical skills were tested using multivariate ANOVA. All data on graph literacy (i.e., data base and strategy) as well as the numeric prediction values were analyzed descriptively. In addition, the number of different responses to the data base and interpretation strategy was counted. To examine whether a particular approach to interpretation was used as a function of case vignette characteristics, we tested the reliability of the agreement (i.e., Fleiss’ κ; Fleiss, 1971). Afterward, we analyzed descriptively the number of switches within the approaches. We summed up the results related to the number of the choices of the data base and strategies under the term stability in graph literacy.
Results
Prior knowledge and skills
All student teachers estimated their prior knowledge regarding formative assessment at an intermediate level, with the formative assessment approach being slightly more common than dealing with graphs in an educational context. Across all student teacher groups (i.e., primary level, secondary level, and special education needs), they reported a mean of 2.30 (SD = 0.70) for graph reading in an educational context and a mean of 2.41 (SD = 0.84) for knowledge about the approach of formative assessments, while 4 was the maximum value. Only 3.5% of all participants stated that they also had practical application knowledge. With respect to mathematical skills, a mean of 3.29 (SD = 1.05) was reported for mathematical competencies and a mean of 4.13 (SD = 1.12) for graph reading skills in mathematical contexts, while the responses had a range from 1 to 6.
With regard to knowledge about the approach of formative assessments [F(2, 191) = 0.766, p = 0.466) and mathematical competencies [F(2, 191) = 2.881, p = 0.59], no significant differences were observed among the focuses of teacher training. The groups showed significantly different mean values with regard to knowledge of graph reading in an educational context [F(2, 191) = 4.150, p > 0.05] and in a mathematical context [F(2, 191) = 4.572, p > 0.05]. Tukey post-hoc tests showed that the student primary teachers rated their prior knowledge of graphs in an educational context significantly lower compared to the other teachers (compared to secondary: 0.36, 95%CI [0.03, 0.70], p < 0.05; compared to special education: 0.34, 95%CI [0.04, 0.64], p < 0.05) and that the special education student teachers rated their competencies lower than the secondary school student teachers in terms of mathematical competencies (–0.56, 95%CI [–1.00, –0.12], p < 0.01).
Approaches to graph literacy
Across all case vignettes, to predict future learning progress, student teachers most often considered data from the intervention phases: both intervention phases together (35.5%), only the second intervention phase (28.1%), all existing data points (i.e., baseline with both intervention phases, 19.7%), and only the first intervention phase (11.4%). Prediction based only on baseline (1.5%) or independent of any of the specified time periods (1.3%) were rarely reported. As a strategy, they primarily used three approaches for prediction: continue the pattern of learning progress (41.0%), focus on the slope of the trend line (29.3%), and use other unspecified strategies (13.2%). The other three strategies were used similarly infrequently: assumptions about the instruction (7.0%), orientation on single measurement points (5.2%), and guessing (4.4%).
For a more detailed look, Figure 3 shows the absolute distribution of the selected strategies separated by the case vignettes and divided by the teacher programs. The arrangement of the case vignettes in Figure 3 is based on the 2 × 3 manipulation of the data (see also section Instrument of Study I). In the distribution of the selected strategies, per graph is sorted according to graph’s slope (from top to bottom: low, medium, high) and in the columns according to graph’s variation of the data points (left: high; right: low). The numbering of the graphs reflects the displayed order within the questionnaire. The distribution of strategies used per graph suggests that individuals switch their strategies when predicting. Moreover, there is no clear pattern in Figure 3 regarding the choice of strategy, which could be related to the characteristics of the graphs (i.e., rate of improvement and variability of the data).
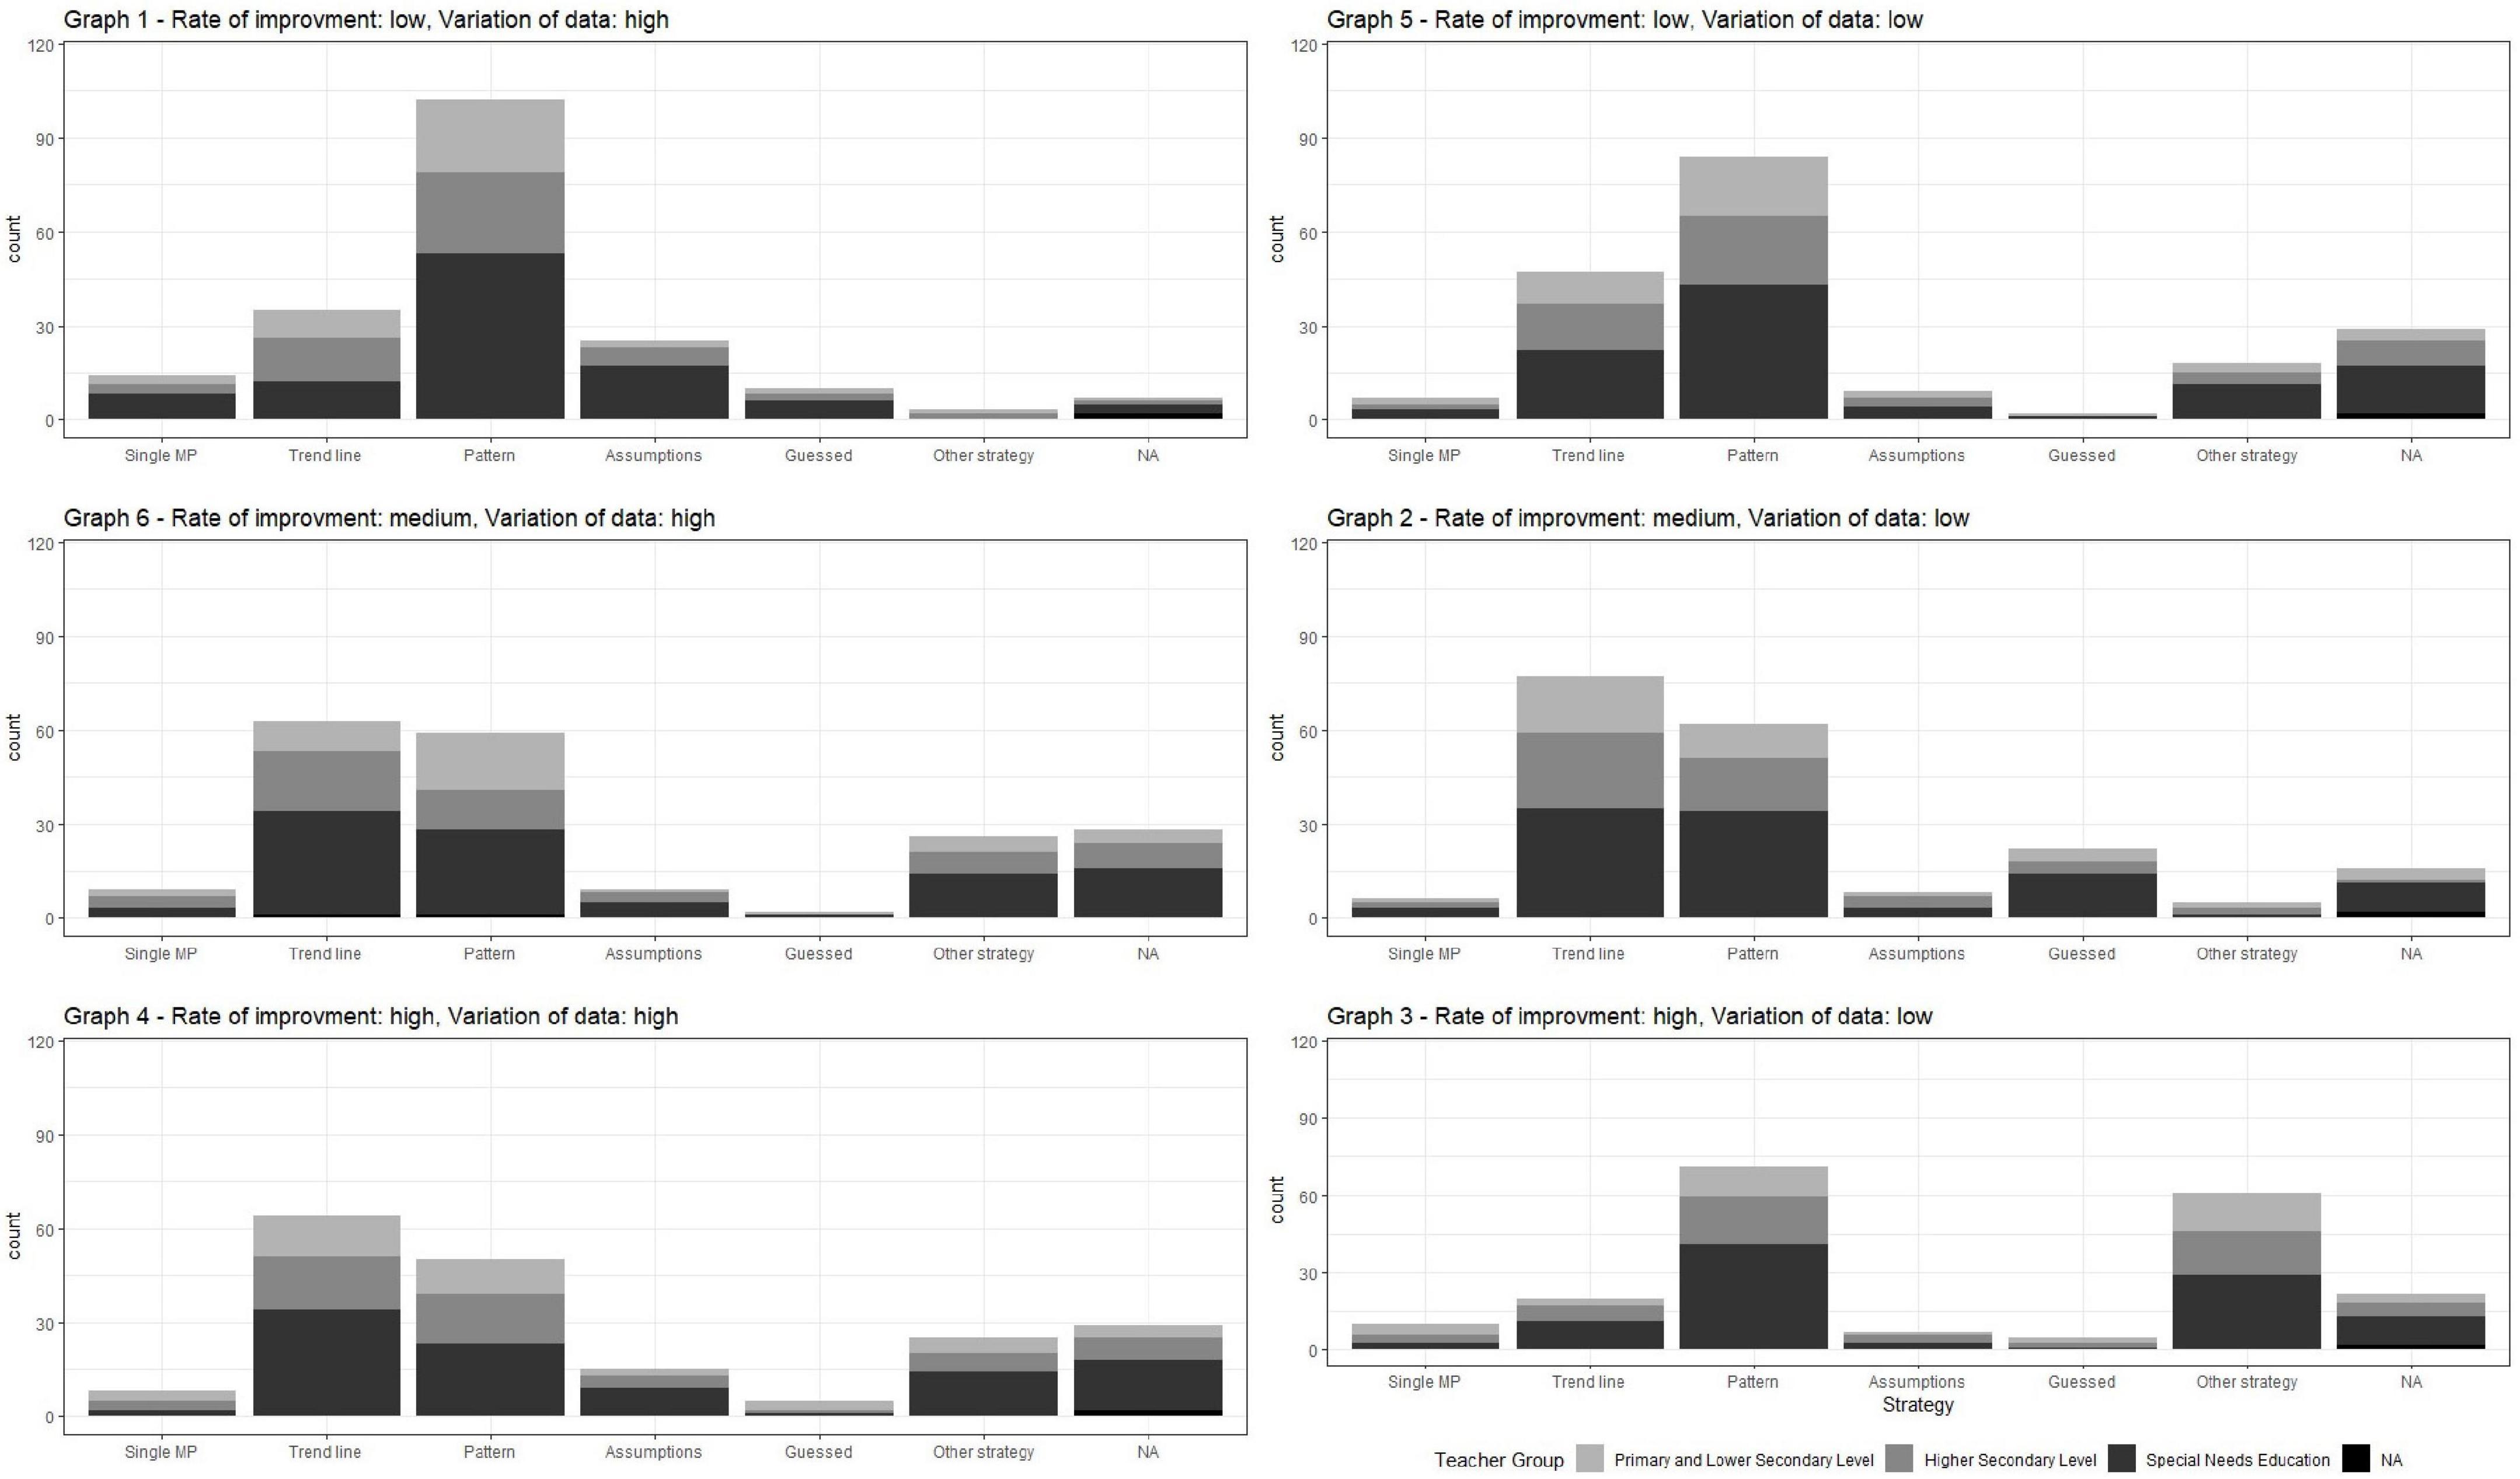
Figure 3. Absolute distribution of the selected strategies separated by the graphs and teacher program.
Stability in graph literacy
Across all case vignettes, participants used a variety of data bases and strategies to make their predictions. The results show slight agreement for both data (Fleiss’ κ = 0.050; p < 0.001) and strategy (Fleiss’ κ = 0.071; p < 0.001). Considering the case vignettes individually, the levels of agreement differed significantly between participants’ answers to graph literacy questions, ranging from –0.016 to 0.439 for data used and from 0.004 to 0.374 for strategies. Moderate agreement was found for the used data for graph 6 (Fleiss’ κ = 0.354 –0.374; p < 0.001) and fair agreement for the interpretation strategy for graphs 1 and 4 (Fleiss’ κ = 0.439; p < 0.001). These results illustrate two things. First, the use of the data points is more coherent than that of the interpretation strategy. Second, student teachers do not have a consistent approach to prediction.
A switch within approaches to graph literacy could be observed in almost all participants. All student teachers used at least two different kinds of data bases to predict the further data points across the six case vignettes. 38.6% of the student teachers used two or three different data bases. Four different kinds of data bases were used by 21.7% of the student teachers. Only two persons used five different data bases (1.2%). In addition, changes in strategy were observed for all student teachers, except for one person. More than half of the student teachers used three different strategies (56.3%) across the six case vignettes. The remaining student teachers changed their strategy two (24.7%), four (13.9%), or five times (4.4%).
Discussion
Examination of the prior knowledge of the sample from Study I suggests that the approach to formative assessment has been consistently weak among student teachers. While most student teachers are aware of the existence of formative assessments and proportionately have theoretical background knowledge, hardly any participants reported practical experience in their use (< 5%). Graph reading experiences in educational and mathematical contexts differed significantly by teacher training. This is to be expected in the university teacher training in Germany, as the proportions of educational and subject-specific training contents are weighted differently depending on the field of study and individual focus in the teacher training program.
With regard to the choice of the data base for prediction, Study I shows that student teachers have a high risk of an unrealistic estimation of future learning progress. Only about 20% of the students intuitively included all available data in their prediction, which is, however, necessary for an accurate prediction (Espin et al., 2017; Klapproth, 2018). Over half of the students focused on a subset of the available data points rather than all available information. Thus, the predictions made about future learning were predominantly based on insufficient data.
Examination of the strategies chosen highlights that there is a great need for specific instruction on graph literacy because student teachers showed an inconsistent approach to prediction. No systematic reason for the choice of strategy can be identified in the available data, such as a property of the graph or a preference by focus in study. Additionally, they frequently switched their strategy. Students most frequently used those strategies (i.e., continuing the pattern or orienting to the trend line) that fall into the two lower levels of graph literacy competence according to Zeuch et al. (2017). The results show that all participants except one switched their prediction strategy within the six case vignettes.
Study I is limited in multiple ways. First, we could not pre-determine the sample size and did not have a really representative randomized sample but an ad hoc sample of persons willing to participate in a survey on this specific subject. Thus, a potentially higher motivation compared to that of the average population of student teachers might bias the results. Teachers with average motivation might therefore show more severe or other difficulties in interpretation. Second, the numerical predictions could not be used to validate the selected data base and interpretive strategy due to the layout of the case vignettes. Visual aids were included in the layout of the graphs as possible factors influencing prediction such as trend line, division between baseline and intervention phases following previous research (Keuning et al., 2017; Newell and Christ, 2017) to provide a nuanced insight into the graph literacy approach. This ensured that even the most inexperienced student teachers could make statements about their prediction procedure. However, the embedding of visual aids means that the assumption about a linear trend in learning progress across all data points is not tenable. Thus, a reference value for matching the accuracy of prediction is missing. In addition, the fixed order of the case vignettes presented may have led to effects in prediction. This design was implemented based on the pilot study to avoid confusing very inexperienced student teachers at entry. In similar studies, such effects should be taken into account or eliminated by a randomized order.
Study II: Video-based intervention on graph reading accuracy
Research questions
The results from Study I suggest that student teachers tend to interpret learning progress graphs intuitively, without a systematic or consistent approach. However, especially for short- to medium-term prediction of future learning developments under the condition of unchanged teaching, it would be necessary to use information about the linear trend. A non-arithmetic approach to estimate the slope of the regression line is Tukey Tri-Split (Tukey, 1977). In Study II, we investigate whether brief video-based instruction on this method increases student teachers’ and in-service teachers’ short-term predictive accuracy on learning developments compared to a simple text-based hint to consider linear trends.
As van den Bosch et al. (2019) show, teachers’ graph literacy skills can be improved via video instruction. However, they used a more general approach which results in a complete instruction on graph comprehension. In Study II, as progress monitoring is still an emerging field in the German school system, we take one step back and ask if the first level of graph literacy, namely predicting learning outcomes by identifying linear trends, can be improved by a short video intervention. Furthermore, it was our aim to examine whether a less than 5 min instruction is sufficient to achieve an improvement among teachers in the field.
Our main hypothesis is:
H1: Student teachers and in-service teachers who receive a very short video instruction about how to use Tukey Tri-Split will improve their short-term predictive accuracy on learning developments more than those who only receive a text-based hint to consider linear trend in data.
Thus, our Null-Hypothesis to be rejected is:
H0: There will be no difference in short-term predictive accuracy on learning developments between student teachers and in-service teachers who receive a very short video instruction about how to use Tukey Tri-Split and those who only receive a text-based hint to consider linear trend in data.
Methods
Sample and procedure
Using the online learning platforms of the authors’ universities, mail contacts to other universities, mail contacts from in-service teacher training providers, and social media platforms, we invited student teachers and in-service teachers to participate in an online survey about learning progress monitoring. In total, N = 198 participants completed the survey.
Within this survey, we implemented a randomized controlled trial: At the beginning of the survey, which was implemented with the software Unipark, all participants received four case vignettes of Study I with the same prediction task estimating numerical values for 1 and 2 weeks after the last measurement point (i.e., weeks 12 and 13) as the pretest. After the pretest, about half of the participants (n = 100) were assigned to the experimental condition. They were shown a short instructional video, introducing Tukey Tri-Split and explaining it with an example. The other half (n = 98), as a control condition, received a text-based hint to consider linear trend in data. Finally, all participants completed the same prediction task with the same four case vignettes again as the posttest.
Conditions
During the survey, participants were randomly assigned to either the experimental or the control condition. The random trigger variable in Unipark was set to provide a nearly equal distribution between both conditions.
Experimental condition
In the experimental group (EG), participants received a 03:03 min video instruction which introduces the Tukey Tri-Split method. The video script adopted the explanation from Hosp et al. (2007) in the way it was transferred to the German school context by Scheer (2021) and embedded it within the example of a primary school teacher wanting to decide which pupils need additional support in reading fluency. The video script and the video in German itself were provided via OSF (see section “Data Availability Statement”). To ensure that the given example in the video was different from the case vignettes, we used the example from Figure 1 as the basis for instruction.
Control condition
The procedure under control condition was the same as under experimental condition except for the intervention between pre- and posttest. Participants in the control group (CG) received, instead of the video, the following text hint:
“Very good. You have completed the first half. In the second half of the survey, we will show you the case vignettes again. Please consider the following tip: Ask yourself whether you can recognize a certain (linear) development trend in the available data, which you can use as a guide.”
We utilized this as a non-specific treatment component control instead of a no-treatment control (Mohr et al., 2009). The rationale for this decision was to ensure that systematic instruction of a specific technique was indeed necessary to improve prediction accuracy and that participants in the experimental group did not improve by priming on one specific feature of the history plots alone.
For ethical reasons, participants under control condition were offered the opportunity to watch the video instruction after submitting the survey.
Measurements
Predictive accuracy on learning progress
To reduce the burden on participants, only four (i.e., in the order presented: graph 6, graph 2, graph 4, and graph 3) of the six case vignettes were used in Study II. In all case vignettes, all optical aids (labeling baseline and intervention phases, vertical lines) or rate of improvement (slope) information were removed (for example, see Figure 4). Thus, it was possible to maintain the assumption of linear trend across all data points.
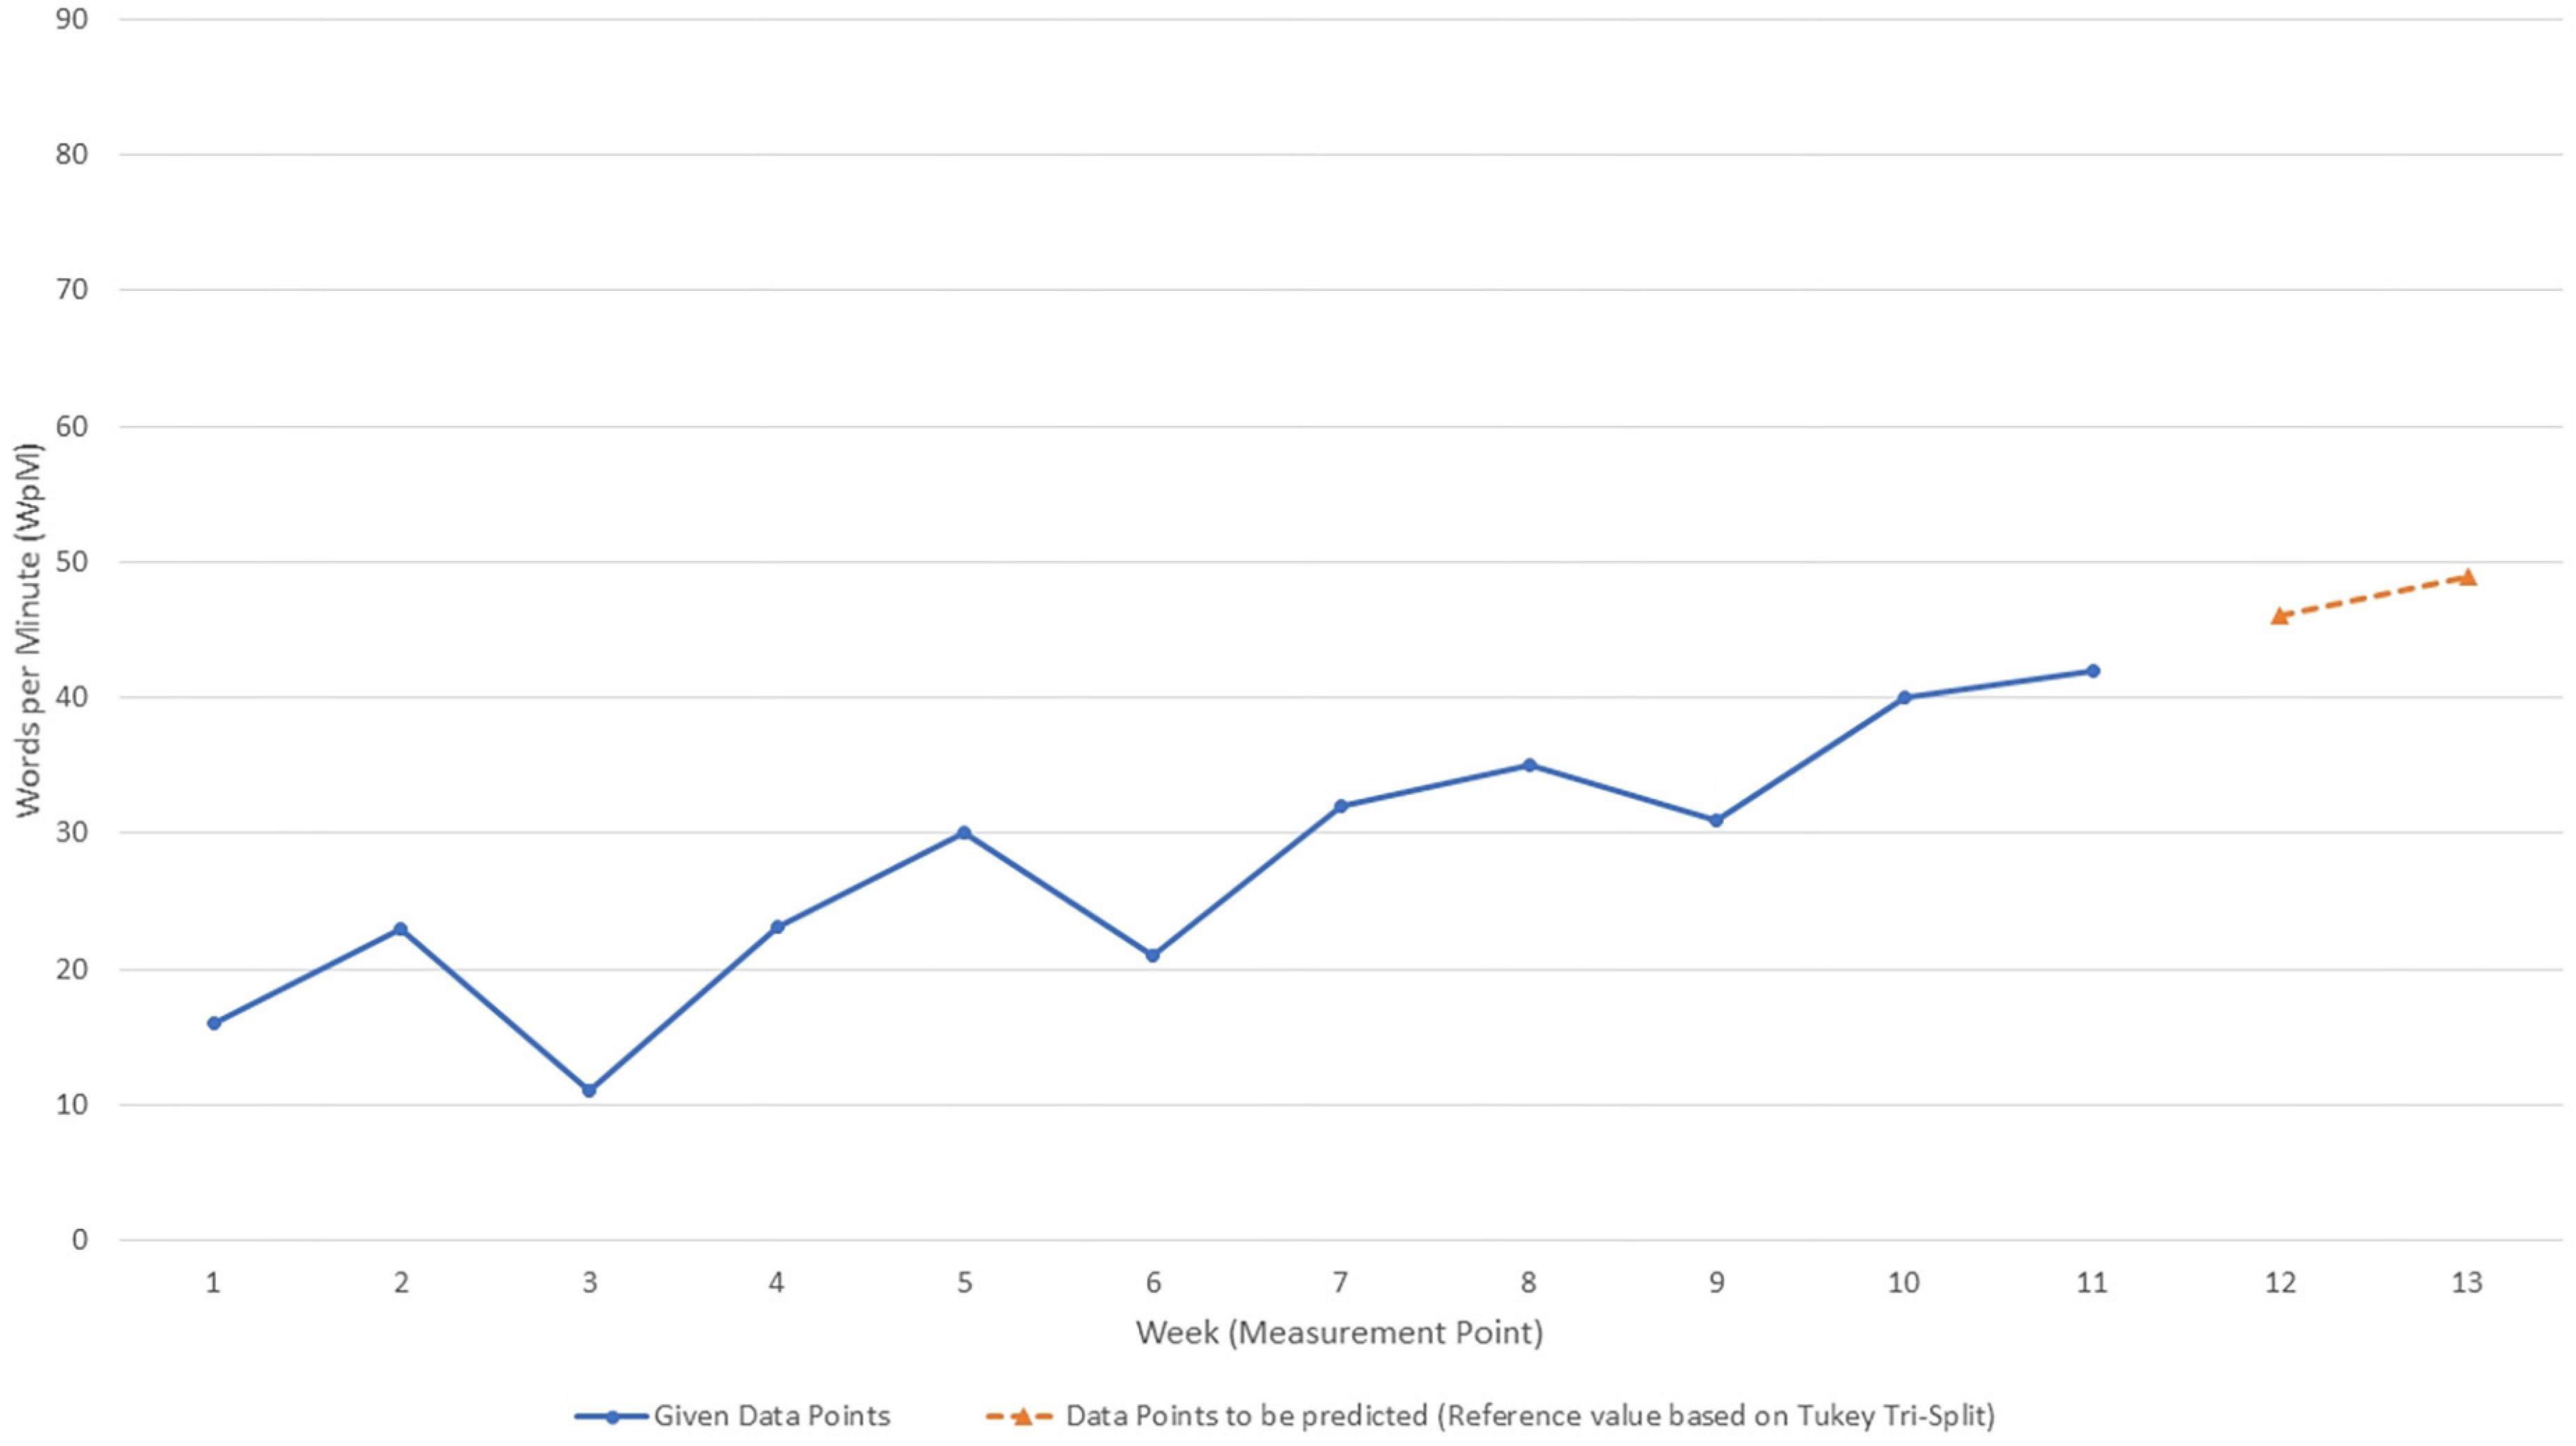
Figure 4. Example of a learning progress graph used in Study II. For this publication, we added the reference values for the data points that had to be predicted by the participants (orange). The y-axis represents week of learning progress measurement, the x-axis represents pupil’s learning outcome (reading fluency, words per minute).
The graphs’ characteristics varied according to rate of improvement (medium vs. high) and variability of data points (low vs. high). Thus, the four case vignettes represent a full 2 × 2 combination of both characteristics.
To calculate a score of prediction accuracy, we followed the approach of constant errors (CE) as used by Klapproth (2018). CE is calculated as the difference of a participant’s prediction of learning outcome (PP) and the learning outcome as predicted by regression (PR). PR was calculated using the arithmetic algorithm to replicate Tukey Tri-Split.
However, since we needed average test scores across individual case vignettes, we had to eliminate negative deviations by squaring CE, resulting in a Squared Constant Error (SCE). To achieve a total test score, we averaged SCE across all eight values (four case vignettes with two data points to be predicted each), resulting in a Mean Squared Constant Error (MSCE). Table 1 gives an overview of these measures. Squaring CE to SCE/MSCE also leads to a kind of penalty for more inaccurate PP compared to PP close to PR.
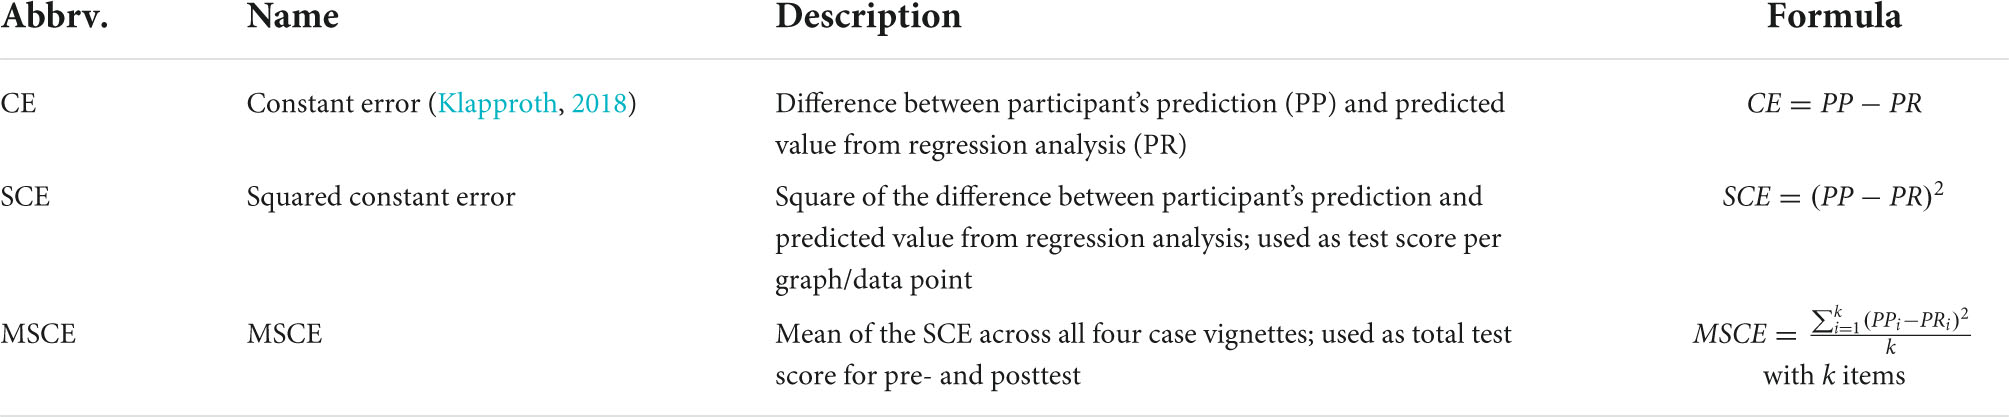
Table 1. Overview of constant error (CE), squared constant error (SCE), and mean squared constant error (MSCE), and their application in the study.
Treatment fidelity
To validate our results, we asked the participants under experimental condition to rate on a four-point scale:
1. Did you watch the explanatory video shown in the middle of the survey in full and fully concentrated on it?
2. Were you able to follow the explanations in the video well?
3. Were you able to apply the method presented in the video to the case studies that followed?
Furthermore, we asked the participants under control condition to rate on a four-point scale:
1. Was the hint (linear trend) in the middle of the survey helpful?
2. Did you change your approach after the hint?
Background variables
To examine if both the experimental and control groups were comparable with regard to their personal and professional background, we collected data on participants’ profession (special needs education teacher training vs. regular teacher training), gender, age as well as self-rated prior knowledge in learning progress monitoring, graph comprehension, and general mathematics skills.
Data analysis
We only included participants with correct participants code to ensure that no duplicates bias the analysis and with all case vignettes completed.
Since outliers are a serious source for bias, we applied the interquartile range (IQR) approach to detect any outliers. Thus, participants were classified as outliers if one of their MSCE (post- or pretest) was either 1.5 times IQR above the third quartile (Q75) or below the first quartile (Q25). In the case of an online study with no control over participants’ attention while answering the test items, outliers are considered as caused by inattention or typos when handling the online survey tool. Therefore, to avoid biased analysis, we excluded cases who were classified as outliers.
Using 2 × 2 ANOVA with a within-subject factor (pre- vs. posttest) and a between-subject factor (experimental vs. control), we tested whether the video intervention had a significant effect on the MSCE score.
An explorative follow-up analysis was performed to analyze whether graph characteristics (rate of improvement, data variability) and distance from last data point (namely: week 12 vs. week 13) have an impact on both the SCE and the intervention effect. To that purpose, we used stepwise linear regression.
Results
Sample characteristics
From N = 198 participants who completed the survey (EG: n = 100; CG: n = 98), eight participants (4.0%) were excluded due to incorrect user ID, eleven (5.6%) due to missing values, and 17 (8.6%) due to outliers. Thus, we analyzed a total sample of N = 162 participants with n = 84 in EG and n = 78 in CG (see Figure 5).
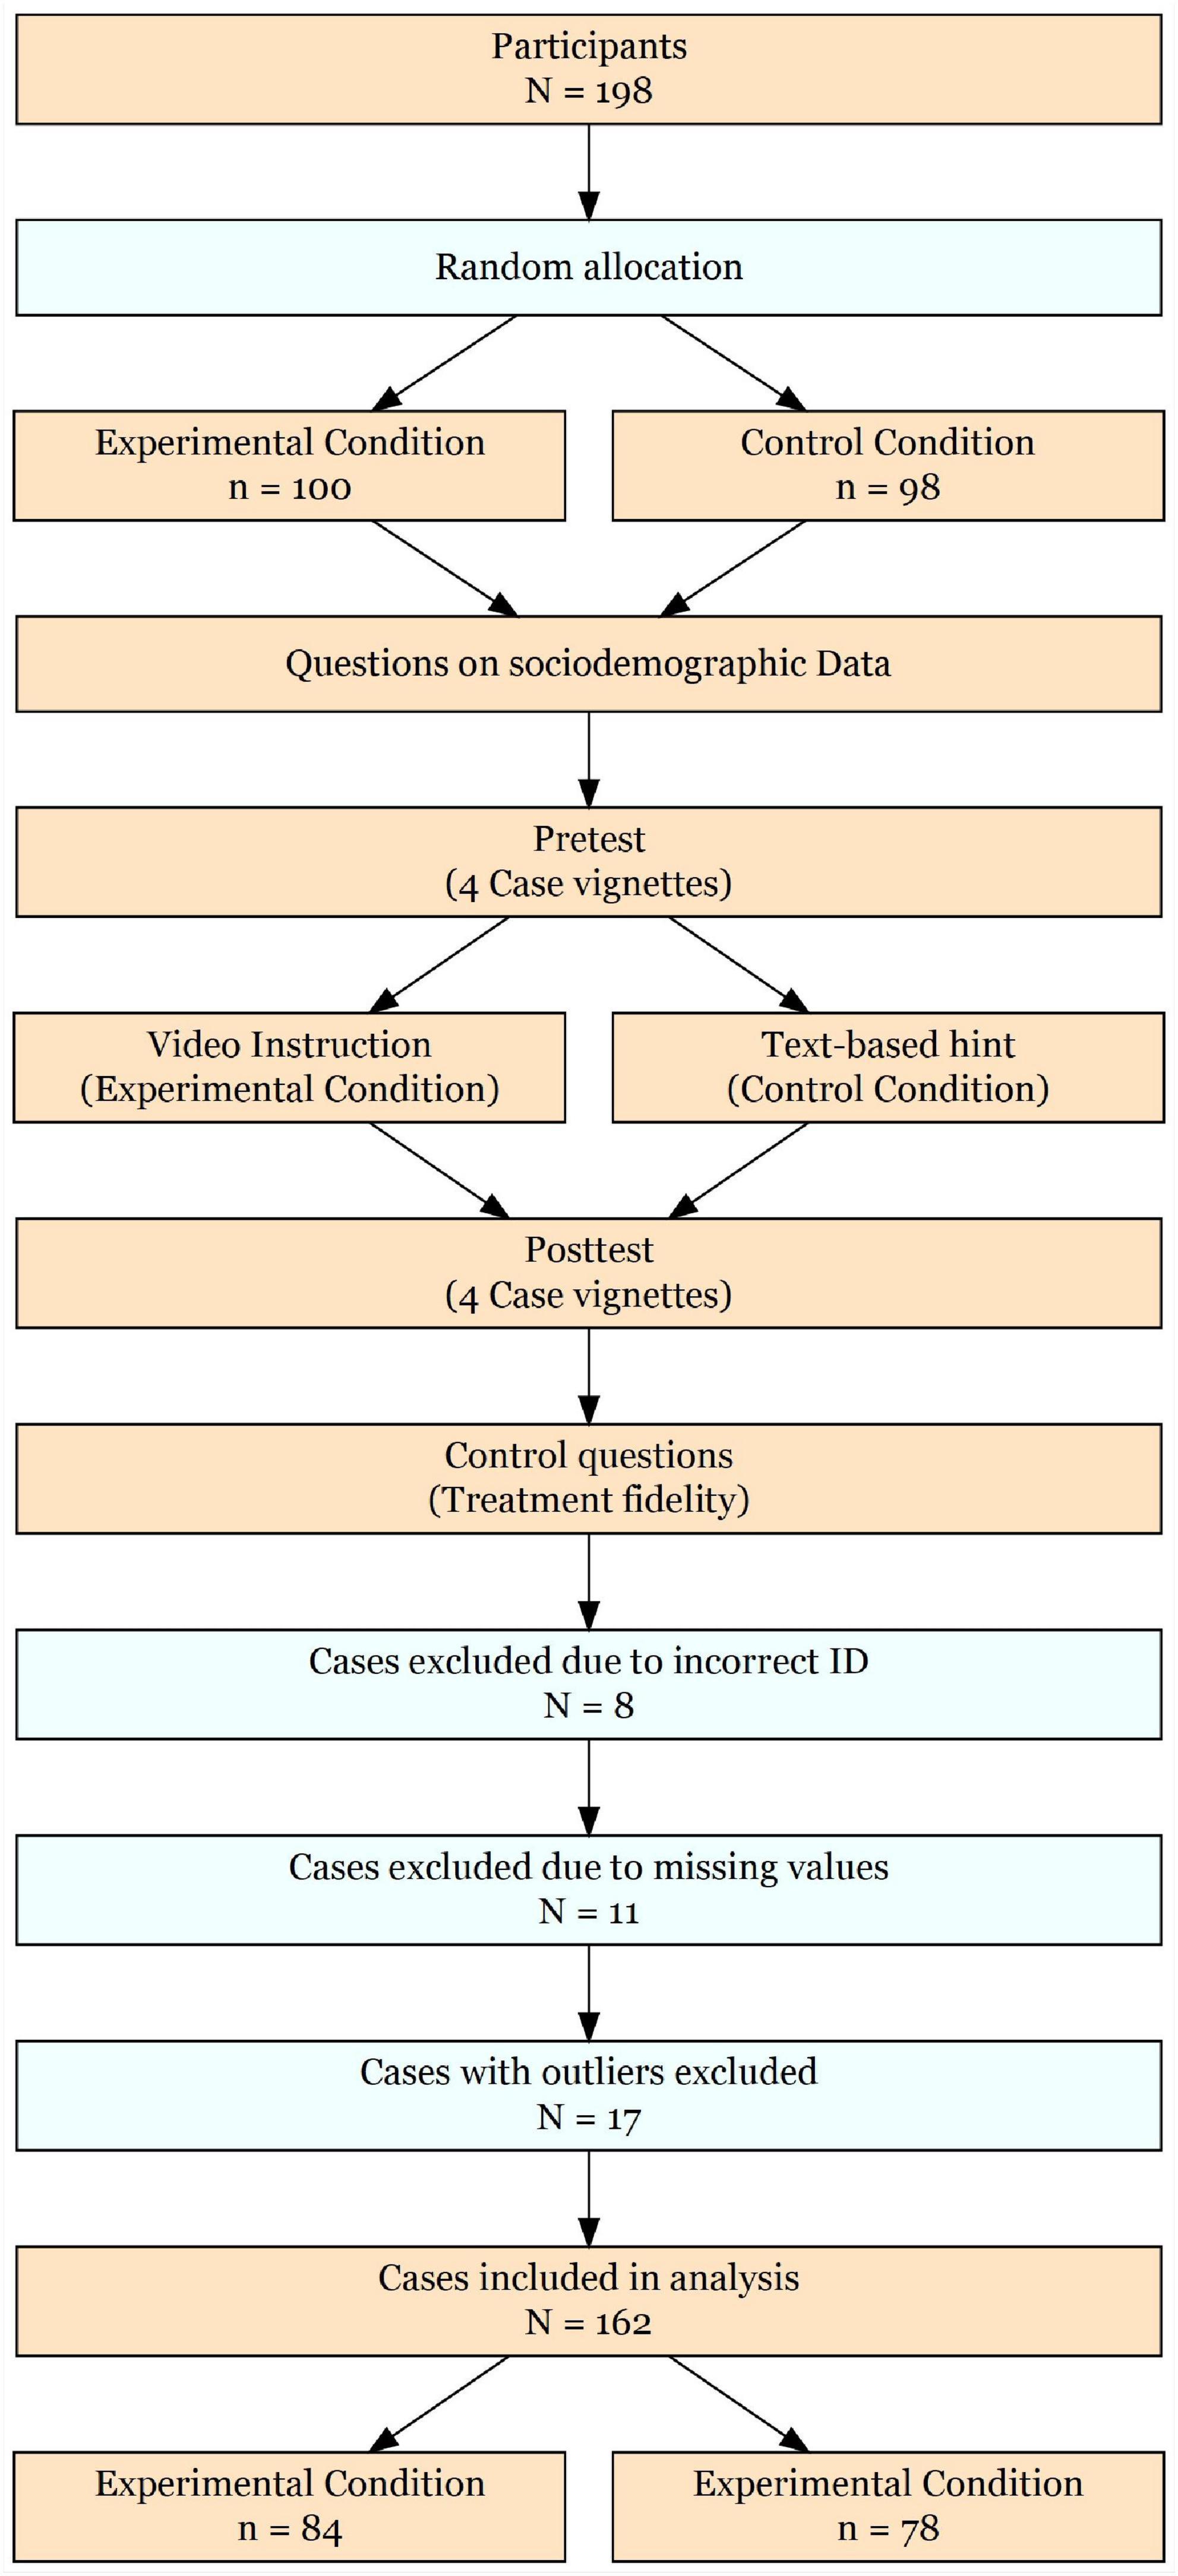
Figure 5. Flow-chart of participants progress through the phases of Study II.
On average, the participants were 31.1 years old (SD = 13.1), with 78.9% (n = 127) being female (male: 20.5% [n = 33]; other gender: 0.6% [n = 1]). The majority of participants were student teachers (56.8%), the dominant teaching degree across all participants was special needs education (80.1%, n = 129). Only a minority of the participants had had prior contact to progress monitoring (32.1%, n = 52) or general graph interpretation (43.1%, n = 69). As Table 2 shows, no significant differences between EG and CG could be found with regard to the background variables.
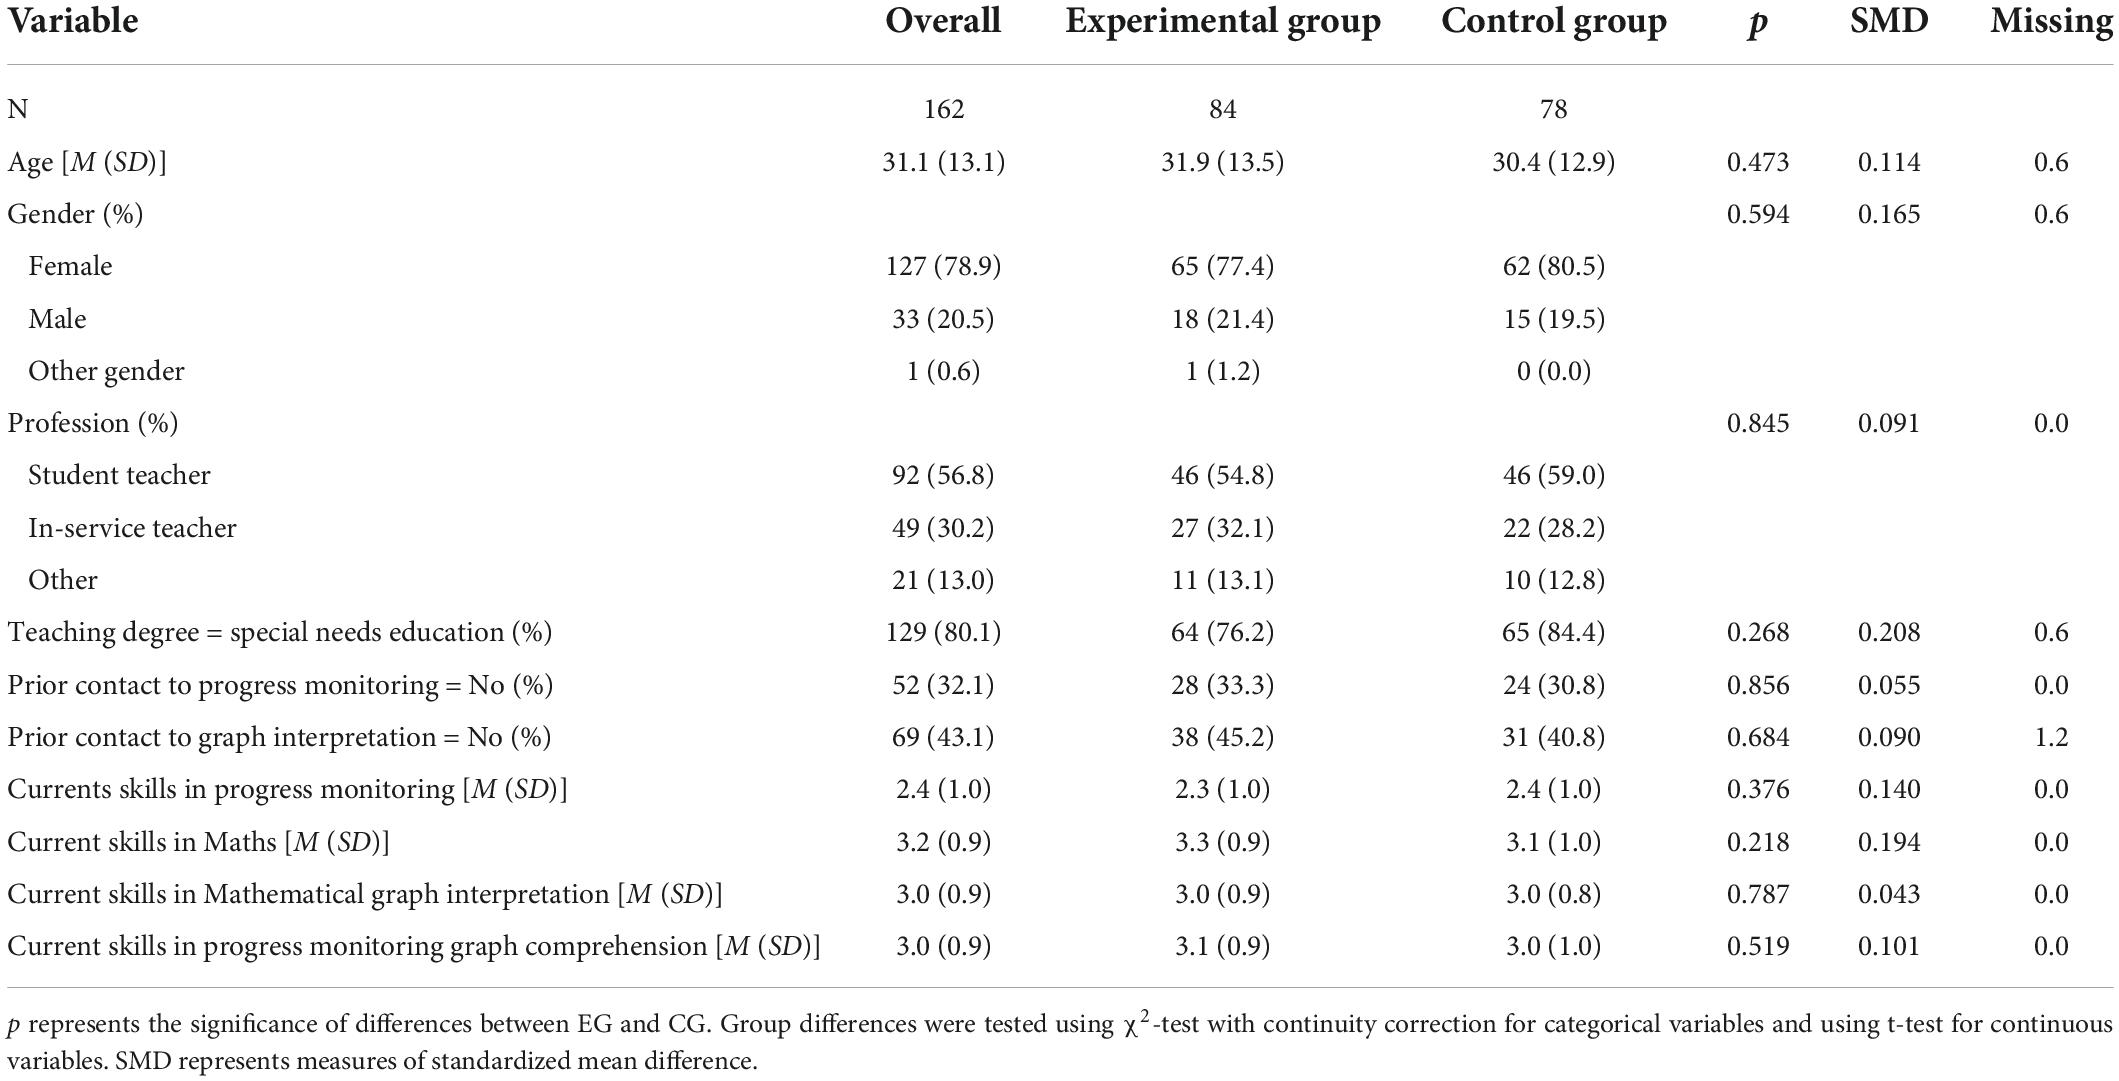
Table 2. Sample characteristics in Study II.
Global treatment effect
As displayed in Table 3 and Figure 6, MSCE in EG decreased after the video-based instruction from M = 55.83 (SD = 30.40, 95%CI [49.33, 62.33]) to M = 31.98 (SD = 25.53) while MSCE in CG remained nearly the same. The 2 × 2 RM-ANOVA indicated significant main effects for group (EG vs. CG) with F(1, 160) = 8.63, p = 0.004, Cohen’s f = 0.36, for measurement time (pre- vs. posttest) with F(1, 160) = 24.21, p < 0.001, Cohen’s f = 0.39 as well as a significant interaction effect of group vs. measurement time with F(1, 160) = 24.26, p < 0.001, Cohen’s f = 0.39. Thus, we most probably may discard the H0 and assume that our video-based Tukey Tri-Split instruction significantly improved participants predictive accuracy compared to a text-based hint.
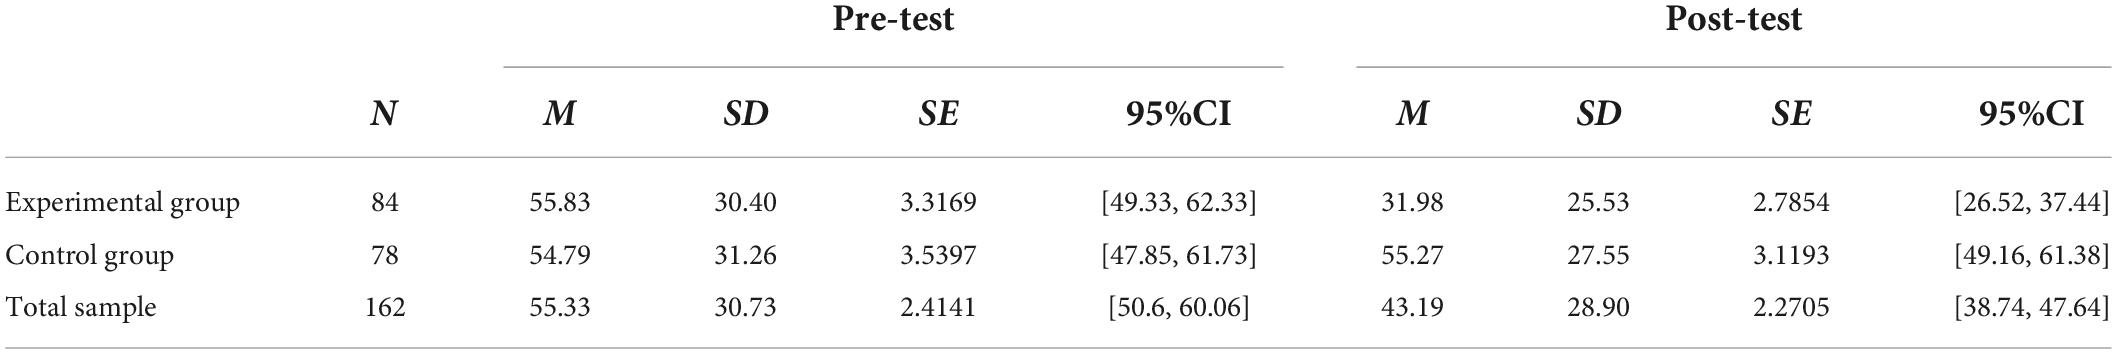
Table 3. Descriptive statistics of the MSCE scores by group and measurement time.
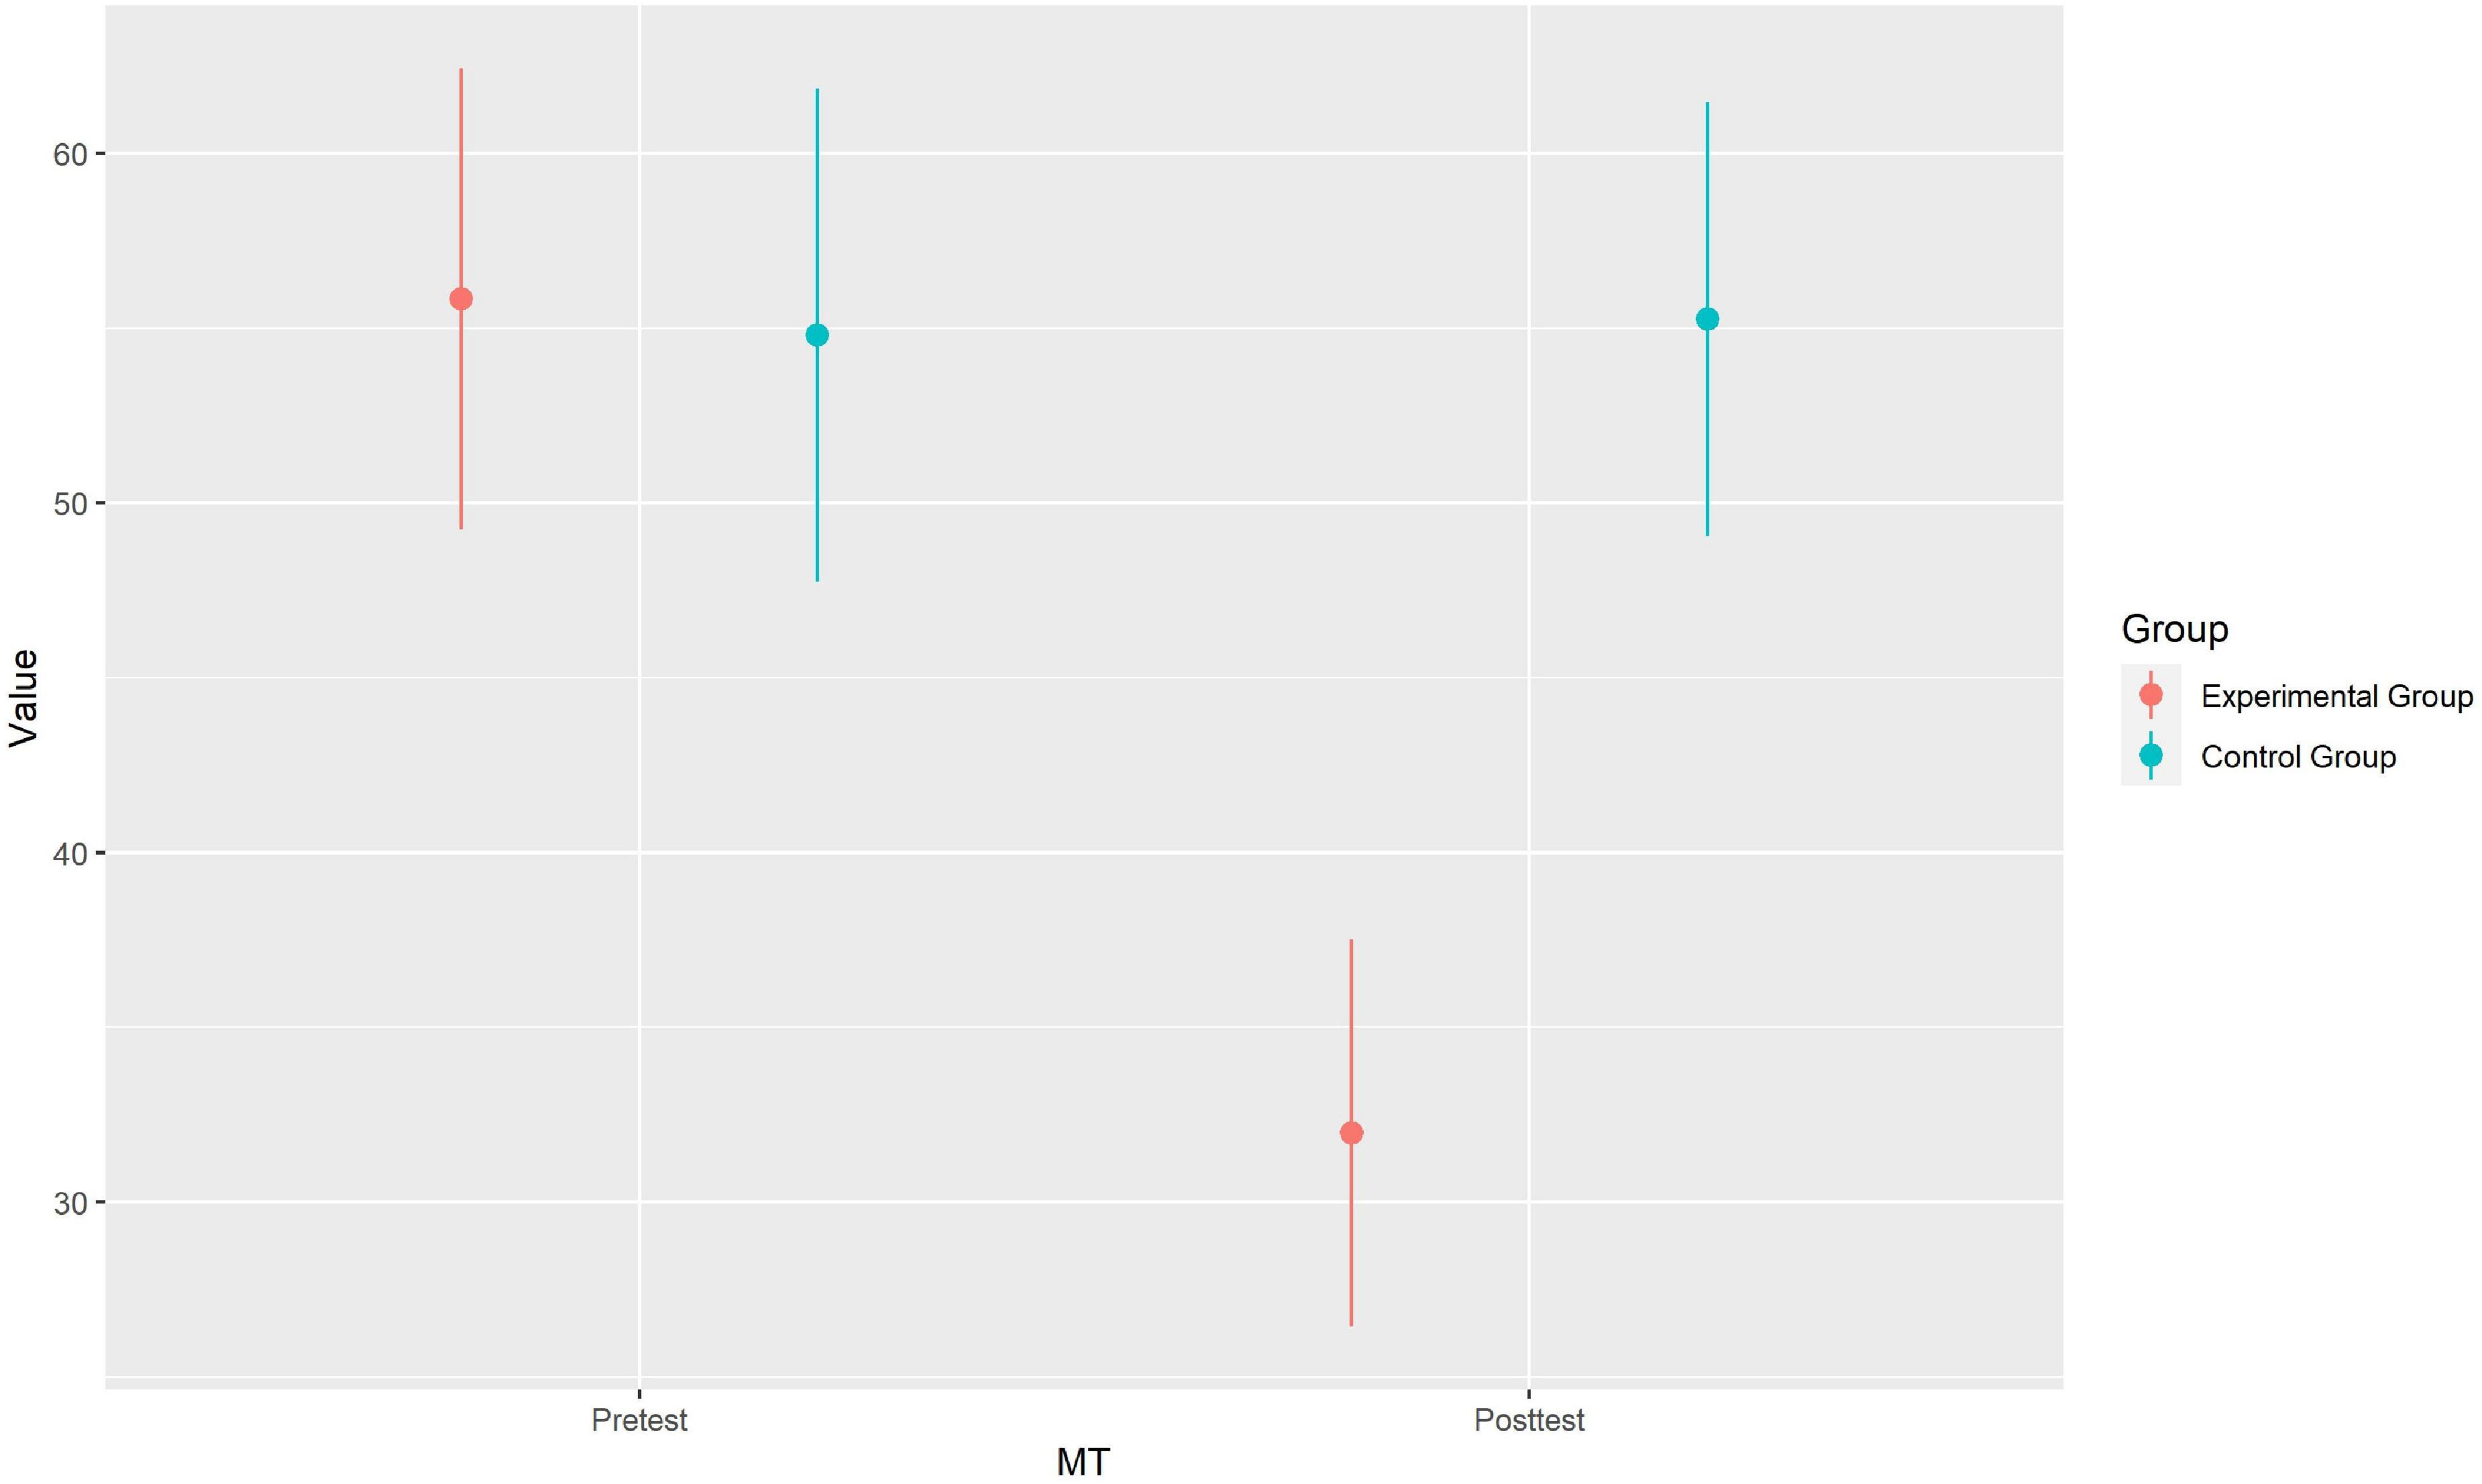
Figure 6. Interaction plot of MSCE scores by group vs. measurement time. Data points represent the group means. Error bars represent 95%CI.
Treatment fidelity
Table 4 displays the results of the questions for treatment fidelity. Most of the participants from the EG answered the treatment fidelity questions at least with “rather yes,” but were more self-critical when it came to rating their personal ability to implement the Tukey Tri-Split. Furthermore, MSCE in posttest was more below MSCE in pretest for participants who answered the treatment fidelity questions more positive. As for the most important question, whether participants watched the video completely and with concentration, the difference between those participants who answered at least “rather yes” and the rest was indicated as statistical significant by a two sample t-test with t(df = 82) = –2.56, p = 0.012, d = –0.95 (see Table 4 for details). Since the MSCE quantifies the deviation from the calculated predicted value, this result means that the predictions of the participants who watched the intervention video with more concentration were closer to the calculated target value at the posttest than the predictions of those participants who did not watch the video intensively. Participants from the CG, on the other hand, did not find their text-based hint helpful and showed no clear patterns of intervention effect based on their responses to the treatment fidelity questions.
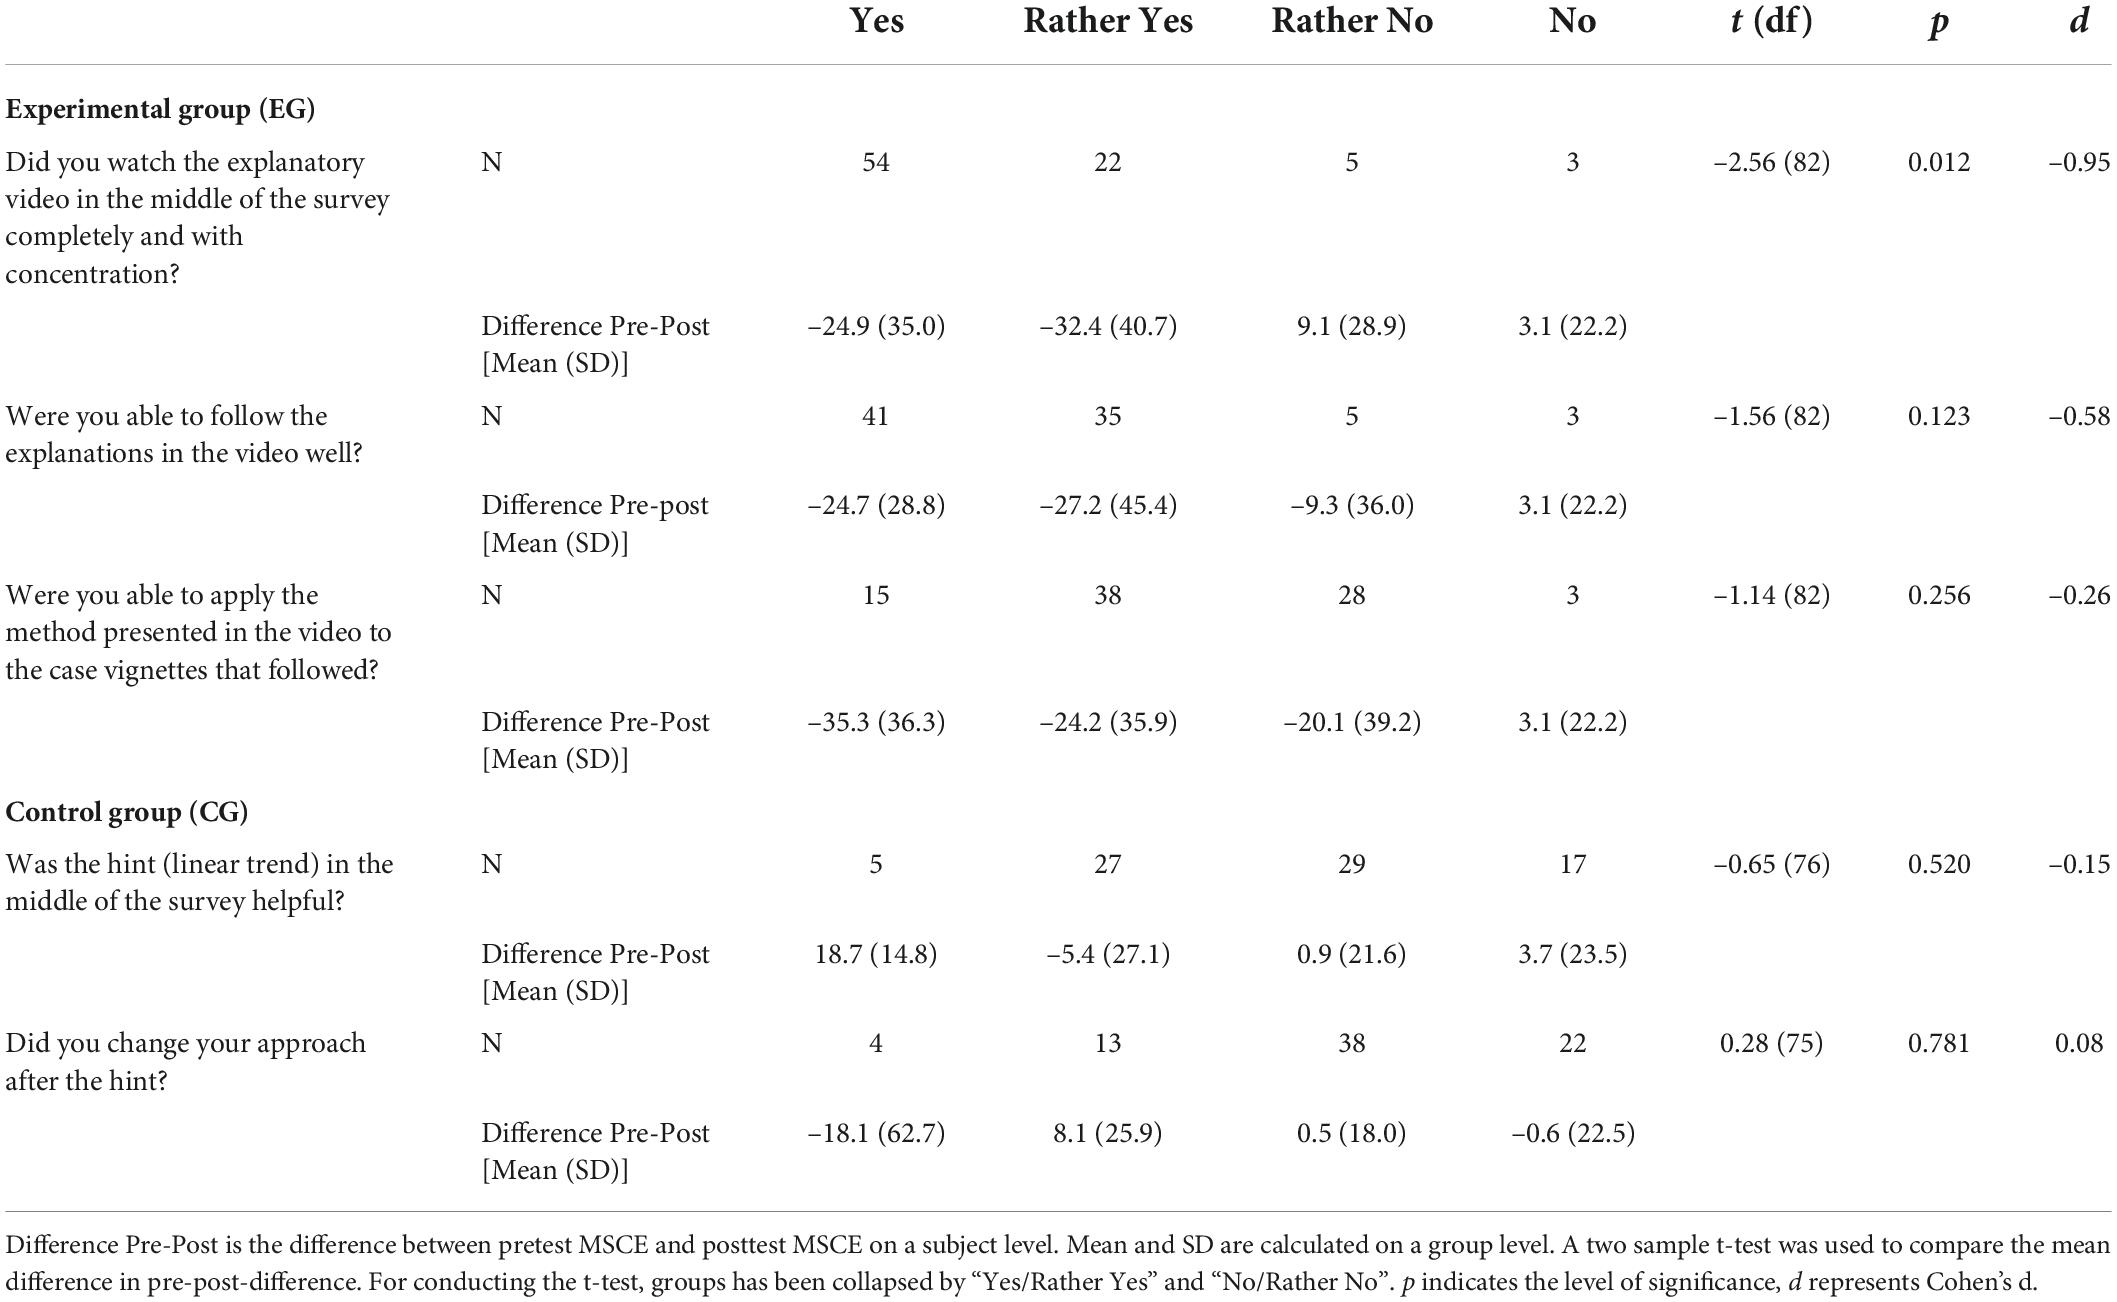
Table 4. Participants’ responses to the treatment fidelity questions and how these responses interact with the intervention effect.
Effects of graph characteristics on predictive accuracy and on the effectiveness of the video-based instruction
A full table of SCE descriptive statistics by measurement time, group, and graph characteristics is provided as Electronical Supplement (Supplementary material) via OSF (see section “Data Availability Statement”). The most important findings are, as Figure 7 illustrates, that participants from the EG showed higher SCE scores in the pretest of all four case vignettes. This means that the EG participants predicted the target value more accurately in the posttest than in the pretest, regardless of graph characteristics. For the EG group, the intervention effect, based on visual inspection, was found to be the largest for the graph with high variability and medium rate of improvement. Here, the SCE value decreases from 52.17 at pretest to 13.54 at posttest. Furthermore, for all participants from the EG and CG, low variability of data points combined with a medium rate of improvement led to such a predictive accuracy in the pretest that there seemed to be no further intervention effect.
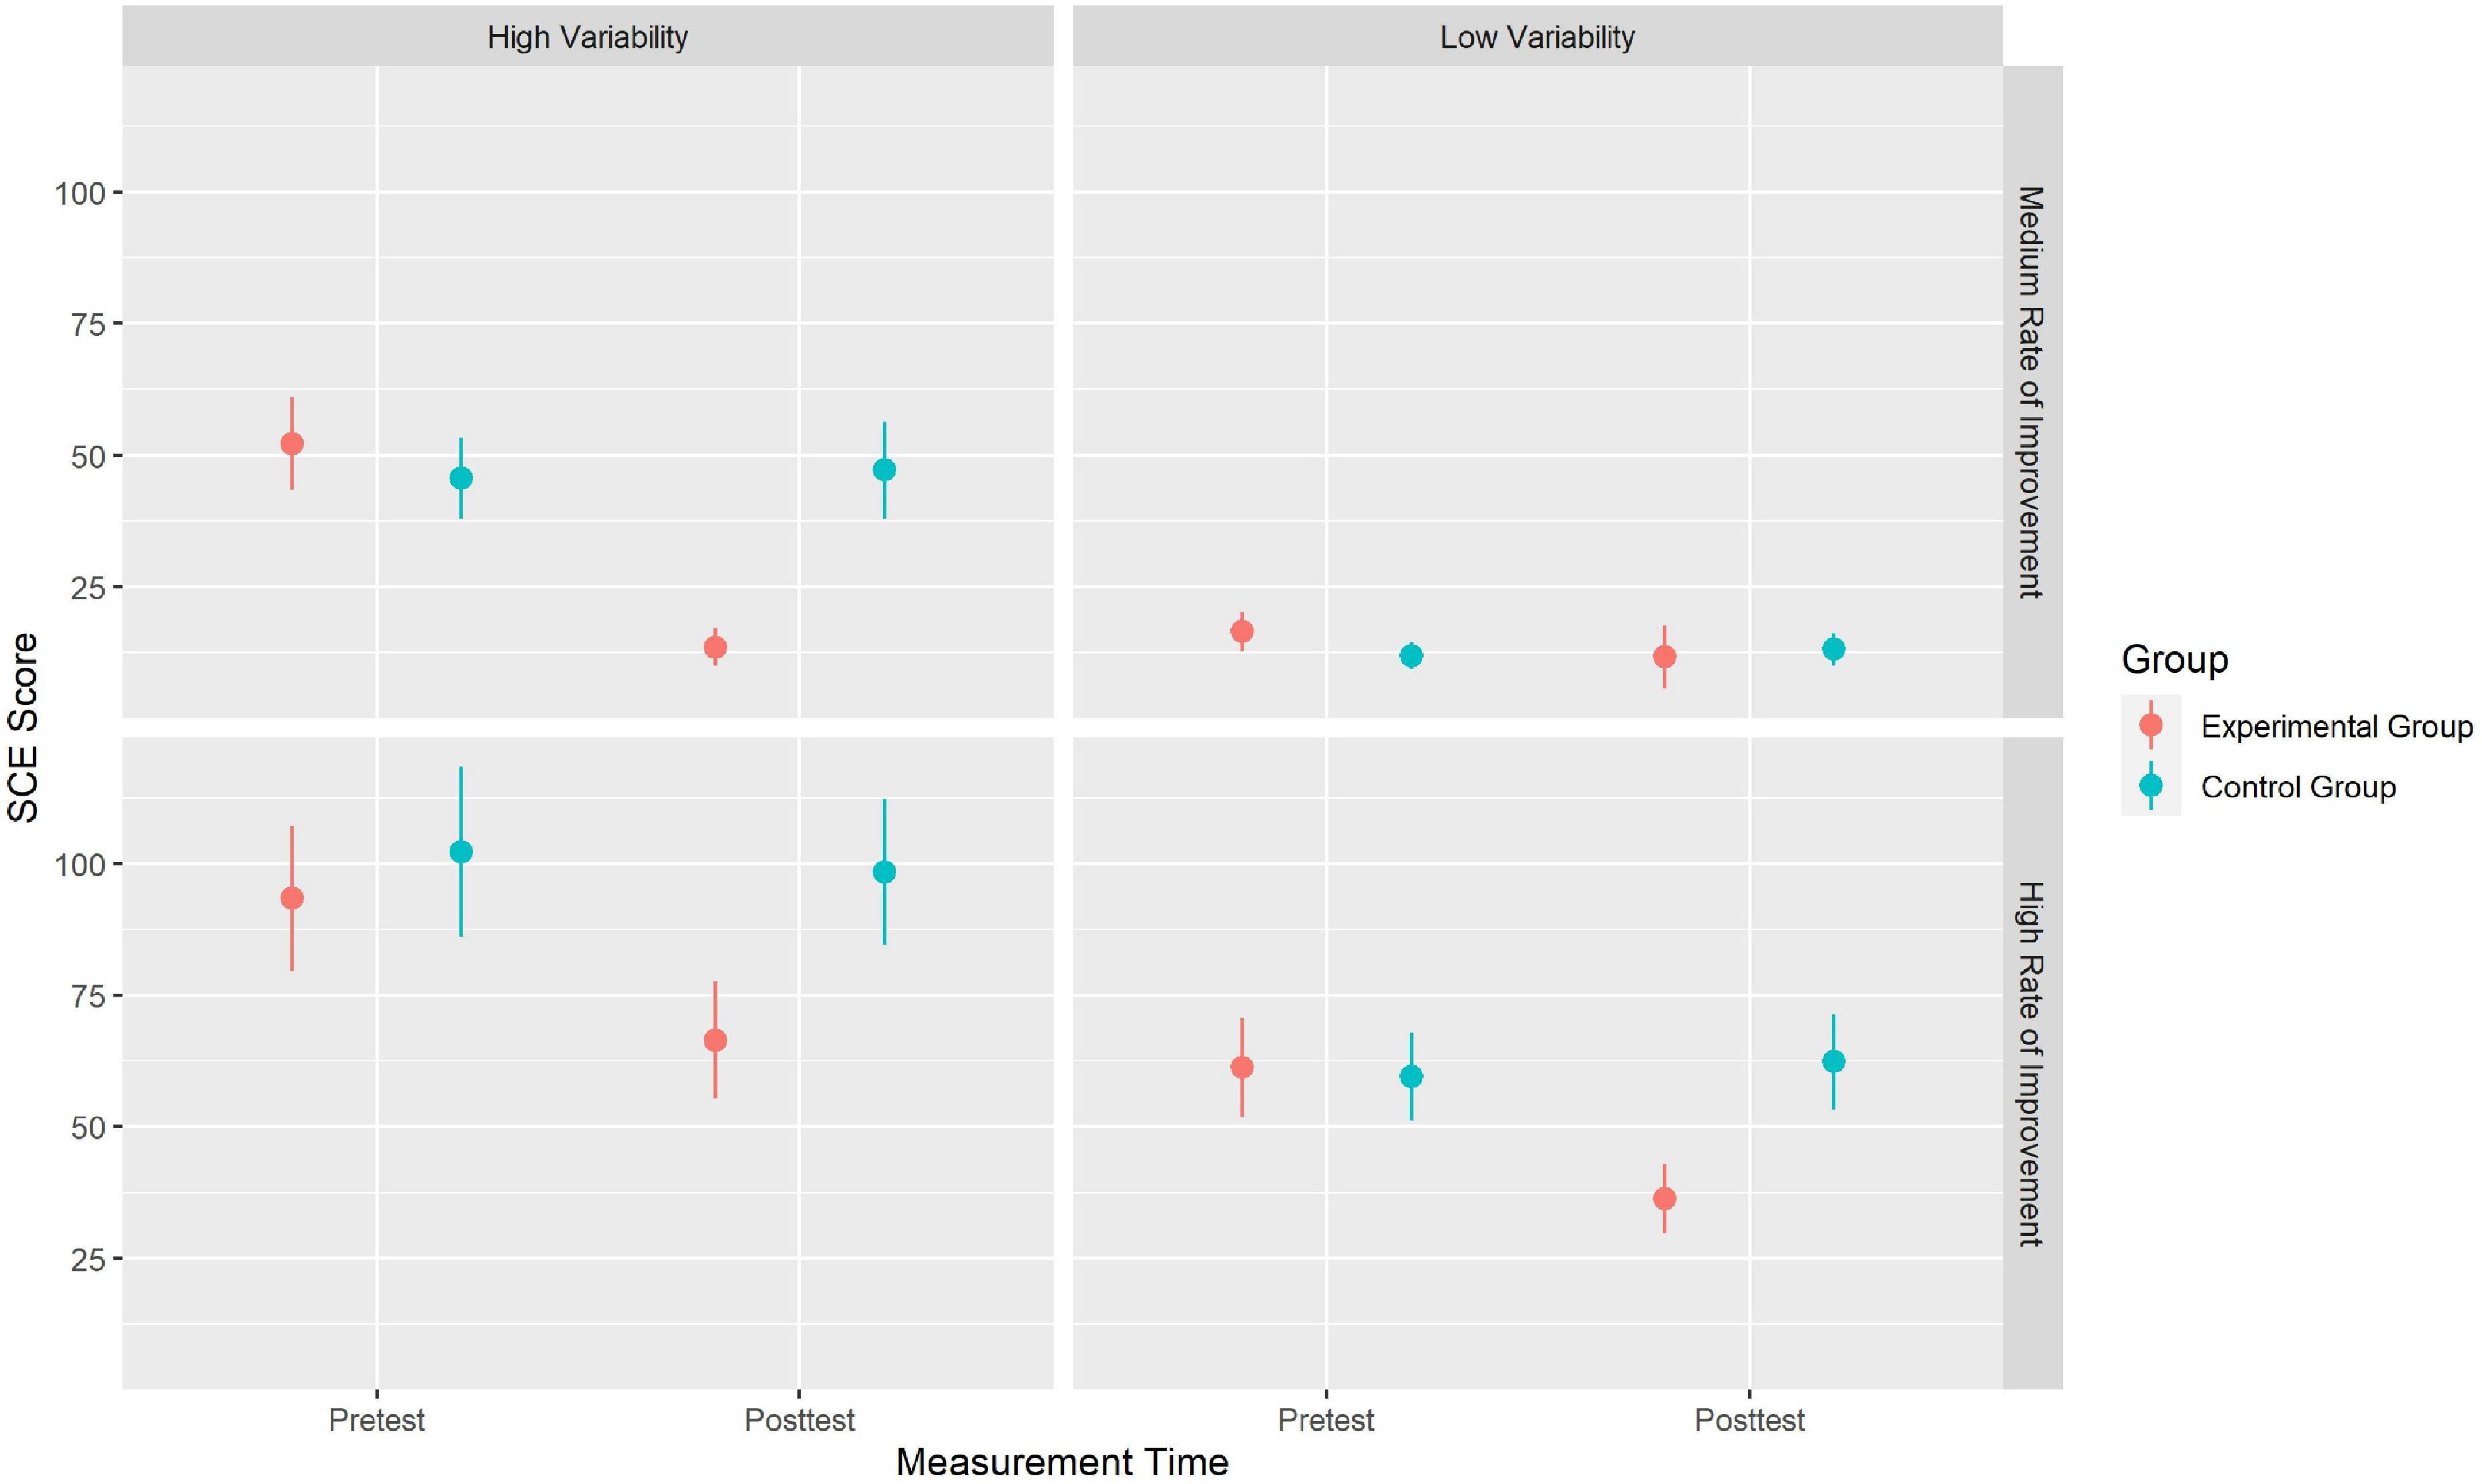
Figure 7. Interaction plot of the effectiveness of the video-based instruction by graph characteristics (rate of improvement vs. variability of data). Data points represent the group means and error bars represent the 95%CI. Figures in the left panels display results for the vignettes with high variability of data points while figures in the right panel display results for the vignettes with low variability of data points. The upper row displays the results for the vignettes with a medium rate of improvement while the bottom row displays the results for the vignettes with a high rate of improvement.
To exploratively analyze the impact of the graph characteristics, we conducted stepwise linear regression in four steps:
• Model 1 is the baseline model which just replicates the original analysis of the treatment effect itself (predictors: group, measurement time).
• In Model 2, we included the rate of improvement (medium vs. high) as predictor.
• In Model 3, we included variability of data points (low vs. high) as predictor.
• In Model 4, we added the distance of the predicted data point to the last given data point (week 12 vs. week 13) as predictor.
We compared the four models with regard to R2, AIC, and BIC. The full regression table is provided as Electronical Supplement (Supplementary material) via OSF (see section “Data Availability Statement”). As displayed there, model 4 performed best (R2 = 0.23, AIC = 28,460.2, BIC = 28,653.6). However, increased model fit from step three to step four is quite small. In-depth analysis shows that the general intervention effect is still there, even if controlled for graph characteristics. Furthermore, a high rate of improvement results in significant higher SCE, which represents a weaker predictive accuracy. Additionally, as seen in visual inspection, lower variability of data points results in smaller SCE leading to better predictive accuracy. However, this effect of low data variability is eliminated in the posttest unless participants are in CG or the graph has a high rate of improvement. A greater distance of the predicted measurement point from the last given measurement point was, counter-intuitively, associated with better performance regarding predictive accuracy except for EG in the posttest. For EG, this means that the video-based instruction worked so well that participants no longer performed worse in rating week 12 than in rating week 13.
Discussion
We could show that the video-based instruction of Tukey Tri-Split was effective in increasing student teachers’ and in-service teachers’ accuracy to predict pupils’ future learning outcomes with a, according to Cohen (1988), large effect size of f = 0.39 compared to a simple text-based control group. The results of our treatment fidelity questions argue for a high amount of treatment fidelity as well as for the internal validity of the study. Participants who fully concentrated on the video and found it comprehensible did benefit more than those who did not. Our main question on treatment fidelity, however, contained both aspects, watching completely and with concentration. Despite this, some participants who watched the video completely but with less concentration might have answered “rather yes” or “rather no,” although we assume that this presents only a small risk of bias.
Furthermore, we could show that participants’ predictive accuracy was influenced by graph characteristics such as data variability (i.e., higher variability led to more inaccurate predictions), slope (i.e., higher rate of improvement led to more inaccurate ratings), and the week to be predicted (i.e., in pretest, week 13 was predicted more accurately than week 12). However, week 13 as point to be predicted and low data variability each reduced the effect of the video-based intervention, but did not eliminate it.
There are several limitations to be discussed. First, regarding the non-representative and non-randomized sample as well as the motivation of the participants, the same difficulties show as in Study I. In both studies, this is due to the web-based realization of the questionnaires with voluntary participation. Second, predictions were made about graphs presented via computer display. If graphs had been available as printouts for the participants, effects might have been different. We do, however, assume that, in that case, the intervention effect might have been even higher—this is due to the fact that, in a pencil-paper-version, participants would have had the possibility to use rulers and draw on the diagram to make their predictions more accurate than when having to apply the technique on a computer screen. A third limitation follows from our control group: While the video intervention took 3 min, reading the textual hint in the control group might have taken just a few seconds. Therefore, we cannot preclude any effect of waiting time of any kind before post-test. A minor argument that could be included into the discussion are possible memory effects of the graphs. However, if such an effect had occurred, it should be the same for both groups, which was one reason to apply the randomized control design in our study.
General discussion
According to the U.S. Supreme Court decision in Andrew F. v. Douglas County School District, learning development and reaching support goals are the most important indicators to determine whether the chosen education is appropriate (Prince et al., 2018). Regardless of the school system, graph literacy is an increasingly important aspect of DBDM in inclusive and special education. Currently, benchmarks and goals for all students are often used as a standard of comparison. However, more important is the question of what learning development the individual student can achieve in his or her particular circumstances and what intervention is the optimal one. For such educational decisions based on quantitative progress monitoring data, simple tools such as the Tukey Tri-Split are necessary for teachers to define achievable learning goals (Hosp et al., 2007; Fuchs and Fuchs, 2011). A core competency of special education teachers is the goal setting and prediction of which goal will be achieved by the child. They must always consider under what conditions and in what environment the child learns best. How this competency can be improved in the area of assessment and graph reading for students and practitioners is an open question so far (Wagner et al., 2017; Blumenthal et al., 2021).
Our research focused on the lowest level of graph literacy (i.e., reading the data; Zeuch et al., 2017) in Study I in order to be able to develop a low-threshold intervention for novices in Study II. The results of Study I again replicate the need for specific support in graph literacy through an example with a sample from Germany, a country without implemented MMTS. Even though few student teachers already intuitively take a good approach to predicting future learning progress from a relevant data base, this combination is so far rare and not consolidated. The approach of formative assessment originated in special education (Fuchs, 2017) and is also heavily researched and taught in Germany by representatives of this discipline (e.g., Jungjohann et al., 2018b; Blumenthal et al., 2021). It was surprising, therefore, that special education student teachers indicated equal amounts of prior knowledge and experience with formative assessments as did students in regular education. This finding suggests that it is not only graph literacy training that should be deepened, but also that awareness of the DBDM approach needs to be more widely disseminated across both teaching majors.
In Study II, we could show that a video-based instruction can increase student teachers’ and in-service teachers’ predictive accuracy of learning outcomes. Although our measurements are near-to-instruction measures, the findings are in line with other research (van den Bosch et al., 2019). However, since our instructional video was far shorter than those used by van den Bosch et al. (2019) with about 3-min against to up to 45 min, we could show that even very small and low-threshold interventions can have a huge impact, at least as a short-term effect. In future research, it should be evaluated if there is (a) a transfer effect on DBDM skills in general and (b) a medium or even long-term effect.
Furthermore, Study II covered the research desiderate from Study I: We succeeded in evaluating whether graph characteristics (rate of improvement, data variability, distance from last point given) have any effect on predictive accuracy. Expectedly, graphs with a high rate of improvement and a high data variability were more difficult to interpret for the participants without training. Consequently, for these graphs, the video-based instruction had the biggest effect. For two reasons, this finding underpins the necessity of systematic instruction by using strategies for data prediction as for instance Tukey Tri-Split. First, in real-life learning progress monitoring, high data variability is expectable and, second, we want our interventions to increase the slope of learning progress. However, we need to further explore how accurate medium- to long-term prediction (for example predicting week 22 instead of week 12 when there are still 11 data points ahead) is and how instruction affects accuracy for these long-term predictions.
Reading graphs is an important component of DBDM (Mandinach and Gummer, 2016). However, this is only one component among many others. It is equally important to interpret the other quantitative data from progress monitoring, in addition to the tasks solved, and to relate it to the other qualitative and quantitative data about the child and the learning environment. For comprehensive support, all data must be interpreted together as a team. Direct implications for school practice become apparent only when the entire process of DBDM is put into practice. Thus, in addition to school achievement tests and screenings, progress monitoring tests should be known and used in school practice. At present, this is not yet foreseeable in Germany for the next few years.
Limitations
One limitation across both studies concerns the transferability of the findings to school practice. In particular, Study II demonstrates the positive effects of the video-based intervention in terms of predictive accuracy. To what extent this improved prediction of short-term data has implications for the processes of DBDM in school practice remains to be seen. This will require, for example, a long-term study in the field focusing on prediction accuracy among teachers of their students. It would need to be verified whether the positive effects can also be replicated under the influence of other variables from the field such as relation to teaching, interventions actually implemented, or individual learning paths.
Conclusion
Overall, we can conclude that there is a fundamental need to implement graph literacy skills into teacher training curricula for both general and special needs education. Such training can be integrated into existing teacher education. A few learning units on the central aspects of graph interpretation could be taught. These include the Tukey Tri-Split used in our study as well as the following topics: making conscious decisions about the number of measurement points, identifying the current state of learning distinguishing between baseline and intervention phases, and, last but not least, defining, setting and reviewing support goals. We can see that student teachers’ and in-service teachers, without further training, lack strategies to interpret learning progress graphs. Our results furthermore indicate that even small but structured, direct-instructional training sessions such as the one used in our study can lead to important increases in graph literacy skills.
Data availability statement
The datasets presented in this study can be found in online repositories. The names of the repository/repositories and accession number(s) can be found below: https://doi.org/10.17605/OSF.IO/X2RS3.
Ethics statement
Ethical review and approval was not required for the study on human participants in accordance with the local legislation and institutional requirements. The patients/participants provided their written informed consent to participate in this study.
Author contributions
JJ and MG designed the Study I and conducted the data collection. DS, JJ, and MG designed the Study II and conducted the data collection, designed the data analysis strategy for Study I, designed the data analysis strategy for Study II, and wrote and edited the manuscript. JJ wrote the R syntax for Study I and outlined the structure of the manuscript. DS wrote the R syntax for Study II. All authors contributed to the article and approved the submitted version.
Funding
This study was funded by the Deutsche Forschungsgemeins-chaft (DFG) (grant no. 453372524).
Conflict of interest
The authors declare that the research was conducted in the absence of any commercial or financial relationships that could be construed as a potential conflict of interest.
Publisher’s note
All claims expressed in this article are solely those of the authors and do not necessarily represent those of their affiliated organizations, or those of the publisher, the editors and the reviewers. Any product that may be evaluated in this article, or claim that may be made by its manufacturer, is not guaranteed or endorsed by the publisher.
Supplementary material
The Supplementary Material for this article can be found online at: https://www.frontiersin.org/articles/10.3389/feduc.2022.919152/full#supplementary-material
References
Ahmed, Y. A. (2019). Data-based decision making in primary schools in Ethiopia. J. Prof. Cap. Commun. 4, 232–259. doi: 10.1108/JPCC-11-2018-0031
Anderson, S., Jungjohann, J., and Gebhardt, M. (2020). Effects of using curriculum-based measurement (CBM) for progress monitoring in reading and an additive reading instruction in second classes. Z. G. 13, 151–166. doi: 10.1007/s42278-019-00072-5
Ardoin, S. P., Christ, T. J., Morena, L. S., Cormier, D. C., and Klingbeil, D. A. (2013). A systematic review and summarization of the recommendations and research surrounding curriculum-based measurement of oral reading fluency (CBM-R) decision rules. J. Sch. Psychol. 51, 1–18. doi: 10.1016/j.jsp.2012.09.004
Bennett, R. E. (2011). Formative assessment: A critical review. Assess. Educ. 18, 5–25. doi: 10.1080/0969594X.2010.513678
Blumenthal, S., Blumenthal, Y., Lembke, E. S., Powell, S. R., Schultze-Petzold, P., and Thomas, E. R. (2021). Educator perspectives on data-based decision making in Germany and the United States. J. Learn. Disabil. 54, 284–299. doi: 10.1177/0022219420986120
Boy, B., Bucher, H.-J., and Christ, K. (2020). Audiovisual science communication on TV and YouTube: How recipients understand and evaluate science videos. Front. Commun. 5:608620. doi: 10.3389/fcomm.2020.608620
Carlson, D., Borman, G. D., and Robinson, M. (2011). A multistate district-level cluster randomized trial of the impact of data-driven reform on reading and mathematics achievement. Educ. Eval. Policy Anal. 33, 378–398. doi: 10.3102/0162373711412765
Cohen, J. (1988). Statistical power analysis for the behavioral sciences, 2nd Edn. Mahwah, NJ: Lawrence Erlbaum Associates.
Espin, C. A., Förster, N., and Mol, S. E. (2021). International perspectives on understanding and improving teachers’ data-based instruction and decision making: Introduction to the special series. J. Learn. Disabil. 54, 239–242. doi: 10.1177/00222194211017531
Espin, C. A., Wayman, M. M., Deno, S. L., McMaster, K. L., and de Rooij, M. (2017). Data-based decision-making: Developing a method for capturing teachers’ understanding of CBM graphs. Learn. Disabil. Res. Pract. 32, 8–21. doi: 10.1111/ldrp.12123
Fien, H., Chard, D. J., and Baker, S. K. (2021). Can the evidence revolution and multi-tiered systems of support improve education equity and reading achievement? Read. Res. Q. 56, S105–S118. doi: 10.1002/rrq.391
Fleiss, J. L. (1971). Measuring nominal scale agreement among many raters. Psychol. Bull. 76, 378–382. doi: 10.1037/h0031619
Fuchs, L. S. (2017). Curriculum-based measurement as the emerging alternative: Three decades later. Learn. Disabil. Res. Pract. 32, 5–7. doi: 10.1111/ldrp.12127
Fuchs, L. S., and Fuchs, D. (2001). What is scientifically-based research on progress monitoring?. Washington, DC: National Center on Student Progress Monitoring.
Fuchs, L. S., and Fuchs, D. (2011). Using CBM for progress monitoring in reading. Washington, DC: U.S. Office of Special Education Programs.
Gesel, S. A., LeJeune, L. M., Chow, J. C., Sinclair, A. C., and Lemons, C. J. (2021). A meta-analysis of the impact of professional development on teachers’ knowledge, skill, and self-efficacy in data-based decision-making. J. Learn. Disabil. 54, 269–283. doi: 10.1177/0022219420970196
Glazer, N. (2011). Challenges with graph interpretation: A review of the literature. Stud. Sci. Educ. 47, 183–210. doi: 10.1080/03057267.2011.605307
Gleason, P., Crissey, S., Chojnacki, G., Zukiedwicz, M., Silva, T., Costelloe, S., et al. (2019). Evaluation of support for using student data to inform teachers’ instruction (NCEE 2019-4008). Jessup, MD: National Center for Education Evaluation and Regional Assistance.
Good, R., and Jefferson, G. (1998). “Contemporary perspectives on curriculum-based measurement validity,” in The Guilford school practitioner series. Advanced applications of curriculum-based measurement, ed. M. R. Shinn (New York, NY: Guilford Press), 61–88.
Hosp, M. K., Hosp, J. L., and Howell, K. W. (2007). The ABC’s of CBM: A practical guide to curriculum-based measurement, 1st Edn. New York, NY: The Guilford Press.
Jungjohann, J., DeVries, J. M., Gebhardt, M., and Mühling, A. (2018a). “Levumi: A web-based curriculum-based measurement to monitor learning progress in inclusive classrooms,” in Computers helping people with special needs. ICCHP 2018. Lecture notes in computer science, eds K. Miesenberger and G. Kouroupetroglou (Cham: Springer International Publishing), 369–378. doi: 10.1007/978-3-319-94277-3_58
Jungjohann, J., DeVries, J. M., Mühling, A., and Gebhardt, M. (2018b). Using theory-based test construction to develop a new curriculum-based measurement for sentence reading comprehension. Front. Educ. 3:115. doi: 10.3389/feduc.2018.00115
Jungjohann, J., Diehl, K., Mühling, A., and Gebhardt, M. (2018c). Graphen der lernverlaufsdiagnostik interpretieren und anwenden – leseförderung mit der onlineverlaufsmessung levumi [Interpret and apply graphs of learning progression monitoring - Reading support with online progress monitoring Levumi]. Forsch. Spr. 6, 84–91. doi: 10.17877/DE290R-19806
Keuning, T., van Geel, M., and Visscher, A. (2017). Why a data-based decision-making intervention works in some schools and not in others. Learn. Disabil. Res. Pract. 32, 32–45. doi: 10.1111/ldrp.12124
Klapproth, F. (2018). Biased predictions of students’ future achievement: An experimental study on pre-service teachers’ interpretation of curriculum-based measurement graphs. Stud. Educ. Eval. 59, 67–75. doi: 10.1016/j.stueduc.2018.03.004
Kubinger, K. D. (2005). Psychological test calibration using the rasch model - some critical suggestions on traditional approaches. Int. J. Test. 5, 377–394. doi: 10.1207/s15327574ijt0504_3
Lane, K. L., Oakes, W. P., Ennis, R. P., and Hirsch, S. E. (2014). Identifying students for secondary and tertiary prevention efforts: How do we determine which students have tier 2 and tier 3 needs? Prev. Sch. Fail. 58, 171–182. doi: 10.1080/1045988X.2014.895573
Mandinach, E. B., and Gummer, E. S. (2016). What does it mean for teachers to be data literate: Laying out the skills, knowledge, and dispositions. Teach. Teach. Educ. 60, 366–376. doi: 10.1016/j.tate.2016.07.011
Mayring, P. (2014). Qualitative content analysis: Theoretical foundation, basic procedures and software solution. Available Online at: https://www.ssoar.info/ssoar/handle/document/39517 (accessed May 30, 2022).
McMaster, K. L., Lembke, E. S., Shin, J., Poch, A. L., Smith, R. A., Jung, P.-G., et al. (2020). Supporting teachers’ use of data-based instruction to improve students’ early writing skills. J. Educ. Psychol. 112, 1–21. doi: 10.1037/edu0000358
Mohr, D. C., Spring, B., Freedland, K. E., Beckner, V., Arean, P., Hollon, S. D., et al. (2009). The selection and design of control conditions for randomized controlled trials of psychological interventions. Psychother. Psychosom. 78, 275–284. doi: 10.1159/000228248
Newell, K. W., and Christ, T. J. (2017). Novice interpretations of progress monitoring graphs: Extreme values and graphical aids. Assess. Eff. Interv. 42, 224–236. doi: 10.1177/1534508417694855
Okan, Y., Garcia-Retamero, R., Cokely, E. T., and Maldonado, A. (2012). Individual differences in graph literacy: Overcoming denominator neglect in risk comprehension. J. Behav. Decis. Mak. 25, 390–401. doi: 10.1002/bdm.751
Oslund, E. L., Elleman, A. M., and Wallace, K. (2021). Factors related to data-based decision-making: Examining experience, professional development, and the mediating effect of confidence on teacher graph literacy. J. Learn. Disabil. 54, 243–255. doi: 10.1177/0022219420972187
Parker, R. I., Vannest, K. J., and Davis, J. L. (2014). A simple method to control positive baseline trend within data nonoverlap. J. Spec. Educ. 48, 79–91. doi: 10.1177/0022466912456430
Prince, A. M. T., Yell, M. L., and Katsiyannis, A. (2018). Endrew F. v. Douglas county school district (2017): The U.S. Supreme court and special education. Interv. Sch. Clin. 53, 321–324. doi: 10.1177/1053451217736867
Scheer, D. (2021). Toolbox diagnostics: Aids for (special) education practice [toolbox diagnostik: Hilfen für die (sonder-)pädagogische praxis], 1st Edn. Stuttgart: Kohlhammer Verlag.
Schurig, M., Jungjohann, J., and Gebhardt, M. (2021). Minimization of a short computer-based test in reading. Front. Educ. 6:684595. doi: 10.3389/feduc.2021.684595
Stecker, P. M., Lembke, E. S., and Foegen, A. (2008). Using progress-monitoring data to improve instructional decision making. Prev. Sch. Fail. 52, 48–58. doi: 10.3200/PSFL.52.2.48-58
Tukey, J. W. (1977). Exploratory data analysis. Addison-Wesley series in behavioral science quantitative methods. Boston, MA: Addison-Wesley.
van den Bosch, R. M., Espin, C. A., Pat-El, R. J., and Saab, N. (2019). Improving teachers’ comprehension of curriculum-based measurement progress-monitoring graphs. J. Learn. Disabil. 52, 413–427. doi: 10.1177/0022219419856013
Vanlommel, K., and Schildkamp, K. (2019). How do teachers make sense of data in the context of high-stakes decision making? Am. Educ. Res. J. 56, 792–821. doi: 10.3102/0002831218803891
Vannest, K. J., Davis, J. L., and Parker, R. I. (2013). Single case research in schools: Practical guidelines for school-based professionals. Abingdon: Routledge.
Wagner, D. L., Hammerschmidt-Snidarich, S. M., Espin, C. A., Seifert, K., and McMaster, K. L. (2017). Pre-service teachers’ interpretation of CBM progress monitoring data. Learn. Disabil. Res. Pract. 32, 22–31. doi: 10.1111/ldrp.12125
Keywords: data-based decision-making (DBDM), formative assessment, graph literacy, instructional effectiveness, progress monitoring, teacher education, video-based intervention
Citation: Jungjohann J, Gebhardt M and Scheer D (2022) Understanding and improving teachers’ graph literacy for data-based decision-making via video intervention. Front. Educ. 7:919152. doi: 10.3389/feduc.2022.919152
Received: 13 April 2022; Accepted: 09 August 2022;
Published: 07 September 2022.
Edited by:
Farah El Zein, Emirates College for Advanced Education, United Arab EmiratesCopyright © 2022 Jungjohann, Gebhardt and Scheer. This is an open-access article distributed under the terms of the Creative Commons Attribution License (CC BY). The use, distribution or reproduction in other forums is permitted, provided the original author(s) and the copyright owner(s) are credited and that the original publication in this journal is cited, in accordance with accepted academic practice. No use, distribution or reproduction is permitted which does not comply with these terms.
*Correspondence: David Scheer, ZGF2aWQuc2NoZWVyQHBoLWx1ZHdpZ3NidXJnLmRl