 Belén Gutiérrez-de-Rozas
 Esther López-Martín
 Elvira Carpintero Molina
- 1Department of Methods of Research and Diagnosis in Education II, Universidad Nacional de Educación a Distancia (UNED), Madrid, Spain
- 2Department of Research and Psychology in Education, Universidad Complutense de Madrid, Madrid, Spain
The explanation of underachievement and the search for its associated factors have been of constant interest in educational research. In this regard, the number of variables that have been involved in its description and explanation has increased over the years, as has the number of studies at an international level on this topic. Although much research has focused on identifying the personal, family, and school aspects that exert the greatest influence on students’ low academic performance, the literature shows the need to study the differential effects of said variables according to the countries in which the studies are conducted. The objective of this article is therefore to analyse cross-national differences in the effect of personal, family, and school characteristics on students’ academic underachievement based on data derived from the Programme for International Student Assessment (PISA) 2018. Furthermore, it aims to identify the profile that characterises students with the lowest academic performance and to estimate the importance of the selected variables in explaining low achievement across countries. To reach these goals, the multivariate technique of decision trees through the binary CART (Classification and Regression Trees) algorithm was used, allowing the estimation of both a global model and nine specific models for each of the selected countries. The results show that, despite slight differences between the countries analysed, the variables that define the general profile of students with the lowest achievement and which have shown the strongest predictive capacity for low performance are mainly linked to the students themselves. These variables are followed in importance by family aspects, which present great differences between the territories that compose the sample. Finally, teacher and school variables have shown to have a low explanatory capacity in this study. It can therefore be concluded that, although personal characteristics continue to be those that best explain academic performance, a series of contextual variables, especially related to families, appear to influence academic achievement differentially and may even hide or cancel out certain personal characteristics.
Introduction
A reduction in low academic achievement, related to the non-attainment of learning goals for a student’s level, age, or ability (Lamas, 2015), is one of the main objectives of current education systems. However, there is a clear lack of agreement when it comes to establishing the most appropriate standards or criteria for its definition (Gorard and Smith, 2003).
These standards may refer to the students’ performance, to the performance of the group they belong to, or even to previously established external criteria (Gutiérrez-de-Rozas and López-Martín, 2020). For this reason, in a particular situation of low performance, a student can present insufficient attainment—by not achieving the educational objectives established for all the students—or an unsatisfactory performance—by performing below what could be expected based on his or her abilities (Jiménez Fernández, 2010). Hence, a situation of low academic performance may or may not exist depending on the standard used.
The International Association for the Evaluation of Educational Achievement (IEA) and the Organisation for Economic Co-operation and Development (OECD) apply standards based on external criteria in their assessments—that is, Trends in International Mathematics and Science Study (TIMSS) and Progress in International Reading Literacy Study (PIRLS) by IEA, or the Programme for International Student Assessment (PISA) by OECD. In these assessments, students are considered to be low-performing students if they are placed at the Low International Benchmark (Mullis et al., 2020) in TIMSS and PIRLS, or below Level 2 in PISA (Organisation for Economic Co-operation and Development [OECD], 2019a). Despite the utility of these standards for making international comparisons in the level of academic achievement between different countries, they do not capture the variability existing within countries. In this regard, results from the PISA 2018 assessment showed that around 71.8% of students in the Philippines were low-performing students in the three areas considered, while only 1.1% of the students were low-performing students in Beijing, Shanghai, Jiangsu, and Zhejiang (Organisation for Economic Co-operation and Development [OECD], 2019b). These unequal results may hide, among other things, different socio-cultural realities. Thus, being placed at one level or another has different implications in each territory.
Regardless of the contextualisation of student underachievement and the way of evidencing it, there is no doubt that knowing the aspects that facilitate or hinder academic performance is key to providing an adequate response to the educational needs of students. For this reason, numerous empirical studies have focused on identifying and analysing the predictive capacity of the conditioning factors of academic performance (Kornilova et al., 2009).
Within these factors, and despite the interrelationship among the variables that influence learning (Bhowmik, 2019; Akbas-Yesilyurt et al., 2020), since the past century, academic literature has been highlighting the strong influence of students’ personal characteristics, together with other contextual aspects, on their educational outcomes. As proof of this, in the review conducted by Sipe and Curlette (1997), student characteristics had the largest effect sizes on academic achievement, followed by school variables and, finally, family aspects. Subsequently, Hattie (2003) showed that, when the interactions between variables were ignored, student characteristics predicted 50% of performance, while teacher characteristics explained 30%. The author attributed much smaller influences to school, peers, school leaders, and family characteristics (between 5 and 10%). In line with these results, the most recent meta-analytic evidence shows the effects of some specific personal aspects, such as the use of self-regulated learning strategies (Ergen and Kanadli, 2017), intelligence (Zaboski et al., 2018), or some personality types (Poropat, 2009), on academic performance. Therefore, there is ample scientific evidence, generated since the last century, for the differential influence of personal, family, and school variables on students’ academic performance.
In this sense, Hattie’s (2009, 2017) work should be highlighted as one of the most important international review studies in the field, since this author identified the influence of personal, family, and school variables on student academic performance by compiling the existing meta-analytical evidence. His research is of particular interest due to the vast amount of evidence that it summarises and also for its systematicity, as the author classifies these conditioning factors of academic performance into 22 categories and 66 subcategories. The results of his research show that previous high academic performance and self-efficacy are the personal variables that most positively influence academic achievement. On the contrary, some personal factors, such as boredom, depression, minority language use, superficial motivation, sleep problems, attention deficit hyperactivity disorder, or hearing difficulties showed the strongest negative effects. Among the family variables, the author demonstrated the positive influence of a favourable home environment and high socio-economic status and highlighted the negative effects of corporal punishment, excessive television viewing, or being a beneficiary of welfare policies. Finally, among school and teacher variables, this author found that teacher efficacy had the strongest positive influence, while student suspension, excessively long summer holidays, or changes of school by students were the aspects with the most negative influence on academic performance.
However, despite these general findings, the literature warns the differential effects of conditioning factors on academic performance depending on the countries in which the studies are conducted. For example, the study by Ghasemi and Burley (2019) revealed the existence of differences in the predictive capacity of gender in mathematics in the countries analysed. Also, Ning et al. (2015), using PISA 2009 data, showed that the influence of school disciplinary climate on students’ academic performance presented cross-national differences. This is to be expected given that each territory has its own socio-economic, cultural, political, and educational characteristics; that the aspects that condition academic achievement are interrelated (Bhowmik, 2019; Akbas-Yesilyurt et al., 2020); and that, in accordance with the ecological systems theory, inhabitants are influenced by the countries they live in (Hampden-Thompson et al., 2013). It can, therefore, be deduced that any macro-level differential aspects between countries may affect the characteristics of the students, the education given by families, and the education provided in schools.
Programme for International Student Assessment: Assessment of competences and associated factors
The Programme for International Student Assessment (PISA), aims to evaluate the extent to which students in the participating countries have acquired the knowledge and skills that are required to fully participate in today’s societies by the end of compulsory education (Organisation for Economic Co-operation and Development [OECD], 2019c).
This assessment analyses students’ proficiency in science, mathematics, and reading—the 2018 edition also includes global competence—through a series of tests that provide an updated and comparative overview of students’ academic performance at the age of 15 years. Said performance does not only refer to the level of knowledge acquired in the areas assessed but also to the degree of skills and competence development in these domains. In each PISA edition, the OECD focuses its analysis and conclusions on one of the skills assessed, thus establishing it as the main domain. In the 2018 edition, as was the case in 2000 and 2009, the focus was placed on reading literacy—understood as “students’ ability to understand, use, evaluate, reflect on and engage with text to achieve their purposes” (Organisation for Economic Co-operation and Development [OECD], 2019c, p. 15).
Through the PISA assessments, the OECD aims not only to provide countries with information on the performance of adolescents in their education systems but also to enable them to understand the results obtained by students in other participating countries and to analyse and compare educational policies (Organisation for Economic Co-operation and Development [OECD], 2019a). Therefore, context questionnaires are applied as a supplement to achievement tests to identify the characteristics of education systems, interpret the results obtained, and understand the factors that are linked to success or failure from both a national and a comparative perspective (López-Martín et al., 2018).
These questionnaires collect contextual data of students—including personal, family, and school aspects—but only a small part of the contextual information is provided by teachers and families. This aspect deserves special consideration, as students’ perceptions often explain variation in learning outcomes beyond what could be attributed to background characteristics themselves (Van Petegem et al., 2007).
Another issue that also deserves consideration is that the OECD has not only added new items to the contextual questionnaires over the successive editions of PISA but has also developed and implemented new full questionnaires, such as the ICT familiarity questionnaire, the educational career questionnaire, the financial literacy questionnaire, or the well-being questionnaire.
Regarding the topic of student well-being, defined as “the psychological, cognitive, social and physical functioning and capabilities that students need to live a happy and fulfilling life” (Organisation for Economic Co-operation and Development [OECD], 2017, p. 35), it should be mentioned that, while information on this construct was collected through certain items of the student questionnaire in previous PISA editions, the specific well-being questionnaire was applied for the first time in 2018. Thus, the importance given to this construct by the OECD is in line with the findings of current empirical evidence, which is highlighting the prominent role of adolescent well-being in both positive adolescent development and success in learning processes (Holzer et al., 2021).
Present study
For all the above, this study aims to analyse cross-national differences in the effect of personal, family, and school characteristics on students’ academic underachievement based on the data derived from the PISA 2018 assessment. Also, this article aims to identify the profile that characterises students with the lowest academic performance and to estimate the importance of the selected variables in the explanation of low performance across countries.
Therefore, this research seeks to help eliminate existing knowledge gaps relating to the differential influence of personal, family, and school variables on students’ low academic performance across countries. Thus, the present study goes beyond the conventional research approach into the conditioning factors of academic performance and, more specifically, academic underachievement, in which the particularities of each territory are usually not considered.
For this purpose, the multivariate decision tree technique, through the binary CART (Classification and Regression Trees) algorithm (Breiman et al., 1984), is used. This technique is considered to be particularly suitable for yielding insights into the research question posed because, as Razi and Athappilly (2005) state, being a non-parametric procedure that allows the prediction of a continuous dependent variable from categorical independent variables, it fits the data perfectly. Also, as the cited authors affirm, CART models provide better predictions than regression models when the predictors are binary or categorical and the dependent variable is continuous. In addition, this model allows the creation of subsets of homogeneous data for the dependent variable, and calculation of the relative importance of each of the independent variables in explaining said dependent variable. Moreover, this technique allows a more thorough study of the variables that influence low performance not only globally but also comparatively across countries. Finally, it is noteworthy that several studies have already used this technique satisfactorily to analyse PISA data (Asensio Muñoz et al., 2018; López-Martín et al., 2018; Arroyo Resino et al., 2019; She et al., 2019). For all these aspects, the multivariate decision tree technique, through the binary CART algorithm, is used here to achieve the objectives proposed in this article.
After the above introduction, the rest of this article is structured as follows: first, the method is described. Then, the profiles of students with the lowest academic performance are presented together with the standardised importance of the analysed variables in explaining low performance in the selected countries. The article concludes with a discussion of the main results.
Materials and methods
Population and sample
The study population was composed of 15-year-old students from the countries that completed all the student context questionnaires in PISA 2018. After excluding from the selection process all the territories that did not apply all context questionnaires to their students, the final selection was based on nine countries. The final sample consisted of 97,878 students from Bulgaria (5.4%), Georgia (5.7%), Hong Kong SAR (China) (6.2%), Ireland (5.7%), Mexico (7.5%), Panama (6.4%), Serbia (6.8%), Spain (36.7%), and the United Arab Emirates (19.7%). Therefore, information was available from Europe, Asia, and Latin America. The main socio-demographic, political, and economic characteristics of the selected countries are described in Appendix A.
As reflected in Table 1, the sample was weighted using the normalised weight variable SENWT—when analysing the overall information from the set of countries considered—or the student sampling weight W_FSTUWT—when analysing the data individually for each of the countries (Organisation for Economic Co-operation and Development [OECD], n.d.). In this regard, it should be clarified that the SENWT variable assigns the same value to the samples of each country to ensure an equal contribution to the analysis, while the W_FSTUWT variable adjusts the samples to the population size of each country so that each contribution depends on population size.
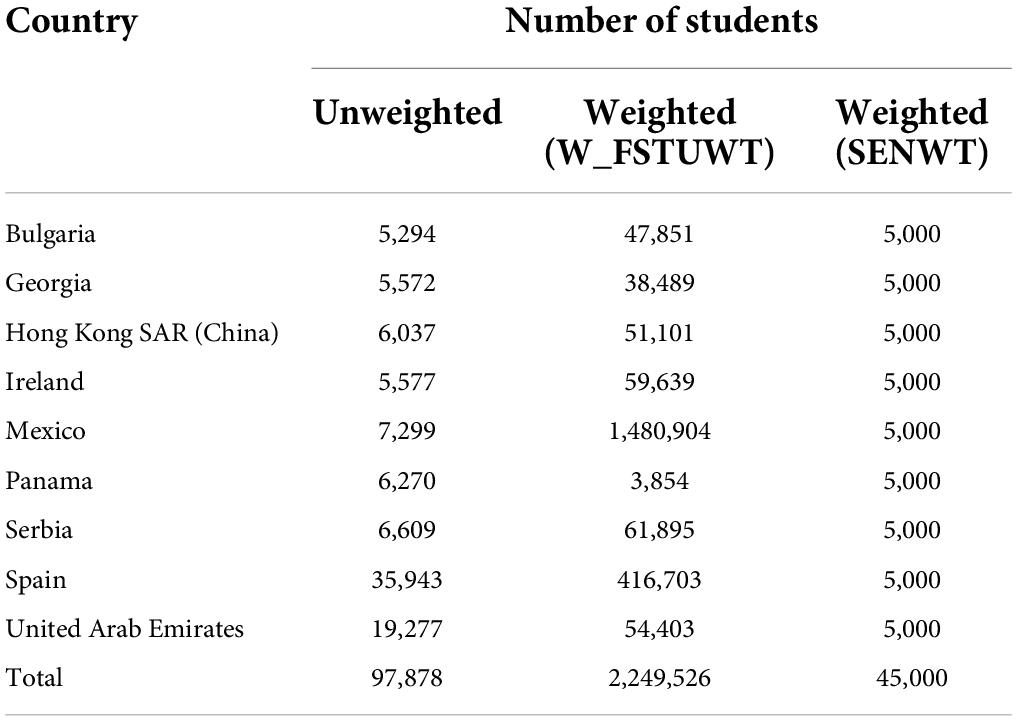
Table 1. Sample description.
Materials
Information derived from achievement tests and context questionnaires administered to students in the PISA 2018 assessment was selected. Reliability and validity evidence of the scales can be found in the PISA 2018 Technical Report,1 in which information about the sampling procedure, the questions included in each questionnaire, the sample items, and the response scale are provided.
As the dependent variable of this study, low academic performance in reading, which was the core subject in the PISA 2018 assessment, was considered. Taking into account that one of the main features of the PISA assessment design is that it reports students’ academic performance through 10 plausible values, the following procedure was followed to estimate the variable “low academic performance”:
• Calculation of average reading literacy performance for each country.
• Classification of students as having low academic achievement: YES—in cases where their performance was below the estimated average performance for their country—and NO—if their reading literacy score was equal to or above the average performance for their country. This classification was made for each of the 10 plausible values provided by PISA.
In this regard, it should be noted that establishing the average performance of each country as a reference point for calculating this variable intends to overcome the limitation of PISA performance levels by considering the internal variability of each territory.
Contextual information was obtained by selecting some of the indices estimated by the OECD from students’ responses to the student and well-being questionnaires. For this selection, Hattie’s’s (2009) work was taken as a reference, as it proposes a classification of personal, family, and school aspects whose influence on performance has been analysed and demonstrated in the meta-analytical literature (Table 2).
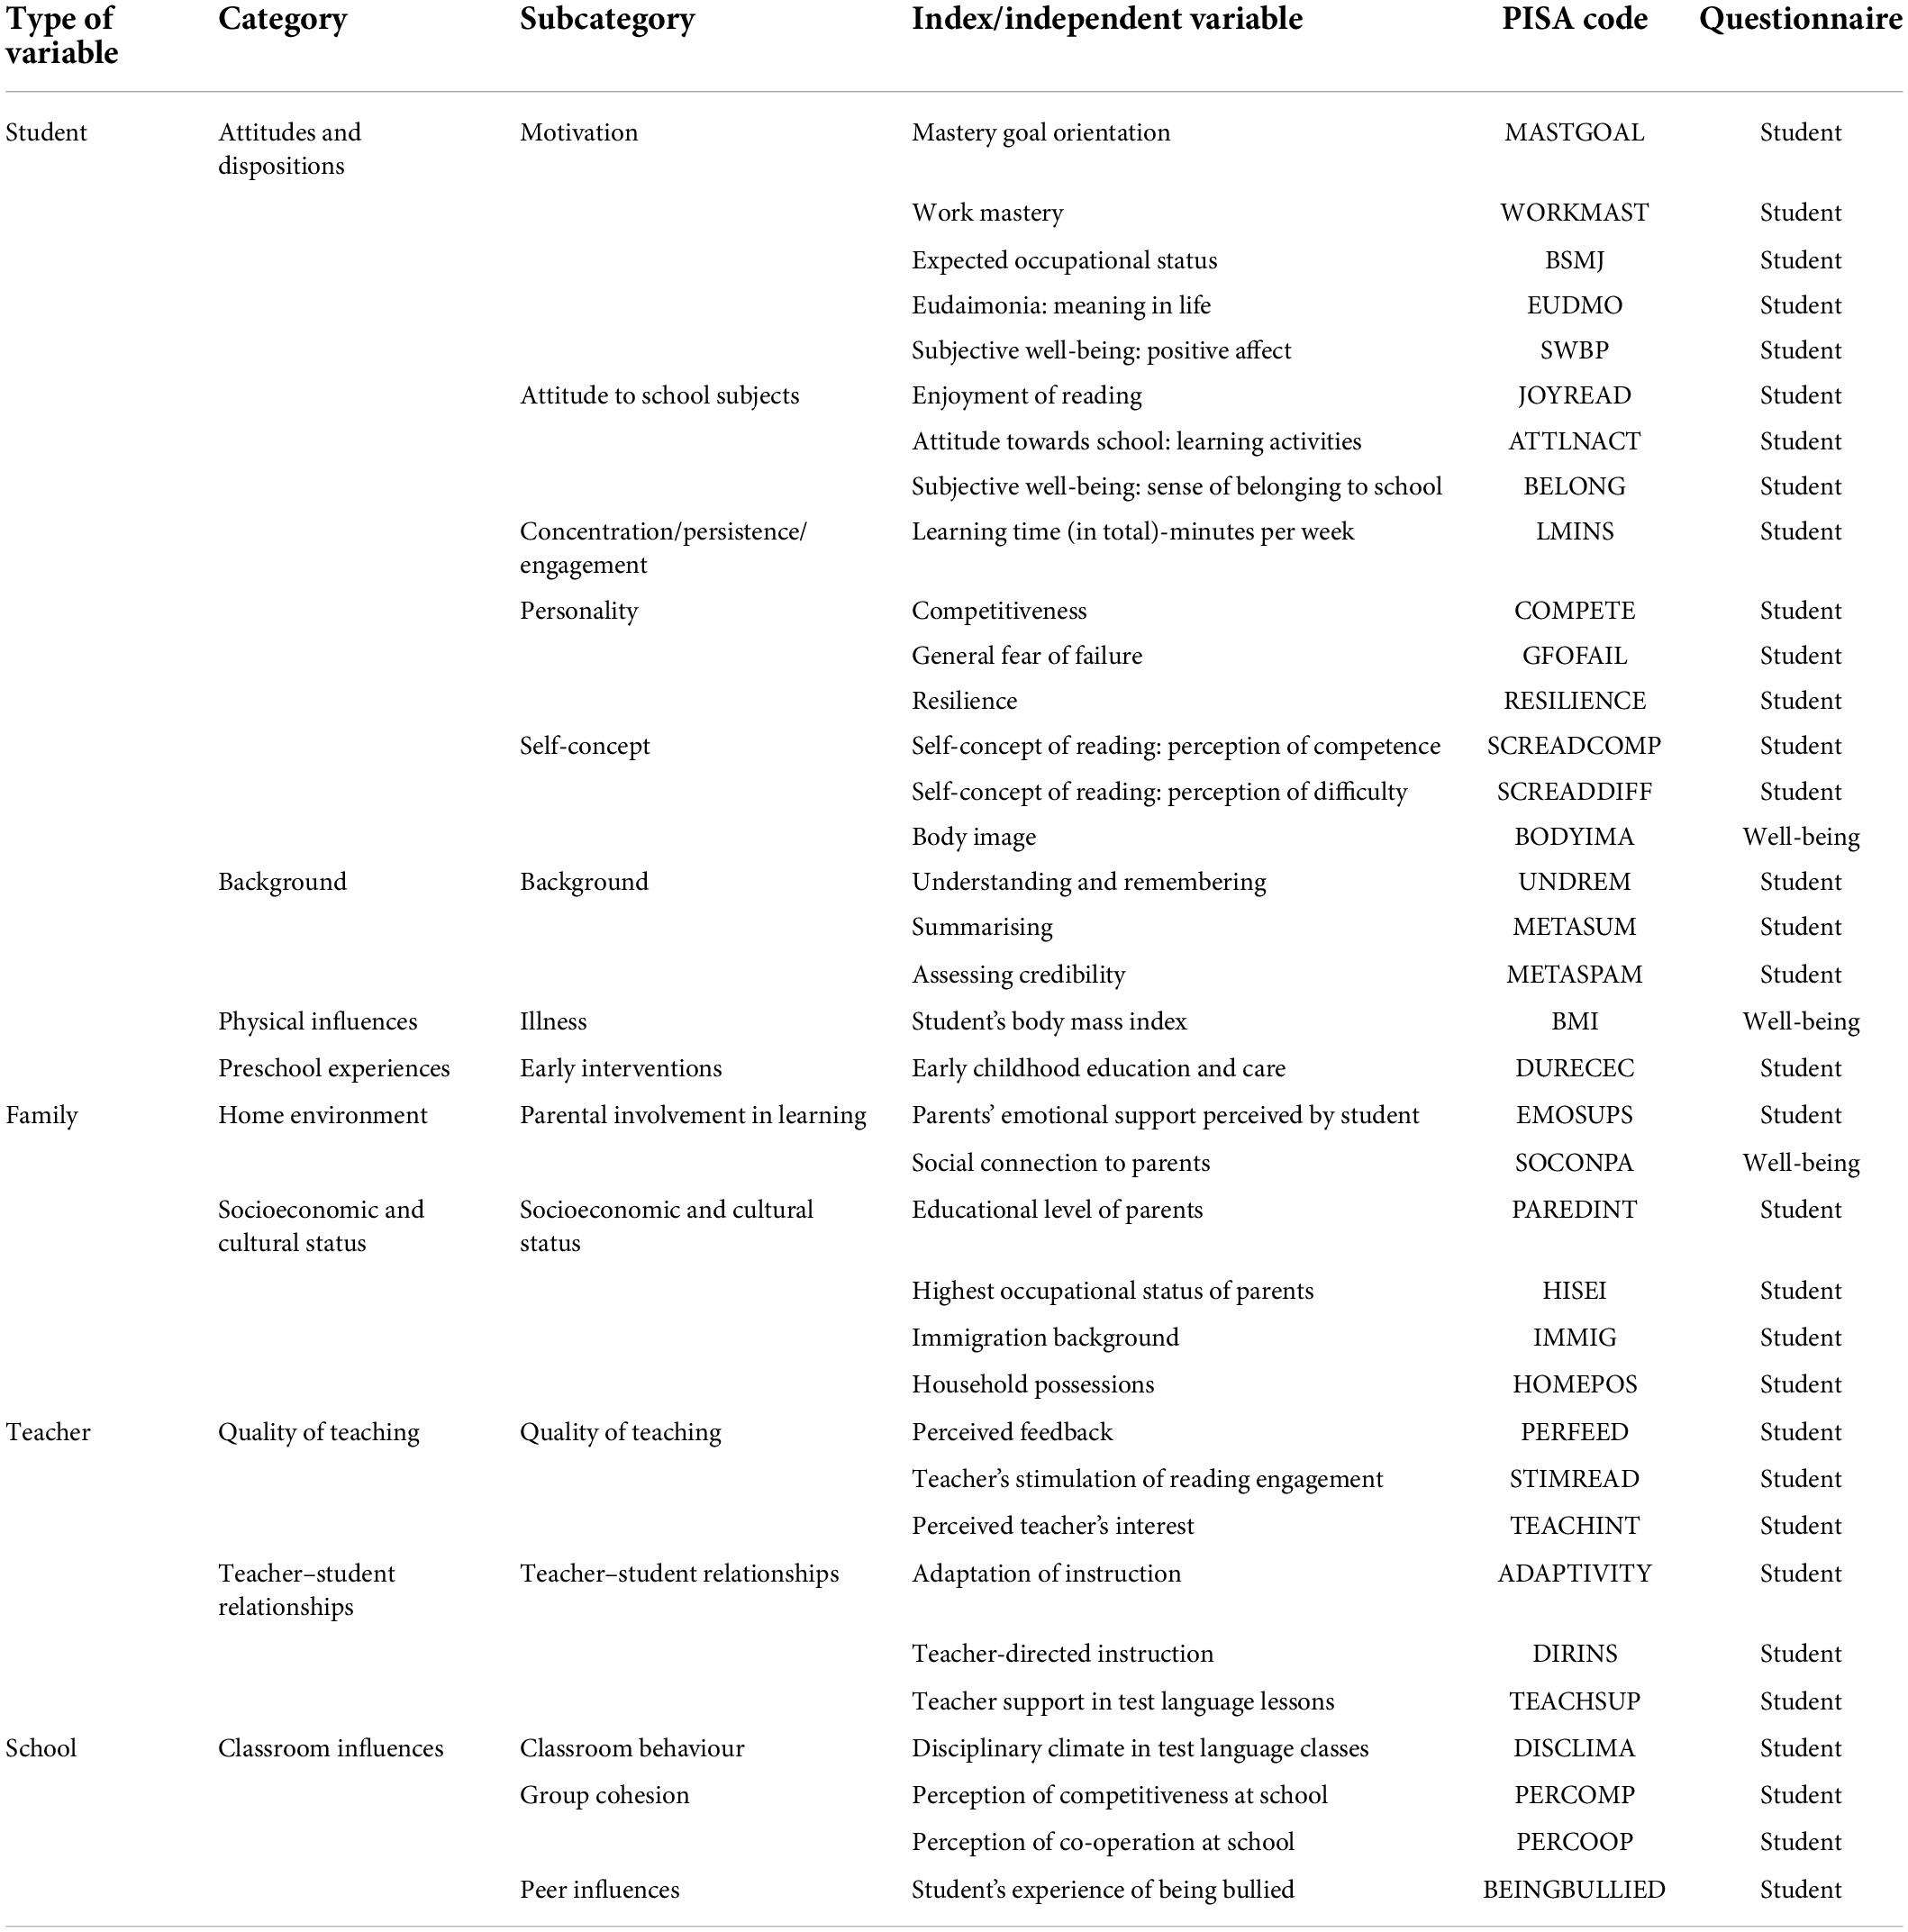
The response rate for all variables was above 70%—except for Learning time (in total)-minutes per week, which had a response rate of 55%.
Procedure
The multivariate technique of decision trees through the binary CART algorithm (Breiman et al., 1984) was used. As mentioned previously, this technique allows the creation of subsets of data that are as homogeneous as possible with respect to the dependent variable, as well as the calculation of the relative importance of each independent variable in explaining the dependent variable.
To identify the personal, family, and school factors that explain low academic performance, first, 10 global models were estimated for the set of countries in the study sample. Second, the average importance of the predictors obtained in the 10 models was calculated. Finally, the relative importance of each independent variable with respect to the predictor that emerged as most relevant in explaining academic performance was calculated. In other words, the standardised importance reflects the impact of each of the independent variables in the model, so that it is possible to observe which are the most important (de Oña et al., 2012). Thus, the relative importance of the most relevant variable would be 100%, while the rest of the variables would be attributed importance proportional to that of 100%. This same procedure was performed with each of the subsamples corresponding to the different countries.
As shown in Table 1, the data were weighted using the SENWT variable in the estimation of the global model to ensure that the contributions of each of the countries were equal, regardless of their sample size. In the models estimated for each of the countries, the values were weighted by the final student weight (W_FSTUWT).
Together with the standardised importance of each of the independent variables, we present the variables that compose the profiles of students with the lowest reading performance in the global model and in each of the nine selected countries.
SPSS Statistics version 27 was used to conduct the analyses.
Results
The results of the global model—relative to the set of countries that comprise the sample—and of the specific models—for each of the nine countries—are presented below. As can be seen in Table 3, the overall average classification rate of the estimated models, which reveals the models’ ability to correctly classify the variables through a percentage, is situated between 68.70% (average for the 10 general models) and 77.26% (average for the 10 Irish models).
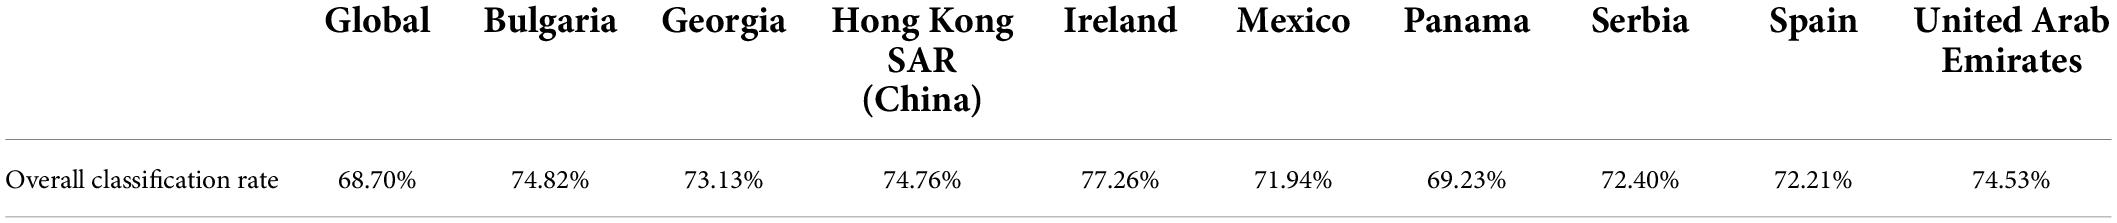
Table 3. Overall average classification rate of the models estimated from the 10 plausible values.
Based on these decision trees—calculated for the whole sample and for each of the countries—the general most extreme profile of students with the lowest academic achievement in reading literacy is presented, along with the specific models that reflect cross-national differences in the effect of personal, family, and school characteristics on low performance.
Profile of students with the lowest reading achievement
This section shows the general most extreme profile of students with low academic achievement in reading using the decision tree estimated for the whole sample. In this estimation, a depth of six levels was established. However, since this article seeks to analyse the variables that best describe the profile of students with the lowest achievement in reading, only the variables that appear in the first three positions of the branch in which said profile is represented are displayed below (Table 4).
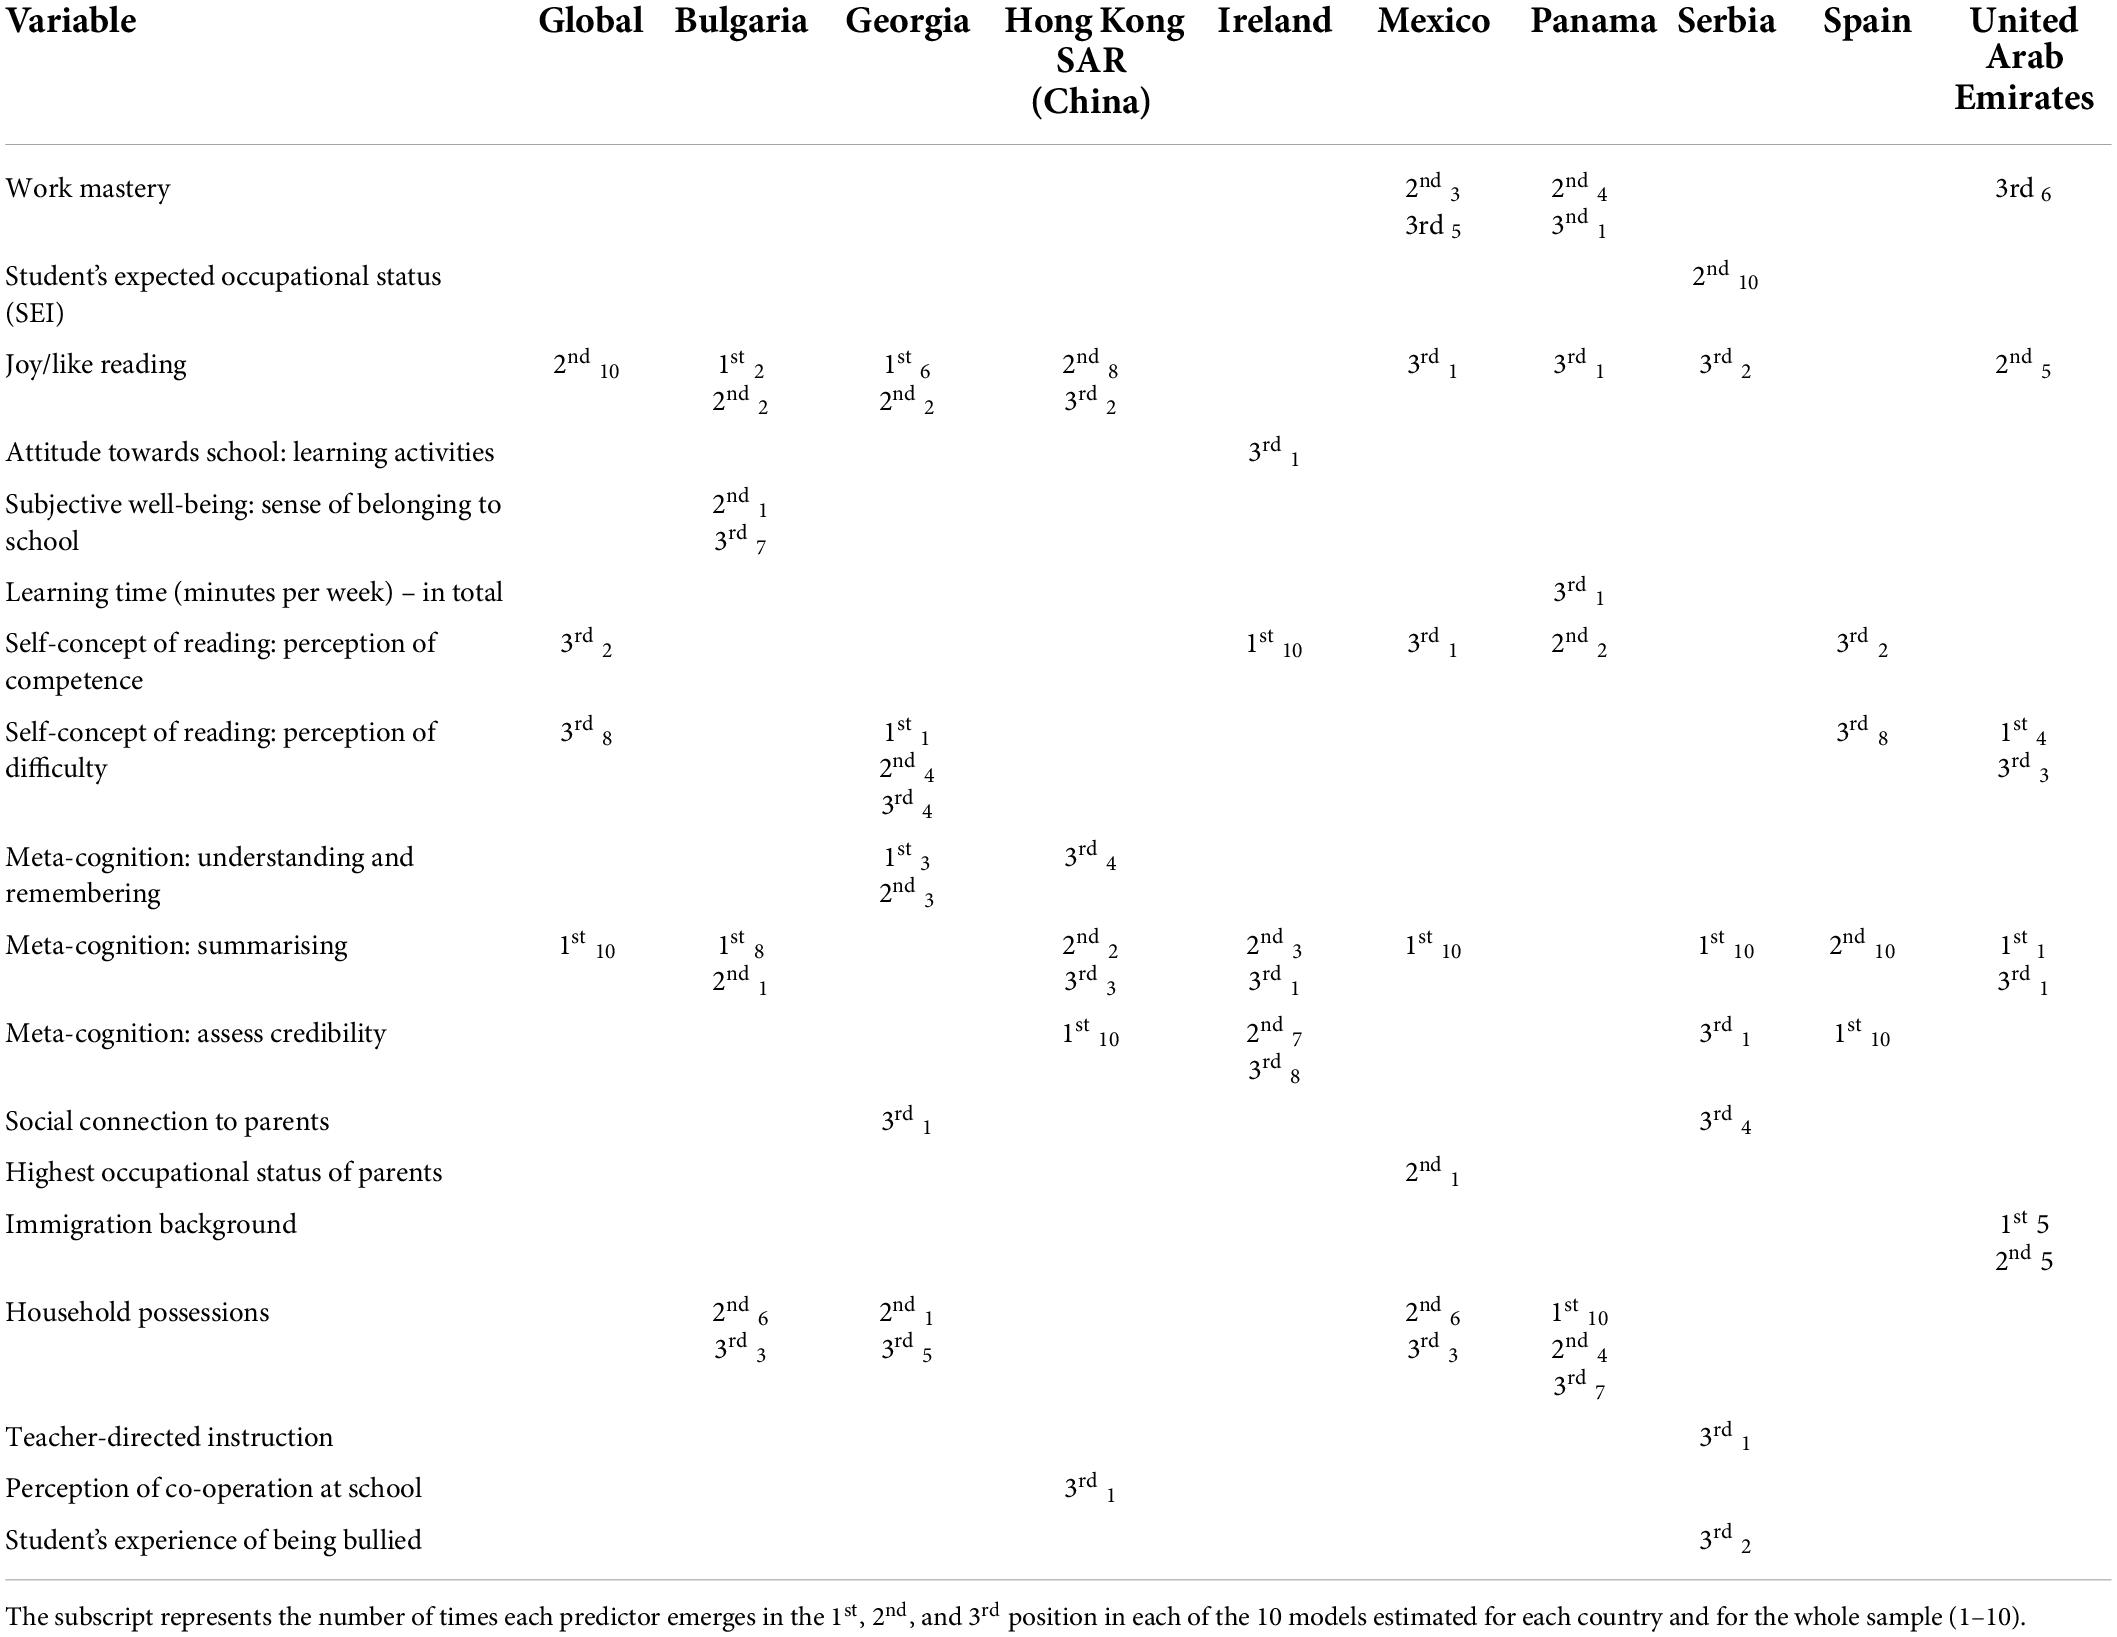
Table 4. Variables that best describe the profile of students with the lowest academic achievement in reading literacy.
The student profile with the lowest achievement in reading is best defined by the three variables that emerged ordered by their discriminatory capacity, which decreases on descending the nodes of the tree. Thus, the variable Meta-cognition: summarising appears in first place with regard to segmentation of the sample, as it has the greatest discriminatory capacity when characterising students with the lowest performance in the 10 global models. The second variable that allows charactirisation of students with the lowest achievement is Joy/like reading, meaning that a lack of enjoyment of this activity may be another key aspect in low performance. After that, Self-concept of reading: perception of difficulty and Self-concept of reading: perception of competence emerge (eight times and twice, respectively) in the third position, indicating that students with very low reading achievement would also consider reading as a difficult task and would regard themselves as not sufficiently prepared to complete it satisfactorily.
Table 4 also shows the aspects that characterise students with the lowest achievement across countries. As can be seen, personal variables linked to meta-cognition, joy/like reading, and cognitive self-concept present a notable discriminatory capacity in the profile of students with the lowest academic achievement in most of the countries considered, which is in line with the results of the general model. In this sense, it is worth noting that Panama is the only country in which no metacognitive variable appears in the profile.
Work mastery is also a prevalent variable in relation to the personal dimension, being found in the models of three of the countries (Mexico, Panama, and the United Arab Emirates). In addition, Subjective well-being: sense of belonging to school appears as a defining variable in Bulgaria and Student’s expected occupational status does in Serbia. Finally, Attitude towards school: learning activities is found in Ireland and Learning time (minutes per week)-in total in Panama; nevertheless, each of these only appears in one of the 10 estimated models.
Home possessions emerge as a family variable with a high discriminatory capacity in Bulgaria, Georgia, Mexico, and Panama. However, it is not present in Hong Kong SAR (China), Ireland, Spain, or in the United Arab Emirates. Also, Immigration background is found in the profile of students with very low academic performance in the United Arab Emirates. Finally, Social connection to parents and Highest occupational status of parents show some presence in Georgia and Serbia and in Mexico, respectively.
School and teacher variables are poorly represented among those aspects characterising students with the lowest academic achievement, except for Teacher-directed instruction and Student’s experience of being bullied in Serbia and Perception of cooperation in Georgia, all of which show a minor presence among the first three positions of the models.
Beyond these results, it is necessary to consider that there are differences in the average level in the achievement of the selected countries. Table 5 shows the mean achievement for each country and the data on student underachievement. These data were used to estimate the models that describe the profile of students with very low academic performance in each country. Hence, the percentage of students with a low performance can be observed to be below 50% in Hong Kong SAR (China), Ireland, Serbia, and Spain, but above 50% in the remaining countries.
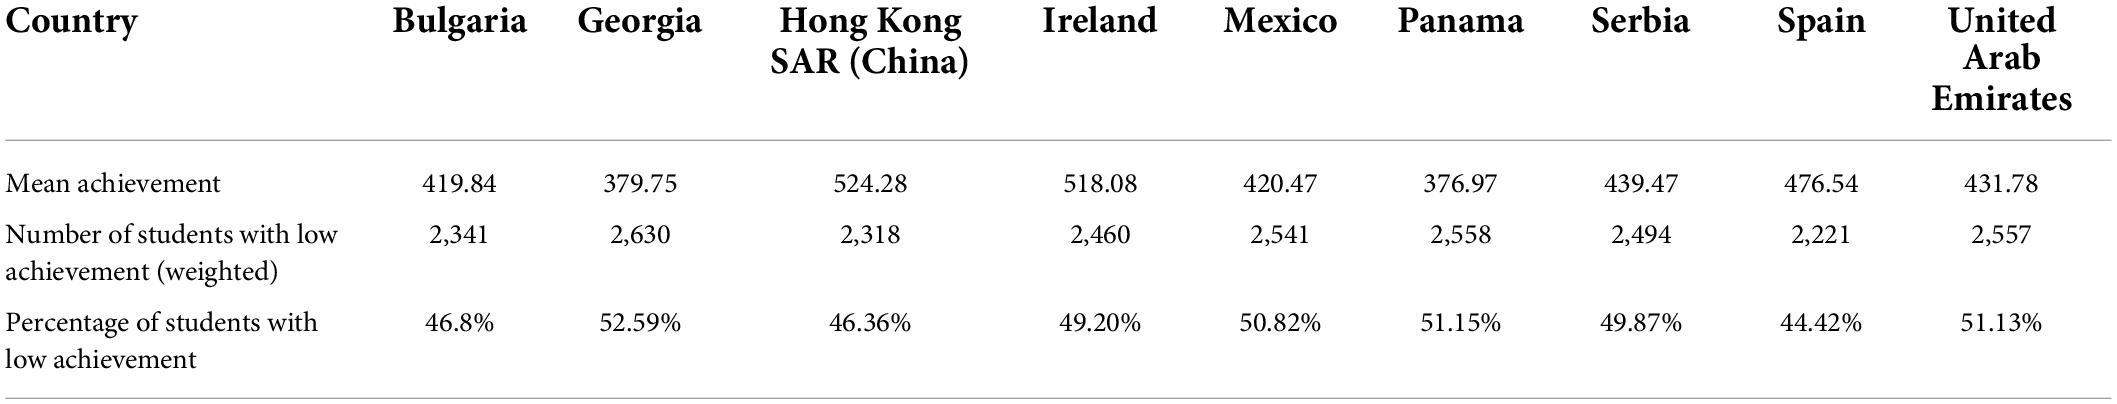
Table 5. Mean performance in reading for each country and number of students with low achievement.
Variables with the highest explanatory capacity for low reading achievement
To analyse the cross-national differences in the personal, family, and school characteristics of students that most contribute to explaining low academic achievement in reading, this section presents the standardised importance that these predictors have in both the overall model and each of the models estimated for the nine countries.
In this vein, it should be clarified that the models have been estimated by considering all the indices together. However, the results are presented in three sections based on each of the three ambits considered—personal, family, or school—for easier reading. It is also noteworthy that the standardised importance corresponding to each of the independent variables is established according to the variable that best contributes to explaining the dependent variable, to which a value of 100% is attributed.
Student variables
The results presented in Table 6 show that the variable Joy/like reading has the greatest explanatory capacity for low performance in the global model. Although the importance of this ability differs among the countries considered, it can be found among the top five positions in all the territories except for the United Arab Emirates, Mexico, and Panama. The rest of the variables that constitute the subcategory Attitude to school subjects present low standardised importance in the overall model.
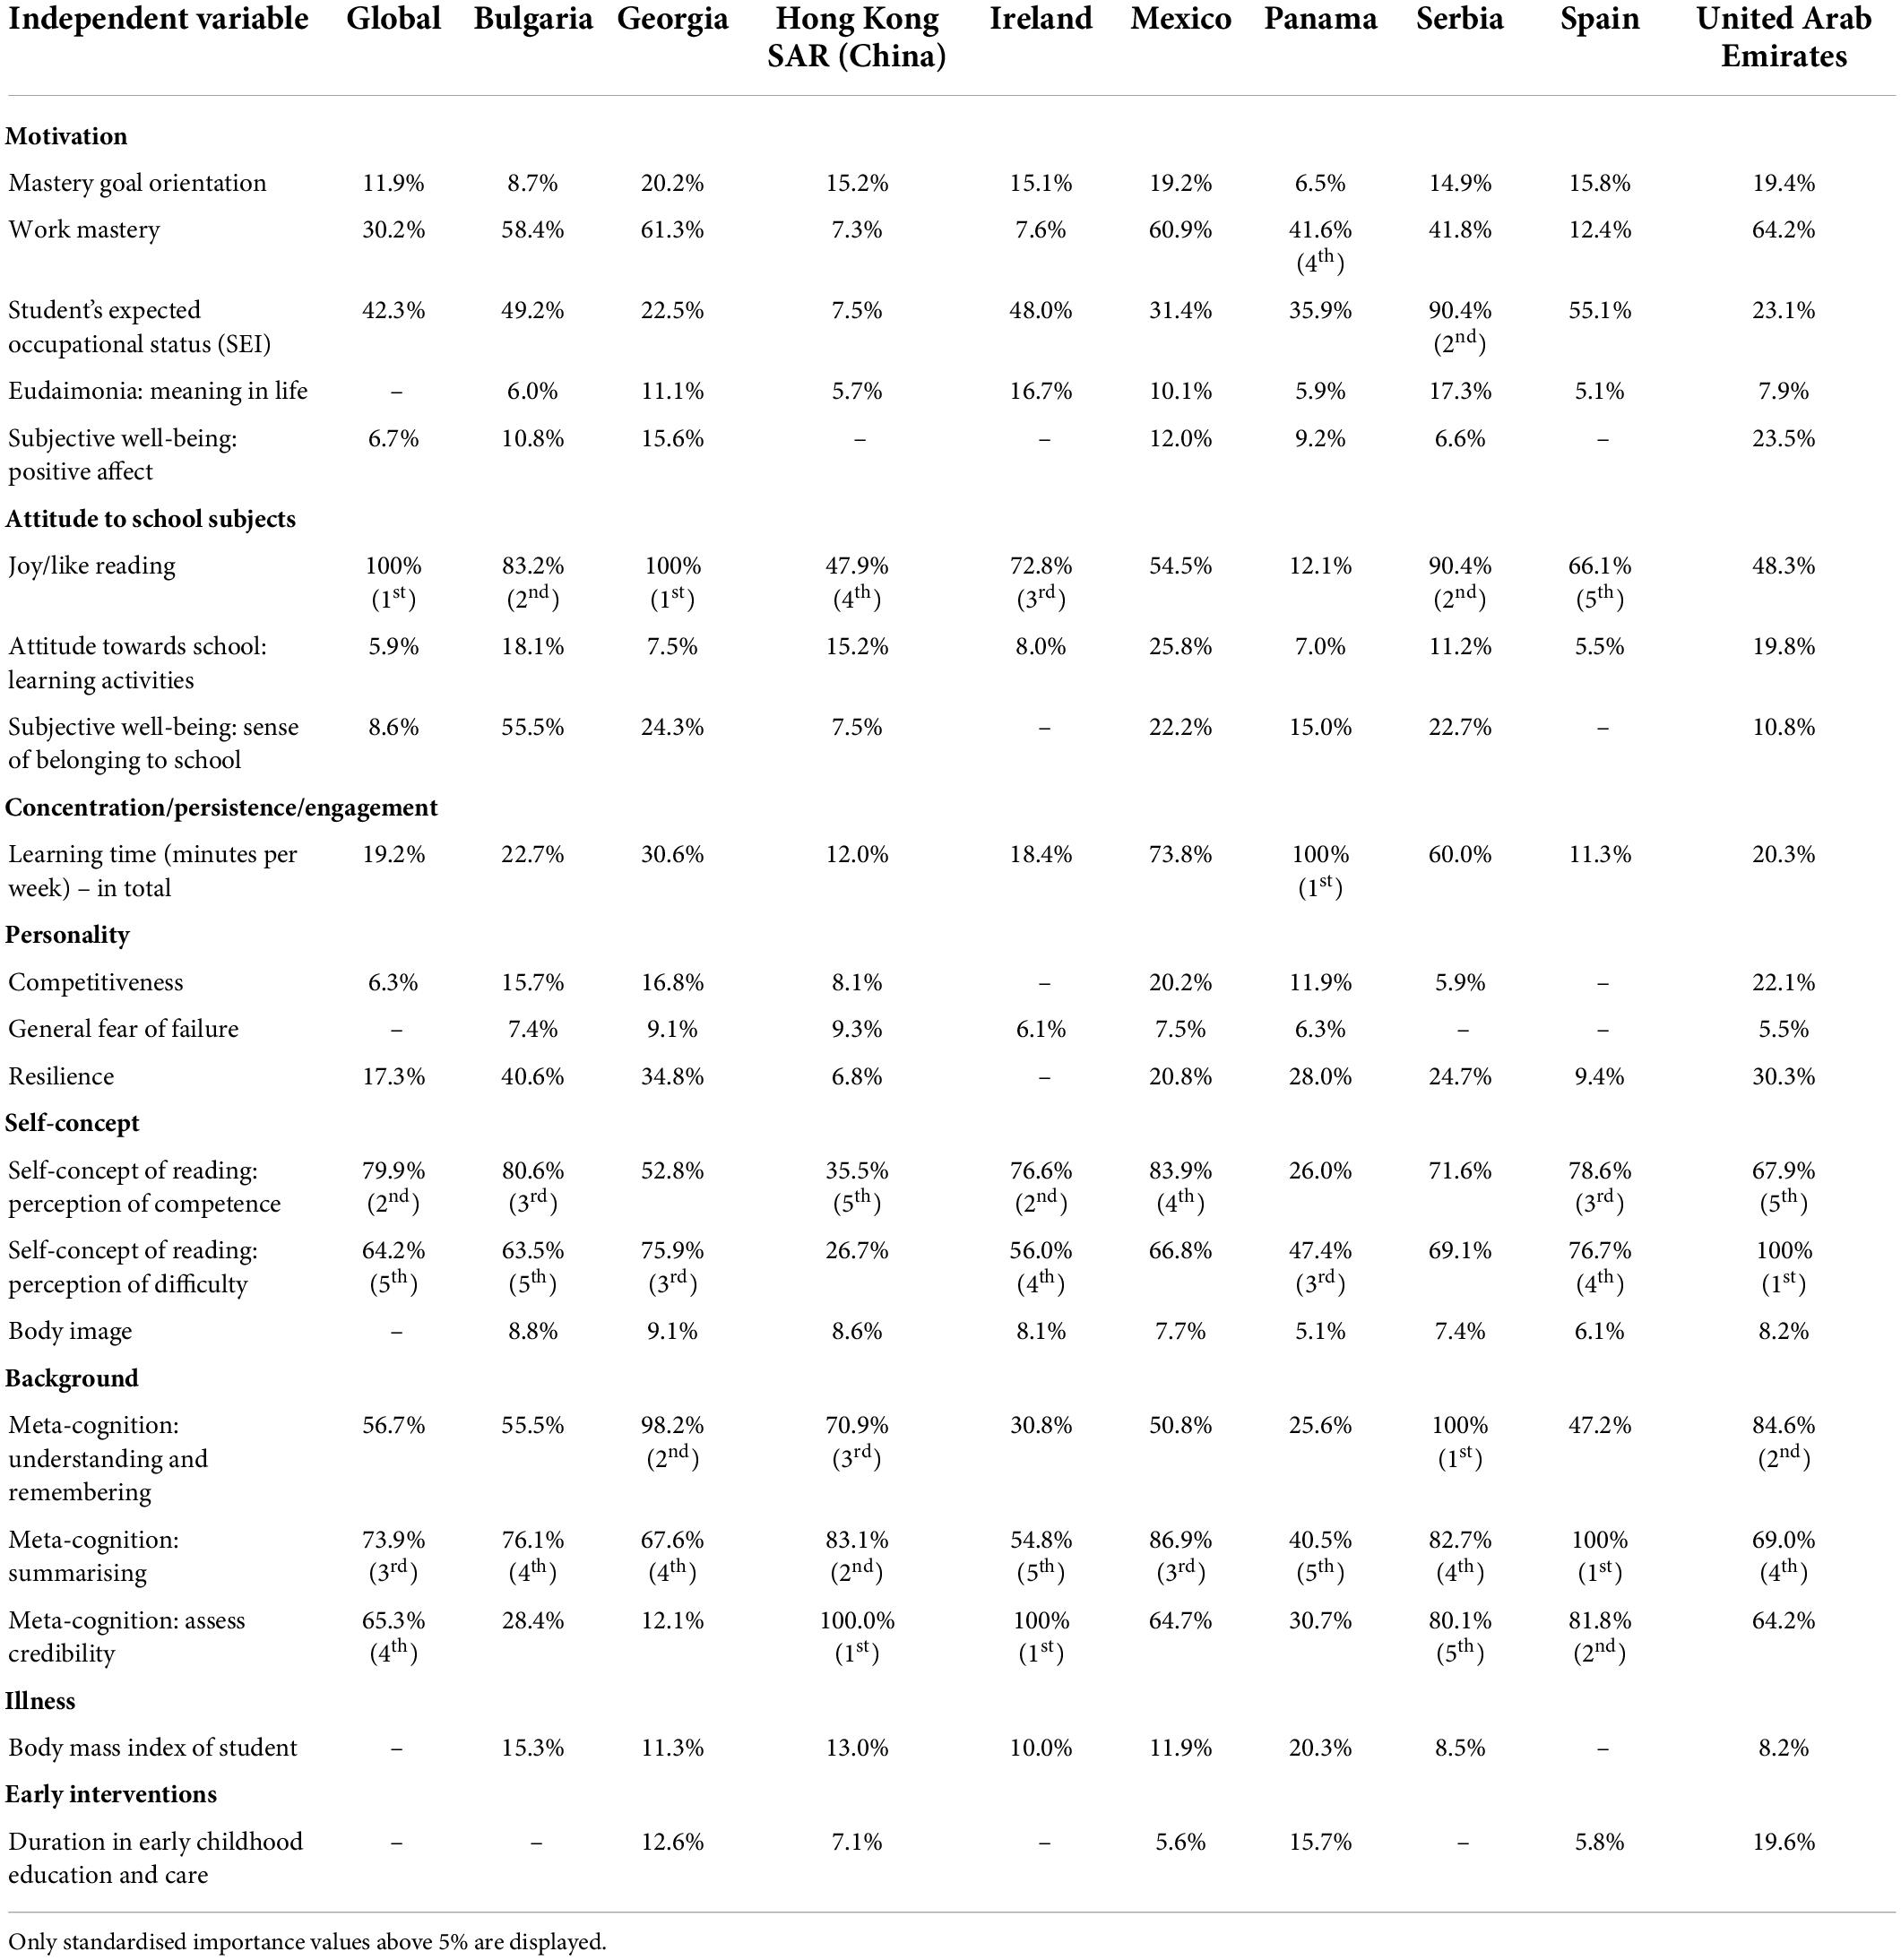
Table 6. Standardised importance of the independent student variables.
The three metacognitive indicators can be considered to show a high explanatory capacity both in the overall model and in each of the selected countries. However, this explanatory capacity differs among territories. Hence, Meta-cognition: summarising is the variable that most contributes to explaining low performance in Spain. It can also be found among the top five positions in all the remaining countries. Moreover, Meta-cognition: understanding and remembering leads the chart in Serbia and occupies the second position in Georgia, and Meta-cognition: assess credibility occupies the first position in Hong Kong SAR (China), and Ireland.
Cognitive self-concept is another construct that plays an important role in explaining low reading achievement across countries. At least one of the two cognitive self-concept variables appears at the top of the table in all the countries considered, except for Serbia. By contrast, Body image, which is related to physical self-concept, has an unremarkable explanatory capacity in all the selected countries, ranking below the middle of the table in most of the models.
Regarding motivational variables, only Work mastery and Student’s expected occupational status appear to be remarkable in the overall model. However, differences between the nine countries in relation to both aspects are noteworthy. On one hand, Work mastery is in the top five positions in Panama, while it is situated at the bottom of the ranking in Hong Kong SAR (China). On the other hand, although Student’s expected occupational status appears in the first half of the table in all the countries analysed, it only ranks among the top five positions in Serbia. Finally, the variables Eudaimonia: meaning in life, Subjective well-being: positive affect, and Mastery goal orientation are situated outside the top positions in all the models.
Regarding personality indices, Resilience is the variable in this category with the greatest explanatory capacity in the overall model and that is best positioned in the said category in most of the selected countries. However, this set of variables plays a minor role in all the countries analysed.
The variable Learning time (minutes per week)-in total shows a standardised importance rate of 19.2% in the overall model. However, the cross-country differences in relation to this aspect are notable: while this variable is located near the centre of the table in most countries, it can be found leading the table in Panama.
Finally, the variables Body mass index of student and Duration in early childhood education and care are located in the second half of the table in most of the countries with the exception of the former in Hong Kong SAR (China), Ireland, and Panama and the latter in Panama.
Family variables
The results reflecting the standardised importance and position of the family variables (Table 7) show that socio-economic and cultural factors are the aspects related to the family environment that most contribute to explaining low performance in the global model—with the exception of Educational level of parents. However, some remarkable differences between the territories must be considered.
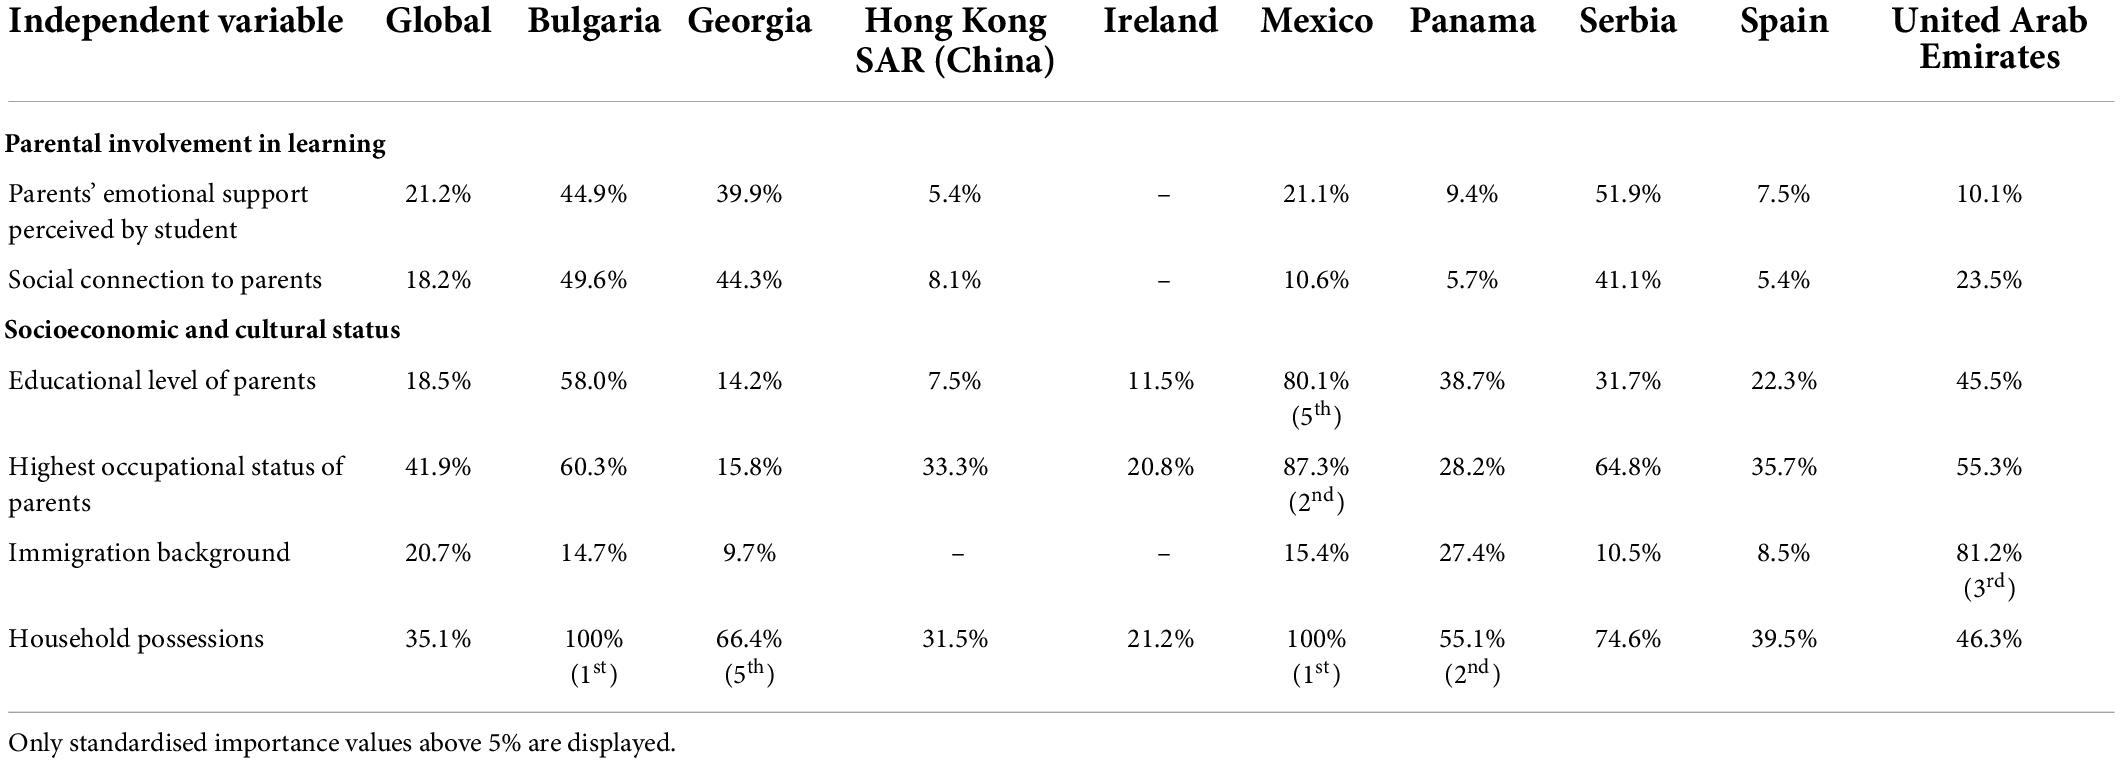
Table 7. Standardised importance of the independent family variables.
First, the variable Household possessions is among the top positions in four of the countries (Bulgaria, Georgia, Mexico, and Panama)—being the first variable of the model in Mexico and Bulgaria—and is situated in the first half of the ranking in all the countries analysed. Also, although Highest occupational status greatly contributes to explaining academic performance in almost all the countries (especially in Mexico), it only occupies the 18th position in Georgia. In addition, Immigration background presents wide diversity across the countries, being the third most important variable in the United Arab Emirates and the second last in Hong Kong SAR (China), and Ireland. Finally, the disparity is also evident for the variable Educational level of parents, as this appears in the 24th place in Hong Kong SAR (China) but occupies the 5th position in Mexico.
In relation to parental involvement, the standardised importance values for the two variables considered (Parents’ emotional support perceived by student and Social connection to parents) are around 20% in the overall model. Again, the results show cross-country differences, with both variables ranking close to the 10th position in Georgia but appearing situated at the bottom of the table in Ireland.
School and teacher variables
The results in Table 8 show the low explanatory capacity of school and teacher variables in the overall model. Moreover, none of the variables within this domain are among the main predictors of low achievement in any of the countries considered. However, some differences among the territories require further analysis.
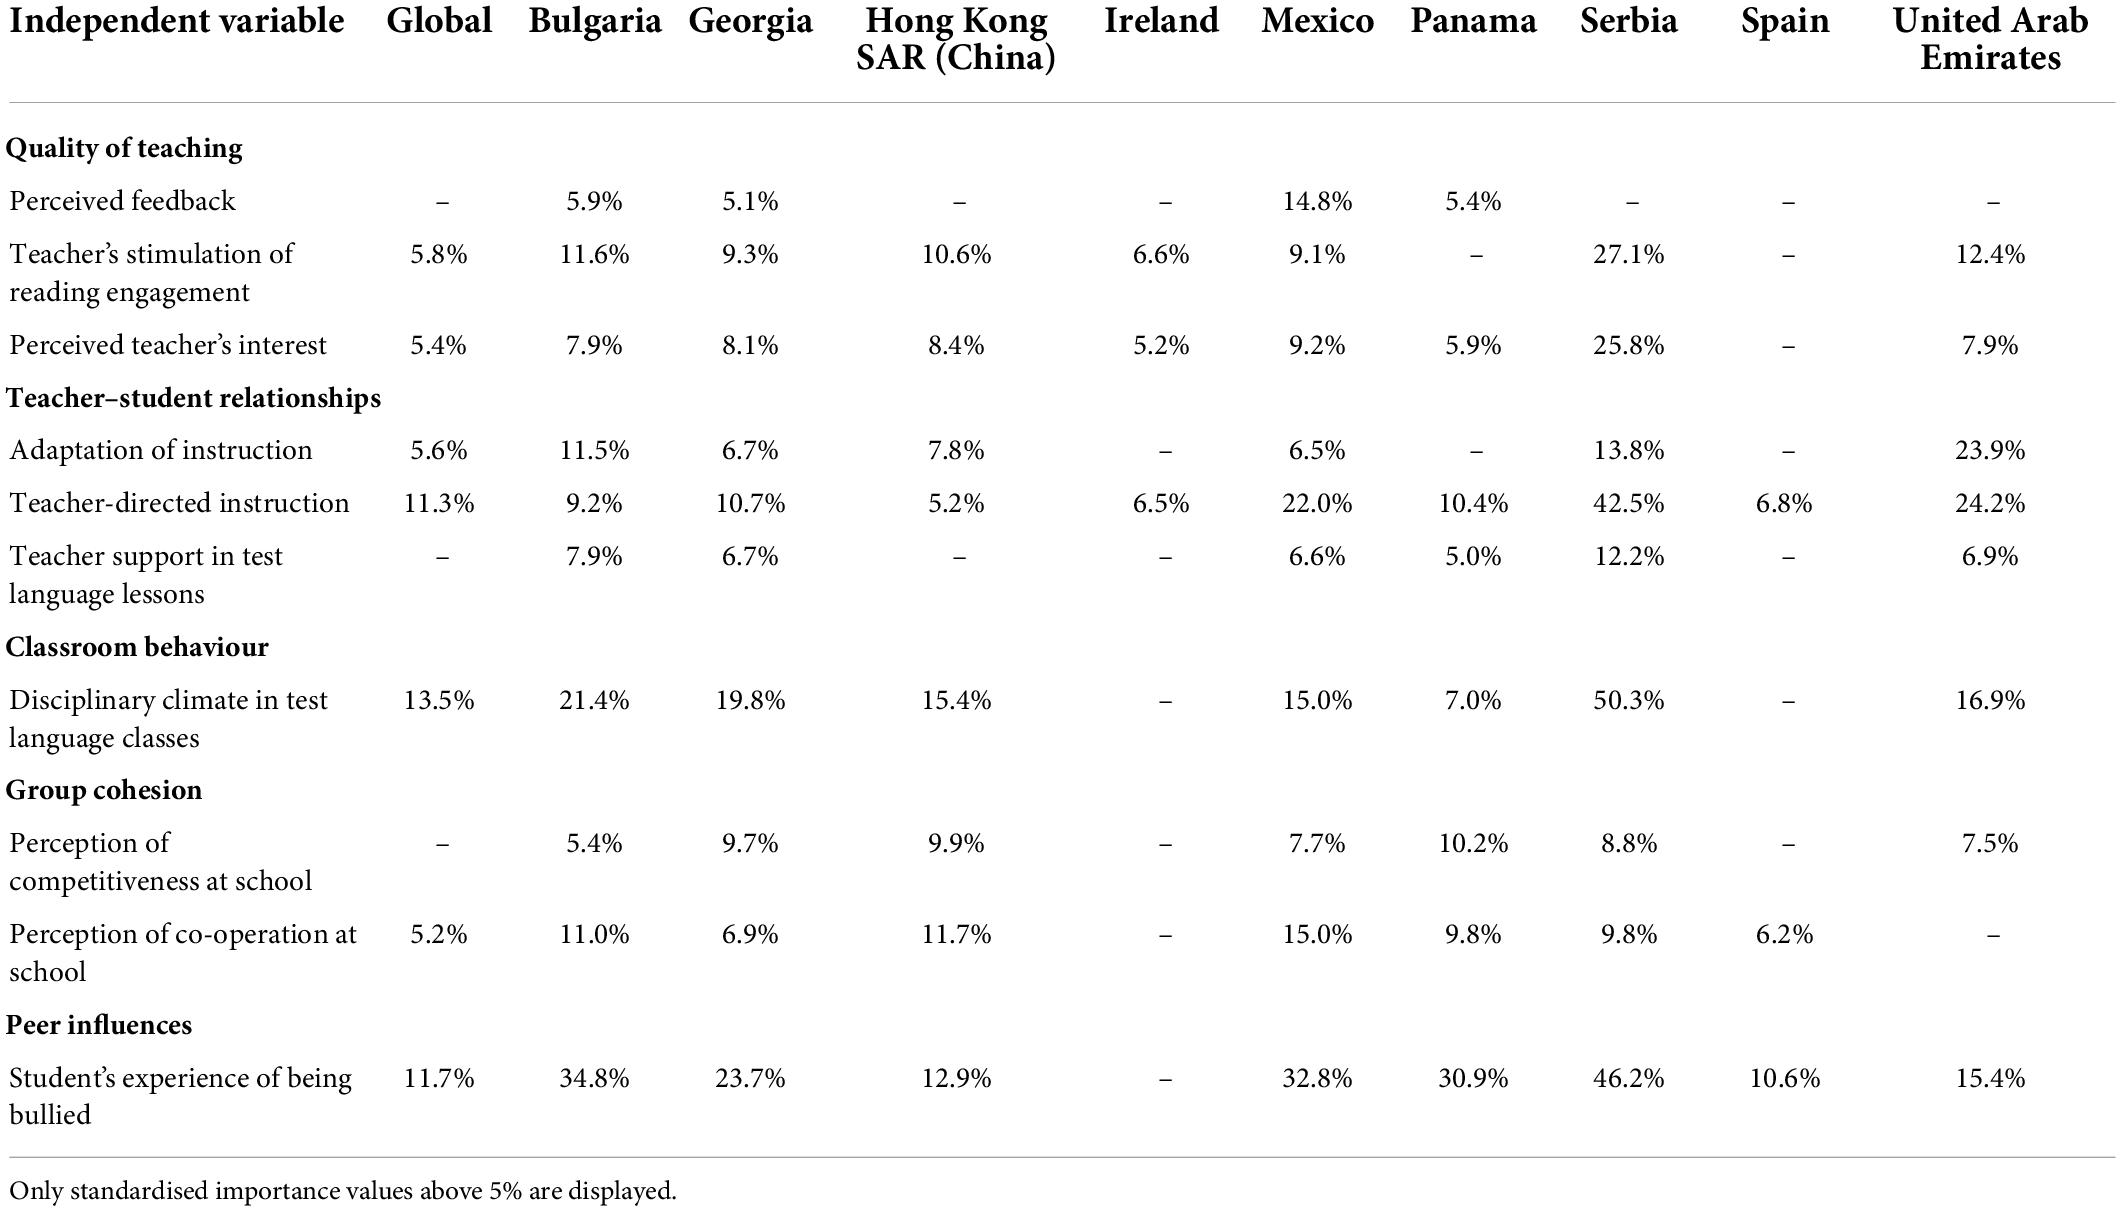
Table 8. Standardised importance of the independent teacher and school variables.
In terms of the aspects more directly related to school, having an Experience of being bullied plays an important role in explaining underachievement in some countries. However, some diversity can be observed, as this variable is in the lower half of the table in Ireland and the United Arab Emirates but reaches the upper half in all the remaining countries. Another school factor, Disciplinary climate in test language classes, ranks Considerably higher in Serbia and Hong Kong SAR (China) than in the other countries. Finally, the variables related to group cohesion have a low explanatory capacity both in the overall model and in all the countries considered.
With regards to teacher-related variables, only Teacher-directed instruction shows a standardised importance of above 6%. However, these teacher-related variables are still below the middle of the ranking in almost all the countries considered.
Discussion
The explanation of underachievement and the search for its associated factors have been of constant interest in educational research. In this regard, the number of variables involved in the description and explanation of achievement—and, more specifically, of underachievement—has increased over the years, as so the number of studies. The very selection of the explanatory variables itself poses a bias in the analysis.
Therefore, to get as broad a picture as possible of this phenomenon, we have analysed the factors affecting low academic achievement using the data that—at least up to now—offer the most complete overview of performance: that is, taking the data from the international PISA assessment. For this purpose, and to adjust the explanation to the reality of each country, all available information on possible associated variables has been incorporated into the analyses. For this reason, only countries that had applied all context questionnaires were included in the sample.
The results of this study show the effects of personal, family, and school characteristics on low academic achievement. Hence, despite slight differences between the countries analysed, the variables that most influence low academic performance are mainly linked to the students themselves (low metacognition, lack of enjoyment of reading, poor self-concept, and low expectations about their future occupational status). In addition, at the family level, socio-economic aspects also play a significant role in explaining low academic achievement. These results are in line with those obtained by Sipe and Curlette (1997) and Hattie (2003), who reported personal variables, followed by family variables, to have the highest predictive capacity for low academic performance. However, in contrast to the results obtained in the aforementioned review papers, in our research, teacher variables were shown to have a low explanatory capacity.
Focusing attention on students’ characteristics, this research shows the major role of a lack of enjoyment of reading in students’ low performance. In this vein, this variable not only presents the greatest predictive capacity in the global model but also plays a relevant role in almost all the countries considered. These results coincide with the conclusions of the meta-analysis conducted by Tze et al. (2016), in which high levels of boredom were significantly related to low levels of academic performance, as well as to low levels of motivation and poor study strategies. In this sense, it is necessary to consider the role of emotional self-regulation when managing boredom. As this is one of the main components of emotional intelligence, it has been shown to be a good predictor of academic results (Checa et al., 2008; Calero et al., 2014). Similarly, in the study by Chang et al. (2016), cognitive engagement is positively correlated with academic performance. As Calero et al. (2014) describe, this could be explained by the fact that engagement is an essential element of motivation when it comes to predicting academic performance, as it is linked to the subjective value that students give to the task they are performing and thus influences their desire to carry it out and the results obtained.
Along with reading enjoyment, metacognition and self-concept have also played a major role in explaining low student achievement in all the countries analysed in our study; these results are in line with the findings of Hattie’s (2009, 2017). Furthermore, Ohtani and Hisasaka (2018) analysed 118 papers and reported that once intelligence is controlled, metacognition appears to be a good predictor of academic performance. These results seem to be reasonable, as metacognition refers to a person’s knowledge of his or her own information processing abilities, cognitive processes, and strategies for developing said processes, and includes the executive skills responsible for monitoring and self-regulating them (Schneider, 2010). Therefore, if students can recognise and understand their mental processes properly, they are likely to apply them optimally while learning.
On the contrary, the personal characteristics that consistently show a low explanatory capacity for academic underachievement across the selected countries correspond to duration in early childhood education and care, body image, and body mass index of student. Regarding the first of these variables, it is often claimed that attending early childhood education improves academic outcomes in the long term. However, although findings about this aspect seem to be contradictory in meta-analytic literature, they tend to show that the effects depend more on factors such as the quality of education than on whether this level of education is attended (Van Huizen and Plantenga, 2018). In this vein, it is also worth mentioning that the results obtained by the aforementioned authors revealed that the positive effects of attending early childhood education are greater for disadvantaged children, thus demonstrating the interrelation of this predictor with the socio-economic status of the families.
Finally, results for the remaining personal variables differ depending on the countries analysed, although not substantially. A greater variability is only observed for learning time, especially in the two, especially in the two Latin American countries considered. This difference is particularly noticeable in the case of Panama, where this variable ranks first in the model. Among other aspects, this could be related to the fact that in this region, some children spend part of their time at work rather than at school or studying, with the negative consequences this has on academic performance (Murillo and Román, 2014).
The importance of family factors in the explanation of academic achievement has also been analysed in this study, as the relationship between parents and children can be one of the most significant throughout a person’s life (Vasquez et al., 2016). Regarding said factors, the overall results are, again, in line with the findings of existing reviews, which reveal a medium-low predictive capacity for this dimension (Sirin, 2005; Castro et al., 2015; Pinquart, 2016; Vasquez et al., 2016; Tan, 2017). However, in contrast to the similar patterns which personal variables follow in each of the countries analysed, there are notable differences between the explanatory capacity of family variables across the territories.
First, the explanatory capacity of parental involvement varies greatly across countries: while the highest explanatory capacity is found in Georgia, the influence of this dimension is very small in Ireland. In this regard, Hampden-Thompson et al. (2013) state that there is a growing body of research that, in line with ecological systems theory, suggests that countries exert social, cultural, political, public, and institutional influences on their inhabitants. Due to this, cross-country differences in the association between family involvement and educational outcomes could be the consequence of national variations in relation to very diverse economic, cultural, social, or political aspects.
Meanwhile, cross-country differences in relation to families’ cultural and socio-economic status can be explained by the differences that exist between the territories analysed (World Bank, 2022a). In this vein, the United Arab Emirates, as a territory with very high rates of temporary labour immigration (Möller, 2022), is the country where immigrant status and occupational status have shown the greatest explanatory capacity for low academic performance. In this regard, the results also probably reflect education inequalities derived from differences between locals and immigrants in the school system. Also noteworthy is the prominent role played by the educational and occupational status of families and the material household resources in Bulgaria—being a country where inequality has been rising during the last decade (Peshev, 2015; Hallert, 2020). The same phenomenon is also observed in Mexico which, despite being the country with the lowest inequality in Latin America, is still affected by this problem (Amarante and Colacce, 2018). Finally, the great importance that these household material resources and the occupational status of families have in Serbia—as well as the students’ expectations about their employment—should be highlighted. These aspects may be related in part to the unemployment rates that this country still faces despite their gradual reduction (World Bank, 2022b), and also to the recent economic and social stabilisation that this territory has faced after the war suffered between 1991 and 2001. Therefore, the results suggest that these variables are more important in countries where the discrimination between family socio-economic resources is greater.
Variables relating to the characteristics of schools and teachers have shown little influence both in defining the general profile of students with low achievement and in explaining underachievement in each of the countries analysed. These results are partly in line with the findings of Hattie (2003), who, while attributing a minor role to school characteristics in explaining academic performance, found that teachers had an explanatory capacity of about 30%. However, the author did not consider the interrelationship between variables, which could explain the differential results with respect to our work. In any case, some slight differences between the analysed territories are observed in relation to school variables.
Although the explanatory capacity of the selected variables is, in general, very similar in all the countries analysed, the high standardised importance of school variables in Serbia stands out. This may be linked to the great variance found in reading achievement across the schools in this territory (Organisation for Economic Co-operation and Development [OECD], 2019a). Also, the fact of having suffered bullying plays a remarkable role in seven of the nine countries considered (Bulgaria, Hong Kong SAR (China), Spain, Mexico, Panama, Georgia, and Serbia). Of these territories, only Spain has lower rates of exposure to bullying than the OECD average (Organisation for Economic Co-operation and Development [OECD], 2019d). Finally, the variability found in the influence of classroom disciplinary climate on academic underachievement must be highlighted, which may be related to differences in cultural and behavioural standards across countries (Ning et al., 2015).
In conclusion, although much research has been focused on identifying the personal, family, and school aspects that exert the greatest influence on students’ low academic performance, our findings suggest the need to examine cross-national differences in greater depth and to consider the specificities of each territory. Despite the interest in these results, the main limitations of this study should be noted. On one hand, the selection of variables was based on the indicators of the PISA context questionnaires. Hence, there could be other explanatory variables for low academic performance—such as intelligence (Zaboski et al., 2018), self-regulation (Kyriakides et al., 2013), or perfectionism (Madigan, 2019) at the personal level, or the type of leadership of the school leaders (Chin, 2007) at the school level—which have not been considered in this article. On the other hand, cross-country comparisons have only been made between territories where all the context questionnaires were applied, which has reduced the number of international comparisons.
It would therefore be desirable to explore further the realities of the countries analysed in this study, as well as to explore comparisons between the explanatory capacity of the variables in a larger number of territories. In this vein, this study lays the theoretical foundations for future research, as it demonstrates the need to go a step further in research into the conditioning factors of low academic performance, which have traditionally been addressed from an international non-comparative perspective that establishes universal conclusions. Thus, this work has demonstrated the existence of differences in the personal, family, and school variables depending on the territories analysed. The results of this research also contribute to laying the foundations to develop specific policies addressed for preventing and improving underachievement, in which the whole educational community should be involved (Vera Sagredo et al., 2021). In this sense, this article demonstrates that, in addition to the development of international common policies aimed at reducing educational problems—as is the case, for example, of those conducted in the European Union—every country should develop its own robust policies aimed at improving students’ academic performance, which should be based on the specific influence that each of the variables exerts on said performance.
In conclusion, despite some common trends in the countries analysed, the variables that explain underachievement are different across them, given that socio-demographic and contextual conditions also differ. Therefore, although personal characteristics continue to be the ones that best explain academic performance, a series of contextual variables, especially related to families, exert a greater or lesser influence on performance depending on the level of development and characterisation of each country, and may even hide or annul certain personal characteristics.
In this vein, although personal variables have shown the greatest impact on students’ underachievement, there is an interrelation between all the factors that influence students’ academic performance (Bhowmik, 2019; Akbas-Yesilyurt et al., 2020). For this reason, consideration should be given to the possibility that personal factors may, in turn, be influenced by family or school variables. For example, we should inquire whether students’ expected occupational status or attitude toward school may be conditioned by family or teachers’ expectations, which also depend on their socio-economic status. We may also ask to what extent teachers might be influencing students’ level of metacognition, self-concept, or boredom.
Thus, policies and interventions should not only target students but should also consider the context in which they live, paying special attention to their families. Also, adequate pre-service and continuous training should be guaranteed for all teachers to ensure that students receive an adequate educational response, paying special attention to those who work in disadvantaged socio-educational contexts (Fernández Batanero, 2011).
For all these reasons, there is a clear need to continue working toward equity as a starting point, so that once equal opportunities are achieved, other personal variables can flourish.
Data availability statement
Publicly available datasets were analysed in this study. These data can be found here: https://www.oecd.org/pisa/data/2018database/.
Ethics statement
Ethical review and approval were not required for the study on human participants in accordance with the local legislation and institutional requirements. Written informed consent for participation was not required for this study in accordance with the national legislation and the institutional requirements.
Author contributions
BG: conceptualization and design of the study, validation, data analysis, interpretation of results, discussion and conclusions, and reviewing and editing. EL-M: conceptualization and design of the study, validation, data analysis, interpretation of results, and reviewing and editing. ECM: conceptualization and design of the study, validation, and reviewing and editing. All authors listed have made a substantial, direct, and intellectual contribution to the work, and approved the submitted version for publication.
Funding
This research has been conducted under the support of the Ayudas para la Formación de Profesorado Universitario (FPU).
Conflict of interest
The authors declare that the research was conducted in the absence of any commercial or financial relationships that could be construed as a potential conflict of interest.
Publisher’s note
All claims expressed in this article are solely those of the authors and do not necessarily represent those of their affiliated organizations, or those of the publisher, the editors and the reviewers. Any product that may be evaluated in this article, or claim that may be made by its manufacturer, is not guaranteed or endorsed by the publisher.
Footnotes
References
Akbas-Yesilyurt, F., Kocak, H., and Yesilyurt, M. E. (2020). Spatial models for identifying factors in student academic achievement. Int. J. Assess. Tools Educ. 7, 735–752. doi: 10.21449/ijate.722460
Amarante, V., and Colacce, M. (2018). ¿Más o menos desiguales? Una revisión sobre la desigualdad de los ingresos a nivel global, regional y nacional. Rev. Cepal 2018, 7–34. doi: 10.18356/1d244513-es
Arroyo Resino, D., Constante Amores, I. A., and Asensio Muñoz, I. (2019). La repetición de curso a debate: Un estudio empírico a partir de PISA 2015. Educación 22, 69–92. doi: 10.5944/educxx1.22479
Asensio Muñoz, I., Carpintero Molina, E., Exposito Casas, E., and Lopez Martin, E. (2018). ¿Cuánto oro hay entre la arena? Minería de datos con los resultados de España en PISA 2015/How much gold is in the sand? Data mining with Spain’s PISA 2015 results. Rev. Española de Pedagog. 76, 225–246. doi: 10.22550/REP76-2-2018-02
Bhowmik, M. K. (2019). “Ethnic minority young people’s education in Hong Kong: factors influencing school failure,” in Education, Ethnicity and Equity in the Multilingual Asian Context, eds J. Gube and F. Gao (New York, NY: Springer), 179–195. doi: 10.1007/978-981-13-3125-1_11
Breiman, L., Friedman, J. H., Olshen, R. A., and Stone, C. J. (1984). Classification and Regression Trees. Pacific Grove: Wadsworth and Brooks-Cole.
Calero, M. D., Carles, R., Mata, S., and Navarro, E. (2014). Diferencias en habilidades y conducta entre grupos de preescolares de alto y bajo rendimiento escolar. RELIEVE-Rev. Electrón. de Investig. y Eval. Educ. 16, 1–17. doi: 10.7203/relieve.16.2.4137
Castro, M., Expósito-Casas, E., López-Martín, E., Lizasoain, L., Navarro-Asencio, E., and Gaviria, J. L. (2015). Parental involvement on student academic achievement: A meta-analysis. Educ. Res. Rev. 14, 33–46.
Chang, D. F., Chien, W. C., and Chou, W. (2016). Meta-analysis approach to detect the effect of student engagement on academic achievement. ICIC Express Lett. 10, 2241–2246. doi: 10.1186/s13054-016-1208-6
Checa, P., Rodríguez−Bailón, R., and Rueda, M. R. (2008). Neurocognitive and temperamental systems of self−regulation and early adolescents’ social and academic outcomes. Mind Brain Educ. 2, 177–187. doi: 10.1111/j.1751-228X.2008.00052.x
Chin, J. M. C. (2007). Meta-analysis of transformational school leadership effects on school outcomes in Taiwan and the USA. Asia Pac. Educ. Rev. 8, 166–177. doi: 10.1007/BF03029253
de Oña, J., de Oña, R., and Calvo, F. J. (2012). A classification tree approach to identify key factors of transit service quality. Expert Syst. Appl. 39, 11164–11171. doi: 10.1016/j.eswa.2012.03.037
Ergen, B., and Kanadli, S. (2017). The effect of self-regulated learning strategies on academic achievement: A meta-analysis study. Eurasian J. Educ. Res. 17, 55–74. doi: 10.14689/ejer.2017.69.4
Fernández Batanero, J. M. (2011). Abandono escolar y prácticas educativas inclusivas. Rev. Latinoam. Educ. Incl. 5, 43–58.
Ghasemi, E., and Burley, H. (2019). Gender, affect, and math: A cross-national meta-analysis of Trends in International Mathematics and Science Study 2015 outcomes. Large-Scale Assess. Educ. 7, 1–25. doi: 10.1186/s40536-019-0078-1
Gorard, S., and Smith, E. (2003). “What Is” Underachievement at School”?,” in Working Paper Series Paper, (Cardiff: Cardiff University School of Social Sciences).
Gutiérrez-de-Rozas, B., and López-Martín, E. (2020). Contextualización y evaluación del fracaso escolar. Madrid: Sanz y Torres.
Hallert, J. J. (2020). Inequality, poverty, and social protection in bulgaria. SSRN [Working Paper]. doi: 10.2139/ssrn.3688532
Hampden-Thompson, G., Guzman, L., and Lippman, L. (2013). A cross-national analysis of parental involvement and student literacy. Int. J. Comp. Sociol. 54, 246–266. doi: 10.1177/0020715213501183
Hattie, J. (2003). Teachers Make a Difference. What is the research evidence?. Camberwell: Australian Council for Educational Research.
Hattie’s, J. (2009). Visible Learning: A Synthesis of 800+ meta-Analyses on Achievement. Milton Park: Routledge.
Hattie’s, J. (2017). Visible Learning plus. 250+ Influences on Student Achievement. Available Online at: https://visible-learning.org/wp-content/uploads/2018/03/250-Influences-Final-Effect-Size-List-2017_VLPLUS.pdf (accessed March 3, 2022).
Holzer, J., Bürger, S., Samek-Krenkel, S., Spiel, C., and Schober, B. (2021). Conceptualisation of students’ school-related wellbeing: Students’ and teachers’ perspectives. Educ. Res. 63, 474–496. doi: 10.1080/00131881.2021.1987152
Kornilova, T. V., Kornilov, S. A., and Chumakova, M. A. (2009). Subjective evaluations of intelligence and academic self-concept predict academic achievement: Evidence from a selective student population. Learn. Individ. Diff. 19, 596–608. doi: 10.1016/j.lindif.2009.08.001
Kyriakides, L., Christoforou, C., and Charalambous, C. Y. (2013). What matters for student learning outcomes: A meta-analysis of studies exploring factors of effective teaching. Teach. Teach. Educ. 36, 143–152. doi: 10.1016/j.tate.2013.07.010
Lamas, H. A. (2015). Sobre el rendimiento escolar. Propósitos y Representaciones 3, 313–386. doi: 10.20511/pyr2015.v3n1.74
López-Martín, E., Expósito-Casas, E., Carpintero Molina, E., and Asensio Muñoz, I. (2018). ¿Qué nos dice PISA sobre la enseñanza y el aprendizaje de las ciencias? una aproximación a través de árboles de decisión. Rev. de Educ. 382, 133–162.
Madigan, D. J. (2019). A meta-analysis of perfectionism and academic achievement. Educ. Psychol. Rev. 31, 967–989. doi: 10.1007/s10648-019-09484-2
Möller, L. M. (2022). “United Arab Emirates: temporary multiculturalism, but permanent legal pluralism?,” in Normativity and Diversity in Family Law, eds N. Yassari and M.-C. Foblets (New York, NY: Springer), 101–117. doi: 10.1007/978-3-030-83106-6_5
Mullis, I. V. S., Martin, M. O., Foy, P., Kelly, D. L., and Fishbein, B. (2020). TIMSS 2019 International Results in Mathematics and Science. Chestnut Hill, MA: TIMSS & PIRLS International Study Center.
Murillo, J., and Román, M. (2014). Consecuencias del trabajo infantil en el desempeño escolar. Estudiantes latinoamericanos de educación primaria. Lat. Am. Res. Rev. 49, 84–106. doi: 10.1353/lar.2014.0031
Ning, B., Van Damme, J., Van Den Noortgate, W., Yang, X., and Gielen, S. (2015). The influence of classroom disciplinary climate of schools on reading achievement: A cross-country comparative study. Sch. Effect. Sch. Improv. 26, 586–611. doi: 10.1080/09243453.2015.1025796
Ohtani, K., and Hisasaka, T. (2018). Beyond intelligence: A meta-analytic review of the relationship among metacognition, intelligence, and academic performance. Metacogn. Learn. 13, 179–212. doi: 10.1007/s11409-018-9183-8
Organisation for Economic Co-operation and Development [OECD] (2017). PISA 2015 Results (volume III): Students’ well-being. Paris: OECD Publishing.
Organisation for Economic Co-operation and Development [OECD] (2019). PISA 2018 Results. Combined Executive Summaries. Volume I, II & III. Paris: OECD Publishing.
Organisation for Economic Co-operation and Development [OECD] (2019a). PISA 2018 Insights and Interpretations. Paris: OECD Publishing.
Organisation for Economic Co-operation and Development [OECD] (2019b). PISA 2018 results. combined executive summaries, Vol. I, II, III. Paris: OECD Publishing.
Organisation for Economic Co-operation and Development [OECD] (2019c). PISA 2018 Assessment and Analytical Framework. Paris: OECD Publishing, doi: 10.1787/b25efab8-en
Organisation for Economic Co-operation and Development [OECD] (2019d). PISA 2018 Results (Volume III): What School Life Means for Students’ Lives. Paris: OECD Publishing, doi: 10.1787/acd78851-en
Organisation for Economic Co-operation and Development [OECD] (n.d.). “Chap. 19 - International Data Products,” in PISA 2018 technical report (Paris: OECD Publishing).
Peshev, P. (2015). Analysis of the wealth inequality dynamics in Bulgaria: Different approach. Econ. Altern. J. 4, 29–33.
Pinquart, M. (2016). Associations of parenting styles and dimensions with academic achievement in children and adolescents: A meta-analysis. Educ. Psychol. Rev. 28, 475–493. doi: 10.1007/s10648-015-9338-y
Poropat, A. E. (2009). A meta-analysis of the five-factor model of personality and academic performance. Psychol. Bull. 135:322. doi: 10.1037/a0014996
Razi, M. A., and Athappilly, K. (2005). A comparative predictive analysis of neural networks (NNs), nonlinear regression and classification and regression tree (CART) models. Expert Syst. Appl. 29, 65–74. doi: 10.1016/j.eswa.2005.01.006
Schneider, W. (2010). “The development of metacognitive competences,” in Metacognition, Strategy Use, and Instruction, eds H. Salatas Waters and W. Schneider (New York, NY: Guilford Press).
She, H. C., Lin, H. S., and Huang, L. Y. (2019). Reflections on and implications of the Programme for International Student Assessment 2015 (PISA 2015) performance of students in Taiwan: The role of epistemic beliefs about science in scientific literacy. J. Res. Sci. Teach. 56, 1309–1340. doi: 10.1002/tea.21553
Sipe, T. A., and Curlette, W. L. (1997). A meta-synthesis of factors related to educational achievement: A methodological approach to summarizing and synthesizing meta-analyses. Int. J. Educ. Res. 25, 583–698. doi: 10.1016/S0883-0355(96)00021-3
Sirin, S. R. (2005). Socioeconomic status and academic achievement: A meta-analytic review of research. Rev. Educ. Res. 75, 417–453. doi: 10.3102/00346543075003417
Tan, C. Y. (2017). Examining cultural capital and student achievement: Results of a meta-analytic review. Alberta J. Educ. Res. 63, 139–159.
Tze, V. M. C., Daniels, L. M., and Klassen, R. M. (2016). Evaluating the relationship between boredom and academic outcomes: A meta-analysis. Educ. Psychol. Rev. 28, 119–144. doi: 10.1007/s10648-015-9301-y
Van Huizen, T., and Plantenga, J. (2018). Do children benefit from universal early childhood education and care? A meta-analysis of evidence from natural experiments. Econ. Educ. Rev. 66, 206–222. doi: 10.1016/j.econedurev.2018.08.001
Van Petegem, K., Aelterman, A., Rosseel, Y., and Creemers, B. (2007). Student perception as moderator for student wellbeing. Soc. Indic. Res. 83, 447–463. doi: 10.1007/s11205-006-9055-5
Vasquez, A. C., Patall, E. A., Fong, C. J., Corrigan, A. S., and Pine, L. (2016). Parent autonomy support, academic achievement, and psychosocial functioning: A meta-analysis of research. Educ. Psychol. Rev. 28, 605–644. doi: 10.1007/s10648-015-9329-z
Vera Sagredo, A., Cerda Etchepare, G., Aragón Mendizábal, E., and Pérez Wilson, C. (2021). Rendimiento académico y su relación con variables socioemocionales en estudiantes chilenos de contextos vulnerables. Educación 24, 375–398. doi: 10.5944/educXX1.28269
Zaboski, B. A., Kranzler, J. H., and Gage, N. A. (2018). Meta-analysis of the relationship between academic achievement and broad abilities of the Cattell-Horn-Carroll theory. J. Sch. Psychol. 71, 42–56. doi: 10.1016/j.jsp.2018.10.001
Appendix
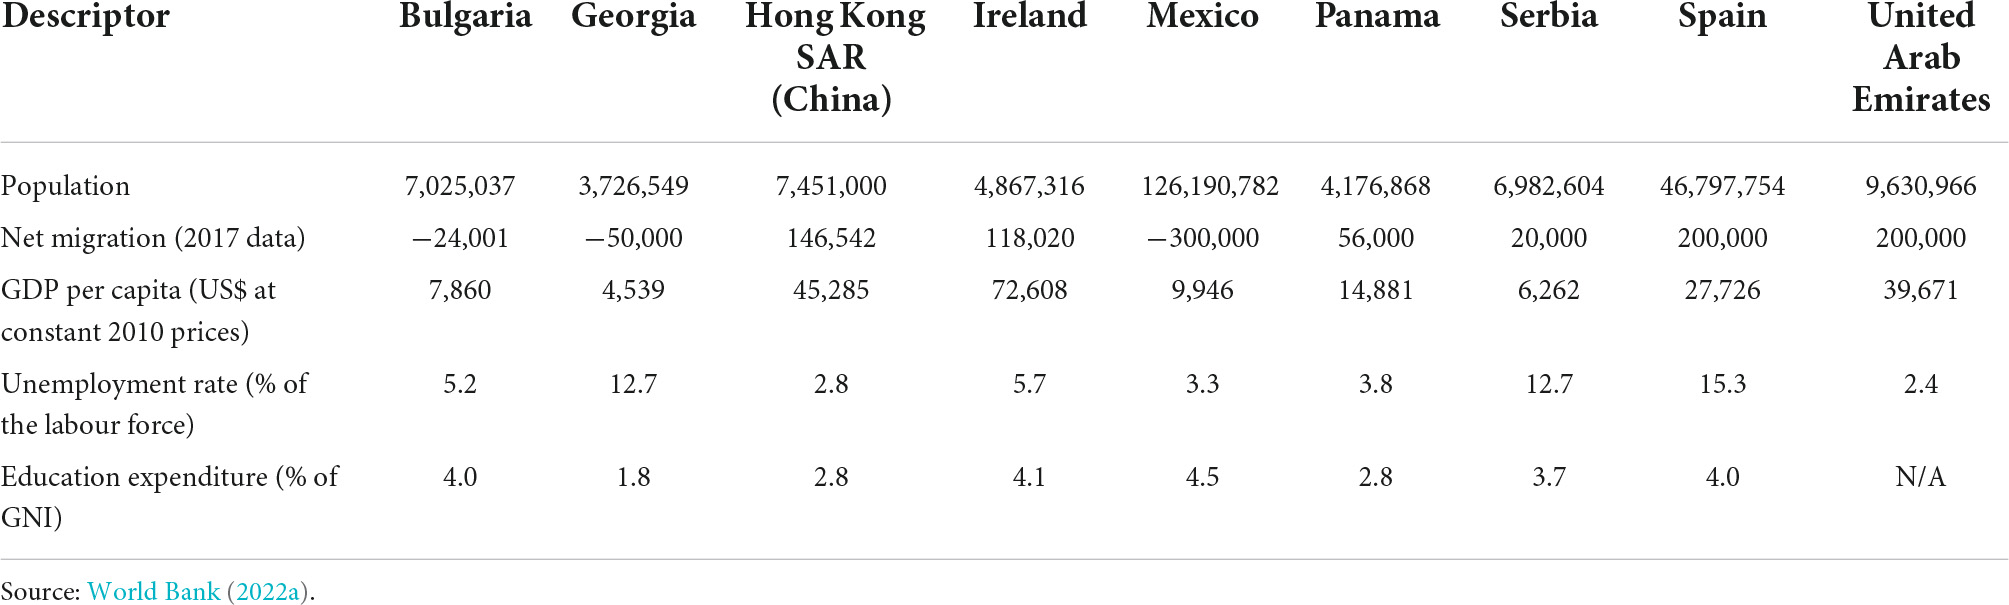
Appendix A. General description of the nine selected countries (2018 data).
Keywords: academic achievement, low achievement, PISA, cross-country analysis, decision trees, CART
Citation: Gutiérrez-de-Rozas B, López-Martín E and Carpintero Molina E (2022) Defining the profile of students with low academic achievement: A cross-country analysis through PISA 2018 data. Front. Educ. 7:910039. doi: 10.3389/feduc.2022.910039
Received: 31 March 2022; Accepted: 11 July 2022;
Published: 05 August 2022.
Edited by:
George Waddell, Royal College of Music, United KingdomReviewed by:
John Hattie, The University of Melbourne, AustraliaChia-Lin Tsai, University of Northern Colorado, United States
Copyright © 2022 Gutiérrez-de-Rozas, López-Martín and Carpintero Molina. This is an open-access article distributed under the terms of the Creative Commons Attribution License (CC BY). The use, distribution or reproduction in other forums is permitted, provided the original author(s) and the copyright owner(s) are credited and that the original publication in this journal is cited, in accordance with accepted academic practice. No use, distribution or reproduction is permitted which does not comply with these terms.
*Correspondence: Belén Gutiérrez-de-Rozas, Ymd1dGllcnJlemRlcm96YXNAZWR1LnVuZWQuZXM=