 Anastasia Kurysheva
 Linda van Ooijen-van der Linden
 Maarten J. van der Smagt
 Gönül Dilaver1
- 1Center of Education and Training, University Medical Center Utrecht, Utrecht, Netherlands
- 2Department of Higher Education, Research and Innovation, Amsterdam University of Applied Sciences, Amsterdam, Netherlands
- 3Faculty of Social and Behavioral Sciences, Utrecht, Netherlands
Signal Detection Theory (SDT) is rarely used in higher education, yet has much potential in informing decision-making. In this methodological paper, we describe the potential of SDT for different higher education contexts and demonstrate its practical application. Both the commonly used regression analyses and SDT analyses provide information on the accuracy of a predictor, and thus which instrument(s) to use. SDT analyses, in addition, provide information on the effects of setting specific cut-off scores on outcomes of interest. SDT provides the sensitivity and specificity information for the chosen instrument(s) at specific cut-off scores (criteria in SDT). This allows for evidence-informed, deliberate choice of cut-off scores to steer toward desired outcomes. Depending on how undesirable false positives and false negatives are considered in a specific situation, a lower or higher cut-off score can be deemed adequate. Using SDT analyses in our example, we demonstrate how to use the results to optimize “real-life” student selection. However, selection is only one of many decision-making practices where SDT is applicable and valuable. We outline some of the areas within higher education decision-making and quality assurance, where SDT can be applied to answer specific questions and optimize decision-making.
Introduction
Signal Detection Theory (SDT; Green and Swets, 1966; Stanislaw and Todorov, 1999; Macmillan and Creelman, 2005; Dandachi-FitzGerald and Martin, 2021) provides the framework and analyses to study the effects of specific cut-off scores in decision-making. SDT originates from military defense, where radar is used to detect hostile vessels (Marcum, 1947; Tanner and Swets, 1954). Since its inception, SDT has been applied in a variety of disciplines. In medicine, SDT is commonly used to describe the accuracy of diagnostic instruments in detecting a disease (Boutis et al., 2010). In cognitive psychology, SDT can be used to determine the accuracy of human memory in distinguishing between previously seen material and new, unseen material (e.g., Inoue and Bellezza, 1998; Nijboer et al., 2008). In school diagnostics, SDT analyses can be used to detect academic impediments (Smolkowski and Cummings, 2015). Even though its application in other fields is well established, the use of SDT in higher education is surprisingly rare (for an example on applying SDT in undergraduate admissions, see van Ooijen-van der Linden et al., 2017, 2018).
The objective of this paper is to demonstrate the application and potential of SDT in informing decisions for quality assurance in higher education. In the first section, we outline the basic concepts of SDT. Next, we illustrate one application of SDT in higher education using student selection as a decision-making example by presenting three possible selection scenarios. In the next section, we use a data set as an example to work out the scenarios in a full demonstration of SDT. By doing that, we aim to answer not only the question of which admission instruments to use, but also how to use them (application of cut-off scores of the instruments). We end with addressing strengths, limitations, and the broader potential of SDT in higher education (research).
Signal detection theory: Basic concepts
SDT is based on the assumption that decisions are made in uncertainty (Green and Swets, 1966; Stanislaw and Todorov, 1999; Macmillan and Creelman, 2005; Dandachi-FitzGerald and Martin, 2021). This assumption is also shared by non-rational theories that originate from the work on bounded rationality (Simon, 1984, 1990). Some of these theories provide ways to perform cost-benefit analyses by weighing the costs of incorrect decisions and the benefits of correct decisions (Selten, 1998; Gigerenzer and Gaissmaier, 2015). SDT offers the framework and calculations to perform such a cost-benefit analysis.
SDT is applicable if the decision requires a yes or no response to the question of whether a specified signal is present. The signal to be detected can be anything wanted or unwanted. The signal is usually detected by an instrument (and not human judgment). The uncertainty is caused by anything that hampers the ability to identify the presence or absence of the signal: noise. The ability of the instrument to correctly identify both presence and absence of the signal is the accuracy of the instrument (Stanislaw and Todorov, 1999).
The user of the instrument decides what level of indication of the signal being present is required to decide the signal is deemed present. This output level of the predictor, or cut-off score, is called a criterion in SDT (Green and Swets, 1966; Macmillan and Creelman, 2005). In using SDT, there are four possible outcomes associated with any decision: hit, miss, false alarm, and correct rejection. In case a signal is present, detecting it would be deemed a hit whereas deciding the signal is absent would be a miss (false negative). Similarly, in case of absence of the signal, deciding that the signal is present would result in a false alarm (false positive), whereas deciding it absent would be a correct rejection. Different cut-off scores yield different proportions of hits (for the signal-present cases) and false alarms (for the signal-absent cases). Although the accuracy of the instrument does not change as the user changes the cut-off score, different cut-off scores yield different decision outcomes. For example, in the case of higher education selective admissions, variation in cut-off scores would increase or decrease the number of students admitted for a program (see section The how question).
Plotting the hit rate against the false alarm rate for different cut-off scores visualizes the accuracy of the instrument. The sensitivity is the capacity of the instrument to identify presence of the signal which is equal to the hit rate (y-axis Figure 1). The specificity is the capacity of the instrument to identify the true absence of the signal, which equals 1 minus false alarm rate (x-axis Figure 1). The resulting graph is known as a Receiver Operating Characteristics curve (ROC curve) (see Figure 1), and the Area Under this Curve (AUC) is a numerical measure of the instrument’s accuracy in detecting the signal. The AUC ranges from 0.5, chance level, to 1, perfect accuracy. The non-parametric AUC has the advantage of being applicable regardless of the shape of the distribution of the predictor data. The reader is referred to the works of Green and Swets (1966), Stanislaw and Todorov (1999), Macmillan and Creelman (2005), Robin et al. (2011), and Dandachi-FitzGerald and Martin (2021) for more information on these measures and assumptions.
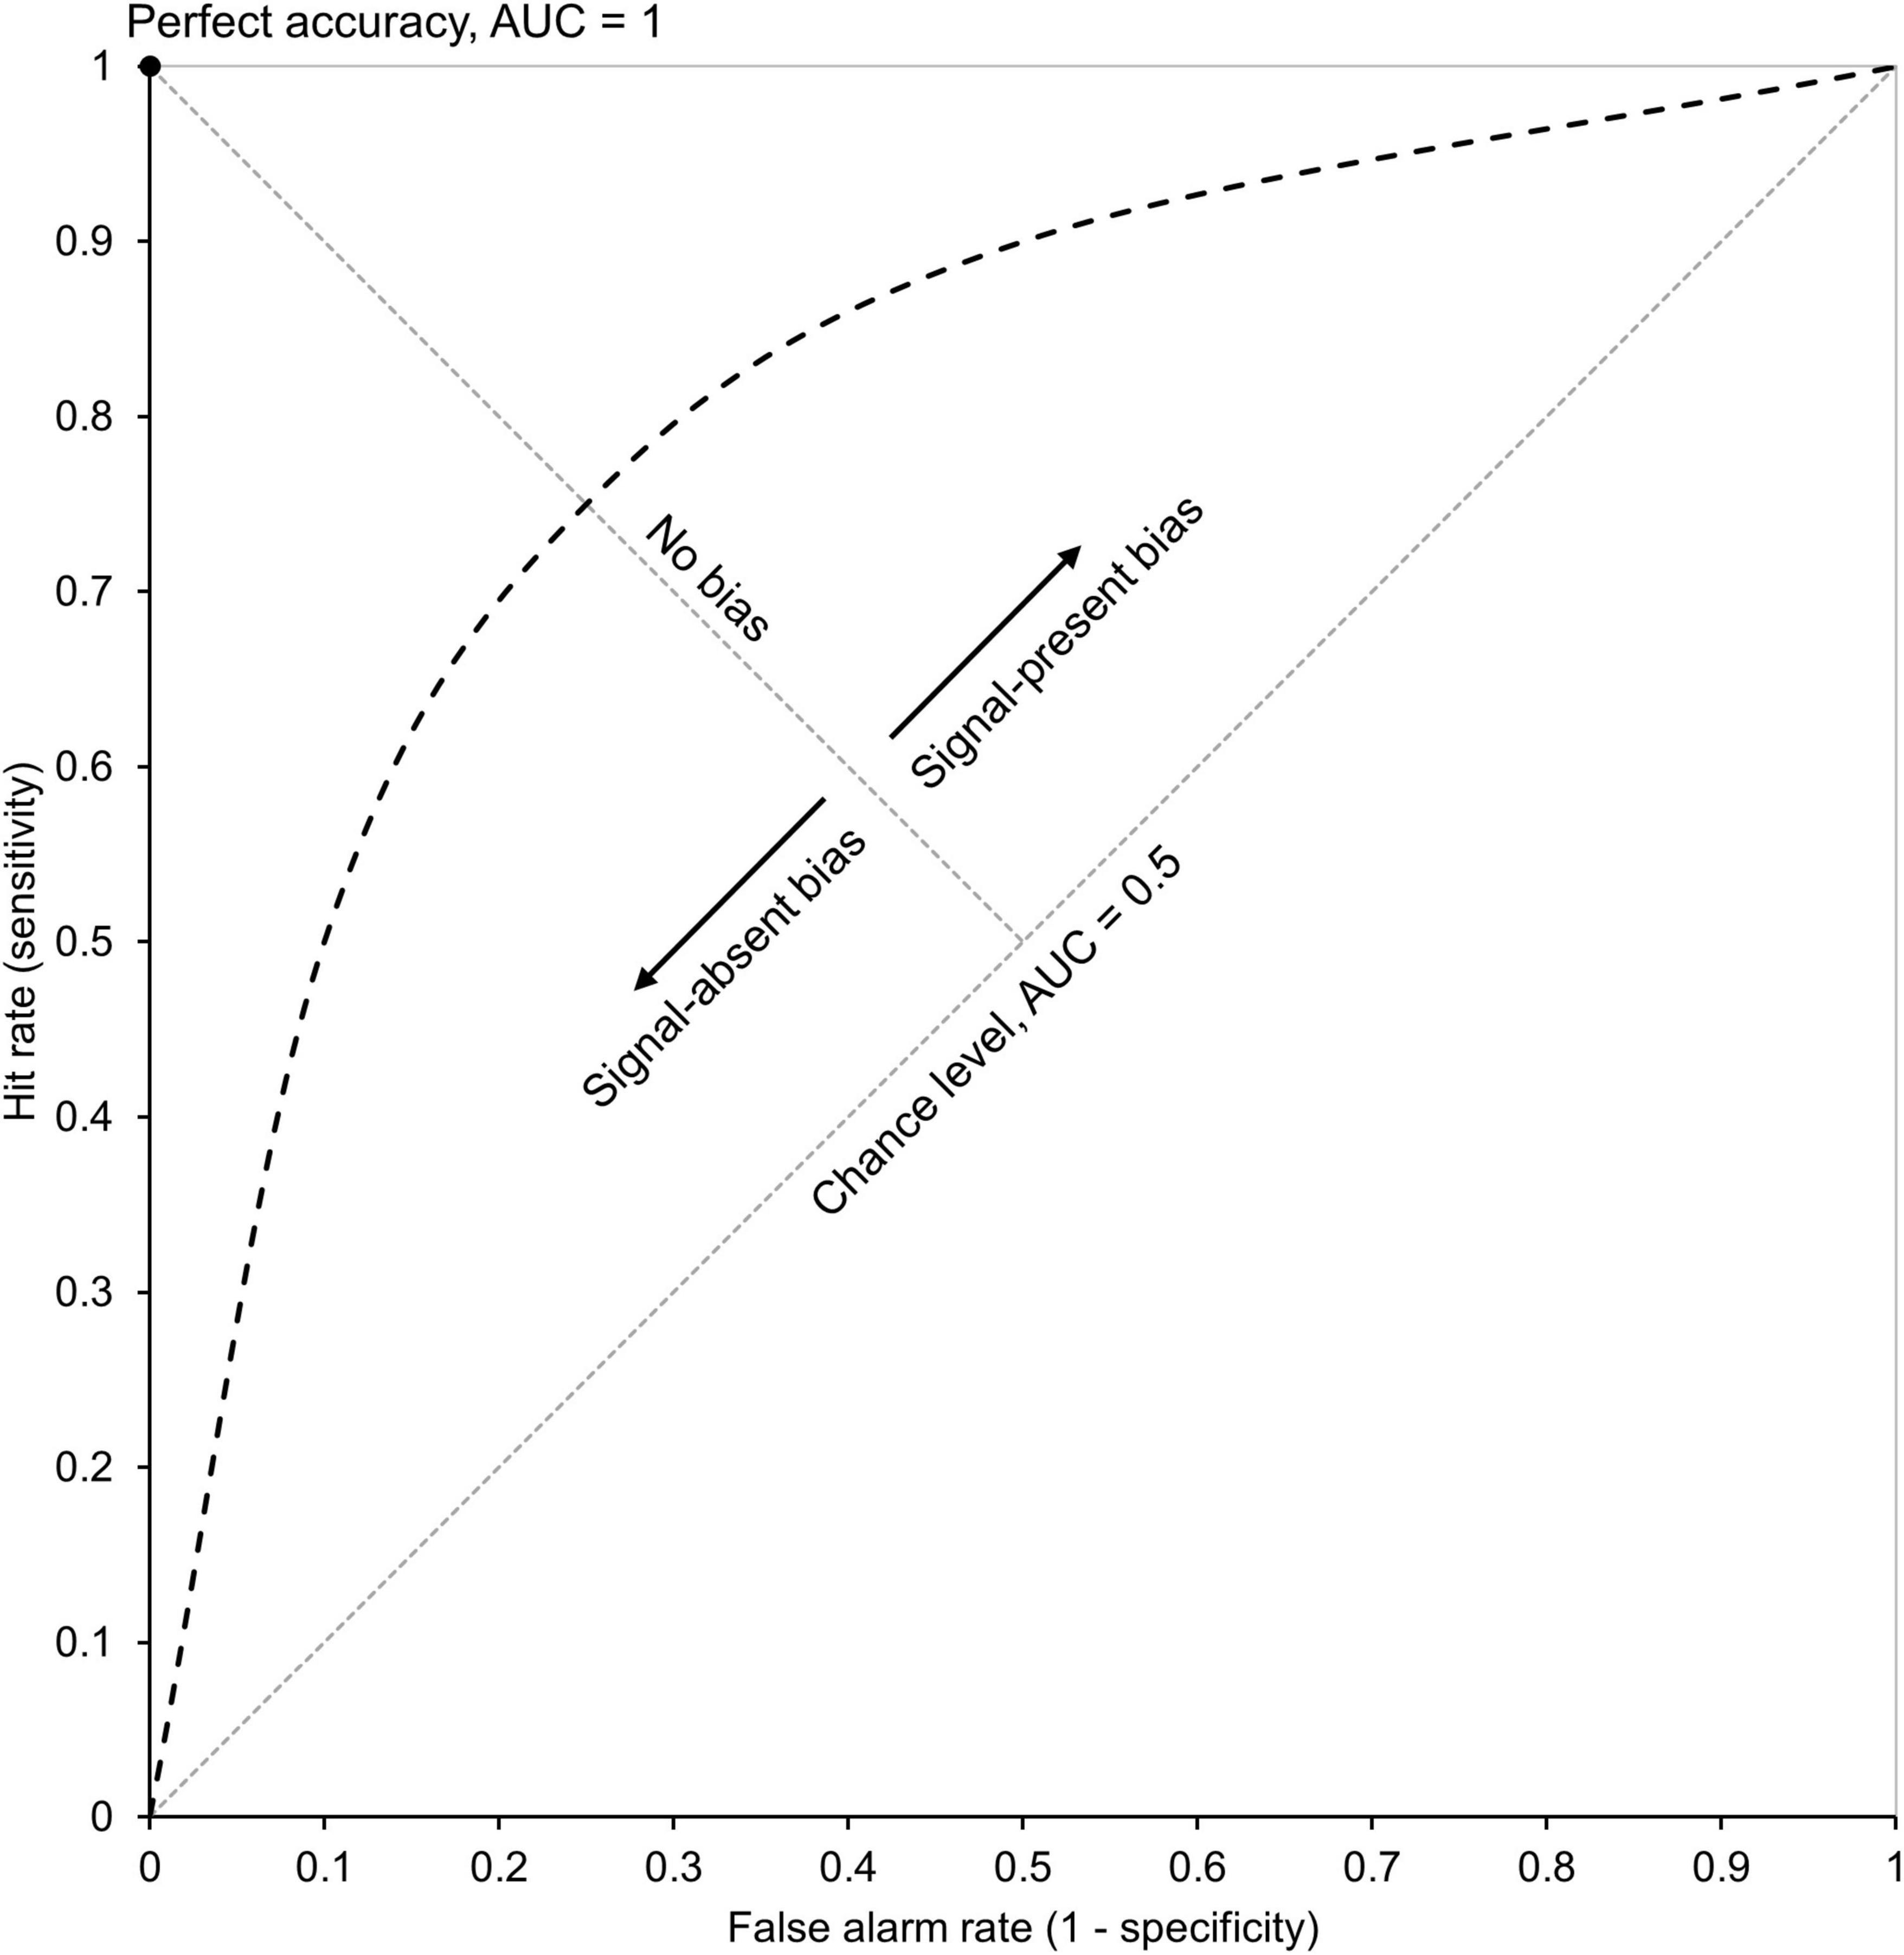
Figure 1. Explanation of a ROC-curve. In selection, each applicant’s score on a selection instrument is compared to each possible cut-off score (criterion in SDT terms) for that instrument. Each application of a criterion yields a false alarm rate and a hit rate for the sample of students, a data point in the Receiver Operating Characteristics curve (ROC curve). A ROC curve visualizes the accuracy of a predictor in predicting an outcome by showing the data points in the decision space between chance level and perfect accuracy. Since the specificity equals 1- (the proportion of) false alarms, the proportion false alarms equals 1 - specificity. Specificity indicates predictor performance in case of absence of the signal, sensitivity indicates predictor performance in case of presence of the signal. Scenario-points A, B, and C correspond to the intended admission bias, rejection bias and bias free selection outcomes in Table 2.
The cut-off score corresponding to equal sensitivity and specificity is the “no bias” cut off-score in that the proportions of misses (false negatives) and false alarms (false positives) are equal. Cut-off scores can be determined in two ways. The simplest way is to choose the cut-off score with the highest accuracy (sensitivity + specificity). The other way is to consider the harm done by misses and false alarms (the costs of incorrect decisions), and thus the desirability of their prevention by choosing a lower or higher cut-off score. Lowering the decision cut-off score (i.e., increasing the tendency to deem the signal present based on the evidence) will yield more hits and fewer misses (y-axis of Figure 1), but also more false alarms and fewer correct rejections (x-axis of Figure 1). A higher decision cut-off score (i.e., decreasing the tendency to deem the signal present based on the same evidence) will yield fewer false alarms and more correct rejections (x-axis), but also more misses and fewer hits (y-axis). Likewise, prioritizing the benefits of hits or correct rejections in making decisions is characterized by trade-offs with misses and false alarms. It is these proportions of hits and false alarms for different cut-off scores that allow for normative allocation of weights to both types of correct and incorrect decisions.
We will demonstrate the application of SDT in detail for three scenarios with a data set from the context of student selection for a master’s program. For the readers interested in other higher education (research) topics, we provide several directions where SDT can be an adequate methodology in the last part of this paper.
Materials and equipment
An example from the student selection context
Selective university programs traditionally use regression analyses to obtain estimates of the predictive power of admissions tools, such as previous academic success (often operationalized as average grade) and scores on admissions tests of aptitudes (Kuncel et al., 2007; Zimmermann et al., 2018). By adding additional terms into regression equations (e.g., binary, quadratic), regression analyses also allow to establish whether adding these terms helps to optimize the model (i.e., improve its amount of explained variance in the data).
If previous academic success (i.e., average grade) is a valid predictor, which average grade (or cut-off score) demarcates a probably successful student from a probably not-successful student? Since most predictors are far from perfect, which types of incorrect decisions are more/less acceptable to the committee? In other words, how do we value admissions of applicants that later fail and the rejection of applicants that would have been successful? What cut-off score does the data prescribe? Regression analyses do not provide information on the consequences that follow from the inevitable application of these different cut-off scores, whereas SDT analyses do. SDT analyses provide an answer not only to the question which selection instruments or admissions tools are predictive for study success, but also how to use the selection instruments (that is, what cut-off score should be used).
In selection, the signal to detect most often is (any type of) study success. Note that in this context, the signal to be detected is not present or absent in the here and now, as it is in radar and diagnostics. In this context of student selection, indicators or predictors of future study success are signaling future study success at the time of application, analogous to what is aimed for with regression analyses.1 The noise is anything that prevents detectability of the applicants’ potential for study success. From a few months after commencement, students’ actual success can be compared to any chosen definition of study success, resulting in a classification of students as either successful or not-successful. At the time of application for a master’s program, certain dimensions of study success in the bachelor’s program (e.g., bachelor’s average grade) can be used as a predictor for the expected study success in the master’s program (e.g., master’s average grade). A total selection outcome consists of (the proportions of) two possible incorrect decisions together with two possible correct decisions (see Table 1). Each applicant turns out to be either successful or not-successful, and the retrospective, hypothetical, admission decision—after having awaited actual student success—is either correct or incorrect. “Admitted” students classified as successful are deemed hits and “rejected” students classified as successful are deemed misses (false negatives). “Admitted” students classified as not-successful are deemed false alarms (false positives) and “rejected” students classified as not-successful are deemed correct rejections.
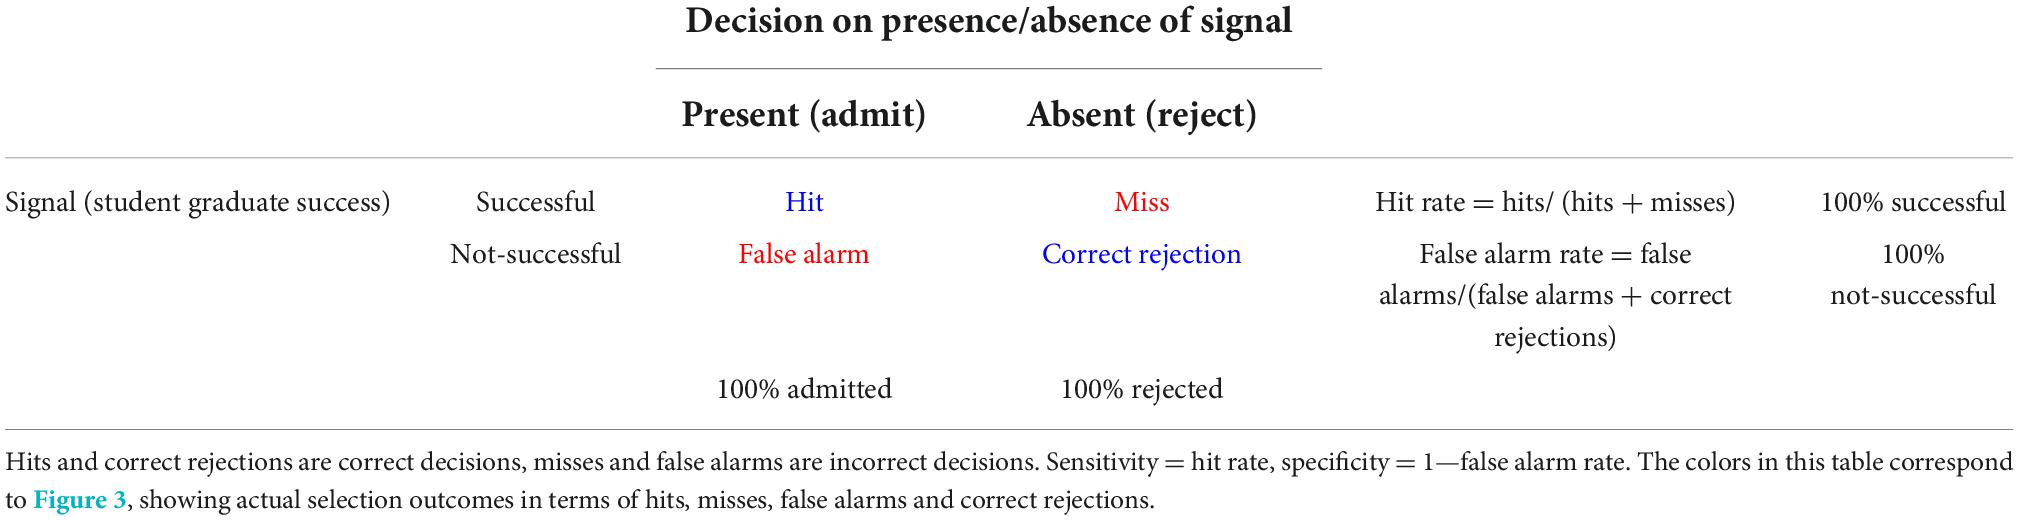
Table 1. The pay-off matrix of signal detection theory (SDT) applied to admission decisions.
In case of selective admissions with a maximum number of to-be-enrolled applicants, the cut-off score is determined by that maximum number that corresponds to a bias to admit applicants (likely in case of a high maximum number and low stakes selection), or to a bias to reject applicants (likely in case of a low maximum number and high stakes selection). Monitoring the resulting rates of hits/misses and false alarms/correct rejections may inform renewal of this and related policies, such as the alignment of admissions instruments with program content and assessment.
Methods
Selection scenarios
In the context of selective admissions to higher education programs, information on the proportions of correct and incorrect selection decisions allows monitoring the effects of current selection practices. This information may suggest evidence-informed adjustments on how to use selection instruments. Importantly, we address accuracy (validity) of selection instruments at a level of decision-making regarding admitting or rejecting specific applicants, that is at an individual level (van Ooijen-van der Linden et al., 2018). In a wider context, the selection procedure as a whole should be evaluated not only on validity and reliability of the selection instruments but also additional criteria such as fairness, legality, educational impact etc. (Patterson and Ferguson, 2010), which are outside of this paper’s scope.
We describe three scenarios that are representative of different selection contexts (see Table 2). Scenario 1 is an admissions bias scenario in which a selection committee wishes to avoid rejecting applicants who could become successful, at the cost of accepting more applicants who are likely to not become successful. The primary focus here is on a high sensitivity, that is a high hit rate. Scenario 2 is a rejection bias scenario in which the selection committee prefers to reject applicants who are likely not going to be successful, at the cost of also rejecting a substantial number of applicants who would have become successful. Here, the primary focus is on high specificity (i.e., a low false alarm rate). In scenario 3, the selection committee prefers a bias-free selection outcome, with sensitivity and specificity balanced. In perfect balance, the hit rate is equal to 1 minus the false alarm rate, which means having equal proportions of both types of incorrect decisions (misses and false alarms, the “no bias” line in Figure 1). Scenarios 1 and 3 are likely to fit selection contexts where a fixed number of admissions was decided upon because the available capacity of buildings or teaching teams requires some control of cohort size, but where the admissions rate is nevertheless high. Scenario 2 fits selection contexts where much or specific control over cohort size or composition is deemed necessary, such as honors programs and other programs focusing on excellence.
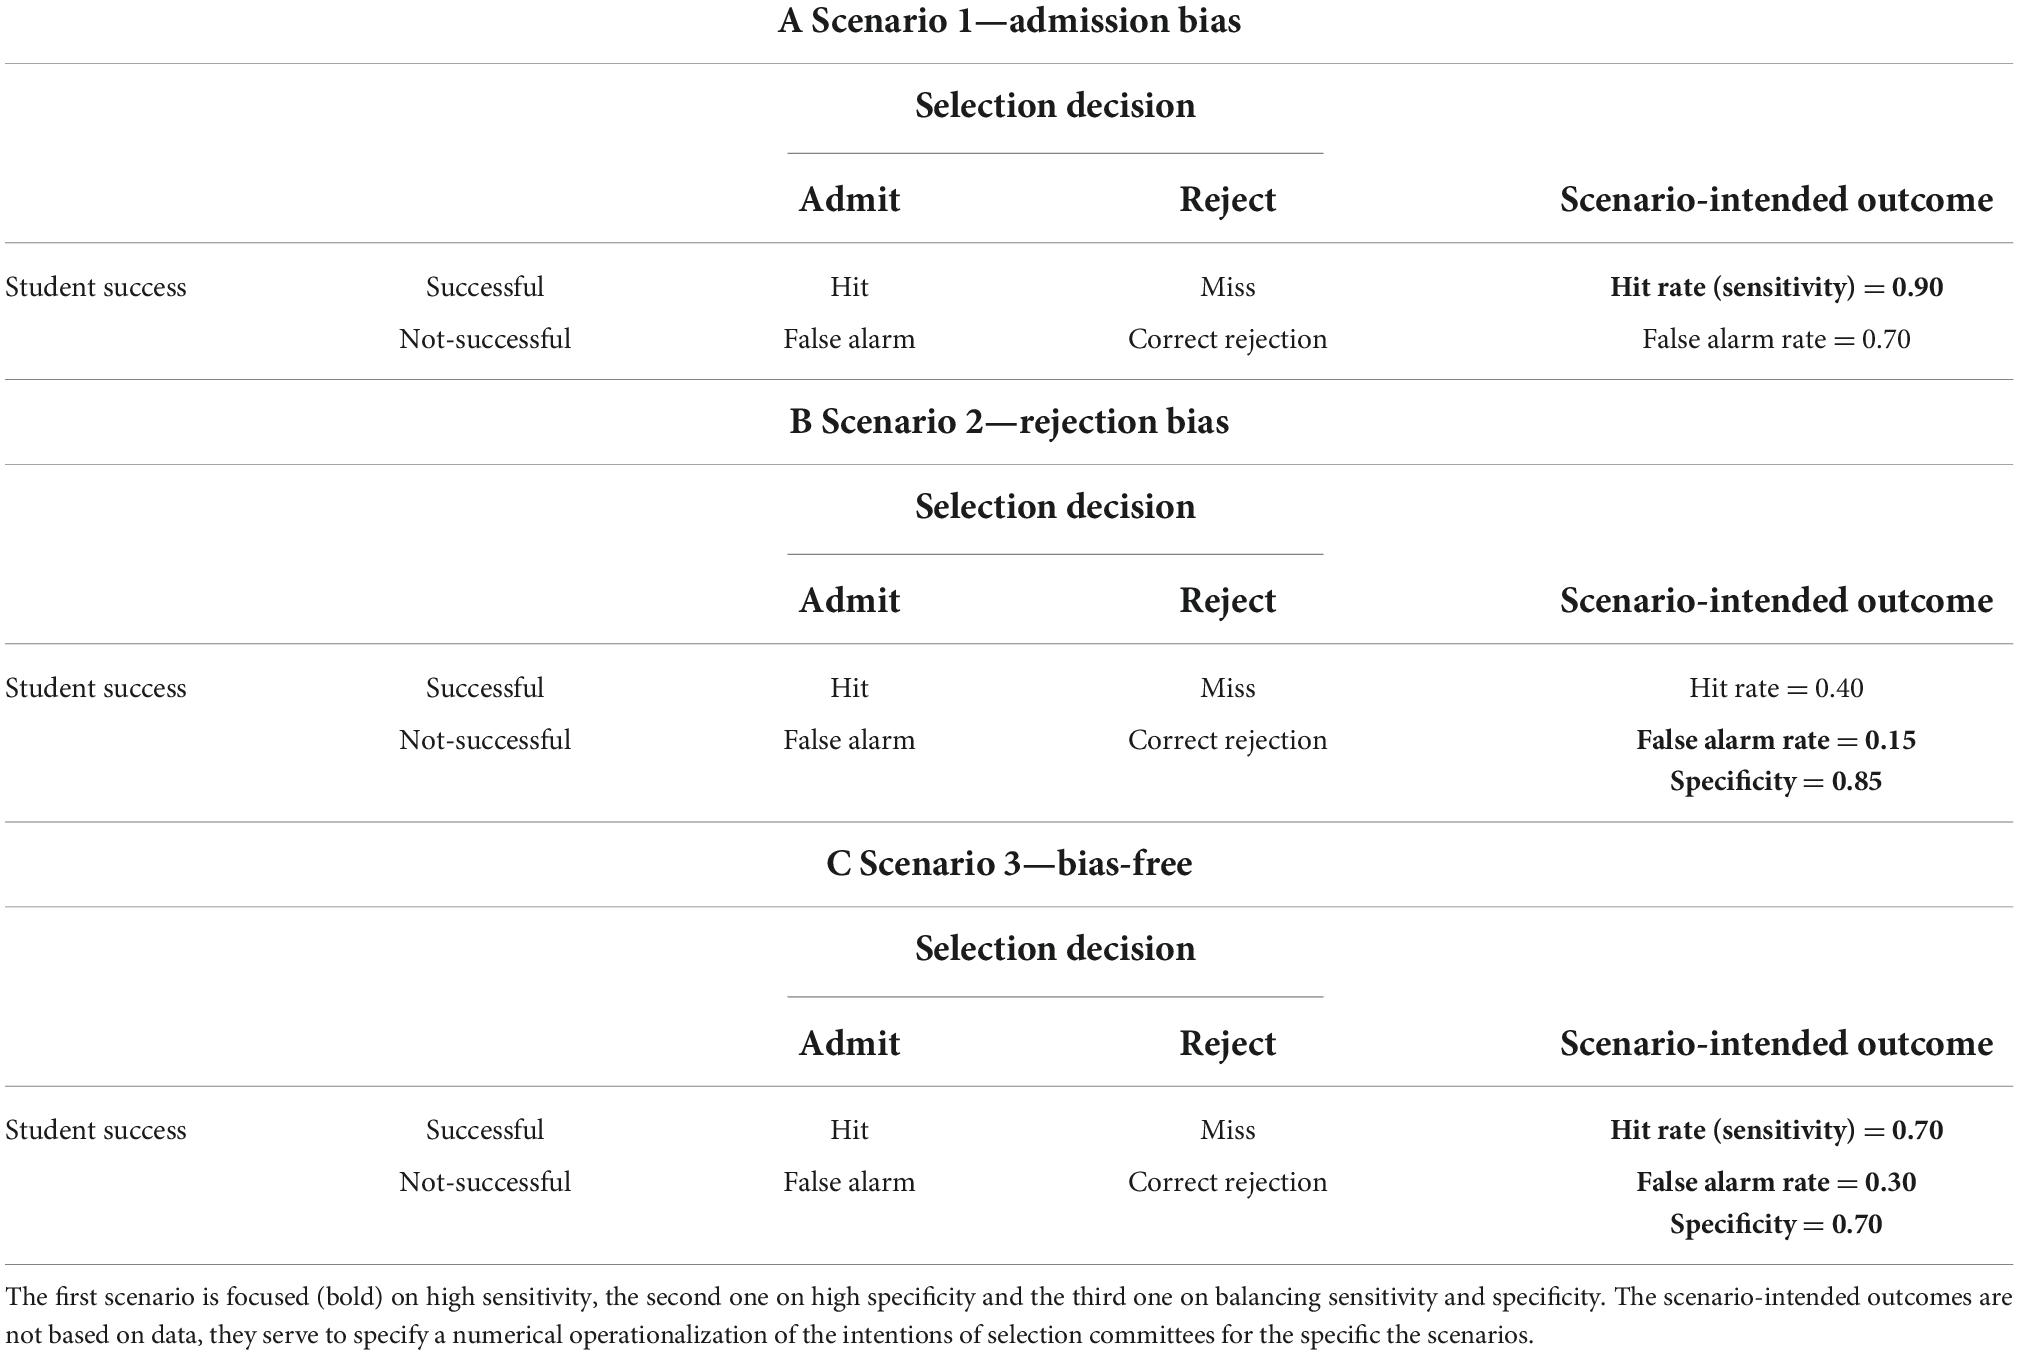
Table 2. Three possible selection scenarios.
Demonstration of application of signal detection theory in student selection
The data for this demonstration comes from six cohorts of masters’ students at a master’s program with a focus on learning to conduct research in the life sciences. The students started their master’s program in six consecutive years and the nominal study duration is 2 years. Average acceptance rate at this master’s program is high: 87% (ranging from 78 to 100%). We excluded cases of applicants for whom information was missing. We ended up with a sample size of 145 students. The demographic characteristics of the sample as well as the descriptive statistics of the variables are presented in Supplementary Table 1. Note that this paper’s purpose is to demonstrate the use of SDT in decision making in higher education, with student selection as an example. The reader is referred to the literature on admission and selection for details on selection instruments in specific contexts (Steenman et al., 2016; Wouters et al., 2016; Niessen et al., 2018; Kurysheva et al., 2019, 2022).
Three variables of interest in this demonstration, bachelor’s average grade, bachelor’s thesis grade and master’s average grade are given on a Dutch scale from 1 to 10. In this scale, a grade of 5.5 is considered as a “pass.” A grade of 9 is given in exceptional cases and a grade of 10 is almost never given. Students were classified as successful or not-successful based on the median of the students’ average grade in the master’s program, which was 7.7 in this sample. In other words, we chose the definition of graduate study success as having a master’s average grade in the top 50% in these cohorts. Note that this operationalization of study success is chosen for demonstration purposes. Like any other operationalization of study success would, this denotes the signal to be detected. The SDT analyses are used to discriminate between students with a master’s average grade in the upper half of the sample distribution (≥ 7.7) and students with a master’s average grade in the lower half (< 7.7). Any other operationalization of study success could have been chosen. Note that ROC curves for different operationalization’s of study success could be compared.
It is important to note that the chosen operationalization of study success as an average master’s grade ≥ 7.7 is the operationalization of the outcome measure (and not the application of a selection cut-off score). The cut-off score is the predictor value to which measured predictor values (in this example, individual student’s bachelor’s average grade or thesis grade) are compared.
The analyses were run in SPSS. However, SDT analysis can be done in any other computer package, including R, Microsoft Excel, Mathematica, Minitab, Quattro Pro, SAS, SYS-TAT, and Stata, because it is based on basic mathematical equations.
Results—Outcomes of demonstrative selection
The which question
First, we describe how both regression analyses and SDT analyses answer the question which selection instrument to use. The regression analysis in Supplementary Table 2 shows that bachelor’s average grade and thesis grade both predict master’s average grade. Thesis grade was added first in the stepwise regression analysis, because there are indications that the most recent academic achievement is the most predictive of subsequent academic achievement (Dore, 2017; Zimmermann et al., 2018). In addition, the bachelor’s thesis is an element in the bachelor’s curriculum, which content-wise best matches the curriculum of this master’s program, as it is research-oriented. The model with only bachelor’s thesis grade as a predictor explains 14% of variance in master’s average grade. A more complete model would take overall study success during bachelor’s education, including the earlier parts of the bachelor’s program into account. So, in the second regression model bachelor’s average grade was added. The model results in 33% of explained variance in the master’s average grade. Notably, thesis grade loses its explanatory power in this second model.
The SDT analysis, conducted on the same data, brings us to the analogous conclusion (see Figure 2). The area under the curve for thesis grade is 0.67, and for bachelor’s average grade is 0.78 (both well above chance, that is 0.5). Bachelor’s average grade is the better predictor of the two, therefore we use it from here on in demonstrating how to make and adjust evidence-informed admissions decisions using SDT. Overall, running these two analyses demonstrates that both regression analyses and SDT analyses provide an answer to the which question.
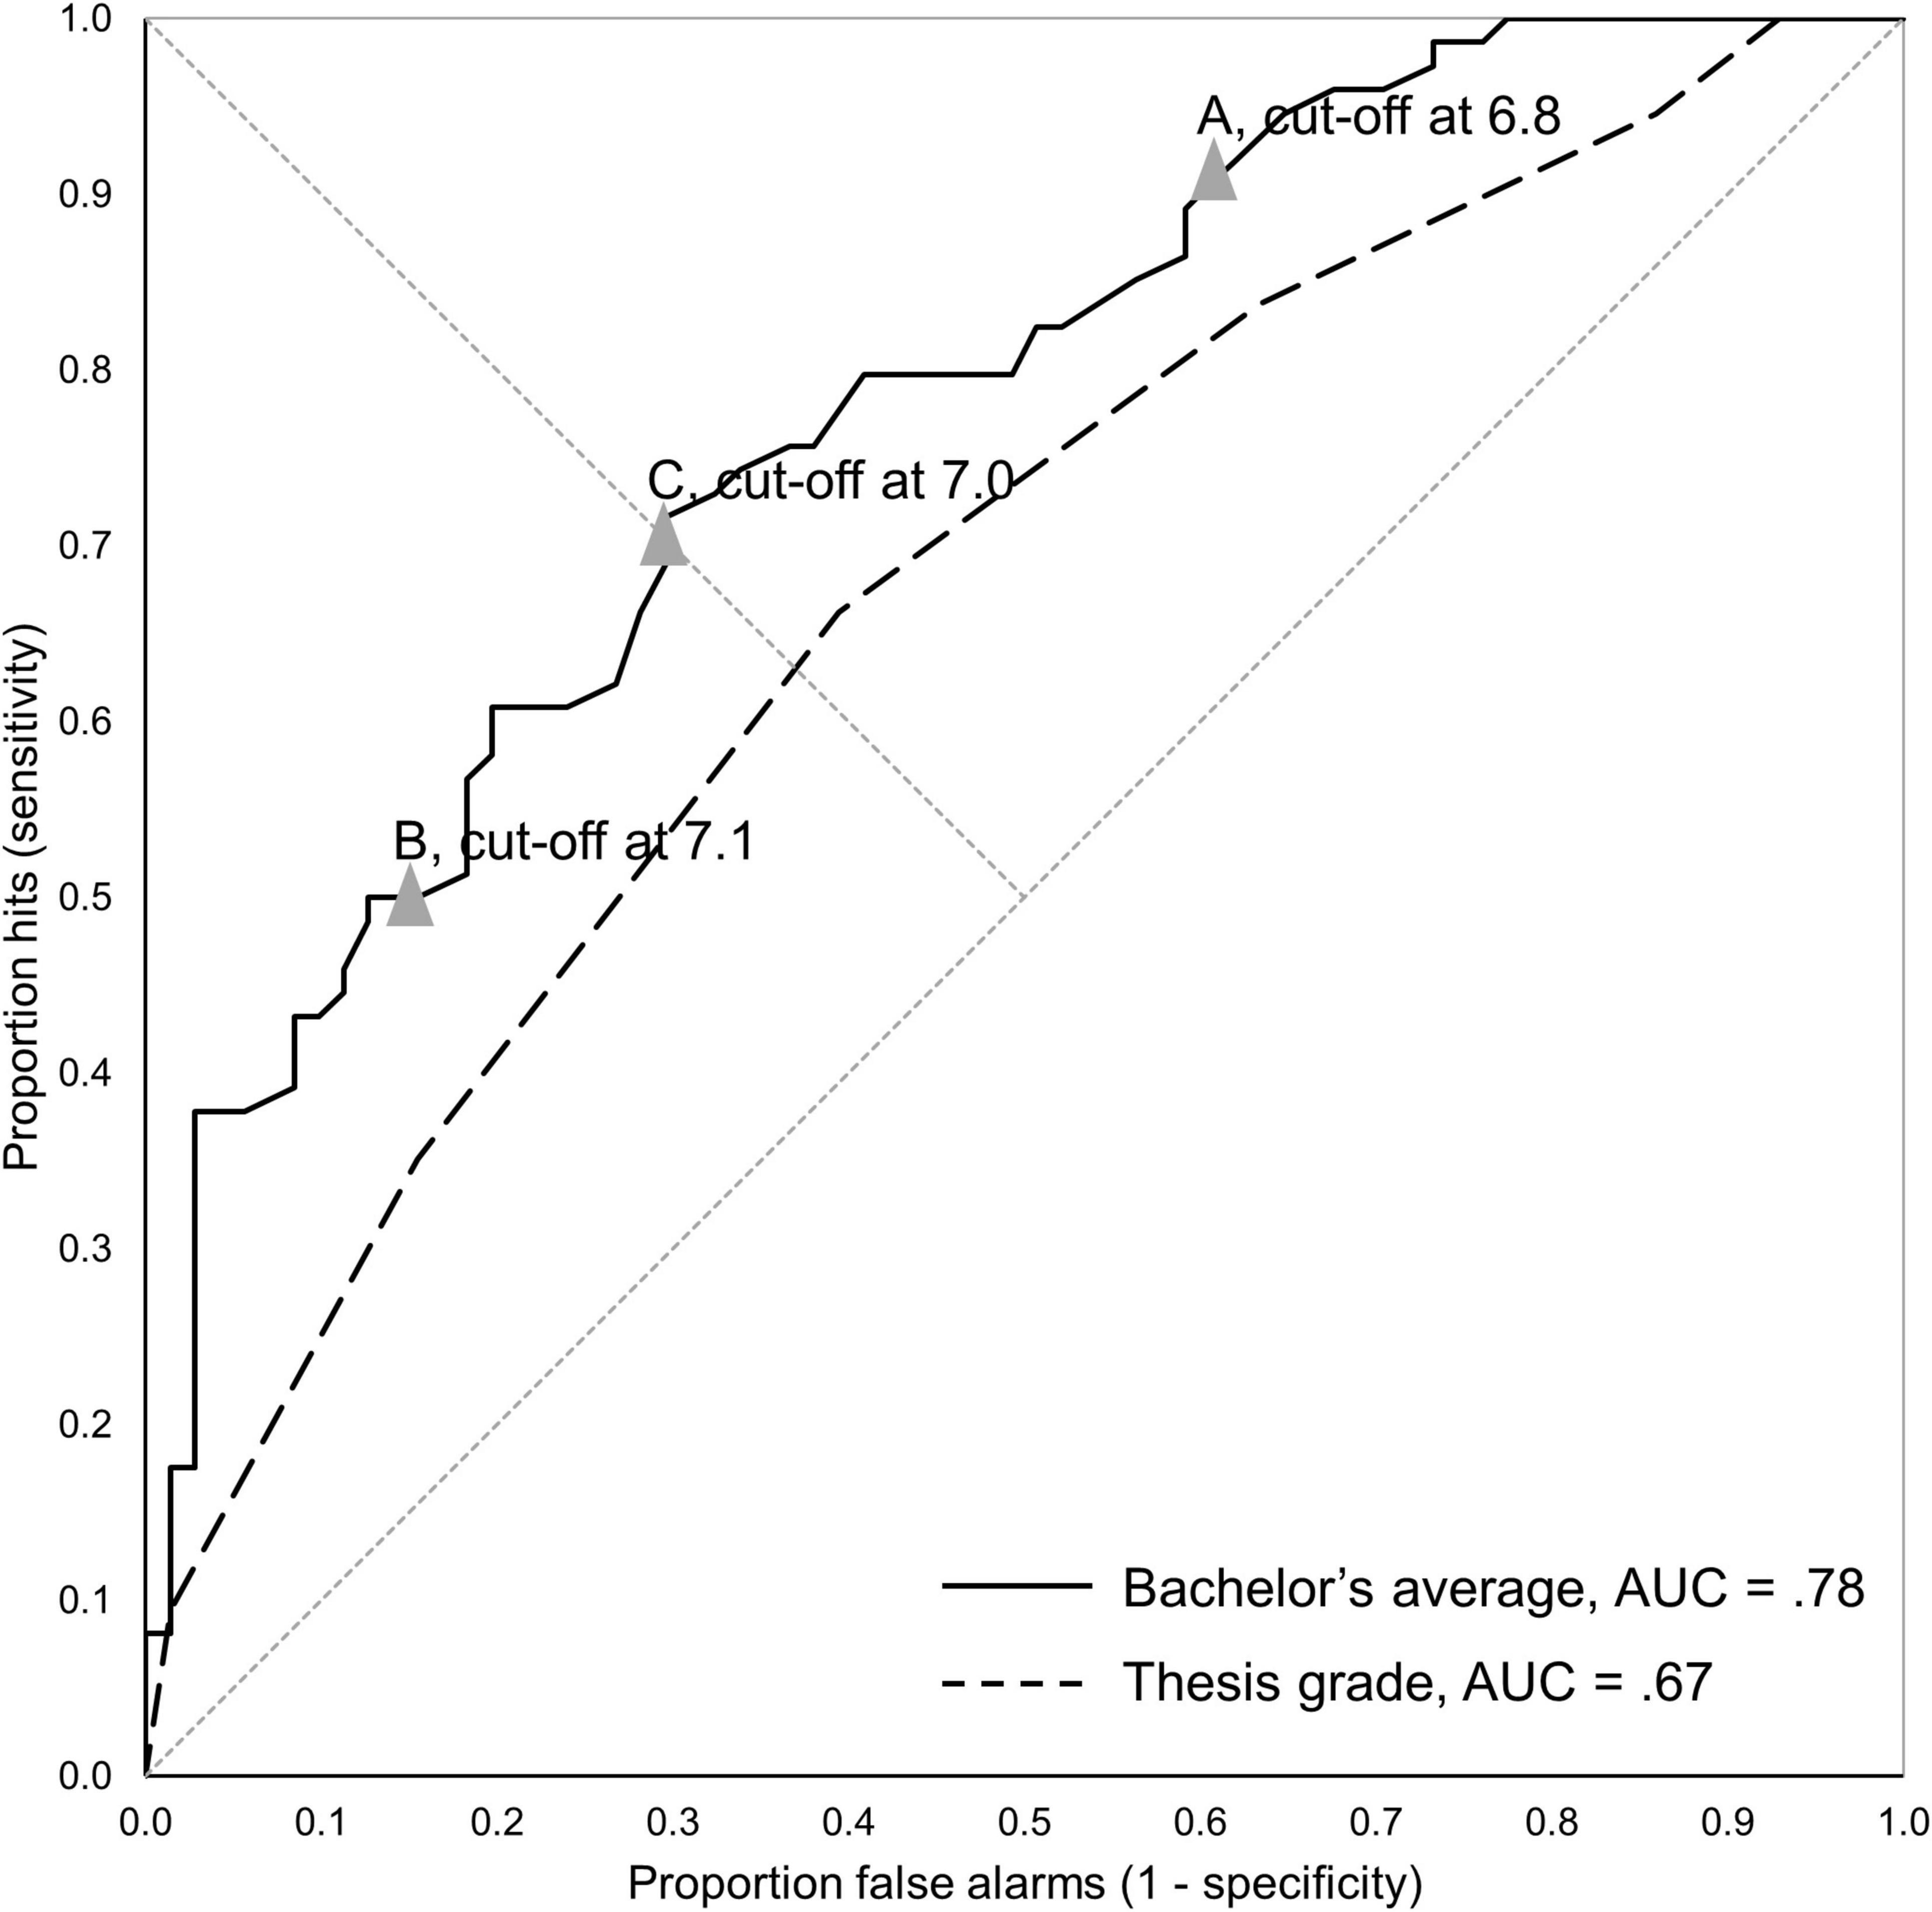
Figure 2. ROC-curves of demonstration data. ROC-curves of average bachelor grade and thesis grade with average master grade ≥7.7 as the definition of student success. Data points A, B, and C are the ones that correspond closest to the intended selection outcome as specified in Table 2. See also Figure 3 and Table 3.
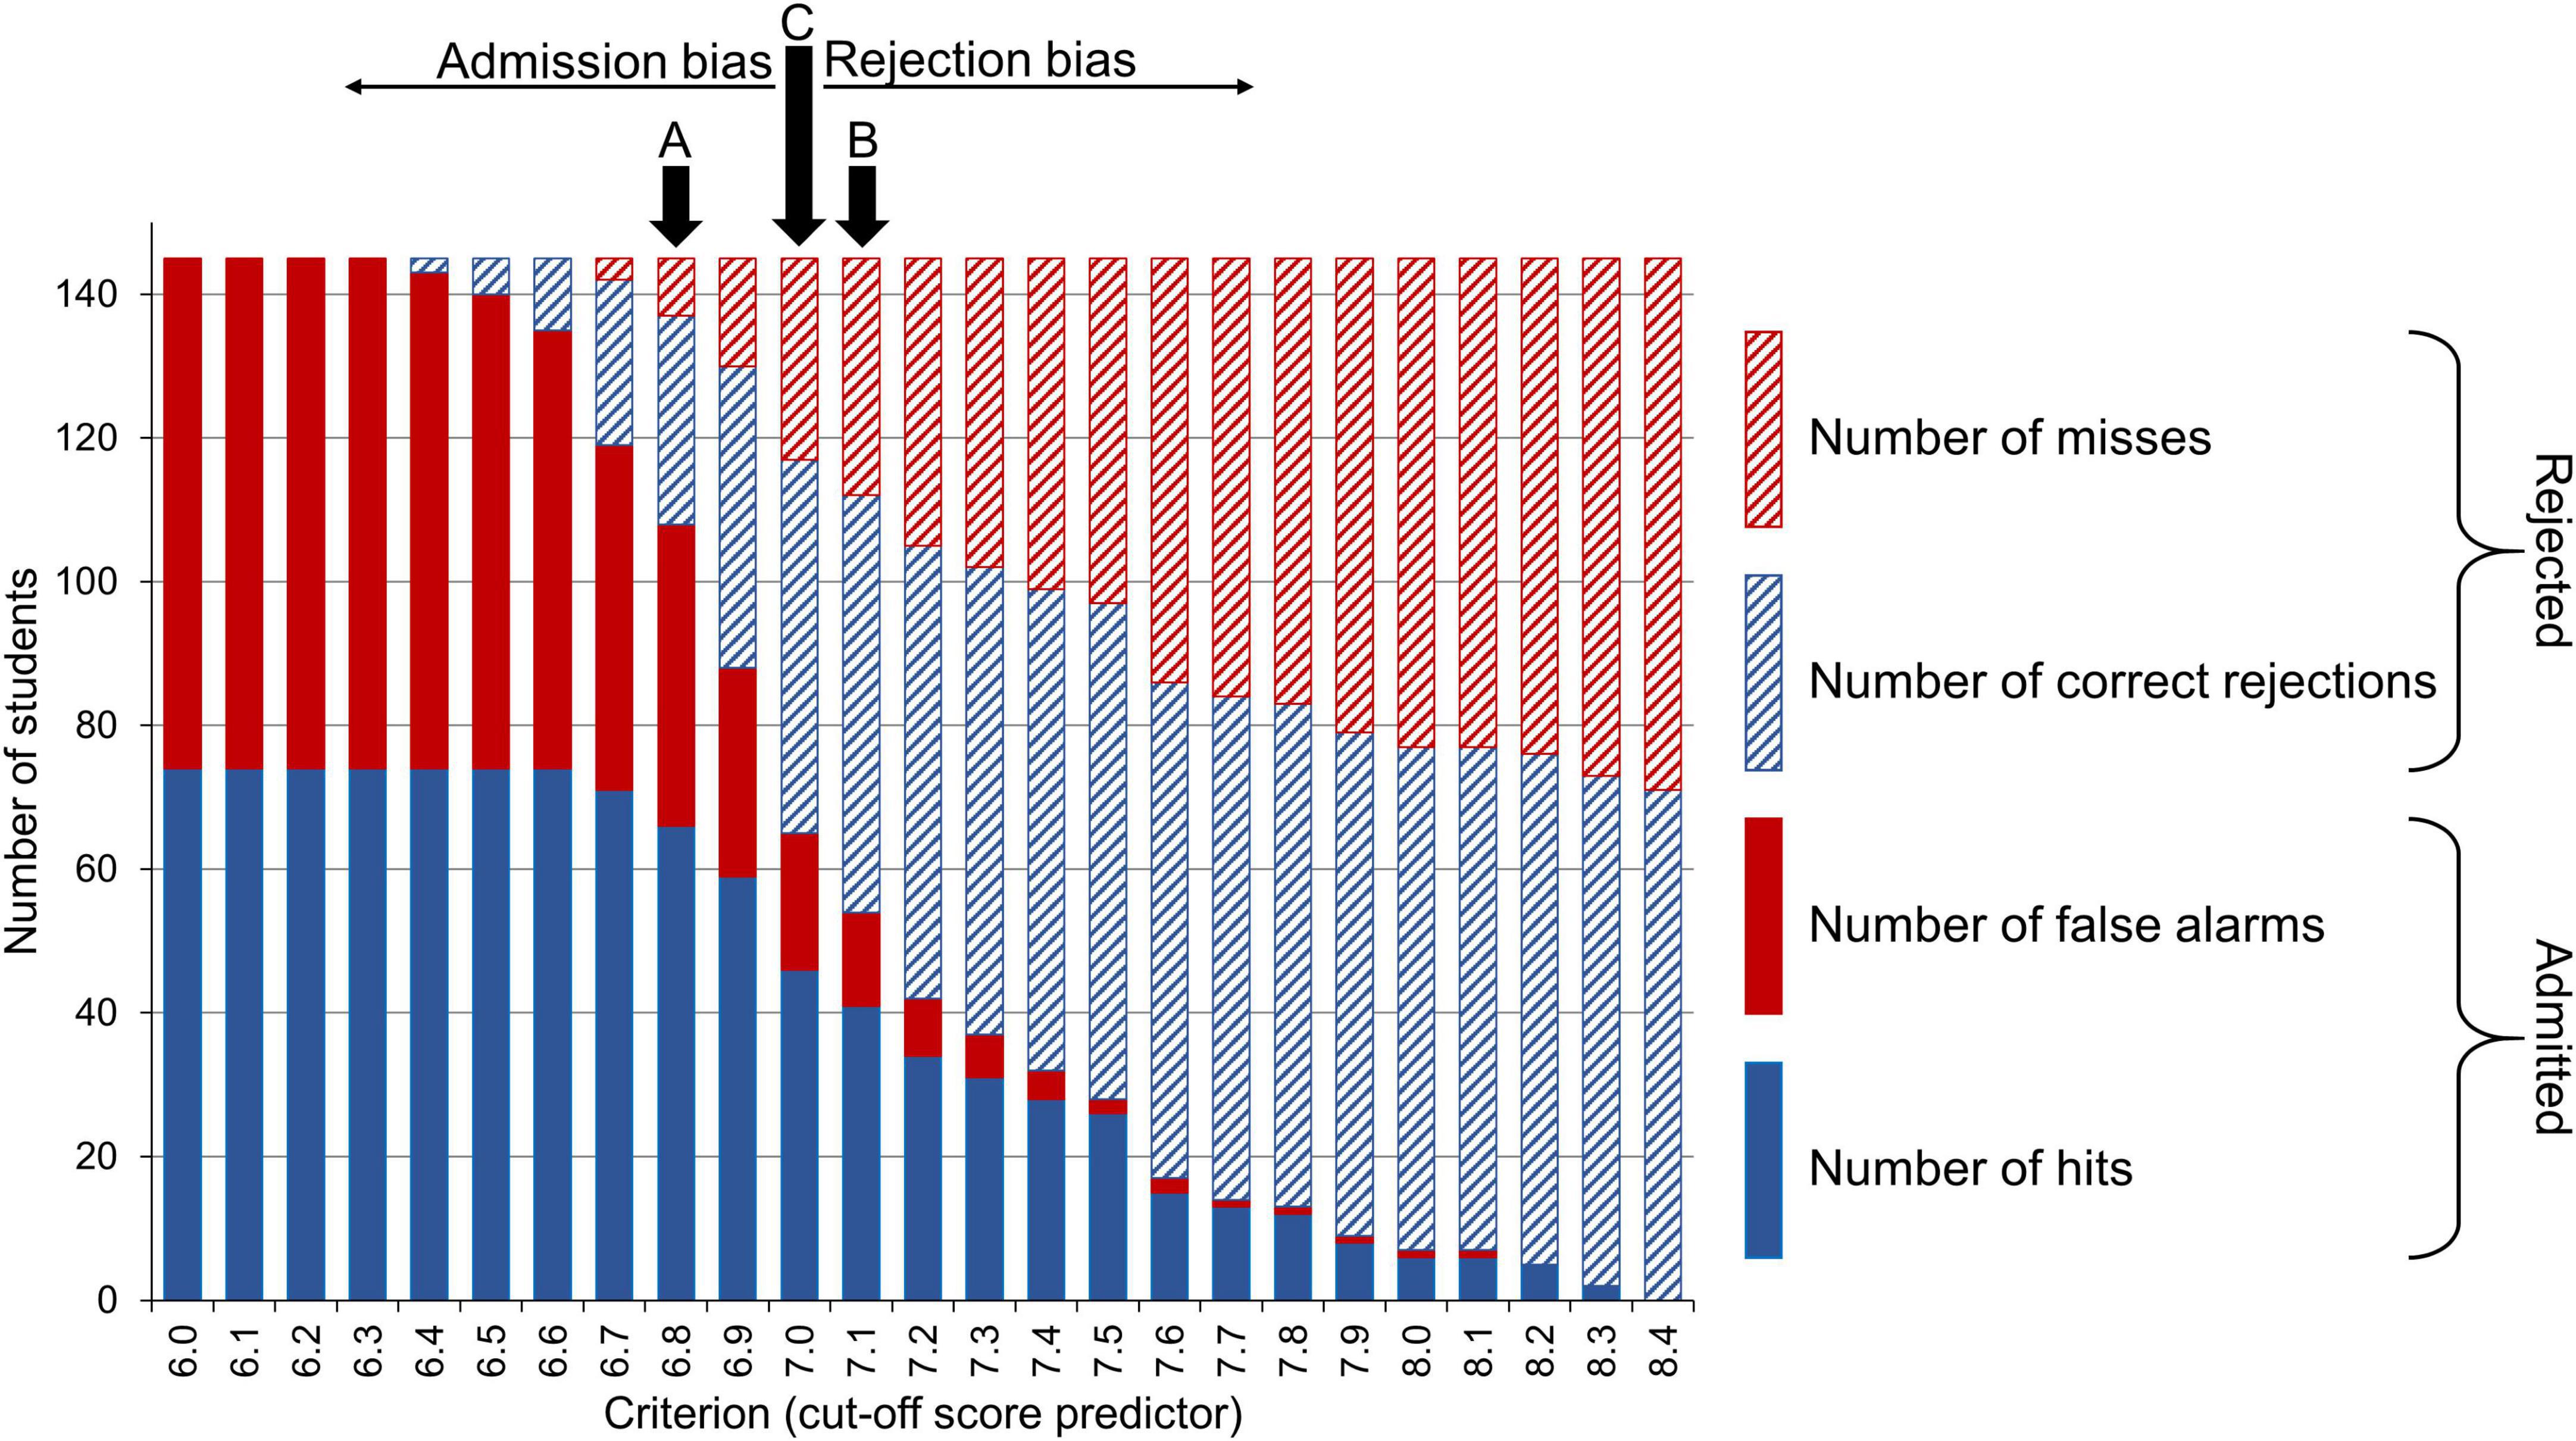
Figure 3. Distribution of selection outcomes in demonstration data. The proportions of hits, misses, false alarms, and correct rejections in the demonstration data and corresponding to the ROC-curve in Figure 2. Cut-off scores A, B, and C corresponds to the predictor cut-off scores in Table 3.
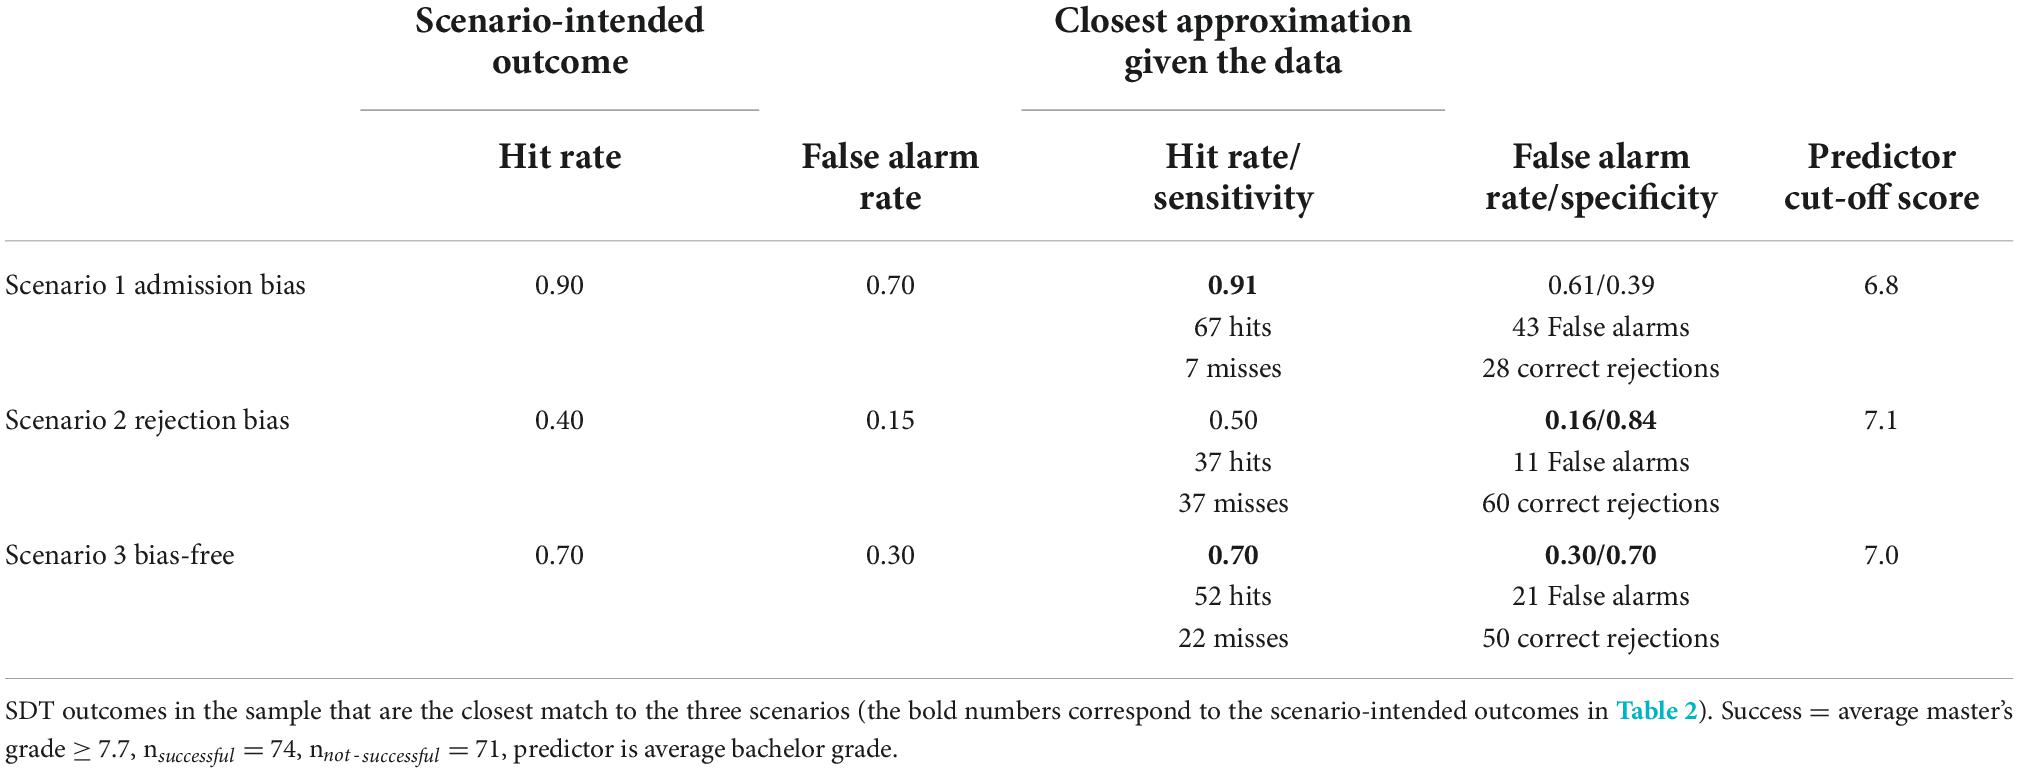
Table 3. Selection outcomes for the three possible scenarios.
The how question
In this subsection, we describe insights that only SDT analyses provide on how to apply the instrument(s) in selection decisions. In our demonstration, the study success definition (the signal to detect) was set to ≥ 7.7 out of 10 in the master’s program. For our sample, this means that of the 145 students 74 were deemed successful while 71 students were deemed not-successful in the program. This is the same for all three demonstration scenarios.
Scenario 1, admissions bias
In this scenario (see scenario 1 in Table 3, cut-off score A in Figures 2, 3), we set the intended admissions bias to admitting 90% of successful students, which would correspond to 66.6 (out of 74) students. This was rounded to 67 students (corresponding to 91% admissions). As a consequence, the seven successful students (9%) with the lowest bachelor average grade would not be admitted. As it turns out, the cut-off score demarcating admissions vs. rejection in this scenario is a bachelor average grade of 6.8 out of 10 (see Table 3). For this scenario, the obtained hit rate is 0.91. As stated above, only seven (9%) of the 74 successful students would have been rejected. Of the 71 not-successful students, this decision cut-off score would result in admitting 61% (43) of them while only 39% (28) would have been rejected. This means a false alarm rate of 0.61. For this scenario then, sensitivity is 91%, specificity is 39%. If this (high) false alarm rate (see Table 3) is deemed acceptable, the predictor cut-off score for admissions for the coming cohort(s) can be set at 6.8. If this false alarm rate is deemed too high (and specificity unacceptably low), though the primary focus was high sensitivity, a committee could decide to apply a higher cut-off score. Of course, lowering the false alarm rate (and enhancing specificity), also lowers the hit rate (sensitivity). High sensitivity comes with the cost of low specificity and vice versa. It is up to a committee to decide on the balance between the sensitivity and specificity.
Scenario 2, rejection bias
In this scenario the focus is on specificity (see scenario 2 in Table 3, cut-off score B in Figures 2, 3). We set the intended specificity to rejecting 85% of not-successful students, which in our sample corresponds to a cut-off score of 7.1 (bachelor’s average grade), reaching specificity of 84%. This comes with a false alarm rate of 0.16. Only 16% (11) of 71 not-successful students would have been admitted while the other 84% (60) would have been rejected. However, this cut-off score would also have resulted in rejecting 50% (37) of 74 of the (documented) successful students and admitting the other half of them (i.e., sensitivity is down to 50%, much lower than in scenario 1). If a miss rate of 0.50 is deemed acceptable, the admissions committee can prescribe a cut-off score of 7.1 for the coming cohort(s). If they think this level of sensitivity is too low (though the primary focus was on specificity), they could choose a lower cut-off score. This will lower the miss rate and accordingly heighten sensitivity, but at the cost of lower specificity. Whether the benefits of lowering the cut-off score in terms of sensitivity are deemed worth the cost in specificity is again up to the committee.
Scenario 3, bias-free
See scenario 3 in Table 3, and cut-off score C in Figures 2, 3 for an overview of this scenario. A bias free selection would in this sample be reached by setting the cut-off score at 7.0 (bachelor’s average grade). This cut-off score comes with a sensitivity (hit-rate) and specificity of 70% (false alarm rate of 0.30). In this scenario, 70% (52) of the 74 successful students would have been admitted and 30% (22) rejected. Of the 71 not-successful students, 30% (21) would have been admitted and 70% (50) rejected. Logically, these values are in between those for the admissions-bias and rejection-bias scenarios. If any of these numbers do not correspond to what the admissions committee deems desirable, these SDT analyses provide the information to adjust the cut-off score for the coming cohort(s) to steer toward obtaining the intended selection outcomes.
Discussion
In this study, we aimed to demonstrate the additional value of SDT for making inferences on the application of an instrument under study, compared to using the conventional regression analyses. We used a graduate selection procedure as an example. While both regression analyses and SDT analyses are equally fit to answer questions on which instrument(s) to use as predictors of student success, we demonstrated that the added value of SDT analyses lies in providing information whether a specific cut-off score results in an admissions bias, selection bias or bias-free selection outcome. This informs how to adjust the cut-off score in the coming cohort(s) to steer toward the intended selection outcome (i.e., the intended distribution of “hits,” “misses,” “false alarms,” and “correct rejections”).
Since intended outcomes are likely to vary across settings, depending on specific goals of different selection committees (focusing on higher sensitivity, higher specificity or a balance between the two), we introduced three core scenarios: “admissions bias,” “rejection bias,” and “bias-free.” For each scenario, we calculated the obtained distribution of hits, misses, false alarms, and correct rejections in a demonstrative sample of masters’ students in a selective program with a high acceptance rate and demonstrated how these results could be used to adjust the cut-off score(s) for the coming cohort(s), given the goals of the selection committee. In this relatively small sample, admissions cut-off scores within a small range—6.8, 7.0, and 7.1—resulted in different selection outcomes, demonstrating an admissions bias, no bias, and a rejection bias. Thus, deliberately choosing a scenario, and evaluating selection outcomes in terms of the intended and obtained (lack of) bias provides the evidence base to decide which cut-off score most likely best fits the intended selection outcomes. It is important to note that the ability to discriminate between applicants who will and will not become successful, does not differ at all between the three described scenarios: The scenarios describe different points on the same ROC curve, visualizing this instrument’s accuracy.
To improve discriminability of selection procedures, SDT analyses (via comparing AUCs of different instruments or combinations thereof) and regression analyses (comparing R2 statistics of these instruments) can be equally useful. Clearly, regression analyses are not the only possibility to explore predictive validity of instruments. Additional advanced statistical techniques such as correction of correlations for indirect range restriction, reliability estimation, cross-validation, bootstrapping, and approaches to variable selection that rely upon partial correlations have been described to make results on selective admissions methods more reliable and robust (Niessen et al., 2018; Zimmermann et al., 2018). The interpretation of the results, however, still stays within the percentage of explained variance, answering the question which instruments are (the most) valid, but not how to use them. That is the unique answer SDT analyses can provide.
Strengths of the signal detection theory approach
The main strength of the SDT methodology is that decision makers can inform themselves of the effects of specific applications of specific instruments. In our example, a selection committee aiming to prevent rejecting students that would have become successful should set the admissions cut-off score at 7.0 out of 10 at most. Please note that SDT analyses allow working with any combination of predictors. Comparable to explained variance in regression analyses, SDT allows comparison of AUCs and calculation of confidence intervals (see Robin et al., 2011, and van Ooijen-van der Linden et al., 2017, 2018).
It would also be informative to run further analyses with a master’s average grade of for example ≥ 6.6 out of 10 or graduating/not graduating (in time) as definition of study success. For these different operationalizations of study success, different predictor cut-off scores may be needed to obtain a comparable selection outcome: Predictors yield their own results in terms of accuracy and effects of cut-off scores for specific operationalizations of study success.
As another example, one could investigate the average weekly self-study time as a predictor of several types of study success in a master’s program. Through providing information on sensitivity, specificity, and decision outcomes resulting from specific cut-off scores, SDT allows to go beyond describing the results obtained with certain instruments by prescribing how to use them the next time. Herein lies its added value in comparison with regression analyses.
Besides the “hard” decisions described so far in which SDT analyses provide valuable information, they can also be used to provide evidence-informed advice. If a body of knowledge has been obtained on which cut-off scores (of which tools, after having established their predictive validity) predict which forms of success or failure, this could be used to timely signal risks and take appropriate measures. For example, if data of several cohorts of students reveal that students who pass more than x courses with just-passing grades for writing assignments are likely to need extra time for their final thesis, students could be timely informed and discuss appropriate action with their tutor.
Limitations of the signal detection theory approach
The effects of specific cut-off scores on decision outcomes will only be fully visible with full samples: One first needs to test the instruments and cut-off scores without rejecting applicants before performing actual selection, because instruments need to be validated in samples that represent the population they were drawn from. However, something similar holds if you would apply regression analyses on a selected sample. If the data of applicants with specific predictor scores are excluded from analyses, the sample is biased.
In the same line of reasoning, inferences based on SDT can be limited in their generalizability, if some data is not available; in our demonstration sample thesis grades for some students were not available, and therefore their data were not included into the SDT analysis. However, this is also a general issue in evidence-informed decision and policy making, not specific for SDT. The (im)possibilities of data providing solutions depend on the available data in each specific case. In our example, a partial solution could be to build up larger program and university specific databases over time.
Potential of signal detection theory in higher education (research)
We demonstrated the application of the SDT methodology in the context of decision-making on graduate admissions, that is, on the individual student level. However, SDT can be applied beyond this, on the level of a course or program. It could be applied to test the effect of smaller assignments across a course compared to one big overarching assignment on students’ performance. SDT analyses data will show if introduction of smaller, but regular assignments, improves performance (the which question), and also how many smaller regular assignments are needed for the required performance (the how question). At the program level, SDT could be used to investigate experienced competence (Dweck, 2017) by students after different semesters in which staff and students collaborate on one-to-many decisions on material and pedagogical approach. SDT analyses will answer the question if this collaboration affects experienced competence (the which question) but also how much collaboration is needed for a specific level of experienced competence (the how question).
Apart from student performance or experience (at individual, course, or program level), SDT analyses could also be applied to staff performance, again at the individual, department, or even institute level. For example, when hiring professors, the departments are usually interested in examining which prior academic records (such as h-index, altmetrics of researcher’s work, efforts to promote open science, commitment to teamwork, number of obtained grants, the size of research group, experience in teaching, the results of a presentation, and interview with the appointment committee) are predictors of expected outcomes for a professorship position. As in all SDT analyses, the task of utmost importance would be to clearly define the expected outcomes and to discern sufficient levels from insufficient levels. Defining the expected outcomes of academics can require substantial thought and elaboration, considering the emerging movement on prioritizing open-access publishing, data sharing, and public engagement over widely accepted metrics of research output such as number of published papers and h-index (Woolston, 2021). If the outcome would, for example, be defined as the percentage of papers published open-access relative toward the overall number of papers in the last 5 years to be at least 50%, the SDT approach can be used to see if any of prior academic records are predictive for adherence to open science (the which question) and what cut-off scores to use in selection of professors (the how question).
The same reasoning and methods would apply to the (collaborative) performance of a department or institute. If a governing body would want to increase open-access publishing, as is a current process at many European universities (Mering, 2020; Woolston, 2021), it perhaps should want to determine whether interventions such as reimbursements for open-access fees (and how much) have the intended effect. The governing body can set up an experiment where different departments (or all departments but in different periods) receive a reimbursement of a specific percentage of the cost. They would set a specific goal for a specific time frame (e.g., 50% more open access publications) and determine the percentage of open-access cost reimbursement (the cut-off score) that is needed to achieve this performance. Whether reimbursement sufficiently reinforces open-access publications is the which question. SDT analyses would also answer the question how much reimbursement would be necessary to reach the goal.
Next, we turn to an example on funding, that could be, again, on the individual, department, or university level. The example on the individual or department level is on making decisions on assignment of grants to researchers, their research groups, or departments. Many teams have difficulties to complete the projects as described in their proposed plan. One of the reasons for this struggle might be that proposed plans for research projects often contain idealistic numbers of outcomes (such as papers, seminars etc.), which are hard to implement within the limited funded time. The predictive capacity of certain features of a research proposal could be used to predict whether the research projects will actually be implemented within the expected time limit. For example, the cut-off number of proposed sub-projects could be established, at which the research plan becomes usually unrealistic and most likely will not meet the expected deadline. These calculations can assist funding agencies to assign grants to projects, which are ambitious but still realistic.
An example on the institutional or even national level deals with the fact that tertiary education usually receives funding from three main sources: Basic state funding, third-parties funding, and tuition fees (Hüther and Krücken, 2018). In different higher education systems, the interplay of these three sources varies and develops distinctively across time. The effects of these three different sources of funding on different outcomes can be explored. For example, would an increased percentage of tuition fees in total funding received by universities ensure a certain number of teachers’ hours and availability for student supervision? Analyzing data from (inter-) national reports, could deliver answers both to the which question (e.g., if an increase in tuition fees is related to increased student supervision hours) and the how question. For example, what would be the minimum tuition fee, in euros, for having the desired teachers’ supervision hours available per student?
Conclusion
Beyond determining instrument validity, SDT allows monitoring the effects of instruments and deliberate changes in policy, didactics, or pedagogy, tailoring their use to optimize approximation of valued goals. In addition to answering the question on which instrument(s) should be used to make a decision, SDT allows to answer the question on how they should be used by establishing adequate cut-off scores. The adequacy of cut-off scores depends on decision makers’ reasoning to give preference to sensitivity (i.e., higher hit rate), or specificity (i.e., lower false alarm rate), or neither of them (balancing sensitivity and specificity). To illustrate the effects of these three core decision options, or scenarios, we used an example of decision-making in selective admissions to a graduate program. It is important to note that the unique potential of SDT can be applied to several other higher education research topics and decision-making processes, ranging from the individual (staff or student) to the institutional level.
Data availability statement
The data analyzed in this study is subject to the following licenses/restrictions: The original data set is pseudonymised and contains indirectly identifiable information on participants such as grades. Requests to access these datasets should be directed to the corresponding author.
Ethics statement
The studies involving human participants were reviewed and approved by the Netherlands Association for Medical Education Ethical Review Board (dossier number: 2019.8.2). Written informed consent for participation was not required for this study in accordance with the national legislation and the institutional requirements.
Author contributions
AK collected the data. AK and LO-V analyzed the data. All authors of the article contributed to the main question and design, and contributed equally to the writing of the manuscript.
Funding
This study received Internal Institutional Funding.
Acknowledgments
We would like to thank Spiros Pachis and Christine Merie Fox for proofreading the final version of this article.
Conflict of interest
The authors declare that the research was conducted in the absence of any commercial or financial relationships that could be construed as a potential conflict of interest.
Publisher’s note
All claims expressed in this article are solely those of the authors and do not necessarily represent those of their affiliated organizations, or those of the publisher, the editors and the reviewers. Any product that may be evaluated in this article, or claim that may be made by its manufacturer, is not guaranteed or endorsed by the publisher.
Supplementary material
The Supplementary Material for this article can be found online at: https://www.frontiersin.org/articles/10.3389/feduc.2022.906611/full#supplementary-material
Footnotes
- ^ It is important to note that, as is the case for regression, it is preferable to use at least one cohort that is in fact not selected, to be able to gain insight in the predictive value of an instrument across its entire range and which cut-off score to use with this instrument in the future.
References
Boutis, K., Pecaric, M., Seeto, B., and Pusic, M. (2010). Using signal detection theory to model changes in serial learning of radiological image interpretation. Adv. Health Sci. Educ. 15, 647–658. doi: 10.1007/s10459-010-9225-8
Dandachi-FitzGerald, B., and Martin, P. K. (2021). “Clinical judgement and clinically applied statistics: Description, benefits, and potential dangers when relying on either one individually in clinical practice,” in Validity Assessment in Clinical Neuropsychological Practice: Evaluating and Managing Noncredible Performance, eds R. W. Schroeder and P. K. Martin (New York, NY: The Guilford Press).
Dore, M. L. (2017). Factors in the Admissions Process Influencing Persistence in a Master’s of Science Program in Marine Science, Ph.D thesis, Fort Lauderdale: Nova Southeastern University.
Dweck, C. S. (2017). From needs to goals and representations: Foundations for a unified theory of motivation, personality, and development. Psychol. Rev. 124, 689–719. doi: 10.1037/rev0000082
Gigerenzer, G., and Gaissmaier, W. (2015). “Decision making: Nonrational theories,” in International Encyclopedia of the Social & Behavioral Sciences, ed. J. D. Wright (Amsterdam: Elsevier), 911–916. doi: 10.1016/B978-0-08-097086-8.26017-0
Green, D. M., and Swets, J. A. (1966). Signal Detection Theory And Psychophysics. New York, NY: Wiley.
Hüther, O., and Krücken, G. (2018). Higher education in Germany—recent developments in an international perspective. Vol. 49. Higher Education Dynamics. Berlin: Springer International Publishing. doi: 10.1007/978-3-319-61479-3
Inoue, C., and Bellezza, F. S. (1998). The detection model of recognition using know and remember judgments. Mem. Cogn. 26, 299–308. doi: 10.3758/BF03201141
Kuncel, N. R., Credé, M., and Thomas, L. L. (2007). A meta-analysis of the predictive validity of the Graduate Management Admission Test (GMAT) and Undergraduate Grade Point Average (UGPA) for graduate student academic performance. Acad. Manag. Learn. Educ. 6, 51–68. doi: 10.5465/amle.2007.24401702
Kurysheva, A., Koning, N., Fox, C. M., van Rijen, H. V., and Dilaver, G. (2022). Once the best student always the best student? Predicting graduate study success, using undergraduate academic indicators. Evidence from research masters’ programs in the Netherlands. Int. J. Sel. Assess. 1–17. doi: 10.1111/ijsa.12397
Kurysheva, A., van Rijen, H. V. M., and Dilaver, G. (2019). How do admission committees select? Do applicants know how they select? Selection criteria and transparency at a Dutch University. Tert. Educ. Manag. 25, 367–388. doi: 10.1007/s11233-019-09050-z
Macmillan, N. A., and Creelman, C. D. (2005). Detection theory: A user’s Guide, 2nd Edn. Mahwah: Lawrence Erlbaum Associates.
Marcum, J. I. (1947). A Statistical Theory Of Target Detection By Pulsed Radar. Santa Monica: The Rand Corporation.
Mering, M. (2020). Open access mandates and policies: The basics. Ser. Rev. 46, 157–159. doi: 10.1080/00987913.2020.1760707
Niessen, A. S. M., Meijer, R. R., and Tendeiro, J. N. (2018). Admission testing for higher education: A multi-cohort study on the validity of high-fidelity curriculum-sampling tests. PLoS One 13:e0198746. doi: 10.1371/journal.pone.0198746
Nijboer, T. C. W., Kanai, R., de Haan, E. H. F., and van der Smagt, M. J. (2008). Recognising the forest, but not the trees: An effect of colour on scene perception and recognition. Conscious. Cogn. 17, 741–752. doi: 10.1016/j.concog.2007.07.008
Patterson, F., and Ferguson, E. (2010). “Selection for medical education and training,” in Understanding Medical Education: Evidence, Theory and Practice, ed. T. Swanwick (London: Wiley-Blackwell), 352–365. doi: 10.1002/9781444320282.ch24
Robin, X., Turck, N., Hainard, A., Tiberti, N., Lisacek, F., Sanchez, J.-C., et al. (2011). PROC: An Open-Source Package for R and S+ to analyze and compare ROC curves. BMC Bioinform. 12:77. doi: 10.1186/1471-2105-12-77
Selten, R. (1998). Aspiration adaptation theory. J. Math. Psychol. 42, 191–214. doi: 10.1006/jmps.1997.1205
Simon, H. A. (1984). Models Of Bounded Rationality, Volume 1: Economic Analysis And Public Policy. Cambridge, MA: MIT Press.
Simon, H. A. (1990). “Bounded rationality,” in Utility and Probability. The New Palgrave, eds J. Eatwell, M. Milgate, and P. Newman (London: Palgrave Macmillan), 15–18. doi: 10.1007/978-1-349-20568-4_5
Smolkowski, K., and Cummings, K. D. (2015). Evaluation of diagnostic systems. Assess. Eff. Interv. 4, 41–54. doi: 10.1177/1534508415590386
Stanislaw, H., and Todorov, N. (1999). Calculation of signal detection theory measures. Behav. Res. Methods Instrum. Comput. 31, 137–149. doi: 10.3758/BF03207704
Steenman, S. C., Bakker, W. E., and van Tartwijk, J. W. (2016). Predicting different grades in different ways for selective admission: Disentangling the first-year grade point average. Stud. High. Educ. 41, 1408–1423. doi: 10.1080/03075079.2014.970631
Tanner, W. P. Jr., and Swets, J. A. (1954). A decision-making theory of visual detection. Psychol. Rev. 61, 401–409. doi: 10.1037/h0058700
van Ooijen-van der Linden, L., van der Smagt, M. J., te Pas, S. F., and Woertman, L. (2018). A signal detection approach in a multiple cohort study: Different admission tools uniquely select different successful students. Front. Educ. 3:30. doi: 10.3389/feduc.2018.00030
van Ooijen-van der Linden, L., van der Smagt, M. J., Woertman, L., and te Pas, S. F. (2017). Signal detection theory as a tool for successful student selection. Assess. Eval. High. Educ. 42, 1193–1207. doi: 10.1080/02602938.2016.1241860
Woolston, C. (2021). Impact factor abandoned by Dutch university in hiring and promotion decisions. Nature 595:462. doi: 10.1038/d41586-021-01759-5
Wouters, A., Croiset, G., Galindo-Garre, F., and Kusurkar, R. A. (2016). Motivation of medical students: Selection by motivation or motivation by selection. BMC Med. Educ. 161:37. doi: 10.1186/s12909-016-0560-1
Keywords: signal detection theory, higher education, decision making, research methods, student selection, methodology, quality assurance, evidence-informed policy
Citation: Kurysheva A, van Ooijen-van der Linden L, van der Smagt MJ and Dilaver G (2022) The added value of signal detection theory as a method in evidence-informed decision-making in higher education: A demonstration. Front. Educ. 7:906611. doi: 10.3389/feduc.2022.906611
Received: 11 April 2022; Accepted: 04 October 2022;
Published: 20 October 2022.
Edited by:
Eduardo Cascallar, KU Leuven, BelgiumReviewed by:
Herman Johann Visser, University of South Africa, South AfricaVanessa Scherman, University of South Africa, South Africa
Copyright © 2022 Kurysheva, van Ooijen-van der Linden, van der Smagt and Dilaver. This is an open-access article distributed under the terms of the Creative Commons Attribution License (CC BY). The use, distribution or reproduction in other forums is permitted, provided the original author(s) and the copyright owner(s) are credited and that the original publication in this journal is cited, in accordance with accepted academic practice. No use, distribution or reproduction is permitted which does not comply with these terms.
*Correspondence: Anastasia Kurysheva, YS5rdXJ5c2hldmFAdW1jdXRyZWNodC5ubA==
†These authors share first authorship