 Manqian Liao
 Yigal Attali
 J. R. Lockwood
 Alina A. von Davier
- Duolingo, Pittsburgh, PA, United States
Digital-first assessments are a new generation of high-stakes assessments that can be taken anytime and anywhere in the world. The flexibility, complexity, and high-stakes nature of these assessments pose quality assurance challenges and require continuous data monitoring and the ability to promptly identify, interpret, and correct anomalous results. In this manuscript, we illustrate the development of a quality assurance system for anomaly detection for a new high-stakes digital-first assessment, for which the population of test takers is still in flux. Various control charts and models are applied to detect and flag any abnormal changes in the assessment statistics, which are then reviewed by experts. The procedure of determining the causes of a score anomaly is demonstrated with a real-world example. Several categories of statistics, including scores, test taker profiles, repeaters, item analysis and item exposure, are monitored to provide context and evidence for evaluating the score anomaly as well as assure the quality of the assessment. The monitoring results and alerts are programmed to be automatically updated and delivered via an interactive dashboard every day.
Introduction
Digital-first assessments are assessments designed to be delivered online, at scale, anytime and anywhere in the world, with a rapid turn-around of scoring and an online smooth sharing process with the receiving institutions. Digital-first assessments are administered continuously to individual test takers, in contrast to traditional large-scale assessments that are based on in-person administration to large groups of test takers in fixed locations. The advantages of digital-first assessments have manifested themselves during the pandemic, when traditional group assessments in brick-and-mortar test centers became impractical. However, this increased flexibility could come with challenges in evaluating and maintaining score validity. The test taking population composition of such a new and accessible test could be more sensitive to some external factors (e.g., admission deadlines). For example, on-demand accessibility can cause rapid changes in the test-taking population due to differing subpopulations testing immediately prior to particular admissions deadlines. Thus, it may be hard to determine whether a change in score distribution is a signal of a changing test taker population or a threat in score validity. A real-time quality assurance (QA) system system named “Analytics for Quality Assurance in Assessment” (AQuAA; Liao et al., 2021) was developed to monitor the integrity and validity of the test scores of a high-stakes, digital-first assessment (Burstein et al., 2021). While Liao et al. (2021) introduced the theoretical framework (e.g., computational psychometrics, von Davier, 2015, 2017; von Davier et al., 2021) and major categories of QA statistics monitored in AQuAA, this manuscript focuses on how AQuAA is designed and used to maintain the score comparability, which is a key aspect of score validity (Winter, 2010; DePascale and Gong, 2020).
Maintaining score comparability is crucial to a high-stakes assessment, regardless of the delivery format of the assessment. Test scores being comparable means that test takers of the same proficiency would be expected to receive the same test score regardless of which form of the test they took or when/where they took the test. Maintaining score comparability over time helps balance “the measurement and the contest” requirements of high-stakes tests (Holland, 1994). Specifically, a high-stakes assessment is supposed to be a high-quality measurement where test scores are accurate and valid; in the meantime, it should be like a contest in the sense that every test taker is given a fair chance.
A guiding principle of AQuAA is the ability to provide timely, accurate detection of score anomalies that may signal threats to score comparability. These score anomalies may arise from distinct sources. First, test scores may change due to changes in test-taker population that may be occurring on different time scales: populations may exhibit a combination of long-term evolution due to more widespread adoption of the test for institutional decision making, and shorter-term, seasonal fluctuations due to application deadlines and other seasonality arising from the usual cadence of academic years. Second, test scores may change due to changes in test-taker behavior, including possible security problems. Third, test scores may change due to unanticipated effects of changes in administration or psychometric procedures. More than one of these forces may be operating simultaneously. To maintain test integrity and comparability in the presence of multiple sources of score changes, it is critical that QA procedures are able to (1) automatically compute statistics that are sensitive to unexpected changes in score trends; (2) provide a sufficiently broad array of such statistics to provide evidence about possible causes of the unexpected changes; and (3) automatically and immediately communicate the detection of anomalies so that the experts can evaluate them and appropriate responses can be implemented. The goal of this manuscript is to discuss features of the AQuAA system that support these challenging tasks.
It should be noted that most analyses in AQuAA are performed to test scores at the aggregate level after the certification decisions are made. These post-hoc group-level analyses serve to examine and maintain score comparability even if the test taking population changes over time. The QA process performed by AQuAA should be distinguished from the security and proctoring processes that scrutinize test taking sessions at the individual level and lead to certification decisions (LaFlair et al., 2022). Scores of test sessions that fail to pass the security and proctoring checks (e.g., the test takers conduct abnormal behaviors during the test) are treated as invalid and are not shared with stakeholders (e.g., school admission officers). Most analyses in AQuAA are based on certified test scores (i.e., scores of the test sessions that passed the security and proctoring checks) because only these test scores can be shared and used by the stakeholders, which are also the focus of this manuscript. Other aggregate-level analyses can be conducted to assure the quality of proctors’ decisions, but they are beyond the scope of this manuscript.
Literature review
High-stakes assessment has profound impacts on test takers’ lives. As indicated by Allalouf (2007), mistakes that jeopardize assessment score validity could occur at all stages of assessment development and administration. These mistakes, if not detected and fixed in a timely manner, can be detrimental to test fairness. Therefore, quality control guidelines and step-by-step procedures have been established to help test developers to prevent, identify, and fix these mistakes (Allalouf, 2007; International Test Commission, 2014; Allalouf et al., 2017).
There are at least two gaps in the existing QA literature. First, most existing QA methods operate under either the assumption that the mean scores are expected to be stable over time or the assumption that variations in score trends can be largely explained by seasonal variations. Lee and von Davier (2013) have summarized a number of techniques to describe score trends and seasonal patterns, including linear ANOVA models (Haberman et al., 2008), regression with autoregressive moving-average (Li et al., 2009), harmonic regressions (Lee and Haberman, 2013) dynamic linear models (Wanjohi et al., 2013), and the Shewhart chart (Schafer et al., 2011). These methods, in combination with change detection methods such as change-point models and hidden Markov model (Lee and von Davier, 2013) and cumulative sum (CUSUM) charts (Page, 1954), were found effective in monitoring the stability of the mean scores (Lee and von Davier, 2013). However, these methods need to be adapted to assessments that are expected to experience mean score fluctuation due to an interaction of seasonal factors (e.g., admission deadlines) and non-seasonal factors (e.g., the pandemic). Lee and Haberman (2013) and Lee and von Davier (2013) addressed the seasonality in the test scores and the abrupt changes in the test scores due to unexpected but short-lived changes, such the exposure of the test items for a specific administration; however, non-seasonal changes that modify the testing population, such as those due to the pandemic, have not been investigated.
Second, there is limited literature about practical procedures to determine the causes of the unstable score trends or properties. While some IT certification testing sectors mentioned that they conduct psychometric analysis to maintain score validity (e.g., Amazon Web Services, n.d., CompTIA, n.d.; Microsoft, 2021), little publicly available documentation was found about the methodologies that they used to maintain stability and the comparability of the test scores. Although Allalouf et al. (2017) attempted to explain the score variance by regressing the score on some observed background variables (e.g., gender, time accommodation), a large portion of the score variance remains unexplained by these observed background variables (R2 = 0.18). Therefore, it is necessary to have a practical investigation procedure when the score residuals go “out-of-control” so that the test developers can promptly determine what action(s) to be taken in response to the score trend deviation.
Overview of the key features of analytics for quality assurance in assessment
Analytics for quality assurance in assessment was developed in the context of a digital-first, high-stakes computerized adaptive language assessment, the Duolingo English Test (Settles et al., 2020; Liao et al., 2021). The key features of AQuAA are motivated by its goal to ensure the assessment score validity and quality and by several unique characteristics of this assessment. The test is administered online and is intended to be accessible anytime and anywhere (Settles et al., 2020). The continuous test administration is supported by proctoring, item generation, and scoring processes that combine AI with human evaluation (Cardwell et al., 2022). The past few years have seen significant changes in test volume and test-taker composition due to the interaction of the characteristics of the test itself and external factors such as the pandemic and the adoption of the test for high-stakes decisions. Therefore, one of the most important features of AQuAA is to detect and alert to abrupt changes in overall score and subscore distributions in the context of changing test taker population. In addition to monitoring test scores, AQuAA monitors statistics related to test-taker background variables, item characteristics and item exposure, in order to provide context to understand the score trends and score changes. Since new test data could be accumulated anytime due to continuous test administration, AQuAA is programmed to import data, update the monitoring statistics, detect score trend anomalies and notify the test developers of score alerts automatically every day.
Anomaly detection methods
In AQuAA, anomaly detection refers to detecting anomalous changes in score trends. Anomaly detection in a relatively new assessment is challenging partly because the population of test takers is constantly evolving and changing. As a result, the baselines of many of the tracked metrics cannot be assumed to be stationary over time.
Therefore, in AQuAA, baselines are estimated for relatively short time periods and irregularities are defined as large discrepancies between the observed daily statistics and the expected baseline based on this relatively short period. As a side note, the term “daily” is used loosely here–depending on the amount of data, the frequency of these computations can be higher or lower than once daily.
We use several methods to estimate the expected daily result and identify abrupt changes in one metric relative to short-term expectations. The first of these methods controls for test taker demographics. Specifically, a daily score residual (r) is computed:
where Xobs is the daily average observed score and Xpred is the daily predicted score. Xpred is calculated by regressing historical scores (over many months) on various background relevant variables, such as gender, native language, and test-taking intent, using a nonparametric regression tree method, and aggregating daily across test takers. These aggregates of predicted scores have two functions. First, their time series is directly monitored to track changes in observed test-taker background variables that, by construction, predict score changes. Second, the time series of the residuals (defined above) are monitored to track changes in test scores that are unexplained by observed changes in test-taker background variables, which are typically of more concern. The daily residual is flagged as an irregularity if a day’s daily score residual has a large absolute value compared to the corresponding 30-day rolling average (e.g., if Z > 2.5 where Z = —(r – M30)/S30— where M30 and S30 are the 30-day rolling mean and standard deviation of the daily residuals, respectively). Figure 1 is a visual representation of the daily score residuals. It can be seen that a daily residual in late October was flagged based on the z score and it is represented as a green point in the figure. Since the flagged daily score residual has a positive value, the mean overall score of this particular day in late October is higher than expected.
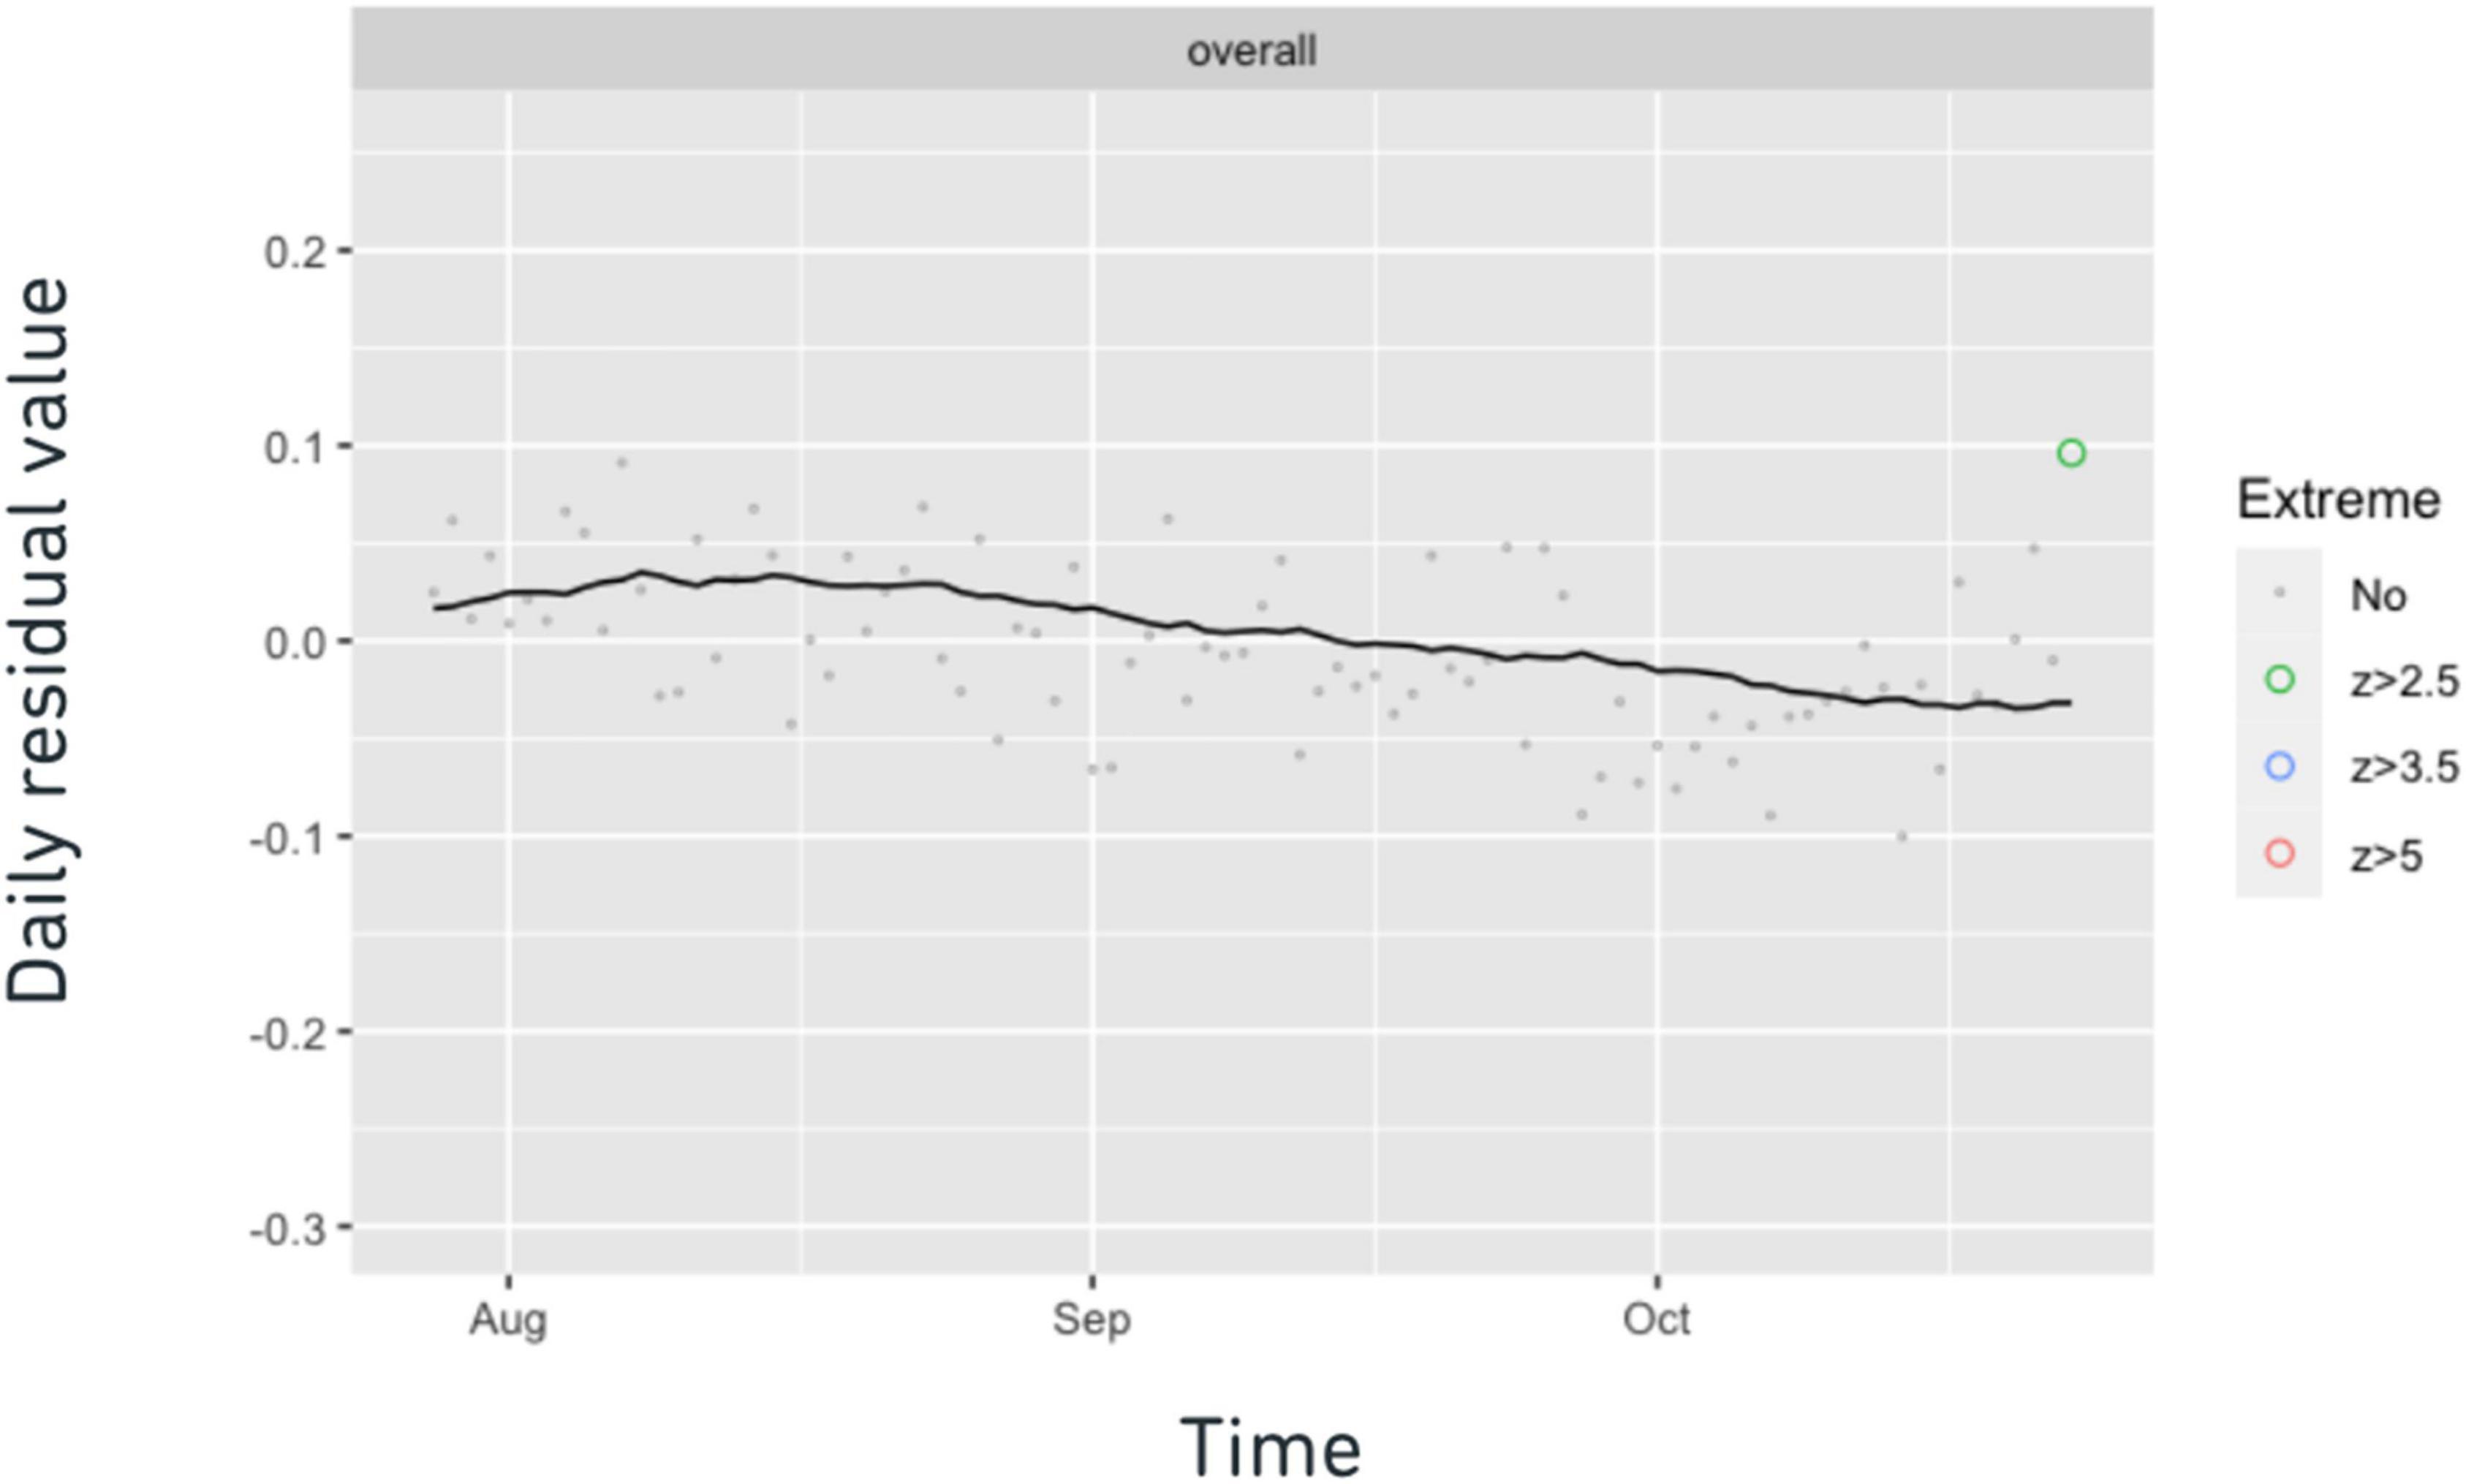
Figure 1. Daily residual chart. Each dot represents an average daily residual controlling for observable test-taker background variables. The black line represents the 30-day rolling average of the daily residuals, M30. Irregular daily residuals are represented as colored dots. Green, blue, and red indicate slight, medium, and large severity, respectively.
A different method to estimate the expected daily result exploits the high correlations between different item scores. It tracks relative differences in scores between one task type and all other task types (or the total score excluding the target task type). In order to identify abrupt changes in scores of one task type relative to the other task types, a similar residual is defined, where Xpred is the total score (excluding the target task type) and Xobs is the daily average observed task-type score. Irregularities are also similarly defined based on 30-day rolling z-scores. These task-specific residuals are designed to identify score irregularities that are specific to a particular task type, which can be useful to monitor consequences of changes to administration or psychometric procedures that differentially impact task types. They also may be useful to detect security threats that arise for a particular task type.
Processes of determining the cause of anomalies
There could be various causes underlying each score anomaly. Some common causes include the occurrence of some major events such as institutions’ admission deadlines. All of these could create test-taking population changes that have not been fully captured by the observed background variables, hence these will result in unpredicted score changes. A different possibility is that the score alert is due to a serious validity issue, such as abnormal test taking behaviors (e.g., item preknowledge) or problems in the item bank or administration procedures. This underscores the necessity to involve experts with diverse backgrounds and expertise (e.g., psychometricians, test developers, test security experts, institution engagement experts) in the investigations of anomalies.
Determining the causes of the score anomalies is critical to determining the actions to be taken. We adopt two major steps to determine the causes of score anomalies: (1) Investigate the major events that coincide with the anomalies; (2) Make hypotheses and collect evidence.
For example, in Figure 1, we observed an anomalous score increase in late October. By inquiring with the institution engagement experts, we discovered that this score anomaly approximately concurs with many universities’ early-action deadline on Nov 1 (i.e., deadline for students to submit their applications early). This observation led us to hypothesize that the score increase in late October was driven by test-taker population change caused by the early admission deadline. As concurrence does not imply causality, further evidence was needed to evaluate this hypothesis.
To help provide context and evidence for evaluating the score anomaly, AQuAA keeps track of various categories of statistics, besides scores, as summarized in Table 1. These statistics include composition of the test taker population, repeaters, item analysis, and item exposure. To test our hypothesis about the score anomaly in late October, we identified three observable implications of the claim that “the score increase in late October is driven by the early admission deadline.” First, as the early admission deadline is a yearly recurring deadline, a similar score increase should be observed at a similar time in the previous year if the claim is true. Second, the score increase is expected to stop after the early admission deadline. Third, the number of test takers with intent for undergraduate or graduate application is expected to increase. Statistics in AQuAA showed patterns consistent with all the three observable implications, supporting our hypothesis about the score anomaly in late October.
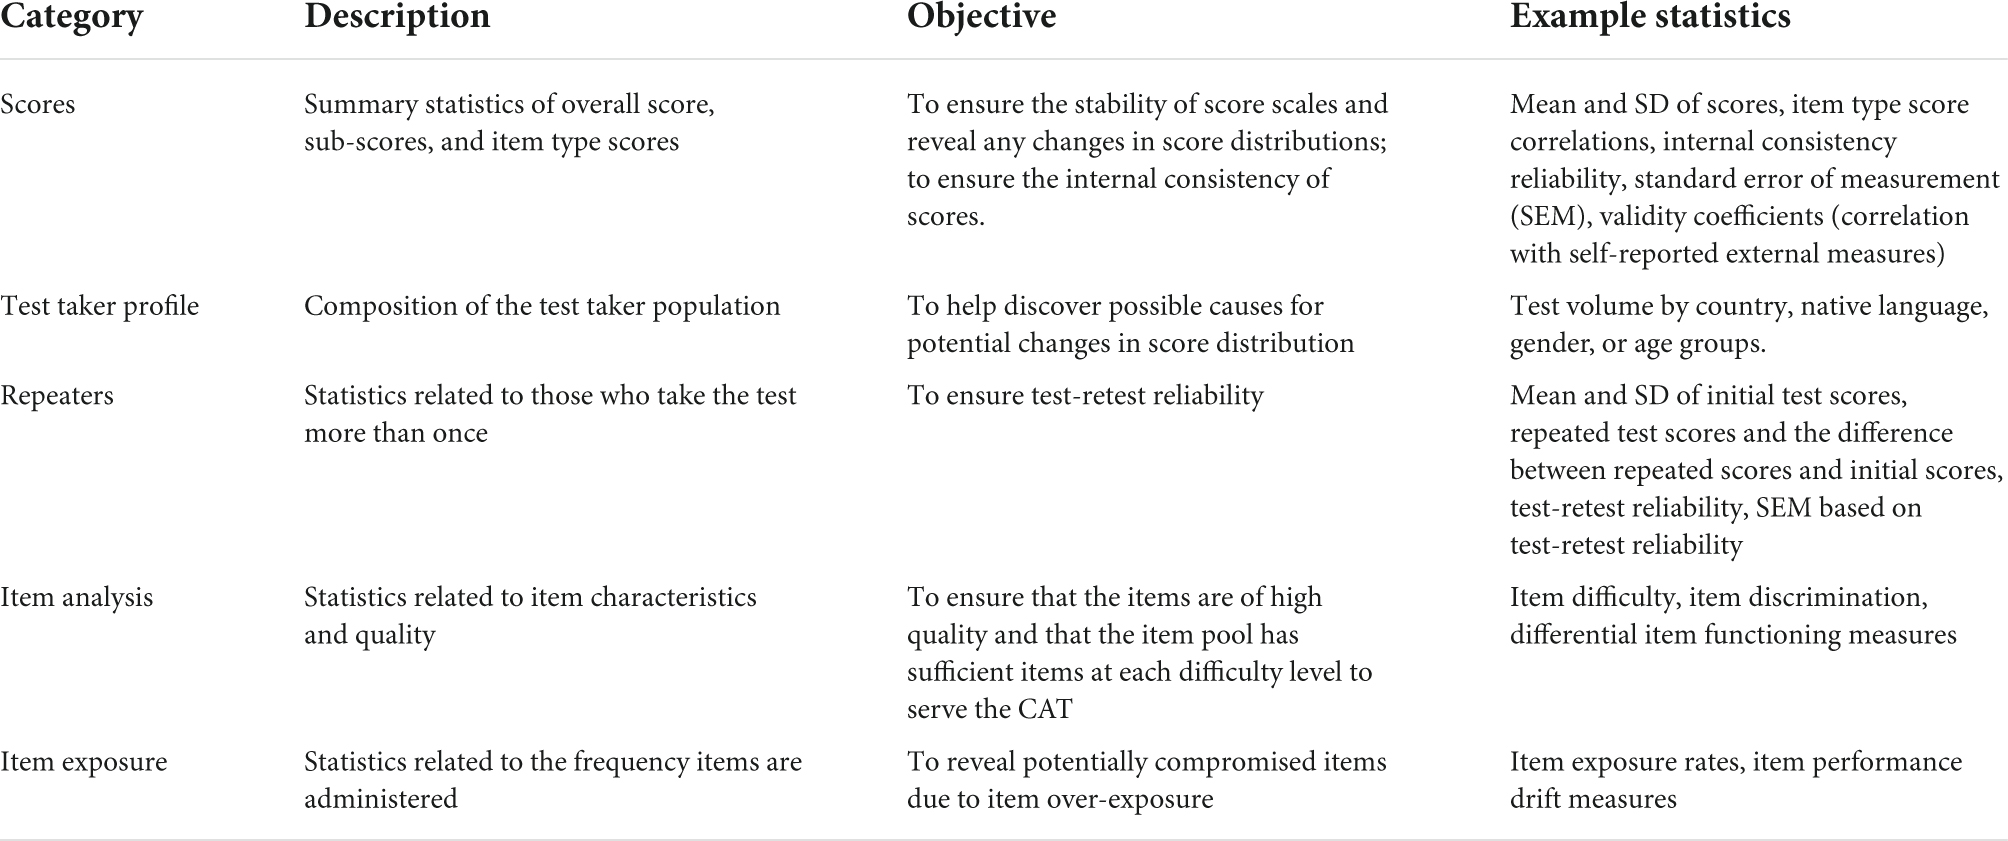
Table 1. Major categories of statistics being monitored in AQuAA.
Automatic update and alert notification
Since it is not feasible to manually update and monitor the QA statistics around the clock, it is necessary to develop an automated pipeline to import data, compute statistics, and push alert notifications to the test developing team whenever an irregularity in the score statistics is detected.
As shown in Figure 2, the automated pipeline was developed and implemented in R (R Development Core Team, 2013). The pipeline is scheduled to import data into R from a database that stores all of the assessment data (e.g., person-level data, item-response-level data, and process data) on a daily basis. The imported raw data are cleaned to ensure the data quality and the accuracy of the statistics to be computed. After computing the QA statistics, trends of the statistics are represented as smoothed lines created by the locally weighted scatterplot smoothing (LOWESS) (Cleveland, 1979) method. The ggplot2 R package (Wickham, 2011) was used to create the line points and the Flexdashboard (Iannone et al., 2020) package was used to create an interactive dashboard that integrates different statistics. Whenever a daily score anomaly is detected, an alert message is automatically sent to the test developing team (see Figure 2 for a demo). To effectively communicate the alert information to the stakeholders, the alert notification includes the latest major event(s) that occur prior to the daily score anomaly as well as the date and severity of the score anomaly.
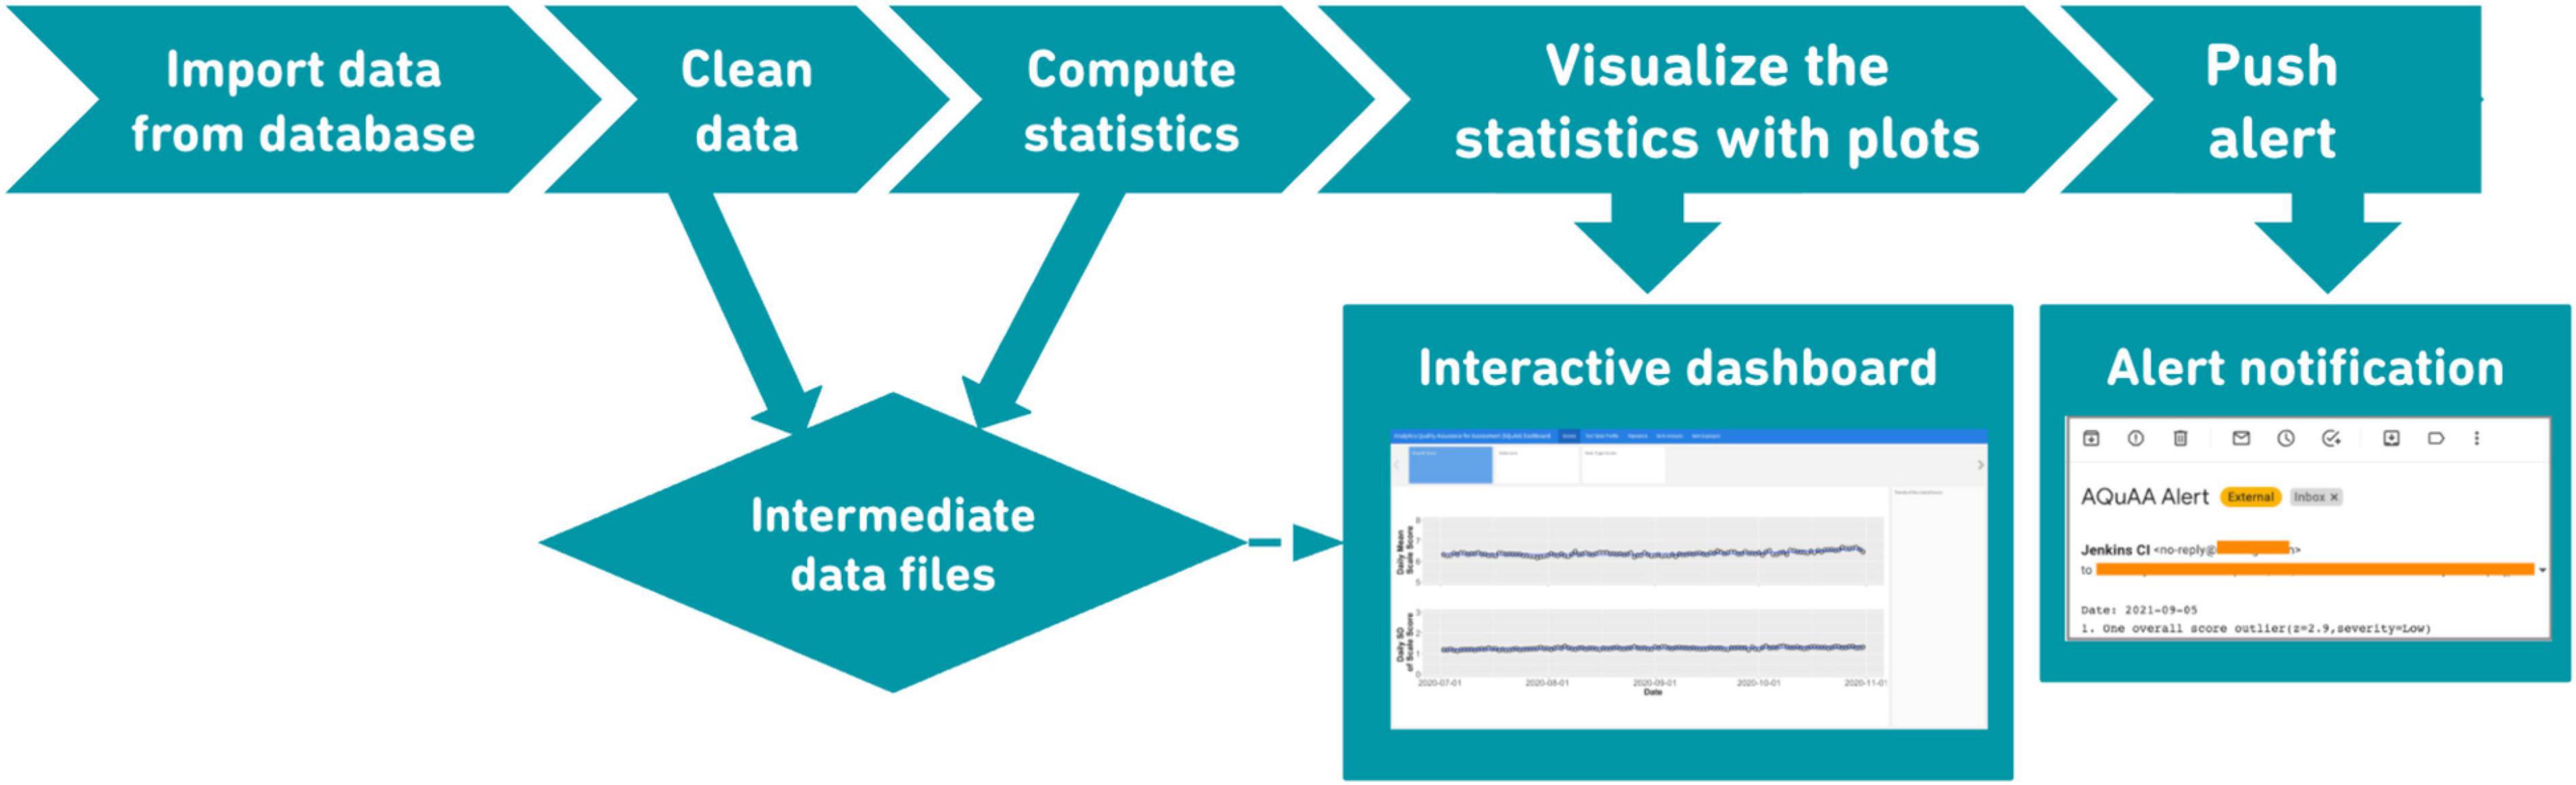
Figure 2. AQuAA automatic updating pipeline.
Discussion
The quality and fairness of test scores from high-stakes tests are at the core of all the evaluations and reviews of test developers and stakeholders. The fact that the score trends can be jointly affected by internal factors, such as the test characteristics, and external factors, such as the admission deadlines, has made it challenging to define and detect anomalies in the score trends as well as to identify the causes of the anomalies. Hence, it is difficult to diagnose whether the score comparability is maintained only based on the score trends. The anomaly detection methods introduced in this manuscript are designed to tackle these challenges by detecting abrupt changes in score trends in the context of constantly changing population characteristics and providing statistical evidence to inform the causes underlying the abrupt changes. Thus, these anomaly detection methods can be used to identify potential threats to score comparability. The methodology was illustrated with a real-life example from the Duolingo English Test.
Although the digital-first assessment consists of many automated processes (e.g., test scoring), its QA process requires a combination of automatic processes and human expert review. In the automated pipeline of AQuAA, processes such as data manipulation, statistics computation and visualization are programmed to be implemented automatically. However, as shown in the real-life example, expert insights and review are necessary to determine the cause of the score anomalies. The AQuAA system and its associated anomaly detection methods were designed with the characteristics of the Duolingo English Test in mind. When adapted to other assessments, it is worth deliberating on how to customize these methods to the purposes and characteristics of the assessments. Some example questions that can be considered are: What are the score trends expected to be like, given the possible changes in population? What statistics would be relevant to understand the causes of the score anomalies? What types of expertise (e.g., assessment experts, test security experts, institution engagement experts) are desirable in the review panel of the score anomalies?
One of the future directions of AQuAA is to inform the seasonal patterns of the test. Although, as a relatively new test, the Duolingo English Test may not have accumulated sufficient data to reveal a seasonal pattern, the fact that some abrupt score changes are observed at similar time periods (e.g., before the early admission deadline) in different years may indicate promising results in modeling seasonal variations.
Data Availability Statement
The data analyzed in this study is subject to the following licenses/restrictions: The datasets presented in this article are not readily available because they are confidential and/or proprietary information. Requests to access these datasets should be directed to ML, bWFuY3lAZHVvbGluZ28uY29t.
Author contributions
ML initiated the structure and the first draft of the manuscript and produced table and figures. YA performed data analyses and wrote the “Overview of the key features of AQuAA,” “Anomaly detection methods,” and “Processes of determining the cause of anomalies” sections. JRL performed data analyses and wrote the “Introduction,” “Anomaly detection methods,” and “Processes of determining the cause of anomalies” sections. AvD provided conception of the study and wrote the “Introduction,” “Processes of determining the cause of anomalies,” and “Discussion” sections. All authors contributed to manuscript revision, read, and approved the submitted version.
Conflict of Interest
ML, YA, JRL, and AvD were employed by Duolingo.
Publisher’s Note
All claims expressed in this article are solely those of the authors and do not necessarily represent those of their affiliated organizations, or those of the publisher, the editors and the reviewers. Any product that may be evaluated in this article, or claim that may be made by its manufacturer, is not guaranteed or endorsed by the publisher.
References
Allalouf, A. (2007). Quality control procedures in the scoring, equating, and reporting of test scores. Educ. Meas. Issues Pract. 26, 36–46. doi: 10.1111/j.1745-3992.2007.00087.x
Allalouf, A., Gutentag, T., and Baumer, M. (2017). Quality Control for Scoring Tests Administered in Continuous Mode: an NCME Instructional Module. Educ. Meas. 36, 58–68. doi: 10.1111/emip.12140
Amazon Web Services (n.d.). Exam Functionality And Feedback. Available Online at: https://aws.amazon.com/certification/policies/during-testing/ (accessed May 18, 2022).
Burstein, J., LaFlair, G., Kunnan, A., and von Davier, A. (2021). A Theoretical Assessment Ecosystem for a Digital-First Assessment—The Duolingo English Test. Available Online at: https://duolingo-papers.s3.amazonaws.com/other/det-assessment-ecosystem.pdf (accessed May 18, 2022).
Cardwell, R., LaFlair, G. T., and Settles, B. (2022). Duolingo English Test: Technical Manual. Available Online at: http://duolingo-papers.s3.amazonaws.com/other/det-technical-manual-current.pdf (accessed May 18, 2022).
Cleveland, W. S. (1979). Robust locally weighted regression and smoothing scatterplots. J. Am. Stat. Assoc. 74, 829–836. doi: 10.1080/01621459.1979.10481038
CompTIA (n.d.). CompTIA Data Forensics. Available online at: https://www.comptia.org/testing/testing-policies-procedures/test-policies/comptia-data-forensics
DePascale, C., and Gong, B. (2020). “Comparability of individual students’ scores on the “same test,” in Comparability Of Large-Scale Educational Assessments: Issues And Recommendations, eds A. I. Berman, E. H. Haertel, and J. W. Pellegrino (Washington, DC: National Academy of Education), 25–48.
Haberman, S. J., Guo, H., Liu, J., and Dorans, N. J. (2008). Consistency of SAT® I: reasoning test score conversions. ETS Res. Rep. Ser. 2008, i–20. doi: 10.1002/j.2333-8504.2008.tb02153.x
Holland, P. W. (1994). “Measurements or contests? Comments on Zwick, bond and Allen/Donoghue,” in Proceedings of the social statistics section of the American Statistical Association, 1994, (Alexandria, VA: American Statistical Association), 27–29.
Iannone, R., Allaire, J. J., Borges, B., and Cheng, J. (2020). Flexdashboard: R Markdown Format for Flexible Dashboards. Available Online at: https://CRAN.R-project.org/package=flexdashboard (accessed May 18, 2022).
International Test Commission (2014). ITC Guidelines on Quality Control in Scoring, Test Analysis, and Reporting of Test Scores. Int. J. Test. 14, 195–217. doi: 10.1080/15305058.2014.918040
LaFlair, G. T., Langenfeld, T., Baig, B., Horie, A. K., Attali, Y., and von Davier, A. A. (2022). Digital-first assessments: a security framework. J. Comput. Assist. Learn. 38, 1077–1086. doi: 10.1111/jcal.12665
Lee, Y.-H., and Haberman, S. J. (2013). Harmonic regression and scale stability. Psychometrika 78, 815–829. doi: 10.1007/s11336-013-9337-1
Lee, Y.-H., and von Davier, A. A. (2013). Monitoring scale scores over time via quality control charts, model-based approaches, and time series techniques. Psychometrika 78, 557–575. doi: 10.1007/s11336-013-9317-5
Li, D., Li, S., and von Davier, A. A. (2009). “Applying time-series analysis to detect scale drift,” in Statistical Models For Test Equating, Scaling, And Linking, ed. A. A. Davier (Berlin: Springer), 327–346. doi: 10.1007/978-0-387-98138-3_20
Liao, M., Attali, Y., and von Davier, A. A. (2021). “AQuAA: Analytics for Quality Assurance in Assessment,” in Proceedings of the Educational Data Mining Conference (Virtual), 787–792.
Microsoft (2021). Exam Development. Available Online at: https://docs.microsoft.com/en-us/learn/certifications/exam-development (accessed May 18, 2022).
Page, E. S. (1954). Continuous inspection schemes. Biometrika 41, 100–115. doi: 10.1093/biomet/41.1-2.100
R Development Core Team (2013). R: A Language And Environment For Statistical Computing. Available Online at: https://www.r-project.org/ (accessed May 18, 2022).
Schafer, W. D., Coverdale, B. J., Luxenberg, H., and Ying, J. (2011). Quality control charts in large-scale assessment programs. Pract. Assess. Res. Eval. 16:15.
Settles, B., LaFlair, G. T., and Hagiwara, M. (2020). Machine Learning–Driven Language Assessment. Trans. Assoc. Comput. Linguist. 8, 247–263. doi: 10.1162/tacl_a_00310
von Davier, A. A. (2015). “Virtual and collaborative assessments: Examples, implications, and challenges for educational measurement,” in Invited Talk at the Workshop on Machine Learning for Education, International Conference of Machine Learning 2015, (Lille).
von Davier, A. A. (2017). Computational psychometrics in support of collaborative educational assessments. J. Educ. Meas. 54, 3–11. doi: 10.1111/jedm.12129
von Davier, A. A., Mislevy, R., and Hao, J. (2021). Computational Psychometrics: New Methodologies for a New Generation of Digital Learning and Assessment: With Examples in R and Python. Berlin: Springer, doi: 10.1007/978-3-030-74394-9
Wanjohi, R. G., van Rijn, P. W., and von Davier, A. A. (2013). “A state space approach to modeling irt and population parameters from a long series of test administrations,” in New Developments In Quantitative Psychology, eds R. E. Millsap, L. A. Ark, D. M. Bolt, and C. M. Woods (Berlin: Springer), 115–132. doi: 10.1007/978-1-4614-9348-8_8
Keywords: digital-first assessment, quality assurance, language assessment, high-stakes assessment, anomaly detection
Citation: Liao M, Attali Y, Lockwood JR and von Davier AA (2022) Maintaining and monitoring quality of a continuously administered digital assessment. Front. Educ. 7:857496. doi: 10.3389/feduc.2022.857496
Received: 18 January 2022; Accepted: 27 June 2022;
Published: 19 July 2022.
Edited by:
Sedat Sen, Harran University, TurkeyReviewed by:
Hollis Lai, University of Alberta, CanadaChad W. Buckendahl, ACS Ventures LLC, United States
Copyright © 2022 Liao, Attali, Lockwood and von Davier. This is an open-access article distributed under the terms of the Creative Commons Attribution License (CC BY). The use, distribution or reproduction in other forums is permitted, provided the original author(s) and the copyright owner(s) are credited and that the original publication in this journal is cited, in accordance with accepted academic practice. No use, distribution or reproduction is permitted which does not comply with these terms.
*Correspondence: Manqian Liao, bWFuY3lAZHVvbGluZ28uY29t