 Björn Boman
- Department of Education, Stockholm University, Stockholm, Sweden
The current study analyzed the relationships between explanatory variables such as socioeconomic status (SES), migration background (MB), and formal teacher competence, and aggregated grades in the Swedish lower-secondary school context by using aggregated municipality data from 2013, 2018, and 2019. SES indicators had larger effect sizes when data from different years were merged and when the outcome variable was changed to an alternative measure of educational achievement. In one model, the MB variable even became statistically insignificant. These results indicate that SES is an important variable which explains a substantial amount of variance in regard to school achievement indicators such as grade point average. Nonetheless, aggregated data may still suffer from omitted variable bias and biased effect size estimates.
Introduction
It is well established that socioeconomic status (SES) is intimately linked to academic achievement such as grades and scholastic assessment tests in a variety of national and international contexts (e.g., Sirin, 2005; Tan, 2015; Kim et al., 2019; Boman, 2022a,c), including Sweden (Gustafsson and Yang Hansen, 2018). Although measurements of SES may differ between countries and regions (e.g., Kim et al., 2019), parental education and/or average (parental) income is typically used to indicate SES. These two types of measures tend to be highly correlated and estimates do not differ substantially depending on the use of only one of these two forms of indicators (e.g., Falk et al., 2021). In the Programme for International Student Assessment Survey (PISA) context, the estimated number of books at home is typically used as an indicator of SES (e.g., Tan, 2015; Reimer et al., 2018). More books at home indicate a higher level of SES (Reimer et al., 2018, p. 35). Aside from PISA and similar international scholastic assessments, in Sweden, average income and/or parental education is typically used to indicate the level of SES. The relationship between SES and grades is moderate but has partially been affected by migration during recent decades (Gustafsson and Yang Hansen, 2018). Thus, the relative impact of migration background (MB), and its relation to SES, on school results has increasingly become an important area of research within the Swedish context, due to changes in demographics related to an increased influx of migrants (e.g., Ruist, 2015; Gustafsson and Yang Hansen, 2018; Boman, 2022b).
For at least a decade, public debates on school results in Sweden have been pervasive (e.g., Wiklund, 2018). Poor results in the PISA 2012 survey and in relation to grades and completion rates at lower-secondary level (i.e., the transition from Grade 9 to Grade 1 at upper-secondary level) appear to be associated with either a neoliberal decentralization of the school system that leads to increased socioeconomic and sociodemographic inequalities (e.g., Bunar, 2010), poor teachers (e.g., SVT, 2018), and increased immigration from low-skilled countries (e.g., Holmlund et al., 2019; Sanandaji, 2020).
While all of these factors might contribute to lower results but to different extents, there is little support of poor teacher quality in Sweden. First, teachers have, on average, high cognitive skills in literacy and numeracy (Hanushek et al., 2019) and although the intake requirements are low, teacher students who graduate at Swedish tertiary institutions like the University of Gothenburg have good grades and cognitive and non-cognitive skills (Hasselgren, 2018). The grade point averages of recently graduated teacher (social science teachers in particular) have decreased in several subjects (Alatalo et al., 2021) but the effects of teacher grades on student grades or test scores have not yet been investigated. Thus, such relationships remain unknown. Furthermore, it may be difficult to draw causal inferences from correlational and descriptive data on the relationship between teacher competence and student’s academic performance because, among other reasons, students are typically taught by several teachers and therefore current teachers may or may not have an impact on the recent performance (Björklund et al., 2010; Holmlund et al., 2019).
Student segregation might be a more plausible explanation for a decline of academic performance in Sweden but is difficult to disentangle from migration factors. Moreover, school segregation effects linked to decentralization do typically occur at upper-secondary level in the Swedish context (Lindbom, 2010; Yang Hansen and Gustafsson, 2016), why differences in achievement at lower levels might be due to other factors such as the SES of parents and thus students. Instead, it seems more reasonable to assert that substantial immigration leads to larger shares of low-performing individuals, schools, and municipalities (Holmlund et al., 2019; Boman, 2022b) and a relative shortage of certified teachers among schools and municipalities because increasing populations, driven by migration to Sweden (Sanandaji, 2020), lead to mismatches between the rate of certified teachers and demand for such staff within schools and municipalities in today’s Sweden. Nonetheless, indicators of SES such as the share of highly educated at the municipality level are unhesitatingly correlated with school results in Sweden (e.g., Boman, 2022b). However, the impact of SES and migration background, as well as their interaction, must be further examined. For instance, aggregated school and municipality data requires replication, as well as the addition of individual level data of students in order to discern inferences at the individual level and control for more factors than can be provided at the aggregated level.
Hence, the current article adds to the corpus of research on educational achievement at lower-secondary level in Sweden, specifically aggregated data on Grade 9 in 2013 and 2018, as well as additional data from 2019. It used multiple regression analyses at the national-regional level, covering 289 out of 290 municipalities in Sweden for which data exist at the municipality database Kolada. In regard to the municipality level data, explanatory variables related to SES and migration background were analyzed in relation to grades. In addition, teacher certification rates (TCR) in each municipality, as well as geographical distance was added. Then, the independent and dependent variables of these two cross-sectional data sets were compared in order to capture fluctuations and performance trends over time and introduced some additional control variables. This article underlines the importance of replication in educational research (Makel and Plucker, 2014) as it contributes with a replication of the relationships found in Boman (2022b) by utilizing similar data sources, analytical strategies, dependent, and independent variables. It does also contribute to scholarly discussions on using aggregated data in relation to educational research.
However, it does not merely replicate the data used in Boman (2022b), as this study was recently published, but includes more data sources from in total 3 years (2013, 2018, 2019), additional predictors (e.g., teacher competence, classroom climate) and alternative dependent variables (e.g., national test results, grade point average), as well as robustness checks (e.g., a moderator analysis). As such it provides more robust and reliable results in this regard.
The following research question was addressed:
RQ1: What are the relationships between socioeconomic status, migration background, and grades at the municipality level?
The article proceeds with a theoretical background section which briefly sketches the contours of the contemporary Swedish educational context at the lower-secondary level, a literature review, and a discussion on using aggregated data, a method and data section, results, and a conclusive discussion.
Theoretical background
The contemporary Swedish education context
As Gustafsson and Yang Hansen (2018) underscore, Sweden has since 1998 moved from a normed-referenced grading system to a criterion-based grading system. The Swedish national curriculum has been revised several times, and the last major revision for the entire school system was introduced in 2011 (Lgr 11), with a partial revision in 2018. Sweden offers 9 years of mandatory elementary school education, in which “Årskurs 7–9” can be translated into lower-secondary education (Swedish National Agency for Education, 2018). In Grade 8 (“Årskurs 8”) students are typically 14–15 years old and 15–16 years old in Grade 9.
Apart from the knowledge-centered national curriculum of compulsory education, the current education system is affected by the free school choice on a voucher based quasi-market, which leads to increased school segregation (Larsson, 2019; Hennerdal et al., 2020), and high rates of low-skilled migrants the 1990s onward (Ekberg, 1999). Furthermore, many smaller municipalities in Sweden have very few schools at the secondary levels (Fjellman et al., 2019).
Fundamentally, the Swedish educational context is signified by a hybrid system of on the one hand neoliberal-oriented decentralization and school accountability and centralized control and bureaucracy on the other hand (Bunar, 2010; Hennerdal et al., 2020). These characteristics might affect patterns at the national level, such as TCR because low-performing municipalities are often compensated with more, if not better school resources such as a more beneficial student–teacher ratio (Holmlund et al., 2019). However, OECD (2022) underscores that these compensatory efforts, in reality, are quite small.
Related literature and theoretical concepts
It is a general pattern that high-SES students outperform their lower-SES peers (e.g., Sirin, 2005). That might occur because high-SES parents are more involved in their children’s lives and have higher aspirations as regards their children’s future trajectories in education and the labor market. In the home environment, high-SES parents spend more time reading with and to their children which likely stimulates cognitive growth and learning (e.g., Myrberg and Rosén, 2009). Moreover, children whose parents have higher SES do generally develop higher cognitive ability levels which are then transmitted to their children through both genes and the environment (Turkheimer et al., 2003; Engelhardt et al., 2018; Falk et al., 2021). Conversely, the lower degree of nurture and support among lower-SES children can affect the cognitive ability levels, and hence outputs in for example school tests, negatively (Turkheimer et al., 2003; Sackett et al., 2009; Flynn, 2012; Boman (2022d)). However, it is possible that earlier academic achievement among larger groups of students might decrease over time because of various social (e.g., immigration, fewer adolescents read in their leisure time), socioeconomic (e.g., increased relative poverty), and school-related factors (e.g., Flynn, 2012; Dutton et al., 2016). That is known as the anti-Flynn effect (Dutton et al., 2016).
Larsson (2019) underlines a socio-educational division in the current Swedish society, especially the capital Stockholm. Whereas some rural areas are associated with high achievement and high-SES family characteristics (e.g., Lundsberg in Värmland), the division is now between the renowned inner-city schools and the suburban schools with low completion rates and intake ratings (Gynatagningen, 2019). In other countries such as the US, inner-city schools are associated with poor school results, low discipline, and high rates of violence (e.g., Devine, 1996). The contention is not that all Swedish inner-city schools are high-performers, but that generally there is a positive relationship between urban locality and school results, although with many exceptions (Boman, 2022b).
Sanandaji (2020) stresses that the three most ethnically diverse municipalities in Sweden have increased their municipal tax equalization revenues since 1996 due to poor performance in the local and national labor market. A report published by Swedish National Agency for Education, 2016 indicates that approximately 6–7% of the decreases in PISA 2000–2012 are attributable to increased migrant participation. Differences between natives and non-natives in regard to educational achievement are also accentuated in a report conducted by Holmlund et al. (2019; see also Swedish National Agency for Education, 2009). In different European countries, natives do typically outperform immigrant students. Azzaloni et al. (2012) found that in Italy and Spain achievement differences in the PISA 2009 survey were associated with family background and socioeconomic status. In Italy, the effect of academic tracking was also substantial while immigrants from Latin America in Spain had an advantage in PISA reading due to their ability in Spanish. However, socioeconomic, institutional, and linguistic factors cannot fully explain the variance in both models (Azzaloni et al., 2012). Similar results were found among first- and second-generation immigrants in Switzerland when analyzing data from the PISA 2000 wave. For example, larger family sizes for first-generation immigrants, typically from Albania, had a negative statistical relationship with PISA scores (Meunier, 2011). Moreover, as Flores-Mendoza et al. (2021; see also Deary et al., 2007) underline, much of the impact of SES disappears when cognitive ability indicators are included in regression analyses. Furthermore, non-cognitive abilities such as conscientiousness or grit might have a partial impact or mediate the relationship between SES and school results (Thorsen et al., 2021).
Granvik Saminathen et al. (2018) found that teachers’ ratings of school leadership, teacher education and school ethos differ across school segregation profiles. Gustafsson and Yang Hansen (2018) examined changes in the impact of family education on student educational achievement in Sweden, 1988–2014, and found that correlations increased by 0.04 units between the early 1990s and 2014, in part because of increased immigration. However, despite efforts to adjust the dependent variable (grades) from different grading systems, this study suffers in part from the insufficient comparability over time.
In relation to teacher effects, there is a rich research literature from the United States which indicates that teachers have at least a moderate relationship with academic performance (e.g., Hanushek et al., 1996). In Sweden, there is a dearth of studies but Holmlund et al. (2019) stress that the totality of national and international evidence suggests that teachers do have a substantial effect on academic performance at lower-secondary level. However, findings from correlational and regression analyses might be spurious due to that certified teachers may be more frequent in low-performing schools and municipalities as a consequence of compensatory efforts (Holmlund et al., 2019). Edmark and Persson (2021) accentuate that there seem to be indications of grade inflation, especially in the independent schools. This might also be shown by a comparison between Sweden’s PISA results from the PISA 2012 survey (e.g., 478 in mathematics compared to 510 in the 2000 survey) and the increasing grade point averages during approximately the same period (Holmlund et al., 2019).
As said, SES is intimately linked to academic achievement (e.g., Sirin, 2005; Tan, 2015; Kim et al., 2019), including Sweden (Gustafsson and Yang Hansen, 2018). However, educational results in Sweden are typically affected by both migration, geographical location, and school factors such as teacher competence or certification (Swedish National Agency for Education, 2009; Björklund et al., 2010; Gustafsson and Yang Hansen, 2018; Holmlund et al., 2019). Thus, all these factors must be considered in this context. However, these should typically not be considered as completely separate but connected factors because highly educated parents and certified teachers are generally located in the vicinities of urban areas where students might perform best (Yang Hansen and Gustafsson, 2016; Holmlund et al., 2019). Because of the impact of migration and the Swedish hybrid model in education these socioeconomic and sociodemographic patterns might be fuzzy or unexpected. For instance, a substantial portion of non-natives might be well-integrated while larger portions are not (Boman, 2021, 2022b). The geographical aspects of cultural and social capital, which are intricately linked with SES, have been underlined by Bourdieu-inspired research which is relevant for the Swedish context (e.g., Larsson, 2019). For instance, major university cities in Sweden attract students with higher cultural capital and SES (Carlhed, 2017) and some inner-city schools in Stockholm are considered as prestigious locations to attain upper-secondary education (Larsson, 2019).
The current study adds to the earlier literature such as Gustafsson and Yang Hansen (2018) and Boman (2022b). Overall, this is regarded as a replication study of Boman (2022b). More broadly, it does also add to the literature on SES–academic achievement relationships (e.g., Sirin, 2005; Tan, 2015) and migration–academic achievement relationships (e.g., Meunier, 2011), as well as research on grades in the Swedish context (e.g., Molin and Fjellborg, 2021). Specifically, it aims to replicate the results of Boman (2022b) but also contribute with a more reliable research design and as such it stands in its own feet. Akin to Molin and Fjellborg (2021), it uses school level data to discern relationships at the meso and macro levels of Swedish school students at the end of the lower-secondary level, specifically Grade 9.
Aggregated data and the ecological fallacy
Piandosi et al. (1988; see also Bronfenbrenner, 1977) have described the ecological fallacy as a kind inferential fallacy. The authors describe it as follows:
Variables that describe groups of individuals, rather than the individuals themselves, are termed “ecological” and are often used when the analysis of individuals’ data is not possible (1). Ecological analyses may be preferred when (1) variables are more conveniently defined or measured on groups because the analysis on individuals would require excessive time or extensive data gathering; (2) ecological analyses permit study of a wider range of values for the independent variable, as in international studies of diet; (3) the precision of aggregate measures like alcohol consumption is likely to be higher for groups than for individuals; and (4) population responses such as smoking quit rates may be of primary interest.
With regard to educational research there are both pros and cons with individual level data compared to aggregated data. For instance, because it is not the same students who take the PISA tests in the triennial surveys only aggregated average scores and aggregated inputs at the school level can be used to compare changes and relationships over time (Gustafsson, 2008; Boman, 2022a). On the other hand, in relation to many other types of research such as longitudinal studies the same individuals should be followed up (e.g., Guglielmi and Brekke, 2017). Moreover, the effect sizes might be biased when for example schools and not students constitute the unit of analysis (Hennerdal et al., 2020; see also Singer, 1961).
Obviously, there are many reasons to focus on the individual level of analysis in the Swedish education context and elsewhere. However, there are good reasons for the use of public data sources where school level data are available. First of all, these data are open to the public and it might be better that researchers, rather than organizations, politicians, pundits and journalists, analyze these data (Gustafsson, 2008). In the next step, other researchers and stakeholders may scrutinize the data and research results in accordance with open data policies. Moreover, these data cover both the meso and macro contexts of educational performance (e.g., Bennett et al., 2012; Aurini et al., 2020; see also Dopfer et al., 2004). In other words, they say something broad but substantial about school achievement and their underlying explanations.
Methods, data, and variables
Dependent variable
When examining educational achievement among Swedish students at lower-secondary level, there are typically four standardized procedures to evaluate them: grades, national tests, international tests (e.g., PISA), and specific tests constructed by researchers (Björklund et al., 2010; Holmlund et al., 2019). While all these assessments have their set of strengths and weaknesses (Lundahl, 2014), grades—non-self-reported such in particular (Kuncel et al., 2005)—are pertinent because they are the results of both cognitive and non-cognitive abilities and are predictive for the future life course among individuals (Borghans et al., 2016).
This study used aggregated data from the municipality database Kolada for information on lower-secondary level indicators in 289 of Sweden’s 290 municipalities in relation to Grades in All Subjects (GAS) in the first step. Percentage per municipality on the degree to which students receive the documented, non-self-reported grades E–A in all subjects from Kolada is understood as the dependent variable. This measure captures both “equity and excellence” as it shows that in high-performing municipalities a large share of students performs at least “good enough” (E) in all subjects or better. Hence, it was preferred over average national test scores. Moreover, as underlined in Boman (2022b) national test results and grades are highly intercorrelated (r = 0.899) why a single measure might be quite sufficient. As Gustafsson and Yang Hansen (2018) emphasize, the inclusion of more grades increases reliability why GAS is reliable in that respect. However, might grade point averages (GPA) be a more suitable measure of grades than GAS? (e.g., Molin and Fjellborg, 2021). That aspect was considered by a consecutive bivariate analysis of the data which shows that the correlation between municipality GAS and municipality GPA for the year 2019 was r = 0.802, which indicates that a researcher may use GAS, GPA, NTR, or a combination of these three indicators in regard to educational achievement in the Swedish context. Whereas GPA is more usual than GAS it was also important to use the exact same outcome variable in order to have the replicate the earlier findings. Nonetheless, some robustness checks included GPA.
Migration background
The current study has some differences compared to Boman (2022b). Instead of using three different but moderately intercorrelated socioeconomic and sociodemographic variables (i.e., percentage of highly educated, welfare recipients, and non-natives in each municipality) it used only non-natives and only data on public schools instead of average scores for both municipal and independent schools from the regional Kolada database.1 An advantage with Kolada in this regard, compared to Sweden’s Statistics (2022) open data, is that percentages of natives and non-natives are found at the elementary and lower-secondary school level (i.e., Grade 1–9) and not just at the municipality level where only data on broad age groups (16–64) are available.
Socioeconomic status
With regard to SES, it included average income (in SEK, Swedish kronor) at the municipality level from Sweden Statistics (2022)2 as a broad indicator of SES. The parsimony of SES in this context is because of the large intercorrelations (above r = 0.50, see Cohen, 1988) between average income and percentage of highly educated (r = 0.669), and average income and welfare recipients (r = –0.691) in Sweden. Hence, a single SES indicator was deemed sufficient. Boman (2022b), on the other hand, included the percentage of highly educated and percentage of welfare recipients as SES indicators.
It is also worth to pay attention to that Kolada does not offer comprehensive statistics from 2013 but only full data on the years 2016–2018. Therefore, only comparable independent variables were sound to use. Moreover, a comparison between for instance 2016 and 2018 would be too narrow to identify meaningful trends over time in relation to both the dependent variable and the independent variables. The selection of specific years is also related to the curriculum (Lgr 11) and its new grading system (F–A) that was implemented around 2012. Hence, 2013 constitutes the first year for students who graduated from Grade 9 at the lower-secondary level. Thus, 2013 and 2018 comprise 2 years of complete comparability in terms of the dependent variables and independent variables.
Control variables
As in Boman (2022b), it also included geographical distance to major city (DMC) and teacher certification rates (TCR). The DMC variables constitute the distance from any municipality to cities with at least 100,000 inhabitants, as well as the important university town Kalmar which has slightly less than 70,000 inhabitants (see Supplementary Material). This variable captures important nuances regarding residence. For instance, urban clusters in Sweden can only partially predict academic achievement due to their heterogenous populations (Manhica et al., 2018; Vogiazides and Mondani, 2019) and many certified teachers work in towns or cities at a commuting distance from various urban clusters or vice versa. Concretely, this was measured with https://sv.distance.to/in kilometers by matching each municipality with the closest major city. A slight negative relationship was expected, because the further from a major city, the less likely such municipalities being inhabited by high-SES families and certified teachers, on average. While imperfect, this variable captures geographical dynamics and relationships within the urban–rural continuum in a more nuanced way than binary delineations (i.e., urban/rural).
In addition, it added two more school level variables for 2018 (these were not included in the 2013, as the School inspection’s survey is only available for the years 2016–2018): classroom climate (percentage of students who claim to have a peaceful classroom climate, “studiero”) and teacher competence (percentage of students who claim that their teachers explain what the students should do, shortened as TC in Supplementary Material). These are indicators of school quality, especially teachers’ basic didactic competence as it is perceived by students. For a few missing values on these two measures in some municipalities, 60% were used a standard replacement value for teacher competence and 50% for classroom discipline, which are slightly below the national averages.
Analytical strategy
The initial estimation model at the municipality level can be described as follows:
Gradem = XIncomemβ + XMigrantmβ + XControlsmβ + em,
where Grade is the percentage of the degree to which pupils receive the grades E–A in all subjects in municipality m, XIncomemβ are the coefficients of average income levels in municipality m, XMigrantmβ are the coefficients of average share of population with a migrant (i.e., non-native) background, and XControlsmβ are the coefficients of the included control variables (i.e., TCR, DMC, TC, classroom climate), and em is an error term.
Results
Descriptive statistics
In 2013, average aggregated GAS was 76.06% with a standard deviation of 7.96. In 2018, average GAS were 72.4% and with standard deviation of 8.86 (see Supplementary Material), which implies an average drop at the macro-national level by roughly 3.6%.
Regression output
Several OLS models (Tables 1, 2) had problems with multicollinearity because of the medium to high intercorrelations between some of the independent variables, but average income had the strongest relationship with GAS 2013 and GAS 2018, followed by the share of non-natives. However, the differences between these effect sizes are rather small, implying that both SES and migration/socio-demographics are crucial factors in relation to grades at this level. Moreover, the increase of non-natives (NNI) from 2013 to 2018 had a rather strong bivariate relationship with GAS 2018 (r = –0.513). This is roughly equal to the positive relationship between GAS 2018 and average income (r = 0.511). Hence, some of the fluctuations in relation to the aggregated grades might be partly attributable to the increase of non-natives because of migration.
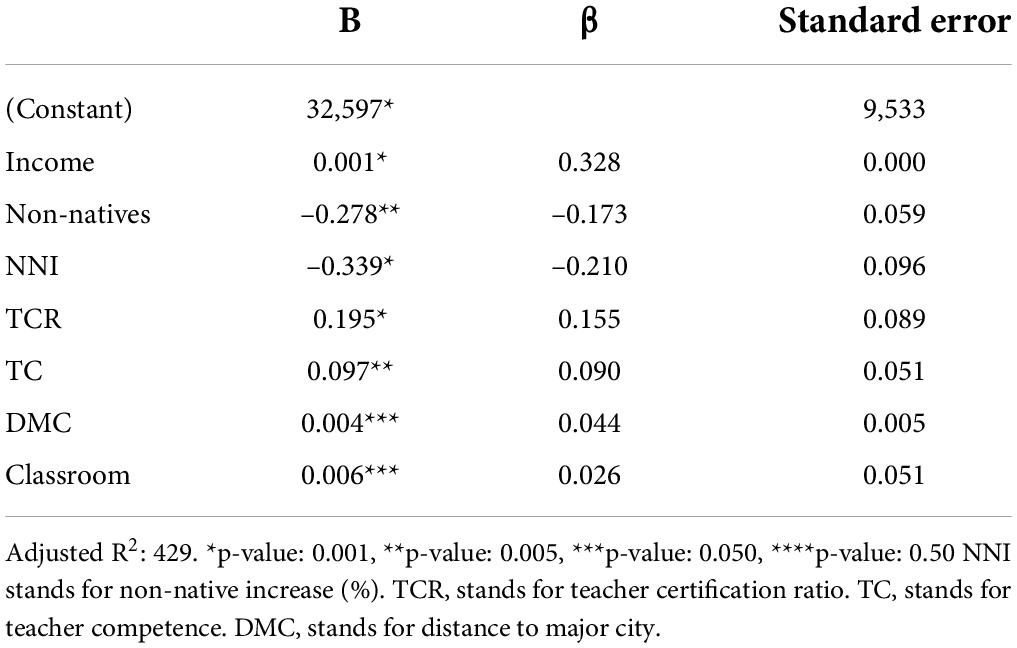
Table 1. Regression output for GAS 2018.
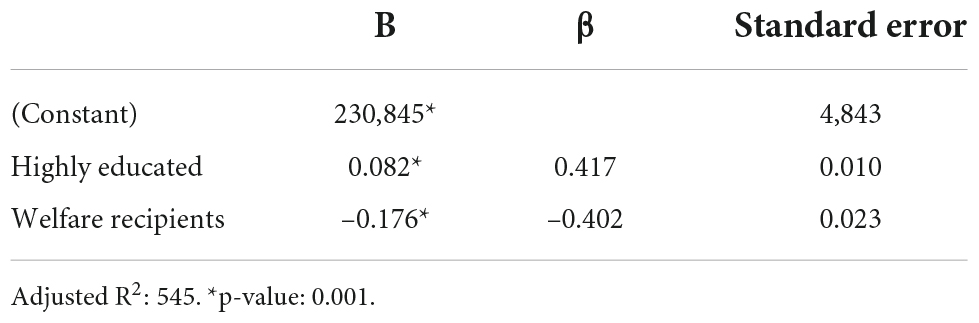
Table 2. Regression output for GPA 2019.
Only a few of the school related control variables (teacher competence) had a significant relationship with GAS. However, classroom climate and teacher competence were not strongly related to GAS.
Robustness checks
To test the robustness of the models, an alternative model was introduced which had GAS (2019) as the dependent variable in tandem with the independent variables from 2018 (see Supplementary Material). This is in part because the 2019 dataset (see Boman, 2022b) consists of both municipal and independent schools. The relationships were, however, robust (e.g., average income for 2018, β = 0.406).
In additional robustness models, sum scores for the 2013, 2018, and 2019 variables were created. GASsum was the dependent variable, whereas SESsum, NNsum, and TCRsum were the independent variables. The relationships were similar, although the composite SES variable had a slightly stronger relationship (β = 0.444). Moreover, GPA instead of GAS was used as the dependent variable in two additional models with 2019 data. In the first model, the highly educated SES variable was stronger (β = 0.651) when welfare recipients and geographical distance were omitted. In the second model, both geographical distance, TCR, and non-native shares became statistically significant, and the highly educated indicator effect size became smaller (β = 0.446, see Supplementary Material). Table 2 shows an OLS model which had no problems with multicollinearity and included these two SES indicators. This lends some support to the explanation that it is SES rather than MB “per se” that explains a substantial portion of grade point averages (Holmlund et al., 2019; Boman, 2021). Moreover, this also indicates that GAS is more sensitive to migration background than GPA. This might be due to the fact that especially first-generation migration students experience difficulties in school because of language abilities (Holmlund et al., 2019; Boman, 2022b) and therefore “fail” to attain E (pass) in all 17 school subjects at end of the compulsory school.
Lastly, the author created an interaction term between SES and migration background (i.e., percentages of non-natives) with grades all subjects (2018) as the outcome variable. However, the interaction term was not statistically significant (see Supplementary Material), even though the interaction term was aggregated and mean centered.
Discussion
Summary of the findings
One of the aims of this study was to replicate the findings from Boman (2021) by using very similar types of data (school level data aggregated to the municipality level), methods (OLS regression models), and variables. Indeed, the effect sizes (i.e., the standardized beta coefficients) are very similar to the ones which are reported in Boman (2022b). Boman (2022b) found an effect size of β = 0.301 for SES (there measured as the percentage of highly educated individuals) for the 2019, whereas the current study found β = 0.367 for 2013 β = 0.328 for 2018. The slight differences might be partly attributable to that the SES variable was not completely identical, and that Boman (2022b) also included another SES predictor (i.e., the percentage of welfare recipients). The effect size order for the independent variables (SES, migration background, teacher certification) were, however, the same. In two robustness models, the SES beta coefficient had larger effect sizes (β = 0.406 and 0.444). This might be related to the fact Boman (2022b) used a combination of public municipal schools and free schools whereas this study used only municipal school data. Hence, when the data and variables from the two studies were merged the relationships became somewhat affected. Nonetheless, the broader patterns are the same. However, it is difficult to make reliable inferences on the relationship between TCR and GAS 2013 and GAS 2018 because two cross-sectional data sets are compared. It might also be the case that earlier teachers affect students’ achievement to a larger degree than the current ones (e.g., Hanushek et al., 2019).
The overall findings of the study suggest that grades at the aggregated macro-national level have decreased by roughly 3.6% since 2013 and the overall share of non-natives has increased (in 2018), whereas TCR decreased from the first point of measure to the second. That does also indicate a partial relationship between non-native increases and decreases of certified teachers. Theoretically and empirically, this might be related to the so-called anti-Flynn effect (Dutton et al., 2016), which means that the earlier secular IQ gains (i.e., the Flynn effect, see e.g., Flynn, 2012) have turned negative because of, for example, social and educational factors (Dutton et al., 2016; Hernaes et al., 2019; Vainikainen and Hautamäki, 2022).
While distance to major cities (DMC) remains constant, the relationship between DMC and GAS has fluctuated somewhat but not significantly. Overall, based on this particular measurement there is no substantial relationship between urbanicity and grades at the national-regional level, although other studies have found such associations (e.g., Yang Hansen and Gustafsson, 2016). However, as emphasized in Boman (2022b) it is notable that many of the high-performing municipalities in Sweden are located in the Stockholm region (e.g., Danderyd, Lidingö, see Supplementary Material).
The overall picture suggests the share of non-natives affects school results, and that optimal migration, integration and school policies therefore are important for the facilitation of heterogenous groups of students and to increase achievement among those that are, at least initially, low-performers. This relationship is of a similar magnitude as SES, here measured by average income levels. This is also stressed in earlier research (e.g., Gustafsson and Yang Hansen, 2018; Boman, 2022b). Specifically, here a SES variable was associated with academic achievement but because of the rather strong interrelationship with socio-demographic variables such as the share of non-natives (an indicator of migration background) it is difficult to interpret these findings. However, it appears likely that current and previous migration patterns increase the share of low-SES households and individuals (e.g., Ruist, 2015).
Some municipalities have increased GAS in 2018 compared to 2013, in spite of increased shares of non-natives, which might inspire qualitative research such as interviews and case studies with minority students that could counter negative stereotypes (e.g., Jutengren and Medin, 2019). The negative relationship between non-natives on GAS is probabilistic, not causal, or entirely pessimistic (Boman, 2021). This leaves room for further school improvement. As is notable in Supplementary Material (2018 data), both classroom climate, teacher competence and TCR may be improved because the values appear rather low. All such are, ceteris paribus, comparative advantages for schools and schoolchildren in general (Granvik Saminathen et al., 2018), although the effects may be small. It seems that the most crucial variables are SES, migration background, and teacher certification, which is one aspect of teacher competence (Alatalo et al., 2021). However, because of the unexplained variance (see Tables 2, 3) there might be omitted variables that stem from the limitations of using aggregated data. Two candidates are cognitive and non-cognitive abilities (e.g., Flores-Mendoza et al., 2021; Thorsen et al., 2021; Boman, 2022a,c). However, it appears unlikely that such data will be collected for all or even the majority of Sweden’s schools and municipalities. Attendance and classroom climate, which may be aggregated to for instance the school level, are loosely tangential to non-cognitive abilities such as conscientiousness but also related to SES (e.g., Ning et al., 2015). Thus, these are not appropriate indicators of conscientiousness. Hence, the aggregated data will not just provide somewhat biased effect sizes but also omitted variables in such regards. Nonetheless, SES (e.g., average income) and migration background (e.g., the percentage of students with a non-native background) are two important cues for school results in Sweden, and perhaps in other contexts, that seem to explain much of the variability in school results such as aggregated grade point averages or similar outcome variables.
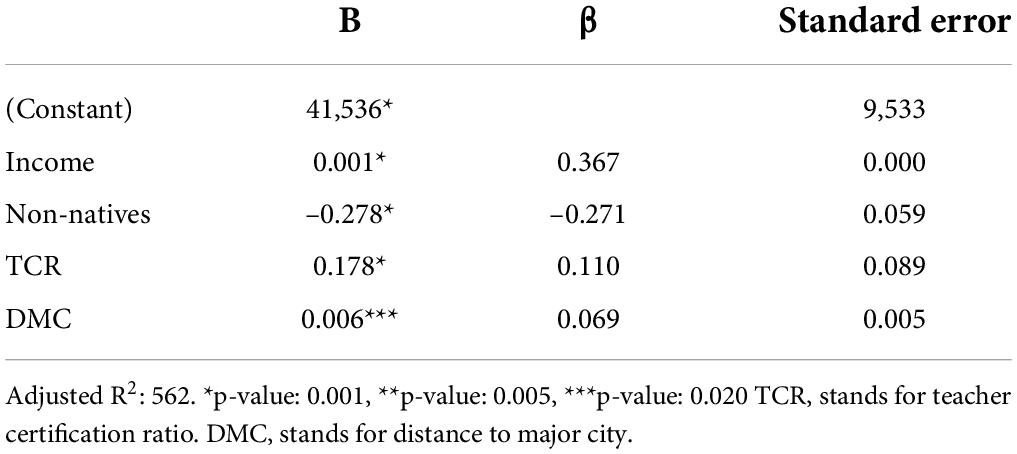
Table 3. Regression output for GAS 2013.
The study has several limitations as aggregated data are comprehensive but crude and may provide misleading information on the relationships between for instance teacher quality indicators and school achievement (e.g., Hanushek et al., 1996). Furthermore, TCR and perceived basic teacher competence were weakly correlated in the present study and therefore it seems implausible that they capture a similar underlying factor. Hence, it is difficult to draw reliable conclusions in that respect. Lastly, other factors such as lower quantities of school-related reading might have influenced grades negatively over time (Vinterek et al., 2020) and this was not controlled for in the present study. Furthermore, as height is associated with educational attainment and achievement (e.g., Cinnirella et al., 2011) it would be useful to include additional biosocial covariates. However, such are not found within the frames of current data sources.
Nonetheless, the study shows that GAS were lower in 2018 than in 2013. A reason for this decline seems to be the increase of non-natives in Swedish school at lower-secondary level (and overall in society), although average income levels increase over time and the positive relationship with grades was somewhat stronger in 2018 (this was also the case with TCR). Hence, it is possible that this statistical relationship is masked by grade inflation, or conversely, that a grade inflation might take place even though the aggregated grades point to a decline of 3.6% because of the increase of non-natives due to migration. It is also plausible that the increase of non-natives has led to a decrease of certified teachers in a large share of Swedish municipalities. All in all, this shows that research on academic performance, as measured by for example grades, in the Swedish context must account for especially SES and secondarily migration background and teacher competence.
Data availability statement
The original contributions presented in this study are included in the article/Supplementary Material, further inquiries can be directed to the corresponding author.
Author contributions
The author confirms being the sole contributor of this work and has approved it for publication.
Funding
Stockholm University was a part of the Bibsam agreement.
Conflict of interest
The author declares that the research was conducted in the absence of any commercial or financial relationships that could be construed as a potential conflict of interest.
Publisher’s note
All claims expressed in this article are solely those of the authors and do not necessarily represent those of their affiliated organizations, or those of the publisher, the editors and the reviewers. Any product that may be evaluated in this article, or claim that may be made by its manufacturer, is not guaranteed or endorsed by the publisher.
Supplementary material
The Supplementary Material for this article can be found online at: https://www.frontiersin.org/articles/10.3389/feduc.2022.854342/full#supplementary-material
Footnotes
References
Alatalo, T., Hansson, A., and Johansson, S. (2021). Teacher’s academic achievement: evidence from Swedish longitudinal register data. Eur. J. Teach. Educ. 1–21.
Aurini, J., Missaghian, R., and Milian, R. (2020). Educational status hierarchies, after-school activities, and parenting logic: lessons from Canada. Sociol. Educ. 93, 173–189.
Azzaloni, D., Schnell, P., and Palmer, J. R. (2012). Educational achievement gaps between immigrant and native students in two “new” immigration countries: Italy and Spain in comparison. ANN. Am. Acad. Polit. Soc. Sci. 643, 46–77. doi: 10.1177/0002716212441590
Bennett, P. R., Lutz, A. C., and Jayaram, L. (2012). Beyond the schoolyard: the role of parenting logics, financial resources, and social institutions in the social class gap in structured activity participation. Sociol. Educ. 85, 131–157. doi: 10.1177/0038040711431585
Björklund, A., Fredriksson, P., Gustafsson, J.-E., and Öckert, B. (2010). Den svenska utbildningspolitikens arbetsmarknadseffekter. Vad säger forskningen? Available online at: https://www.ifau.se/Forskning/Publikationer/Rapporter/2010/Den-svenska-utbildningspolitikens-arbetsmarknadseffekter-vad-sager-forskningen/ (accessed August 10, 2022).
Boman, B. (2021). Parallelization: the fourth leg of cultural globalization theory. Integ. Psychol. Behav. Sci. 55, 354–370. doi: 10.1007/s12124-021-09600-4
Boman, B. (2022a). PISA achievement in Sweden from the perspective of both individual data and aggregated cross-country data. Front. Educ. 6:753347. doi: 10.3389/feduc.2021.753347
Boman, B. (2022c). Educational achievement among East Asian school children 1967-2022: A thematic review of the literature. International Journal of Educational Research Open, 3.
Boman, B. (2022b). Regional differences in educational achievement among Swedish Grade 9 students. Scand. J. Educ. Res. 66, 610–625.
Boman, B. (2022d). The influence of SES on grades: crossectional and longitudinal evidence from two Swedish cohorts. Eur. J. Psychol. Educ.
Borghans, L., Golsteyn, B., Heckman, J., and Humphries, J. (2016). What achievement tests measure. Proc. Natl. Acad. Sci. U.S.A. 51, 13355–13359. doi: 10.1073/pnas.1601135113
Bronfenbrenner, U. (1977). Toward an experimental ecology of human development. Am. Psychol. 32, 513–531.
Bunar, N. (2010). Choosing for quality or inequality: current perspectives on the implementation of school choice policy in Sweden. J. Educ. Policy 25, 1–18.
Carlhed, C. (2017). The social space of educational strategies: exploring patterns of enrolment, efficiency and completion among Swedish Students in undergraduate programmes with professional qualifications. Scand. J. Educ. Res. 61, 503–525.
Cinnirella, F., Piopiunik, M., and Winter, J. (2011). Why does height matter for educational attainment? Evidence from German children. Econ. Hum. Biol. 9, 407–418. doi: 10.1016/j.ehb.2011.04.006
Deary, I., Strand, S., Smith, P., and Fernandes, C. (2007). Intelligence and educational achievement. Intelligence 35, 13–21.
Devine, J. (1996). Maximum Security: The Culture of Violence in Innercity Schools. Chicago, IL: The University of Chicago Press.
Dutton, E., van der Linden, D., and Lynn, R. (2016). The negative Flynn effect: a systematic literature review. Intelligence 59, 163–169.
Edmark, K., and Persson, L. (2021). The impact of attending an upper secondary school: evidence from Sweden using a school ranking data. Econ. Educ. Rev. 84:102148.
Ekberg, J. (1999). Immigration and the public sector: income effects for the native population in Sweden. J. Popul. Econ. 12, 411–430.
Engelhardt, L., Church, J., Harden, P., and Tucker-Drob, E. (2018). Accounting for the shared environment in cognitive abilities and academic achievement with measured socioecological contexts. Dev. Sci. 22:e12699. doi: 10.1111/desc.12699
Falk, A., Kosse, F., Pinger, P., Schildberg-Hörisch, H., and Deckers, T. (2021). Socioeconomic status and inequalites in Children’s IQ and economic preferences. J. Polit. Econ. 129, 2504–2545.
Fjellman, A. M., Yang Hansen, K., and Beach, D. (2019). School choice and implications for equity: the new political geography of the Swedish upper secondary school market. Educ. Rev. 71, 518–539.
Flores-Mendoza, C., Ardila, R., Gallegos, M., and Reategui-Colareta, N. (2021). General intelligence and socioeconomic status as strong predictors of student performance in Latin American schools: evidence from PISA items. Front. Educ. 6:632289. doi: 10.3389/feduc.2021.632289
Flynn, J. (2012). Are We Getting Smarter? Rising IQ in the Twenty-First Century. Cambridge: Cambridge University Press.
Granvik Saminathen, M. G., Brolin Låftman, S., Almquist, Y. B., and Modin, B. (2018). Effective schools, school segregation, and the link with school achievement. Sch. Effect. Sch. Improve. 29, 464–484.
Guglielmi, S., and Brekke, N. (2017). A framework for understanding cross-national and cross-ethnic gaps in math and science achievement: the case of the United States. Comp. Educ. Rev. 61, 176–213.
Gustafsson, J.-E. (2008). Effects of international comparative studies on educational quality on the quality of educational research. Eur. Educ. Res. J. 7, 1–17.
Gustafsson, J.-E., and Yang Hansen, K. (2018). Changes in the impact of family education on student educational achievement in Sweden 1988–2014. Scand. J. Educ. Res. 62, 719–736.
Gynatagningen (2019). Preliminär Antagning 2019 (Preliminary admission 2019). Available online at: https://www.gyantagningen.se/antagningspoang-och-rapporter/preliminar-antagning/prel-antagning-2019.html (accessed August 10, 2022).
Hanushek, E., Piopiunik, M., and Wiederhold, S. (2019). The value of smart teachers: international evidence on teacher cognitive skills and student performance. J. Hum. Resour. 54, 857–899.
Hanushek, E. A., Rivkin, S. G., and Taylor, L. L. (1996). Aggregation and the estimated effects of school resources. Rev. Econ. Stat. 78, 611–627.
Hasselgren, E. (2018). Varför Lärarstudenter Hoppar av. En Studie om Orsakerna Bakom från Lärarutbildning vid Göteborgs Universitet. Göteborg, report 2018:2. Göteborg: Göteborgs universitet.
Hennerdal, P., Malmberg, B., and Andersson, E. K. (2020). Competition and school performance: swedish school leavers from 1991–2012. Scand. J. Educ. Res. 64, 70–86.
Hernaes, Ø, Markussen, S., and Røed, K. (2019). Television, cognitive ability and high school completion. J. Hum. Resour. 54, 371–400.
Holmlund, H., Sjögren, A., and Öckert, B. (2019). SOU, Jämlikhet i möjligheter och utfall i den svenska skolan. Bilaga 7 till Långtidsutredningen 2019. Available online at: https://www.regeringen.se/4adad2/contentassets/23c13d7ae0ef48e4bed43b68917573d3/jamlikhet-i-mojligheter-och-utfall-i-den-svenska-skolan-sou-201940.pdf (accessed August 10, 2022).
Jutengren, G., and Medin, E. (2019). Cross-ethnic friendship and prosocial behavior’s potential significance to elementary children’s academic competence. J. Educ. Res. 112, 38–45.
Kim, S. W., Cho, H., and Kim, L. Y. (2019). Socioeconomic status and academic outcomes in developing countries: a meta-analysis. Rev. Educ. Res. 89, 875–916.
Kuncel, N. R., Credé, M., and Thomas, L. L. (2005). The validity of self-reported grade point averages, class ranks, and test scores: a meta-analysis and review of the literature. Rev. Educ. Res. 75, 63–82.
Larsson, E. (2019). Innerstadsgymnasierna. En studie av tre Elitpräglade Gymnasieskolor i Stockholm och deras Positionering på Utbildningsmarknaden. Ph.D. thesis. Stockholm: Stockholm University.
Lindbom, A. (2010). School choice in Sweden: effects on student performance, school costs, and segregation. Scand. J. Educ. Res. 54, 615–630.
Makel, M., and Plucker, J. (2014). Facts are more important than novelty: replication in the education sciences. Educ. Res. 43, 304–316.
Manhica, H., Berg, L., Almquist, Y. B., Rostila, M., and Hjern, A. (2018). Labour market participation among young refugees in Sweden and the potential of education: a national cohort study. J. Youth Stud. 22, 533–550.
Meunier, M. (2011). Immigration and student achievement: evidence from Switzerland. Econ. Educ. Rev. 30, 16–38.
Molin, L., and Fjellborg, A. A. (2021). Geographical variations in the relation between final course grades and results on the national tests in social sciences, 2015–2017. Educ. Rev. 73, 451–469.
Myrberg, E., and Rosén, M. (2009). Direct and indirect effects of parents’ education on reading achievement among third graders in Sweden. Br. J. Educ. Psychol. 79, 695–711.
Ning, B., Van Damme, J., Liu, H., Vanlaar, G., and Gielen, S. (2015). The influence of school disciplinary climate on reading achievement: a cross-country comparative study. Sch. Effect. Sch. Improve. 26, 586–611.
OECD (2022). Policy Dialogues in Focus for Sweden. International Insights for School Funding Reform. Paris: OECD.
Piandosi, S., Byar, D., and Green, S. (1988). The Ecological fallacy. Am. J. Epidemiol. 127, 893–904.
Reimer, D., Jensen, S. S., and Kjeldsen, C. (2018). “Social inequality in student performance in the Nordic countries,” in Northern Lights on TIMSS and PISA 2018 (Copenhagen: TeamNord), 31–60.
Ruist, J. (2015). The Fiscal cost of refugee immigration: the example of Sweden. Popul. Dev. Rev. 41, 567–581.
Sackett, P. R., Kuncel, N. R., Arneson, J. J., Cooper, S. R., and Waters, S. D. (2009). Does socioeconomic status explain the relationship between admissions tests and post-secondary academic performance? Psychol. Bull. 135, 1–22. doi: 10.1037/a0013978
Sanandaji, T. (2020). Mass Challenge: The Socioeconomic Impact of Migration to a Scandinavian Welfare State. New York, NY: Palgrave Macmillan.
Singer, J. D. (1961). World Politics. The International System: Theoretical Essays. Cambridge: Cambridge University Press.
Sirin, S. (2005). Socioeconomic status and academic achievement: a meta-review of research. Rev. Educ. Res. 75, 417–453.
SVT (2018). 0,05 på Högskoleprovet – Tillräckligt för att bli Antagen till Lärarutbilningen. Available online at: https://www.svt.se/nyheter/inrikes/0-05-poangpa-hogskoleprovet-tillrackligt-for-att-bli-larare (accessed August 10, 2022).
Sweden Statistics (2022). Statistics of Sweden. Available online at: https://www.scb.se/ (accessed August 10, 2022).
Swedish National Agency for Education (2009). Vad påverkar resultaten i svensk grundskola? Kunskapsöversikt om betydelsen av olika faktorer [What affects the results in Swedish elementary education?]. Stockholm: Sweden’s Ministry of Education.
Swedish National Agency for Education (2016). Invandringens betydelse för skolresultaten. Stockholm: Sweden’s Ministry of Education.
Swedish National Agency for Education (2018). Curriculum for the Compulsory School, Preschool Class and School-age Educare. Stockholm: Sweden’s Ministry of Education.
Tan, C. Y. (2015). The contribution of cultural capital to students’ mathematics achievement in medium and high socioeconomic gradient economies. Br. Educ. Res. J. 41, 1050–1067.
Thorsen, C., Yang Hansen, K., and Johansson, S. (2021). The mechanisms of interest and perseverance in predicting achievement among academically resilient and non-resilient students: evidence from Swedish longitudinal data. Br. J. Educ. Psychol. 91, 1481–1497. doi: 10.1111/bjep.12431
Turkheimer, E., Haley, A., Waldron, M., D’Onofrio, B., and Gottesman, I. (2003). Socioeconomic status modifies heritability of IQ in young children. Psychol. Sci. 14, 623–628.
Vainikainen, M.-P., and Hautamäki, J. (2022). Three studies on learning to learn in Finland: anti-flynn effects 2001–2017. Scand. J. Educ. Res. 66, 43–58.
Vinterek, M., Winberg, M., Tegmark, M., Alatsurname>Alatalo, T., and Liberg, C. (2020). The decrease of school related reading in Swedish Compulsory School – Trends Between 2017 and 2017”. Scand. J. Educ. Res. 66, 119–133.
Vogiazides, L., and Mondani, H. (2019). A geographical path to integration? Exploring the interplay between regional context and labour market integration among refugees in Sweden. J. Ethnic Migrat. Stud. 46, 23–45.
Wiklund, M. (2018). The Media apparatus in the becoming of education policy: education media discourse during two electoral periods. J. Crit. Educ. Policy Stud. 16, 99–134.
Keywords: Sweden, educational achievement, grades, socioeconomic status, migration
Citation: Boman B (2022) Regional differences in educational achievement: A replication study of municipality data. Front. Educ. 7:854342. doi: 10.3389/feduc.2022.854342
Received: 13 January 2022; Accepted: 01 July 2022;
Published: 28 July 2022.
Edited by:
George Waddell, Royal College of Music, United KingdomReviewed by:
Lilly Augustine, Jönköping University, SwedenY. Selvamani, International Institute for Population Sciences (IIPS), India
Copyright © 2022 Boman. This is an open-access article distributed under the terms of the Creative Commons Attribution License (CC BY). The use, distribution or reproduction in other forums is permitted, provided the original author(s) and the copyright owner(s) are credited and that the original publication in this journal is cited, in accordance with accepted academic practice. No use, distribution or reproduction is permitted which does not comply with these terms.
*Correspondence: Björn Boman, Y29udGFjdEBiam9ybmJvbWFuLmNvbQ==