 January Durant
 Daniel B. Wright
- Department of Educational Psychology, University of Nevada, Las Vegas, NV, United States
MAP Growth (MAP) and Smarter Balanced assessment (SBA) are two of the most common standardized assessments used in Pre-Kindergarten to Grade 12 education in the United States. We show how scores on MAP relate to scores on SBA for third grade students. Previous studies examining the relationship between MAP Growth and SBA have been conducted by the test publisher. The current study expands on this and examines how scores on MAP Growth relate to scores on SBA and examine if these relationships vary by when the MAP Growth assessment is taken or by student demographics (by English language proficiency, gender, and ethnicity). Scores on these assessments are compared for 3rd grade students from Clark County, Nevada, which is the fifth largest school district in the United States. The scale scores were associated and, when using MAP to predict SBA scores, followed a quadratic pattern. While students' scores on the assessments varied by English language proficiency, gender, and ethnicity (i.e., discrepancies that are often referred to as achievement gaps), the relationships between these assessments showed a similar pattern across these demographics. Growth scores were calculated for three MAP administration time points. As well as showing a slight “rich get richer” effect (i.e., slightly more growth for those scoring high), there were regression toward the mean effects. The MAP growth curves were similar by English language proficiency, gender, and ethnicity.
1. Exploring the Associations Between MAP Growth and SBA by Demographics
The primary goal of this paper is to show how the scores on MAP Growth (MAP, by NWEA) relate to scores on the Smarter Balanced Assessment (SBA), and to examine if these relationships vary by when the MAP is taken and by student demographics (by English language proficiency, gender, and ethnicity). MAP Growth is a set of assessments designed to give formative feedback throughout the year for pre-kindergarten to Grade 12 (PK–12) students. NWEA state their assessments are used in 9,500 school districts in 145 countries (www.nwea.org). The MAP Growth assessment is the most used of their assessments within PK-12 and here will be referred to as MAP. SBA (smarterbalanced.org) has been developed by several US states (the consortium has had up to 30 member states) and its assessments are used, among other things, in grades 3–8 and 11 as summative end of year assessments to measure academic “proficiency” of students. In the US, state and federal law currently requires schools to report academic proficiency data and SBA is commonly used for this purpose. Alignment studies conducted by NWEA, indicate MAP Growth scores align with SBA scores; thus, MAP growth scores may be used to identify students who may not be on track to meet end of year academic proficiency standards. Given that MAP and SBA are two of the most commonly used assessments in the US and there is a paucity of peer reviewed research examining their relationship, further investigating the relationship between these tests and whether the relationship varies by characteristics of the students is important. The data examined here come from Clark County, Nevada, which is a large ethically diverse school district where students take both MAP and SBA.
SBA converts the scale scores, which range from ~2,000–3,000, into four levels. States can use different verbal labels to describe these and in Nevada the labels used are: minimal understanding, partial understanding, proficient, and advanced. For Federal reporting purposes, states often just report the proportion at levels 3 or 4 (i.e., at least proficient). Because of this NWEA have produced reports for how MAP scores relate to either just this threshold or the three thresholds differentiating the four levels on SBA. Their most recent (at the time of writing) report comparing MAP and SBA is at www.nwea.org/resources/sbac-linking-study/ (NWEA, 2021).
It is important to stress that transforming the scale scores into categories causes information to be lost (MacCallum et al., 2002; Altman and Royston, 2006) and this is recognized by SBAC.
Although Achievement Level Descriptors are intended to aid interpretation of the four categories, they are less precise than scaled scores for describing student growth or changes in achievement gaps among groups of students since they do not reveal changes of student scores within the four levels. Thus, achievement levels should be understood as representing approximations of levels at which students demonstrate mastery of a set of concepts and skills.
https://validity.smarterbalanced.org/scoring/ (Oct. 24, 2021)
As such, here the MAP scale scores are compared with the SBA scale scores. This allows more information to be used in comparing these measures.
Psychometricians talk of three ways to compare scores from two tests: equating, aligning, and predicting (e.g., Holland and Dorans, 2006; Dorans et al., 2011). Equating requires that the tests measure the same construct (and no constructs that the other does not) and that they are equally difficult and equally reliable. Students taking high stakes standardized tests will often receive different forms of the test. They are equitable if no student should have a preference about which form they take. These conditions are usually only applicable with parallel forms of the same test. Scale aligning requires matching points from the scales onto a common metric (Dorans et al., 2011). How this common scale score is used depends on further assumptions. Sometimes this is called the concordance of the two tests. For example, the following report shows the concordance of two tests often used for undergraduate admissions in the US: the ACT and SAT scores: www.act.org/content/act/en/products-and-services/the-act/scores/act-sat-concordance.html. Each test is treated the same by the statistical procedure. Prediction requires the fewest assumptions and the two assessments are treated differently. One assessment is used to predict scores on the other assessment. This is the approach taken here. As these assessments are not designed to measure the same construct, here the appropriate approach is prediction. Because the SBA scores are used for federal reporting, the MAP scores will be used to predict the SBA scores using regression.
The three MAP administrations can be used to measure academic growth throughout the year. These growth estimates can be compared by demographics. We can also examine whether students who begin the year with high scores tend to have lower growth than students who begin with low scores. This often occurs when the initial scores are not perfectly reliable, so include part true score and part what is assumed random error. This is true for all educational assessments (American Educational Research Association et al., 2014). It is assumed that while the true score remains relatively stable, those with very high random errors will have less positive error terms on subsequent assessments, and vice versa for those with initially very low error scores. This will lead to the tendency for scores to regress towards the mean (Galton, 1886). The opposite finding, that high scoring students increase or the “rich get richer” effect–also referred to as the Matthew Effect (e.g., Stanovich, 1986) based on a story in the Gospel of Matthew–predicts those with initially high scores grow more. As the regression to mean occurs simply because of the way in which test scores are estimated, we predict regression to the mean to occur.
2. Analysis Plan
The main descriptive procedures are scatter plots with the SBA scores on the vertical axis and MAP scores on the horizontal axis. Because the scores on the SBA have a ceiling, about one percent in the sample scored at the maximum (and a smaller amount at the minimum), a Tobit regression is used (Tobin, 1958). While this is a small percentage, if an unbounded regression is used this produces large over-predictions for high MAP scores. Because Tobit regressions are more common in economics than education research, a brief review of this approach is warranted. Tobin (1958) created a model where it is assumed that there is some normally distributed variable but that the values beyond some threshold have all been given that threshold as a value. This is described as censored data. This ceiling effect is intended because the test is not designed to measure precisely at these extremes because the federal government simply asks for the proportion of students above different thresholds. In order to reliably produce estimates at high values would require lengthening the assessment by including a greater number of difficult questions. The statistical approach often used when there is a cut-off where scores above this value are just given the cut-off value is Tobit regression. The Tobit approach is popular in econometrics and biostatistics, and has been discussed for other areas (e.g., Wright et al., 2011). Tobit regression can be run in R (R Core Team, 2022) using the survreg function (Therneau, 2021) or more conveniently using a wrapper function for this, called tobit, that is in the AER package (Kleiber and Zeileis, 2008).
The regression modeling begins with a linear model, without demographic variables. A quadratic model and a model with two lines connected at the median (so both one additional degree of freedom) are then tested. The model with two lines connected at the median is sometimes called the broken-stick model. This is a type of B-spline, more details are discussed in James et al. (2013, p. 271–276). The quadratic and the broken stick model were chosen because they are equally complex, each estimating two parameters (the linear slope and quadratic terms for the quadratic models, and the slopes for the line each side of the median for the broken stick model). Models with more degrees of freedom were also examined but these did not improve the fit substantively. R2 is used to compare models as it is a well-known measure. p-values are not used in this paper for several reasons, including: many readers misunderstand them (e.g., Oakes, 1986, and many others); the sample size is large enough so that even minute effects will be “significant” (e.g., Cohen, 1994); and for data security reasons we do not have school identifiers which means that the data are not independent, an assumption for the p-values' accuracy (e.g., Goldstein, 2011). Once a model has been chosen, the demographic variables are included to explore if the associations between SBA and MAP are similar for these groups.
Many of the technical reports by NWEA match the scores for the two assessments for the proportion of the sample with scores less than or equal to this score, called equi-percentile linking, and show the concordance of the two measures (i.e., scale aligning). This approach matches, for example, the scores associated with the 42nd percentile of each assessment. Depending on the granularity of the assessment scores this creates a monotonically increasing step-function between the two measures. These analyses are available from the authors, but not included in this report.
We also examine growth throughout the year on the three MAP administrations (i.e., fall, winter, spring) and explore whether the growth estimates are associated with the demographics. There are many approaches to growth modeling (e.g., Grimm et al., 2017). The approaches that we use are:
1. Multilevel models. Whether the assessment was given in fall, winter, or spring is coded as a variable used to predict the MAP scores. The intercept and the slope are allowed to vary by person [scoreij = (β0 + u0j) + (β1 + u1j)administrationij+eij], and the conditional modes for each u1j are calculated. β1 is added to these to create slope estimates.
2. Structural equation models. A growth model is defined such that there is a latent variable for the intercept and a latent variable for the slope (Bauer, 2003; Curran, 2003). The estimated slopes from this procedure should be similar to the estimate from the multilevel/conditional modes procedure. In many cases, depending on coding and some aspects of the data, they can be identical (McNeish and Matta, 2018).
3. The observed slope for each student. The third approach is less complex. This can have advantages because with only three time points and some missing values, the complex approaches can have computational problems (Wright, 2017). Let the estimate for the slope be the observed slope of each person who has two or three points. If they only have one or zero MAP assessments, they do not get a slope for this or any of the slope estimation procedures. If these estimates are very different from those found with either of the first two procedures it suggests that those more complex procedures may be unreliable because of having so few values per person and therefore this simpler approach would be preferred. Otherwise the more complex approaches will likely be more accurate.
Three approaches are used because with a small number of time points (a maximum of three per person) care must be taken when calculating a growth score. The first two approaches can produce conditional modes and latent variables that either have the slope and intercept values highly correlated (r > 0.99) or near zero variance terms for one of them near zero. If the different approaches give different estimates the third approach, the observed slopes, will be used as recommended in Wright (2017). If the estimates from the different procedures are similar (r > 0.9) the estimates from the first two approaches are preferred as they use information from other students to produce better estimates for the individual students. Efron and Morris (1977) provide a clear description of how using information from others, in effect shrinking the estimates toward the sample mean, improves accuracy of the individual estimates. If the estimates are all similar for the three procedures the conditional modes approach will be used.
The analysis was done using R (R Core Team, 2022). The code for our analysis, as part of the final submitted version of this paper in a knitr file (Xie, 2015), is at https://github.com/dbrookswr/Psychometrics/blob/master/ccsdresultspap.Rnw. Accessing the data requires permission from the Clark Country School District (CCSD) so the data are not placed there. The following R packages were used for analyses: AER (Kleiber and Zeileis, 2008), lavaan (Rosseel, 2012), and lme4 (Bates et al., 2015).
3. The Data
Data were drawn from existing electronic educational records of students who attended school within CCSD during the 2018–2019 school year (pre-COVID 19). CCSD is located in southern Nevada and is the fifth largest school district in the United States. Clark County, Nevada, includes a large urban area (e.g., Las Vegas, Henderson, North Las Vegas, Paradise), suburbs, and some rural areas. According to the 2010 census, there are about two million people living there, with 61% White, 11% African American, 9% Asian, <1% of Pacific Islander, <1% American Indian, 14% from other races, and 5% from two or more races. Twenty-nine percent of residents identified as of Hispanic origin. The current demographics of the Las Vegas area are likely to be similar to the US as a whole within a few decades (e.g., Frey, 2015; Kolko, 2017).
During the 2018–2019 school year there were 384 schools and 325,081 students enrolled within CCSD. Data were requested from the Assessment, Accountability, Research, and School Improvement Division at CCSD. We received data on 23,324 third grade students. The following variables were included in the data set: student age, gender, ethnicity, English proficiency, six MAP scores on the 2018–2019 fall, winter, and spring administrations for reading and math, and two SBA scores for English, language, arts (ELA), and math. The SBA is given is given in the spring, so is closest in time to the spring MAP administration. All students enrolled in third grade with test data were included in the sample. Data for all grades where SBA is administered were requested, but only grade three data were made available.
3.1. Ethics Statement
This study received ethics approval from UNLV IRB and received approval from the CCSD Research Review Committee.
4. Results
4.1. Descriptive Statistics
Descriptive statistics for demographic variables are listed in Table 1. Ethnicity is divided into seven categories. The Pacific Islander and Native American categories have fewer people than the others. These will be combined for modeling purposes. Table 2 shows descriptive statistics for the four assessments. The MAP scores increase throughout the year. The means for these tables are shown broken down by the demographic variables in the Appendix.
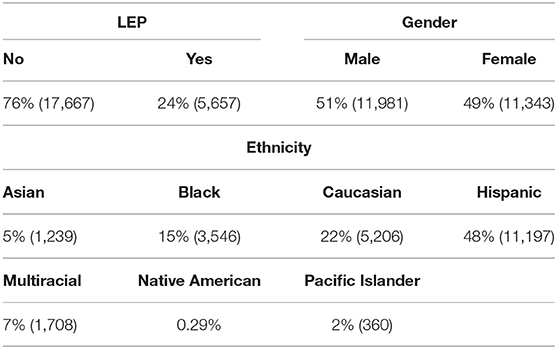
Table 1. Percentages in the sample for Limited English Proficiency (LEP), by gender, and by ethnicity. The gender variable is binary.
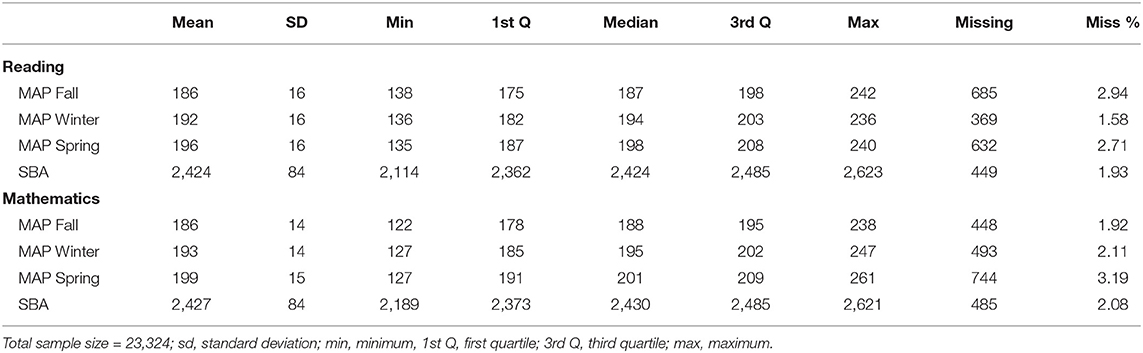
Table 2. Descriptive statistics for the assessments.
The assessments use different scales. To allow comparisons across assessments to be more apparent, in subsequent analyses these assessment scores are scaled such that their means are 0 and their standard deviations are 1. Figure 1 shows 5,000 randomly chosen data points for the two SBAs with each of the MAPs for the corresponding content area. Only 5,000 are used so that the density of points in different regions of these plots can be seen. Besides the SBAs being censored (seen most clearly at the maximum), there is a non-linear pattern for each of these. A quadratic relationship between MAP and SBA improves the fit for each MAP administration. The curves are drawn based on the entire sample for the Tobit regressions using both linear and quadratic terms for the MAPs variables to predict SBA [i.e., ]. Three observations can be drawn from these. First, all the MAP administrations are positively associated with SBA scores. Second, the quadratic curves seem to summarize these associations fairly well. Third, the spread of the data around these curves appears to be getting less from fall, to winter, to spring MAP administrations, or in other words the association with SBA is stronger the closer the administration dates are too each other.
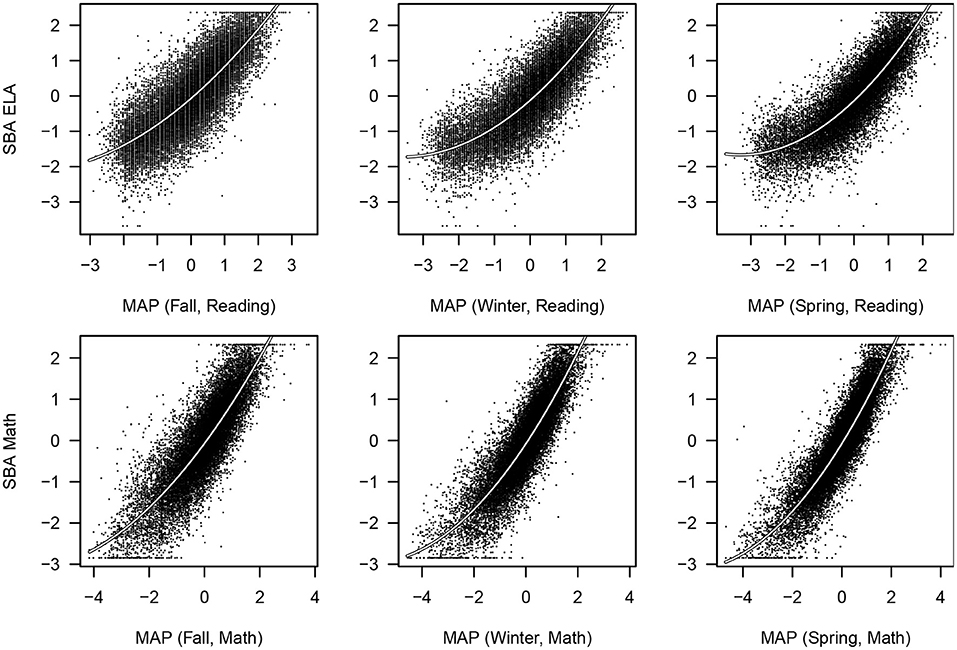
Figure 1. Six scatter plots for 5,000 SBA and MAPs values (jittered).
4.2. Tobit Regressions
Tobit regressions were conducted to predict the SBA scores from the associated MAP scores. This was done for four separate models: linear, quadratic, a broken stick model (two linear components joined at the median), and a cubic polynomial (higher order spline models were considered but they did not improve the fit substantively). Table 3 shows the Pearson correlations between the predicted values and the observed values for each pair of variables in Figure 1. The highest values are for the relationships between SBA and the Spring MAP administrations. This is expected as these were administered closer in time to the SBA than the other MAP administrations. These will be the focus when exploring group differences. The linear model uses two degrees of freedom (intercept and slope). The quadratic and broken stick models use one additional degree of freedom. Of the these, the quadratic has the higher R2 values (see Table 3). The cubic regression uses an additional degree of freedom and the improvement is only slight compared with the quadratic model. Higher degree spline models were examined, but did not improve the fit substantially.
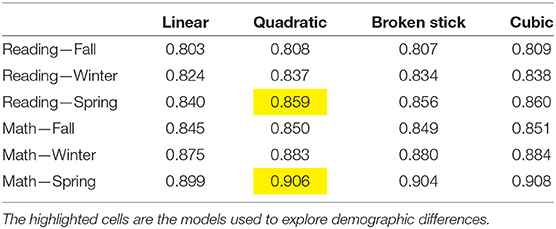
Table 3. Correlations between predicted values and SBA for each of the MAPs and for both Reading and Mathematics. The predicted values are from a linear Tobit model, a quadratic one, the broken stick model, and a cubic model.
How much do these relationships vary by demographics? The answer is “not by much.” Table 4 shows the fit of the quadratic model and then the additional impact of LEP, gender, and ethnicity, as main effects (after conditioning on the linear and quadratic effects for MAPs), with their interactions with the linear effect, and their interactions with quadratic effect. Even including the main effect and both interactions, the increase in the correlations between the residuals and SBA increased only by about 0.001.
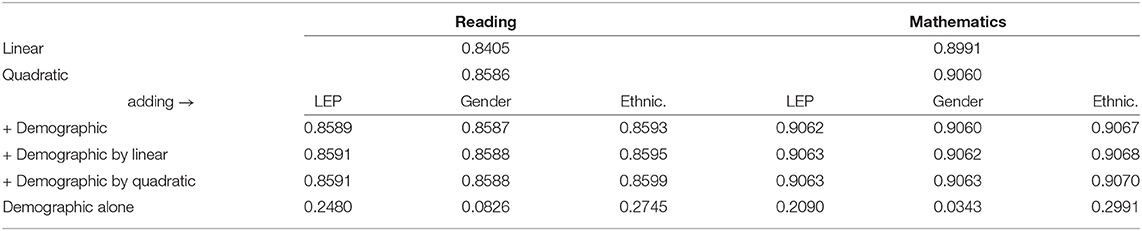
Table 4. R2 values from regressions between spring MAPs and SBAs when including LEP, gender, and ethnicity. The final line shows the relationship (main effect, without conditioning on MAPs) between LEP, gender, and ethnicity with SBAs (achievement gaps). See Appendix for more information on achievement gap data.
4.3. MAP Growth Scores
As discussed above, we use three ways to estimate growth to examine the reliability of the estimates (Grimm et al., 2017). Table 5 shows that these estimates are very similar. The estimates of the slopes from the conditional modes of multilevel models and the slope latent variable from structural equation models are nearly identical, so the choice between them is academic. For the following analysis those from the conditional modes approach are used.
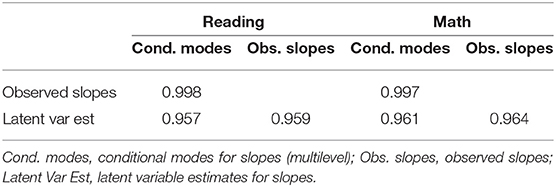
Table 5. The different approaches to growth modeling for estimating the slope estimates for Math Maps and Reading Maps for fall, winter, and spring.
The slope estimates will be compared with the initial MAP scores. Interest is whether the slopes are positively related to the initial scores, as consistent with the rich get richer adage, or are negatively related, as consistent with regression toward the mean artifact. The plots in the first column of Figure 2 show that high scores in the Fall are associated with negative slopes. This decrease would be expected by the statistical artifact of regression toward the mean. For this to account for all of the associations, the expectation is that the high scores on the spring administration would be associated with positive slopes, and this is shown in the plots in the third column. Further, if the associations between the different administrations and the slopes is due only to this artifact the expectation is that the association between the slope and the winter administration of MAPs should be near zero. The middle column shows the linear regression line is fairly flat; the correlations are r = 0.09 and r = 0.04 for mathematics and reading, respectively. That they are slightly positive shows that there is some evidence of the rich getting richer, but that the more prominent characteristic of these plots is regression toward the mean.
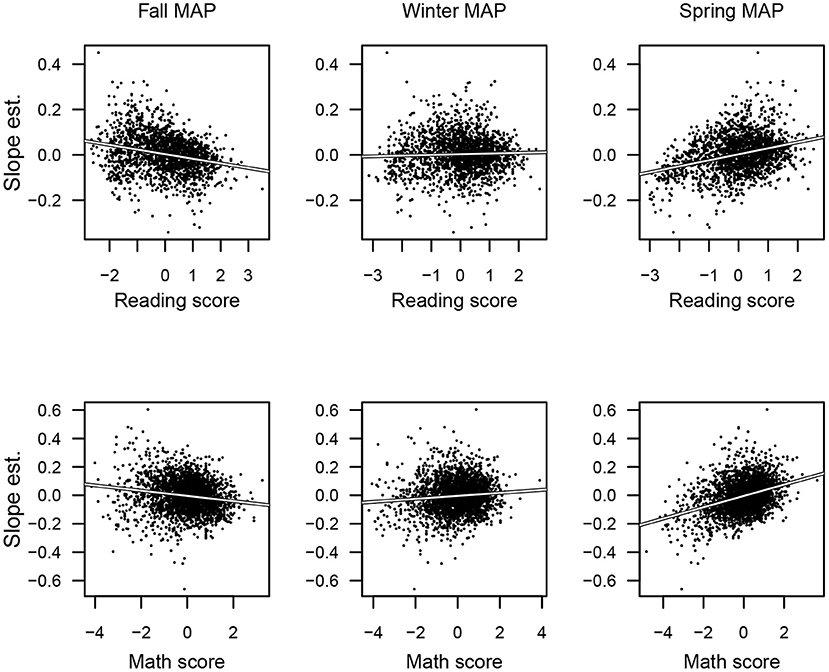
Figure 2. Plots between the slope estimates from the multilevel models with the Fall, Winter, and Spring administrations of the Reading (top) and Math (bottom) MAPs administrations. The downward slope on the left-side panels and the upward slopes on the right-side panels are consistent with regression to the mean. The slight positive slope for the middle column for math shows a tendency for those with high scores to improve more than those with low scores. Three thousand points (jittered) are shown in the scatter plots.
Table 6 shows the R2 associated by using each demographic, as a categorical variable, to predict the slope estimates. The differences were all very small, the largest being <0.003, or less than one-third of one percent. This shows that different groups are growing at similar rates according to these MAP assessments.
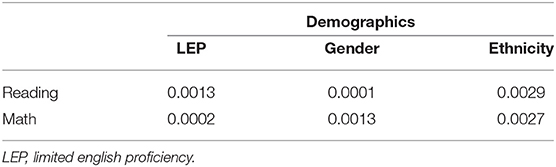
Table 6. The R2 associated with predicting the slope found from the conditional modes for the MAP administrations for reading and math by demographics variables, treated as categories. As these are all small it shows that the rate of change of these scores does not differ greatly across these demographics.
5. Discussion
MAP and SBA are two of the most used standardized assessments used in the US. They are used for different, but overlapping, purposes and therefore both are useful. They are often taken by the same students so knowing how associated the scores on these assessments are is important. Further, the SBA are used for federal reporting so that data analysts in school districts may wish to predict them from MAP scores taken earlier in the year to predict how the district will perform. Further, educators may benefit by being able to predict performance to know how well individual students are likely to do. The MAP, according to NWEA:
… provides teachers with accurate, and actionable evidence to help target instruction for each student or groups of students regardless of how far above or below they are from their grade level.
www.nwea.org/map-growth/ (Dec. 5, 2021)
While SBAC offers instructional support and interim assessments, this assessment is an end of year summative assessment that is often used to meet federal reporting requirements. Therefore, being able to predict SBA scores from MAP scores is valuable for schools and districts. Being able to do this for a large ethnically diverse school district, like Clark County, Nevada, is particularly noteworthy.
The relationship between MAP and SBA showed two main characteristics, and these were consistent across reading and math, and across demographic groups. First, there is a ceiling for the SBA scores that affects about 1% of the students in this sample. Traditional regression is inappropriate because of this. Tobit regressions (Tobin, 1958) are well-suited for this situation, though other approaches could also be used. The second characteristic is that for these data, a quadratic curve fit the data well (see Table 3). It is important to note that this curve was increasing throughout the span of the data; we do not believe that if someone could receive a really low MAP score (below any of those given) that this would be associated with a high SBA score. Other functions that are increasing throughout the span of the data could also be fit for these data.
While there were large achievement gaps for the different assessments by the demographic variables (see Appendix), the relationships between MAP and SBA were very similar for the different groups. Similarly, the estimates for growth for the MAP administrations were similar for the groups.
Finally, the value of academic testing and accountability metrics more generally are being questioned (Muller, 2018). While this debate is beyond of the scope of this paper it is important to stress the appropriate use of assessments and to understand how the myriad of assessments that students take relate to each other in order to justify each and to learn as much as possible from the results of each. In this paper we explore the relationship between two of the most used assessments in the US with the hope that they enables people to use the results from these wisely.
Data Availability Statement
The datasets presented in this article are not readily available because accessing the data requires permission from CCSD. Requests to access the datasets should be directed to ZGFuaWVsLndyaWdodEB1bmx2LmVkdQ==.
Ethics Statement
The studies involving human participants were reviewed and approved by University of Nevada Las Vegas Institutional Review Board. Written informed consent from the participants' legal guardian/next of kin was not required to participate in this study in accordance with the national legislation and the institutional requirements.
Author Contributions
JD contributed to study conception and design, requesting the data from CCSD, data analysis, and review of the manuscript. DW contributed to study conception and design, data analysis, and drafting of the manuscript. Both authors contributed to the article and approved the submitted version.
Funding
Support for this project comes from the Dunn Family Foundation.
Conflict of Interest
The authors declare that the research was conducted in the absence of any commercial or financial relationships that could be construed as a potential conflict of interest.
Publisher's Note
All claims expressed in this article are solely those of the authors and do not necessarily represent those of their affiliated organizations, or those of the publisher, the editors and the reviewers. Any product that may be evaluated in this article, or claim that may be made by its manufacturer, is not guaranteed or endorsed by the publisher.
Acknowledgments
Thanks to CCSD for providing the data.
References
Altman, D. G., and Royston, P. (2006). The cost of dichotomising continuous variables. Br. Med. J. 332:1080. doi: 10.1136/bmj.332.7549.1080
American Educational Research Association, American Psychological Association, and National Council on Measurement in Education (2014). Standards for Educational & Psychological Testing, 2014 Edn. Washington, DC: American Educational Research Association.
Bates, D., Mächler, M., Bolker, B., and Walker, S. (2015). Fitting linear mixed-effects models using lme4. J. Stat. Softw. 67, 1–48. doi: 10.18637/jss.v067.i01
Bauer, D. J. (2003). Estimating multilevel linear models as structural equation models. J. Educ. Behav. Stat. 28, 135–167. doi: 10.3102/10769986028002135
Cohen, J. (1994). The earth is round (p < 0.05). Am. Psychol. 49, 997–1003. doi: 10.1037/0003-066X.49.12.997
Curran, P. J. (2003). Have multilevel models been structural equation models all along? Multivar. Behav. Res. 38, 529–569. doi: 10.1207/s15327906mbr3804_5
Dorans, N. J., Moses, T. P., and Eignor, D. R. (2011). “Equating test scores: towards best practices,” in Statistical Models for Test Equating, Scaling, and Linking, ed A. A. von Davier (New York, NY: Springer), 21–42. doi: 10.1007/978-0-387-98138-3_2
Efron, B., and Morris, C. (1977). Stein's paradox in statistics. Sci. Am. 236, 119–127. doi: 10.1038/scientificamerican0577-119
Frey, W. H. (2015). Diversity Explosion: How New Racial Demographics are Remaking America. Washington, DC: Brookings Institution Press.
Galton, F. (1886). Regression towards mediocrity in hereditary stature. J. Anthropol. Instit. Great Britain Ireland 15, 246–263. doi: 10.2307/2841583
Goldstein, H. (2011). Multilevel Statistical Models, 4th Edn. Chichester: Wiley. doi: 10.1002/9780470973394
Grimm, K. J., Ram, N., and Estabrook, R. (2017). Growth Modeling: Structural Equation and Multilevel Modeling Approaches. New York, NY: Guilford Press.
Holland, P. W., and Dorans, N. J. (2006). “Linking and equating,” in Educational Measurement, 4th Edn, ed R. L. Brennan (Westport, CT: Praeger), 189–220.
James, G., Witten, D., Hastie, T., and Tibshirani, R. (2013). An introduction to Statistical Learning With Application in R. New York, NY: Springer. doi: 10.1007/978-1-4614-7138-7
Kolko, J. (2017). 40 years from now, the U.S. could look like Las Vegas: demographically, at least. Available online at: fivethirtyeight.com/features/40-years-from-now-the-u-s-could-look-like-las-vegas/
MacCallum, R. C., Zhang, S., Preacher, K. J., and Rucker, D. D. (2002). On the practice of dichotomization of quantitative variables. Psychol. Methods 7, 19–40. doi: 10.1037/1082-989X.7.1.19
McNeish, D., and Matta, T. (2018). Differentiating between mixed-effectsand latent-curve approaches to growth modeling. Behav. Res. Methods 50, 1398–1414. doi: 10.3758/s13428-017-0976-5
NWEA (2021). Predicting Performance on the Smarter Balanced Summative Assessments Based on NWEA MAP Growth Scores. NWEA.
Oakes, M. W. (1986). Statistical Inference: A Commentary for the Social and Behavioral Sciences. Hobokon, NJ: John Wiley & Sons.
R Core Team (2022). R: A Language and Environment for Statistical Computing. Vienna: R Foundation for Statistical Computing.
Rosseel, Y. (2012). lavaan: an R package for structural equation modeling. J. Stat. Softw. 48, 1–36. doi: 10.18637/jss.v048.i02
Stanovich, K. E. (1986). Matthew effects in reading: some consequences of individual differences in the acquisition of literacy. Read. Res. Q. 21, 360–407. doi: 10.1598/RRQ.21.4.1
Therneau, T. M. (2021). A Package for Survival Analysis in R. R package version 3.2-11. Available online at: https://CRAN.R-project.org/package=survival
Tobin, J. (1958). Estimation of relationships for limited dependent variables. Econometrica 26, 24–36. doi: 10.2307/1907382
Wright, D. B. (2017). Some limits using random slope models to measure academic growth. Front. Educ. 2:58. doi: 10.3389/feduc.2017.00058
Wright, D. B., Strubler, K. A., and Vallano, J. P. (2011). Statistical techniques for juror and jury research. Legal Criminol. Psychol. 16, 90–125. doi: 10.1348/135532510X487655
Xie, Y. (2015). Dynamic documents with R and knitr, 2 Edn. Boca Raton, FL: Chapman and Hall; CRC Press.
Appendix
MAP and SBA Mean Scores by Demographics
Table A1 shows the differences by LEP and gender for the raw scores for the three MAP administrations for reading and math, and for the SBA scores for ELA and math. The LEP students score lower on all of these. Females and males score at approximately the same levels for the math assessments. Females perform better than males on the reading/ELA assessments.
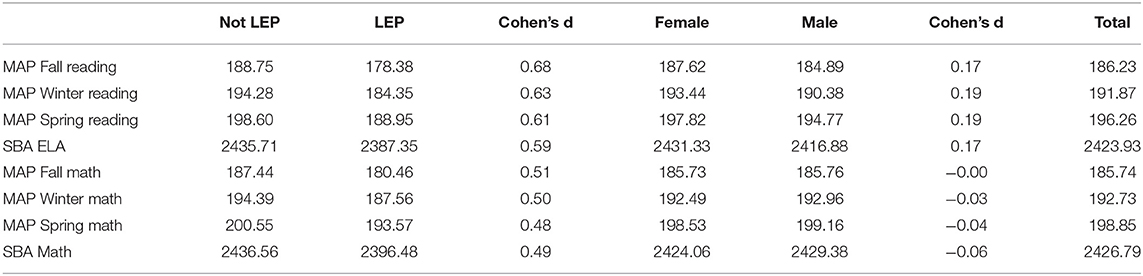
Table A1. MAP and SBA means for the raw scores by Limited English Proficiency (LEP) and by Gender.
Table A2 shows the breakdown of assessment means by ethnicity category. The mean scores for the different categories can be ordered as:
Asians > Caucasians > Multiracial > NatAmer/PacIsl > Hispanic > Black
for all assessment. It should be stressed that the purpose of this paper is not to provide explanations nor much evidence with respect of achievement gaps. The State of Nevada Department of Education provides this information at: http://nevadareportcard.nv.gov/di/main/assessment for all school districts in the state.
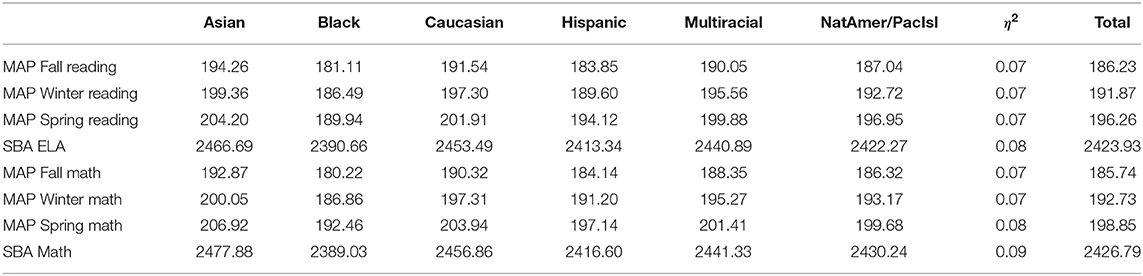
Table A2. MAP and SBA means for the raw scores by Ethnicity categories.
Keywords: formative assessment, summative assessment, measures of academic progress, smarter balanced assessment consortium, growth
Citation: Durant J and Wright DB (2022) Exploring the Associations Between MAP Growth and SBA by Demographics. Front. Educ. 7:851625. doi: 10.3389/feduc.2022.851625
Received: 10 January 2022; Accepted: 12 May 2022;
Published: 16 June 2022.
Edited by:
Robbert Smit, St. Gallen University of Teacher Education, SwitzerlandReviewed by:
Michael Schurig, Technical University Dortmund, GermanySoo Lee, American Institutes for Research, United States
Copyright © 2022 Durant and Wright. This is an open-access article distributed under the terms of the Creative Commons Attribution License (CC BY). The use, distribution or reproduction in other forums is permitted, provided the original author(s) and the copyright owner(s) are credited and that the original publication in this journal is cited, in accordance with accepted academic practice. No use, distribution or reproduction is permitted which does not comply with these terms.
*Correspondence: January Durant, amFudWFyeWR1cmFudEBnbWFpbC5jb20=