 Stephen Humphry
 Ken Bredemeyer
- Graduate School of Education, University of Western Australia, Perth, WA, Australia
Pairwise comparisons can be used to equate two sets of educational performances. In this article, a simple method for the joint scaling of two or more sets of assessment performances is described and illustrated. This method is applicable where a scale of student abilities has already been formed, and the scale is to be extended to include additional performances. It requires a subset of already scaled performances, which is designated as a core linking set for the purpose of scale extension. The article illustrates the application of the method to construct a scale with a larger range of latent abilities, using fewer additional comparisons compared to the standard method of pairwise comparisons. The design differs from standard pairwise comparisons in the way performances are paired. The method of pairing performances can also be used to efficiently place individual performances on an existing scale.
Introduction
Pairwise comparisons can be used to assess students’ work, such as essays and language tests (Heldsinger and Humphry, 2010; Humphry and McGrane, 2015; Steedle and Ferrara, 2016; Humphry and Heldsinger, 2019, 2020), as a replacement for rubric marking (Pollit, 2009, 2012; Steedle and Ferrara, 2016). The method of pairwise comparisons can also be used to equate two sets of performances without requiring common items or common persons (using instead common judges). For example, it can be used to equate a scale obtained from one rubric to the scale obtained from another, through comparisons of performances on the two scales (Humphry and McGrane, 2015). This type of equating design cannot be achieved without the use of pairwise comparisons or a similar method.
Using pairwise comparisons for equating two sets of assessment performances is well-documented in the literature. This article introduces and illustrates a simple method for scale extension in contexts where one set of performances has already been scaled and another set of performances is equated with the scaled set through joint scaling. The method enables researchers to concentrate pairings to efficiently align scales formed from separate sets of performances and it also affords other advantages.
Because it connects the two data sets in the equating design to enable joint scaling, the method introduced in this article requires the selection of a set of already scaled performances, which is referred to as the core set. Then performances on the new scale, which are to be equated onto an existing scale, are compared against the core set. In the generation of pairs, these performances are referred to as non-core and it follows that all the comparisons used to connect the scales are core vs. non-core. The relevance of core and non-core sets is most clearly apparent when there are at least three sets where two or more non-core sets are placed on a common scale through a core set.
The aim of the article is not to study application of the method under a range of conditions; rather the scope is limited to a single empirical application and a single simulation study. The introductory context is chosen to highlight general considerations for application of the method.
In addition to scale extension, pairwise comparisons using pairs generated as core vs. non-core can also be applied post-hoc to efficiently place new performances on an existing scale when those new performances have not been scaled. To place performances on an existing scale, the core set would be drawn from already scaled performances and the performances to be placed on the scale designated non-core. This application is discussed later in the article, but is not its main focus. Nevertheless, we discuss implications for future research, including the application of computer adaptive presentation of pairs based on existing calibrated performance banks.
The structure of this article is as follows. First, a brief background to the method of pairwise comparisons and its relevance in educational assessment is presented. Next, a design and method for equating two separate scales using core vs. non-core pairs is detailed. The method is demonstrated using empirical data collected from a persuasive writing task, and then applied in a simulation study. The aim of the empirical study is to extend a writing scale formed on the basis of paired comparisons, and subsequently to obtain performance exemplars for use by teachers in separate assessments of their own students’ performances. The aim of the simulation study is to emulate the empirical study, to ascertain the effectiveness of the method used to extend the scale, where data fit the relevant model. In the empirical study, the writing task was administered to primary school and secondary school students, whose performances were judged, using pairwise comparisons, by experienced markers using an online platform. The estimation procedure for placing the performances on a scale of latent writing ability is outlined for both the empirical data from the school assessment task and the simulation study. The resulting scales are evaluated using fit statistics and, for the simulation study, by comparing the estimated and simulated parameters. Lastly, a discussion follows which includes the benefits of the method, considerations for its application, and limitations of the studies presented.
Background
As broader background, the method of pairwise comparisons is based on Thurstone’s law of comparative judgment (Thurstone, 1927). Bradley and Terry (1952), and later Luce (1959), showed that Thurstone’s equations for the analysis of pairwise comparison data could be simplified using the cumulative logistic function. The resulting Bradley-Terry-Luce (BTL) model is used to estimate the latent ability of the persons in this study. The BTL model has the same form as the Rasch model (Andrich, 1978), but the probabilities of success are defined using the differences between performance estimates, rather than using the differences between ability estimates and item difficulties.
The BTL model defines the probability that performance a is compared favorably over performance b as follows:
where a and b are the parameters denoting the latent writing abilities inferred from the quality of performances. As with Rasch modeling, the BTL model provides a scale for performances (provided there are enough comparisons) if the data fit the model adequately.
An excellent and more detailed discussion of the background into the method of pairwise comparisons can be found in Bramley (2007). Bramley’s article covers the development of pairwise comparison methodology from the adaptation of Thurstone’s original work to the form used in the current study. See also Humphry and Heldsinger (2019) for a brief overview of some key literature focusing on different aspects of the application of pairwise comparisons in education.
Pairwise comparisons offer a very flexible design for parameter estimation. It is not necessary to compare each performance with every other performance. Pollit (2012, pp. 160) states that this “system is extraordinarily robust.” This means that sparse data can be analyzed to yield performance locations with acceptable standard errors of estimation.
To obtain sufficiently accurate locations using pairwise comparisons, it is useful to specify the number of times each performance is compared to others. If a performance is compared too few times, the standard error of estimation will be high, so there will be a large degree of uncertainty in the location of the performance. Various authors have offered recommendations for the minimum number of comparisons generally required (Verhavert et al., 2019). Pollit (2012, pp. 160) claims that, “if every object is compared about 10 times to suitable other objects, this will generate a data set that is adequate to estimate the values of every object on a single scale.” This is also a key consideration for joint scaling of sets of performances on existing scales, as elaborated later.
Pollit (2012) refers to the concept of chaining performances to reduce the time spent judging comparisons. In the moderation exercise presented in Pollit (2012), each pair of two successive comparisons contains a common performance, so that reading time is reduced on the second comparison. In the current study, common performances are included for more than two consecutive comparisons to further improve judging efficiency. The number of consecutive comparisons which contain a common performance is referred to in this article as the “chaining constant.” Although Pollit’s main reason for including chaining of performances in the design is to improve time efficiency, it stands to reason that the cognitive load for judges is also reduced because they do not need to become familiar with two new performances each and every time they see a new pair. Chaining performances in consecutive comparisons has some potential to introduce violations of the statistical assumption of independent comparisons, though Pollit (2012) notes that no evidence of chaining bias has yet been found.
Due to the robustness and flexibility of the pairwise comparison method, judgments of pairs generated using the core vs. non-core method can be combined with judgments of standard pairs and the BTL model applied, provided there is a core linking set and the comparisons were made using the same judging criteria. By combining core vs. non-core comparisons with standard comparisons, a new scale can be obtained for the new performances that is anchored to the existing scale.
The use of core vs. non-core comparisons is alluded to by Steedle and Ferrara (2016, p. 211) in stating: “if desired, these [pairwise] estimates can be anchored to a rubric scale by including anchor papers with fixed scores in the judgment and estimation process.” The procedure described by Steedle and Ferrara is equivalent to a design that includes standard pairs plus core vs. non-core pairs, as described in this article.
In this article, OUTFIT MNSQ is used as an indicator of model fit to check the fit of the performances. The OUTFIT MNSQ statistic is computed in the same way as in applications of the Rasch model (Wright and Stone, 1979; Wright and Masters, 1982) except that the observed and expected scores are related to two person parameters in the BTL model rather than person and item parameters in Rasch’s model. The expected value of the Outfit statistic, or unweighted mean-squared standardized residual, is approximately 1. An often-used range of acceptable limits for the Outfit index is 0.7–1.3 (Smith et al., 2008).
The Person Separation Index is used as an indicator of the internal consistency of the judgments on which the scale is based and is modeled on Cronbach’s alpha. Its minimum value is effectively 0 and its maximum is 1. A higher value indicates higher internal consistency. Relevant to the interpretation of results, for a given level of internal consistency, the separation index will be higher if there are more comparisons because there is more Fisher information and smaller standard errors, as touched upon by Heldsinger and Humphry (2013).
Materials and methods
Rationale for using core and non-core sets
To explain the core and non-core distinction and the use of core sets for joint scaling in general terms, it is instructive to consider situations in which a core set of performances is used to join three or more separate data sets. Figure 1 depicts a case of three sets in which the core set links the other two data sets for which there are no direct comparisons between performances. In this case, performances in Sets 2 and 3 will be placed on a common scale only through comparisons with performances in the core set (Set 1) and only if there is sufficient overlap between Sets 1 and 2, and Sets 1 and 3.
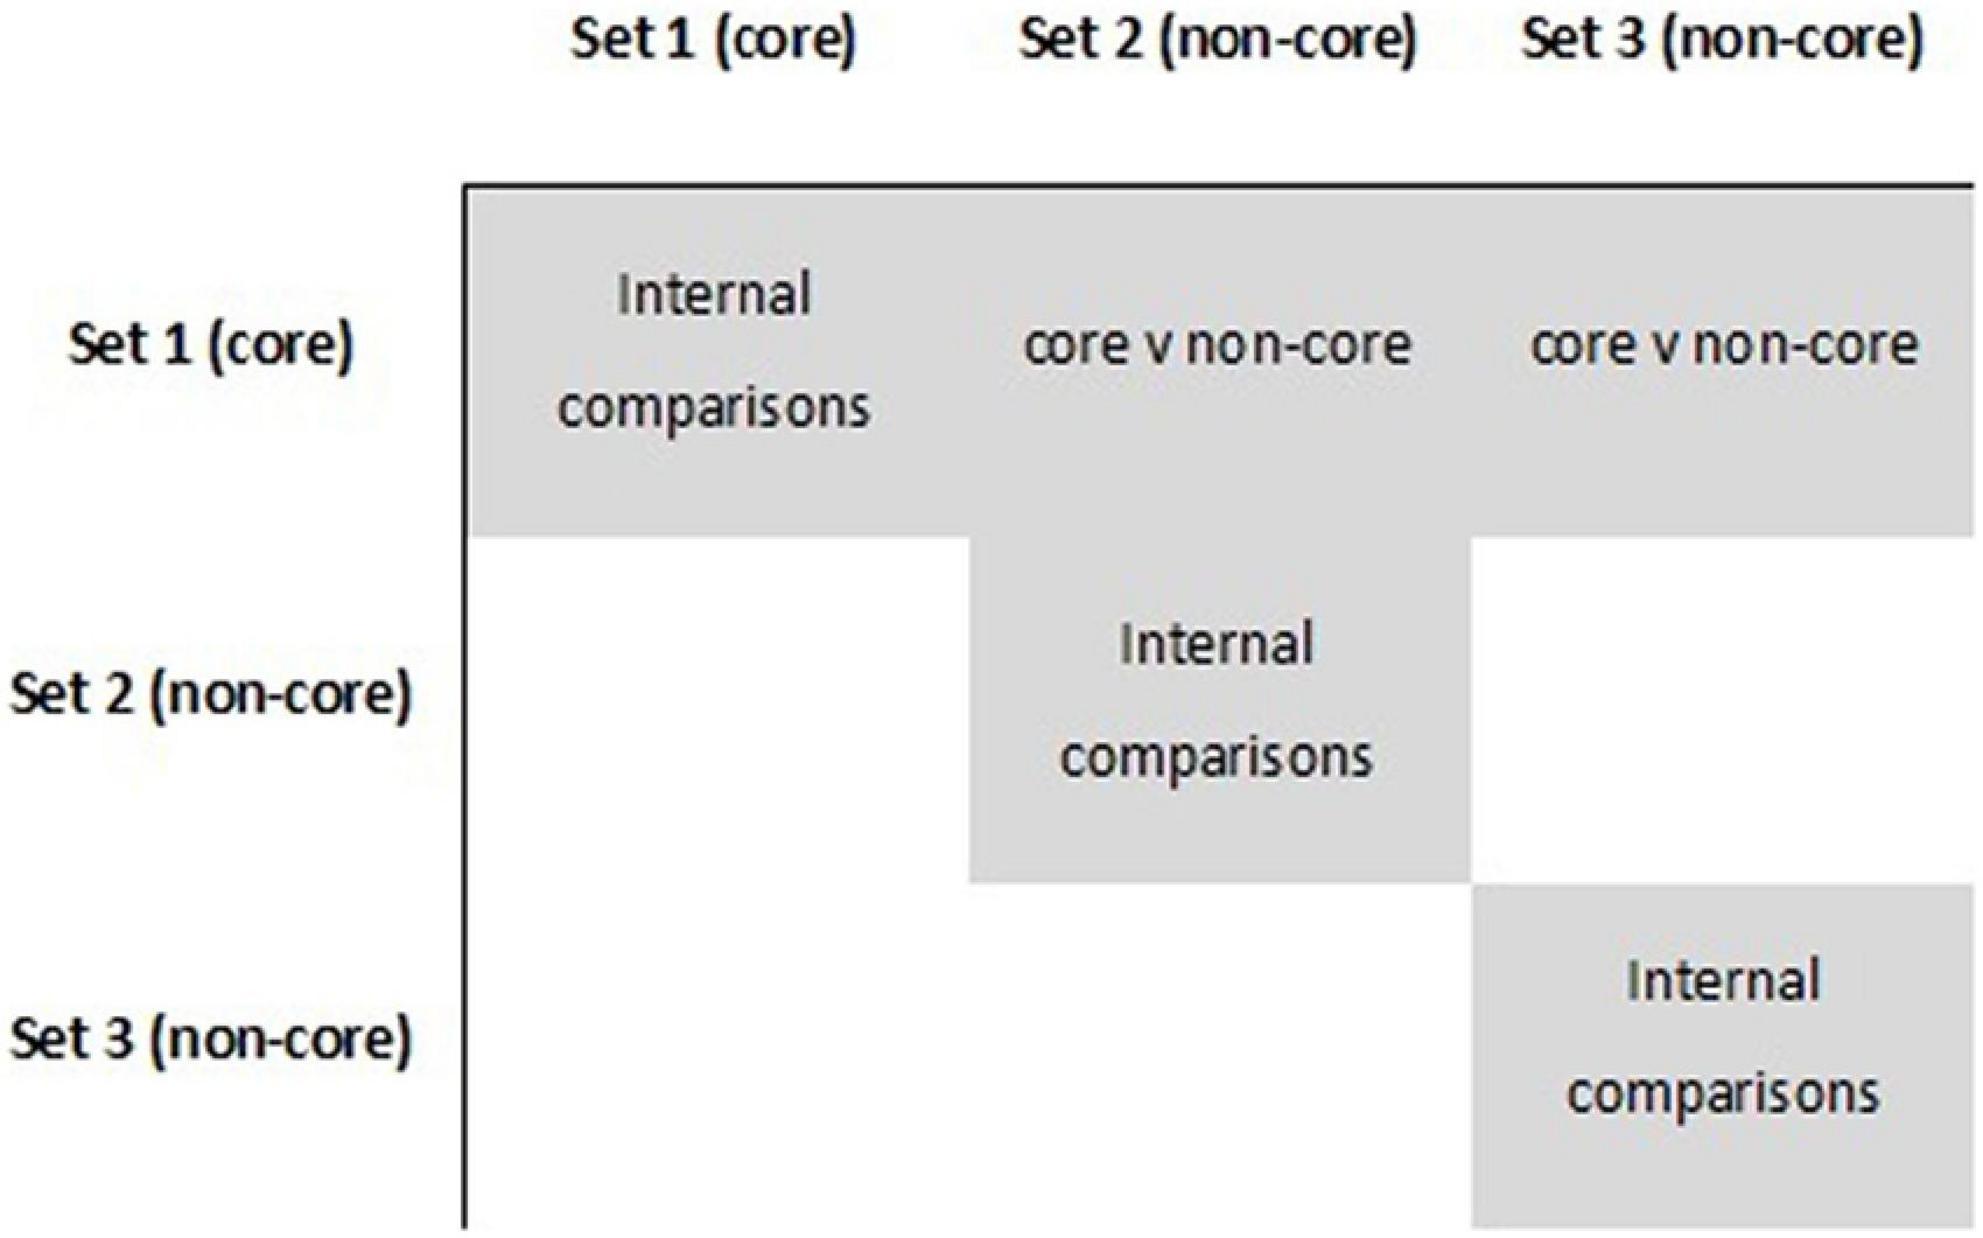
Figure 1. Schematic depiction of a data matrix with a core set and two non-core sets.
Figure 1 depicts the basis of the method using a simple case in which all performances in Set 1 form a core set, all performances in Set 2 form a non-core set, and all performances in Set 3 form a non-core set. To avoid confusion, we note that in the empirical and simulation studies used in this article, the core and non-core sets are subsets of primary and secondary performances, i.e., they are subsets of larger sets. The reasons for selecting subsets for core vs. non-core comparisons are explained to follow.
More generally, the data matrix may comprise any number of sets that have internal comparisons, and in principle the core set will provide a basis for joint scaling on a common scale. Thus, a single core set may be used to equate three, four or more other sets that each have only internal comparisons prior to the use of comparisons with performances in a core set.
The most extreme case is that in which each non-core performance comprises its own set containing just one performance. In this case, comparisons against the core set are the means of placing individual performances on a common scale.
Although the logic of the core and non-core distinction is most apparent when there are at least three sets, there are advantages to pairing performances using the distinction when there are two sets. Further, considerations applicable to two sets are also applicable to cases in which there are three or more sets to be jointly scaled. The empirical and simulation studies described below illustrate the use of core vs. non-core pairings between two sets to obtain the advantages of targeted selection of performances and the availability of specific diagnostic information to evaluate joint scaling. These advantages are discussed in further detail later in the article.
Requirements of joint scaling
To jointly scale all performances by selecting a core set and one or more non-core sets, there needs to be sufficient information from the performances. When the core vs. non-core method is used, there need to be internal comparisons of performances within both the core and non-core sets before the scale locations of performances in the two sets can be equated with each other.
Given limited resources, it may be necessary to concentrate available comparisons on the most useful pairings for linking. To explain the nature of information required for joint scaling, consider an extreme case in which there is no information and joint scaling is not possible. Specifically, let Set 1 be the core set and suppose there is only one performance j (non-core) from Set 2 used to equate the two sets, termed the link Subset L, and only one comparison of performance j in Subset L against a performance i in Set 1. In this case, performance j has an estimate on the scale comprising Set 2 performances but it is not possible to obtain an estimate for performance j based on comparisons with Set 1 performances. Therefore, it cannot provide any information to align the two scales.
The first case can be expanded to a case in which there is a significant number of performances in a link Subset L, contained within Set 2 used to equate the two sets, but where only one comparison is made between each performance in Subset L against a performance in the core Set 1. Using the reasoning above, it is not possible to obtain an estimate for any performance in Set 2 based on comparisons with Set 1 performances. Thus, comparisons for these performances cannot provide any information to align the two scales.
If we further expand the case so that there are at least two comparisons between performances from Set 2 and performances in Set 1, then estimates of Set 2 performances can be obtained on the scale for the Set 1 performances. In this case, comparisons for the performances do provide information to align the scales. However, if Set 2 performances that are compared with Set 1 performances have very few comparisons with Set 1 performances, the standard errors are large. Accordingly, if there is little information and the standard errors are large, plots such as those in Figures 2, 3 are likely to provide little information about whether there is a linear relation between the two sets of location estimates for the Set 2 performances, based on comparisons with Set 1 vs. comparisons with Set 2. With little information, the measurement error will obscure the association. On the other hand, if there is sufficient information, such plots can be expected to provide information about whether there is a linear relationship.
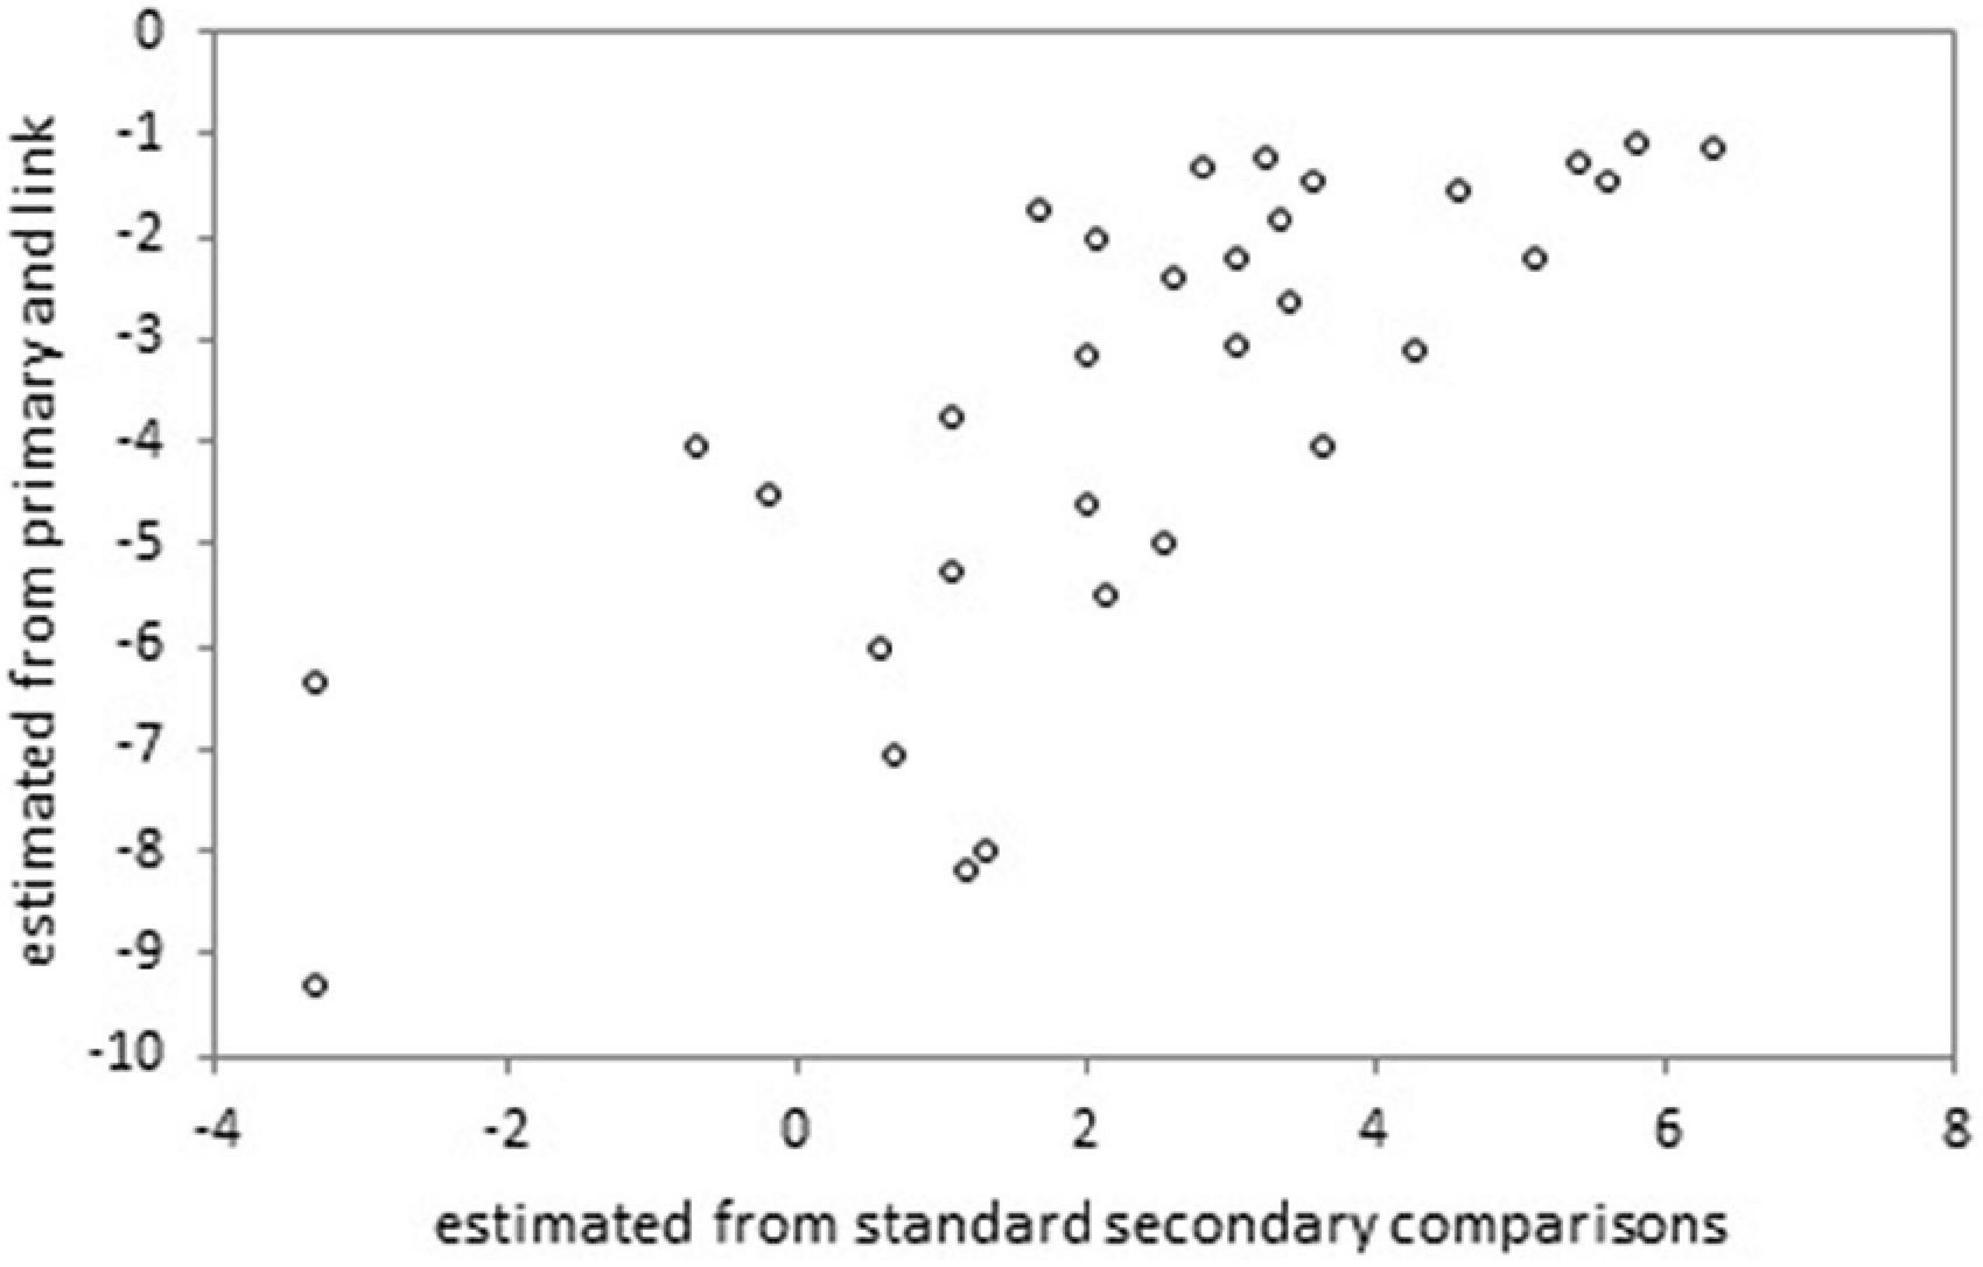
Figure 2. Location estimates of the 32 non-core secondary performances, from two independent analyses in the scale extension study.
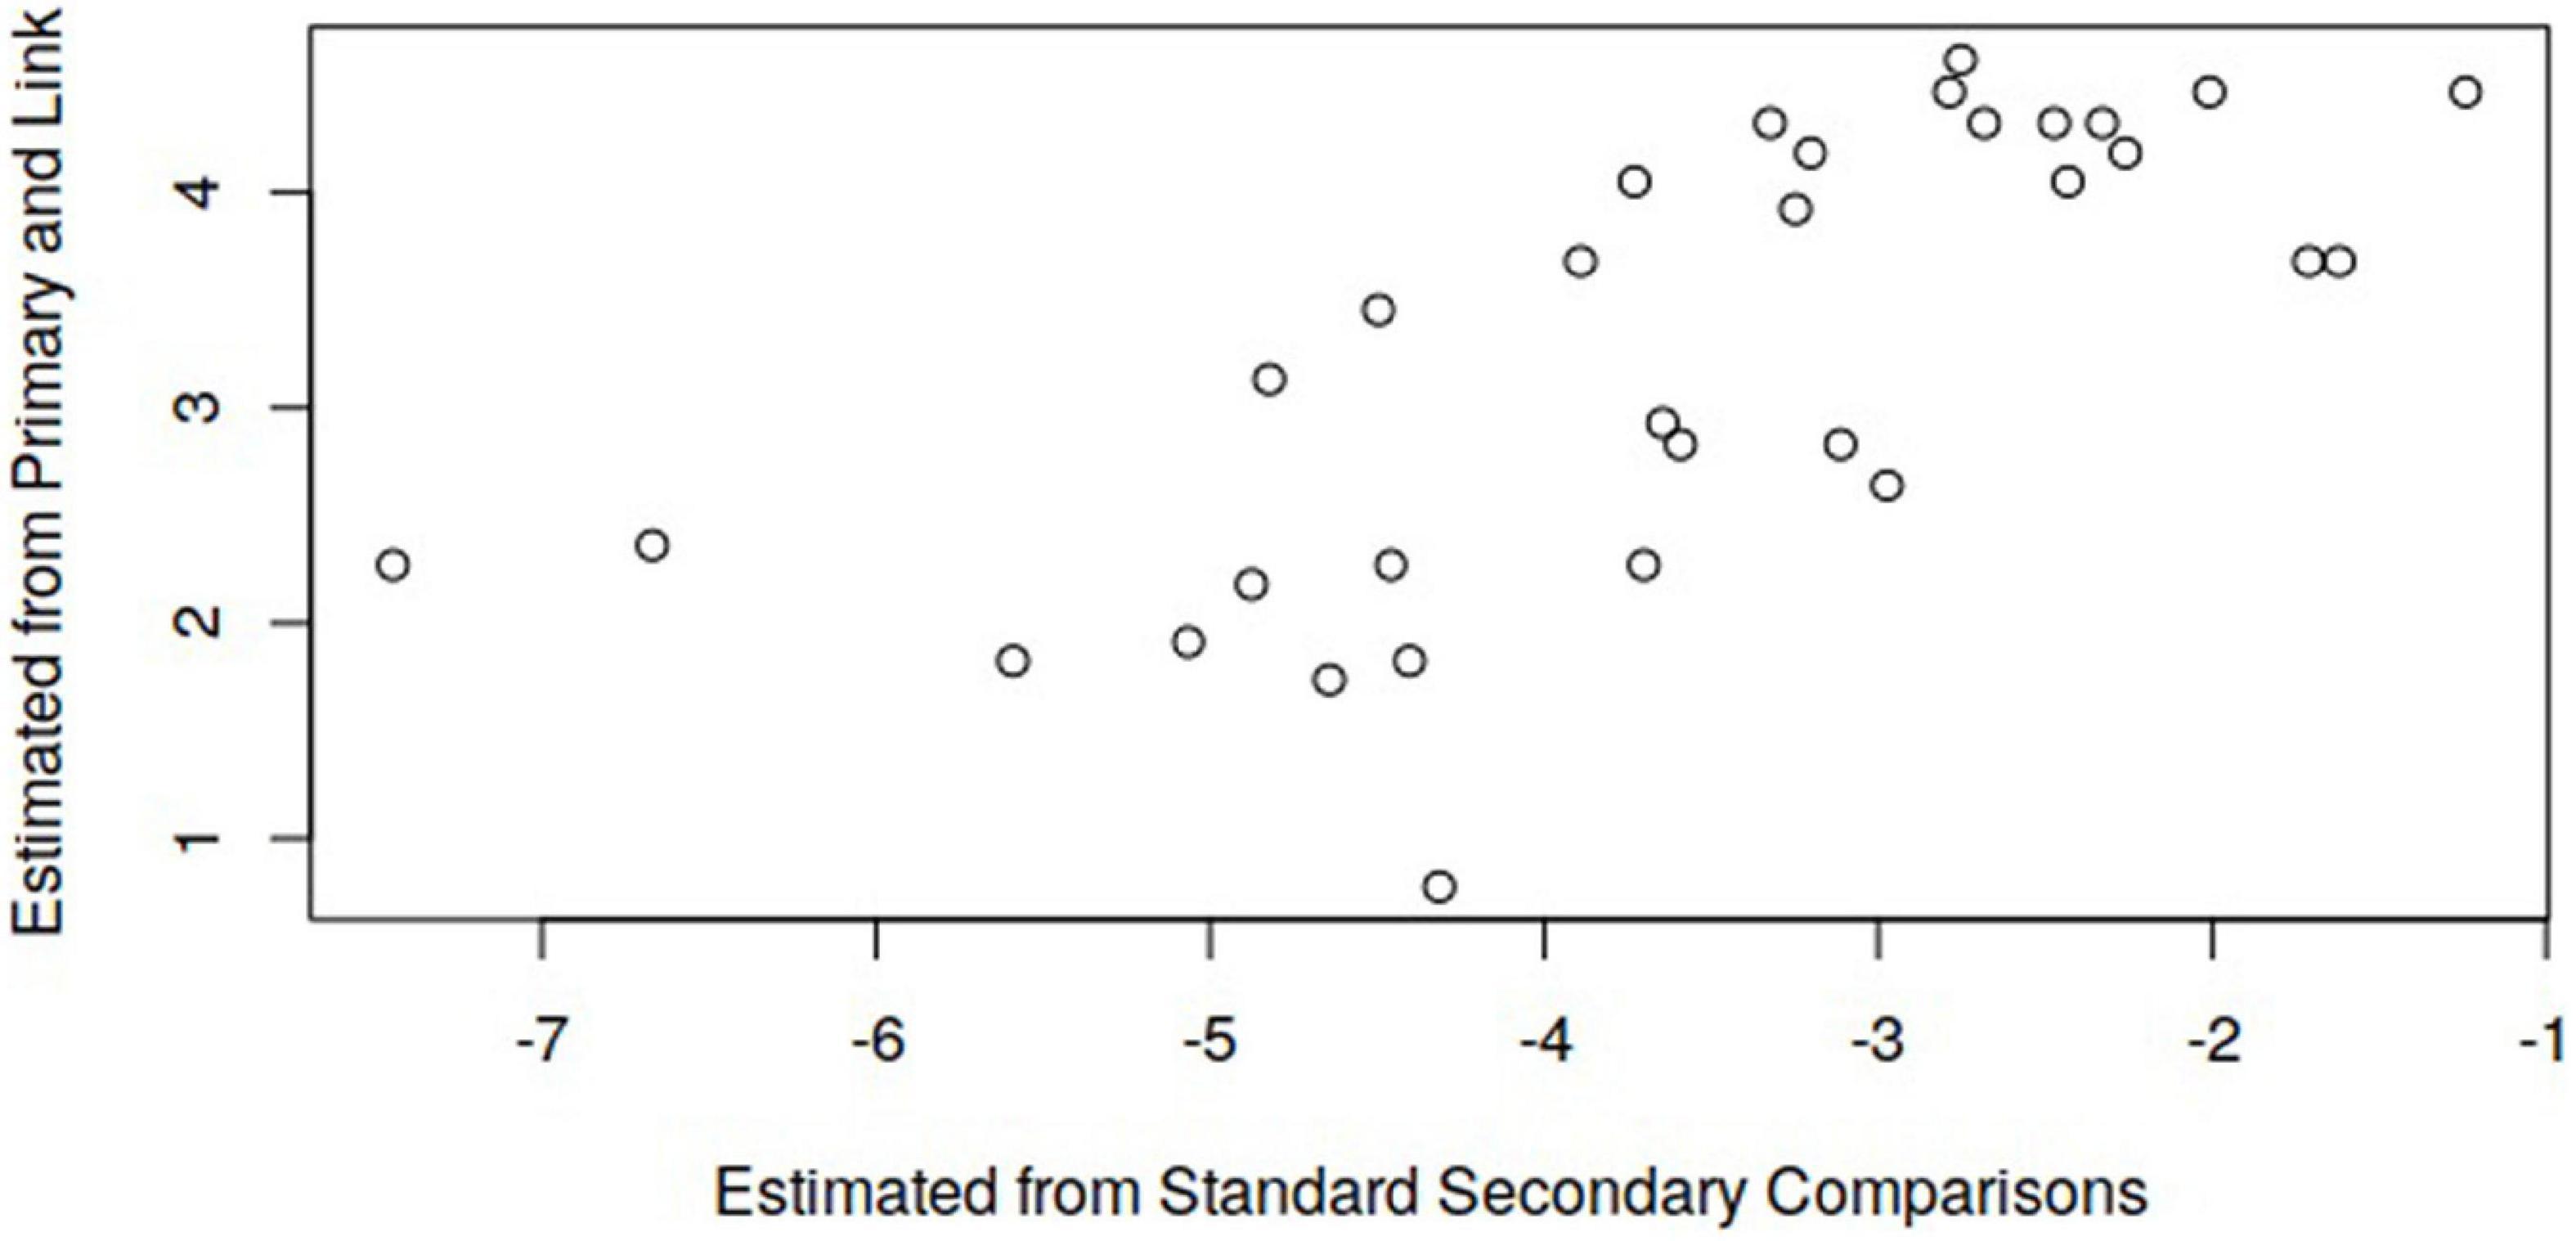
Figure 3. Location estimates of the link set from scaling of independent data sets in the simulation study.
Design considerations
Following from the considerations detailed above, the optimal design of a scale extension paired comparison exercise depends on factors that include: (i) the number of performances in sets; (ii) the number of new comparisons that can be made with available resources; and (iii) the abilities of students producing different sets of performances.
If it is possible to make enough comparisons such that random pairings ensure performances in Set 2 are compared a reasonable number of times against performances in Set 1 (say, more than seven times) then this option can be used and diagnostic information will be useful. Given the numbers of performances in Sets 1 and 2 and the available resources for comparisons, if the number of comparisons of a Set 2 performance against a Set 1 performance is typically low with random pairings, then the core vs. non-core pairing method provides advantages. The advantages, relevant to the empirical illustration of the method, are detailed later in this article.
Paired comparison design for illustrative study
Figure 4 depicts the design of the empirical and simulated studies. In the figure, the horizontal dashed lines represent the pairings of performances to connect the two scales. They also convey a range in which the core vs. non-core comparisons are generated. The primary scale obtained from pairwise comparisons (PW Primary School Scale) is the existing scale, depicted on the left-hand-side. The secondary scale obtained from pairwise comparisons (PW Secondary School Scale) is depicted on the right-hand-side.
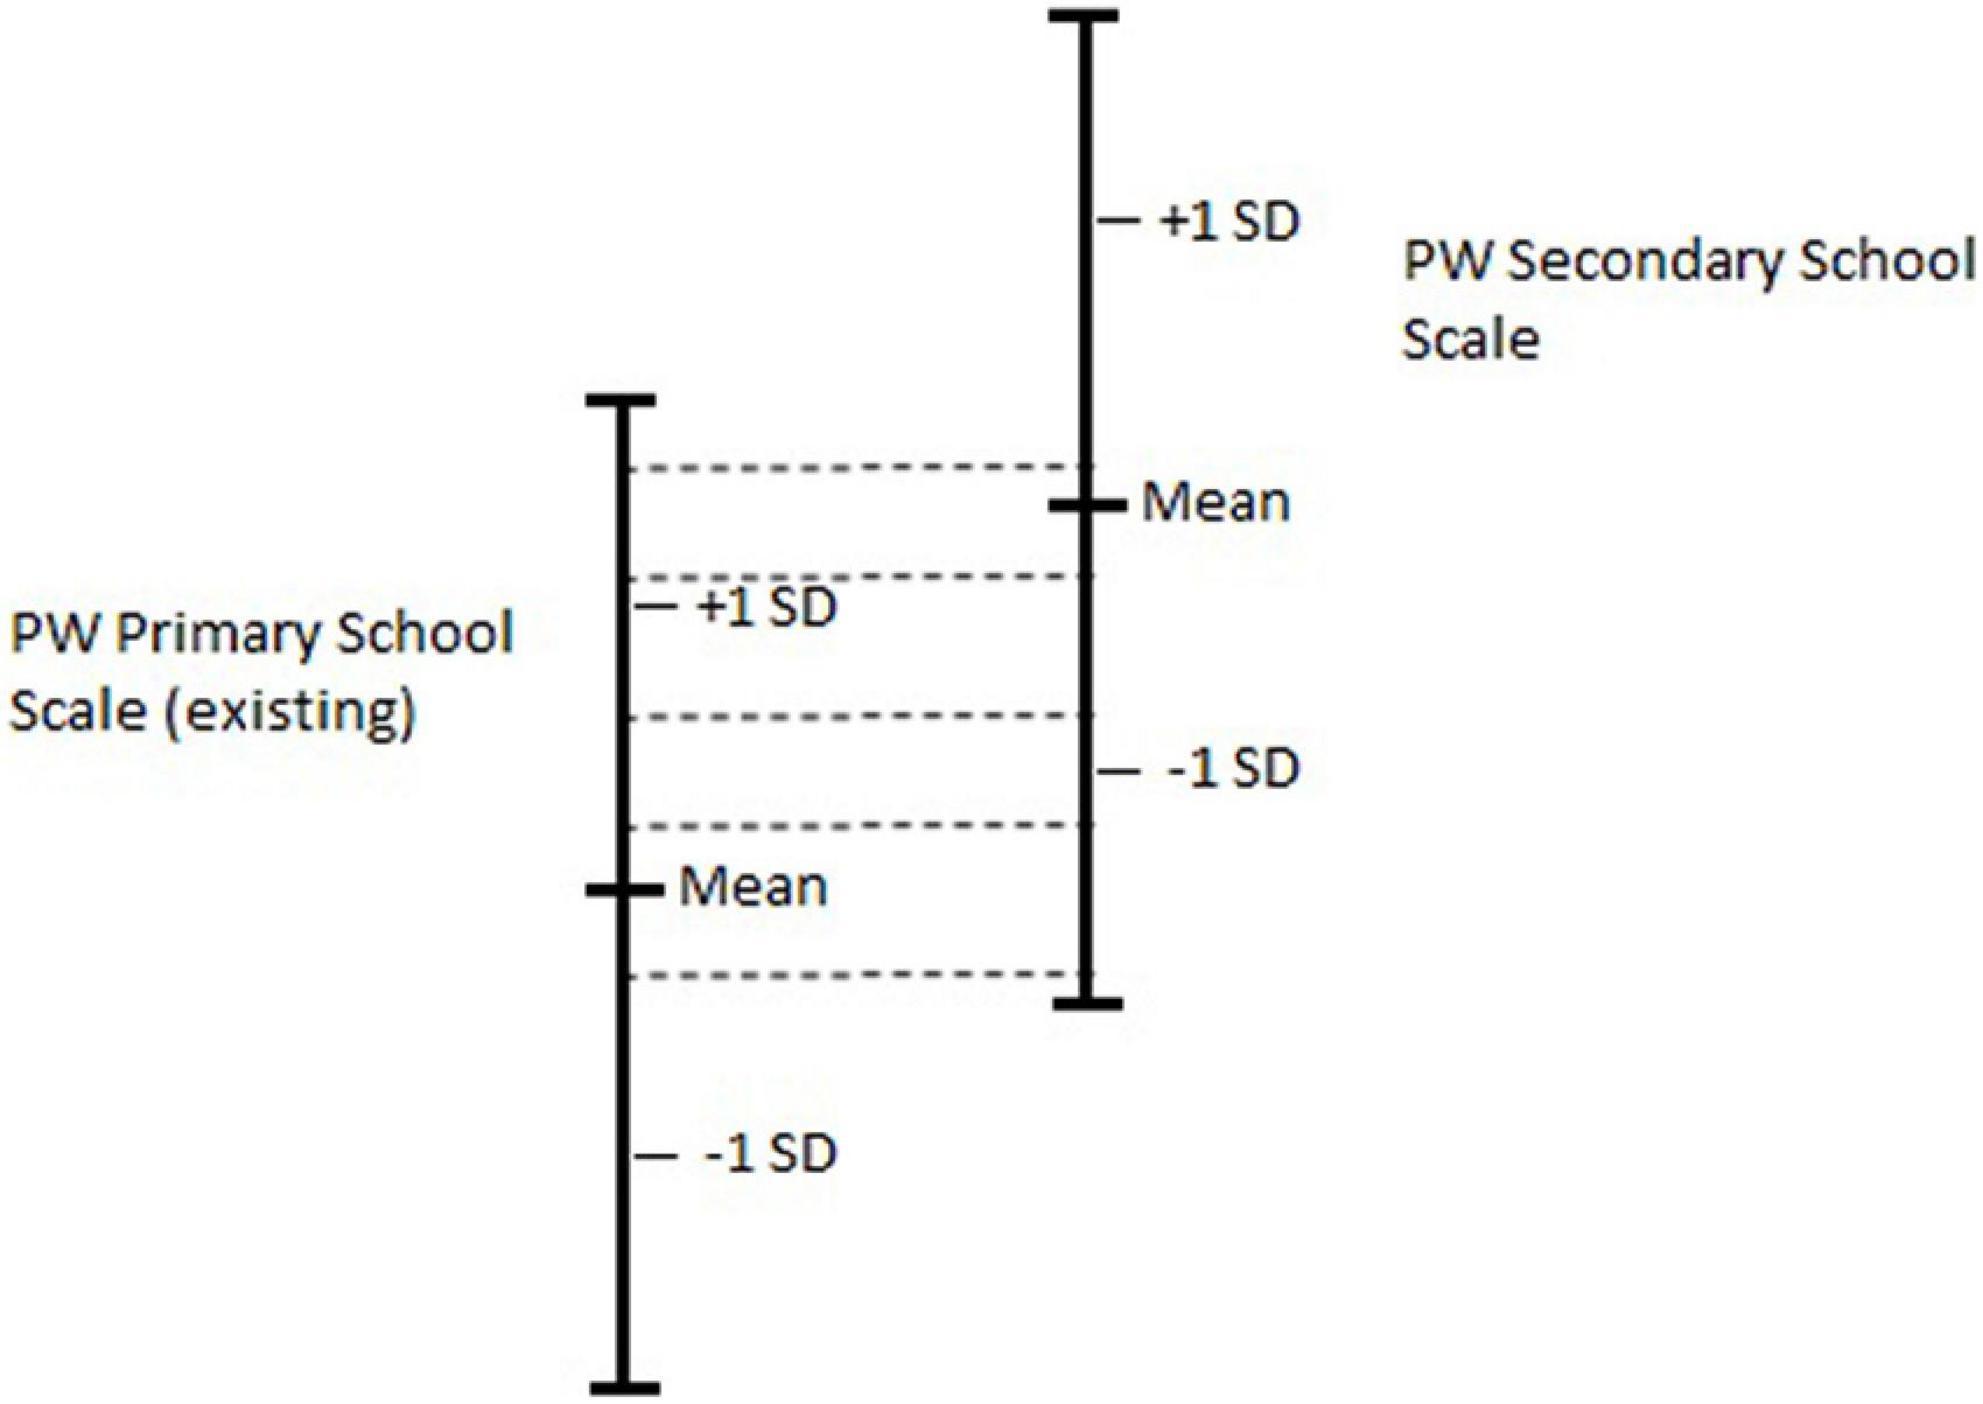
Figure 4. Schematic showing the scale extension design. Vertical lines represent the extent of the ability scales.
Empirical study
The empirical study described in this article focuses on the extension of a primary school Writing scale, whose construction is described in Humphry and Heldsinger (2019). For the scale extension project, a scale of latent writing ability was already formed using pairwise comparisons of primary school performances. The goal of the empirical study was to extend the pre-existing scale upwards to include performances of secondary school students in years 7–9. It was assumed, prior to equating, that the secondary school performances would be generally of a higher quality than the primary school performances, but there would be sufficient overlap in the quality of performances from the two groups to enable this type of equating.
Primary school standard comparisons
Located on the existing primary school scale were 162 writing performances from primary school students. The construction of the scale, including the data collection, test administration, judgments, and pairwise comparison procedure are detailed in Humphry and Heldsinger (2019, see pp. 509–510). The criteria for making judgments as to which performance is better in each pair is also detailed in Humphry and Heldsinger (2019). In the study, a persuasive writing task was administered by classroom teachers, who had been provided with instructions and a choice of topics to present to their students. A total of 3,228 pairs were compared by 18 judges who were all experienced classroom teachers.
Secondary school standard comparisons
To scale the secondary performances, 111 secondary school performances from students in years 7–9 were compared with one another by 16 judges. The judges made a total of 1,018 comparisons, with most judges making 60 comparisons each. Of the 16 judges, five were highly experienced assessors of both primary and secondary Writing, one was a primary classroom teacher, and the rest were secondary classroom teachers.
Core vs. non-core comparisons
The current empirical study, designed to place the two sets of performances on the same scale, involved pairing primary school performances to secondary school performances to form the core vs. non-core pairs. Of the 162 primary and 111 secondary school performances, 82 primary and 32 secondary school performances were selected to be used in the core vs. non-core comparisons. To obtain performances with an overlapping range of performance levels, primary school performances with the highest locations and secondary performances with the lowest locations were selected.
A total of 2,624 core vs. non-core pairs were generated and allocated to judges. Four judges, who were very experienced in marking both primary and secondary Writing, made 656 comparisons each, resulting in all the core vs. non-core pairs generated being compared.
Generation of core vs. non-core comparisons
For the purpose of core vs. non-core comparisons, pairs were generated between the two sets of performances and not within either set. Selected primary school performances were designated as core and selected secondary school performances were designated as non-core. The top 82 primary school performances and the bottom 32 secondary school performances were selected into these sets, based on estimated locations from standard pairwise scaling of the primary and secondary performances separately. The method generally aims to place non-core performances on the scale formed using the core, linking set of performances. The key requirement for pair generation using this method is to specify the number of times each non-core performance is included in the set of pairs allocated to judges. In the empirical project, each non-core (secondary school) performance was included exactly 82 times. For each pairing, a core performance is matched randomly with a non-core performance (without replication). Random sampling without replacement was used in the pairing procedure, given other applicable constraints on pair generation, in order to ensure that performances were sufficiently connected for joint scaling. The pairs were generated using the pair generator R package (Bredemeyer, 2021a).
Pair presentation
Pairs of performances were presented side by side to judges to make comparisons using online software. The left vs. right presentation on the screen was fully randomized for the performances. Each performance was included in a comparison 22 times on average, and a chaining constant of four was used to reduce the cognitive load of judges.
Scaling and scale extension for the empirical component
To jointly scale the primary and secondary scales in both simulation and empirical studies, comparisons from the three sets of judgments—primary school standard comparisons, secondary school standard comparisons, and core vs. non-core comparisons—were combined. The combined set of comparisons were used to estimate the abilities of performances based on the Bradley-Terry-Luce model, which is implemented in the PairwiseComparisons R package (Bredemeyer, 2021b) built in the R statistical and programming environment (R Core Team, 2021). Scale locations for each performance were obtained using an estimation algorithm that calculates the performance location in logits, centered on zero. For the applied study, a shift constant was added to all performance locations, so that locations were centered on the primary school performances (so that the mean of the primary school locations was zero). Applying the shift constant simply aligns the combined scale to the original scale of the primary school performances.
Scaling the three sets of pairwise comparisons together ensures that the origin of the scale is consistent for all performances. In summary, the steps for the joint scaling of performances were as follows. First, the primary school performances were scaled using standard pairs, in which all pairs were sampled from a list of all possible pairs of primary school performances. Second, secondary school performances were scaled also based on standard pairs. Third, a set of the primary performances with the highest scale locations was selected and a set of the lowest secondary performances was selected. Fourth, primary school and secondary school performances were compared using core vs. non-core pair generation and presentation of the pairs to judges for comparison. Once the pairwise comparisons had been made, all data were combined in a single data set and abilities were estimated using the BTL model. As a last step in the empirical study, to align the final scale with the original primary scale, a shift was applied such that the primary school performances have the same location as they did in the original primary scale.
Simulation study
Simulation specifications and details
Simulation specifications were chosen to emulate the Writing scale equating project in terms of the numbers of performances and the direction of the difference between the means. The specifications in Table 1 were followed for the simulation study so it matches the empirical study. Because the goal of the empirical study was to align two previously formed scales, the set of comparisons of primary school performances and the set of comparisons of secondary school performances were held constant over multiple repetitions of the simulation to emulate the design of the empirical study. The core vs. non-core comparisons were generated uniquely over 30 repetitions of the simulation. The top 82 primary school performances and the bottom 32 secondary school performances were selected into the core and non-core sets based on their simulated locations. For each of the 30 repetitions of the simulation, joint scaling of all performances was performed, and a shift constant was calculated in order to center the primary school performance locations on zero.
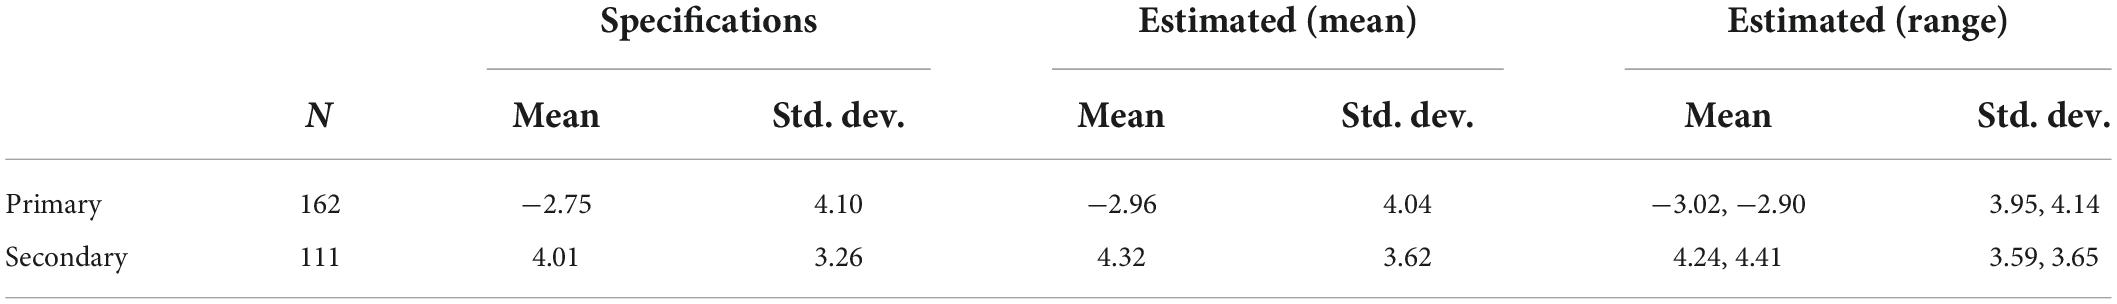
Table 1. Mean and standard deviation of the simulated and estimated parameters for the primary and secondary performances in the simulation study.
The number of performances, and the mean and standard deviation of the person locations, specified for the simulation, are shown in Table 1. The normal random distribution was used to generate logit locations for both the primary school and secondary school simulated performances, based on the specifications in Table 1.
To demonstrate the efficiency of the use of pairings, a similar simulation was conducted in which pairings between performances in the secondary and primary sets were made at random (without replacement). For this simulation, all primary school performances and all secondary performances were in the sampling pools for selection into the core and non-core sets, respectively. This random design simulation was the same as the core vs. non-core simulation in other respects.
Pair generation for the simulated component
For the core vs. non-core simulation, standard pairs were generated for both primary school and secondary school performances using the pair generator R package (Bredemeyer, 2021a). A total of 1,622 pairs were generated for primary school performances and 1,112 pairs were generated for secondary school performances. Each performance was included 40 times on average for the primary school set and 20 times on average in the secondary school set. Primary school and secondary school pairs were formed only once as the standard scales were considered to exist prior to the application of the core vs. non-core method.
Because the core vs. non-core pairings are exhaustive in the empirical data, the core vs. non-core pairs were also formed only once for the simulation; all core performances are compared against all non-core performances, and therefore the comparisons did not vary over repetitions of the simulation. Each non-core performance was paired against every core performance, so that 2,624 comparisons of primary school performances against secondary school performances were made, in each repetition of the simulation.
When all three sets of judgments—primary school standard comparisons, secondary school standard comparisons, and core vs. non-core comparisons—were combined, there was a total of 5,358 comparisons.
Simulated comparisons
Judgments, as to which of the pairs was deemed better, were simulated using the PairwiseComparisons R package (Bredemeyer, 2021b). PairwiseComparisons simulates judgments of pairwise comparisons by generating deviates of the binomial distribution, where the probability of favorably comparing one performance is the probability defined by the BTL model.
Scaling and scale extension for the simulated component
The secondary Writing performances were scaled using the BTL model in the same manner that the primary Writing performances were scaled. To ascertain how well the scales were connected, the mean difference between estimated locations of secondary and primary performances was compared with the difference between the simulated locations of the secondary and primary performances.
The reason for comparing the mean differences is as follows. The simulated difference between the mean secondary and primary locations is 6.75. The estimate of each individual scale location contains measurement error; however, measurement error only has a minor impact on the mean scale locations for the primary and secondary person groups. Therefore, if the two scales are aligned, the estimated mean difference between the person groups will be accurate and consistent with the simulated mean difference of 6.75. Thus, the accuracy of the estimation of the mean difference indicates the accuracy of the alignment of the primary and secondary scales.
In addition, if the scales are aligned, the simulated primary and secondary locations will be correlated with the estimated locations. Also, the plot of simulated vs. estimated locations will follow a single line without being disjointed across year groups. A scatterplot showing the correspondence between simulated and estimated locations for both primary and secondary performances is provided in the results to follow (Figure 5).
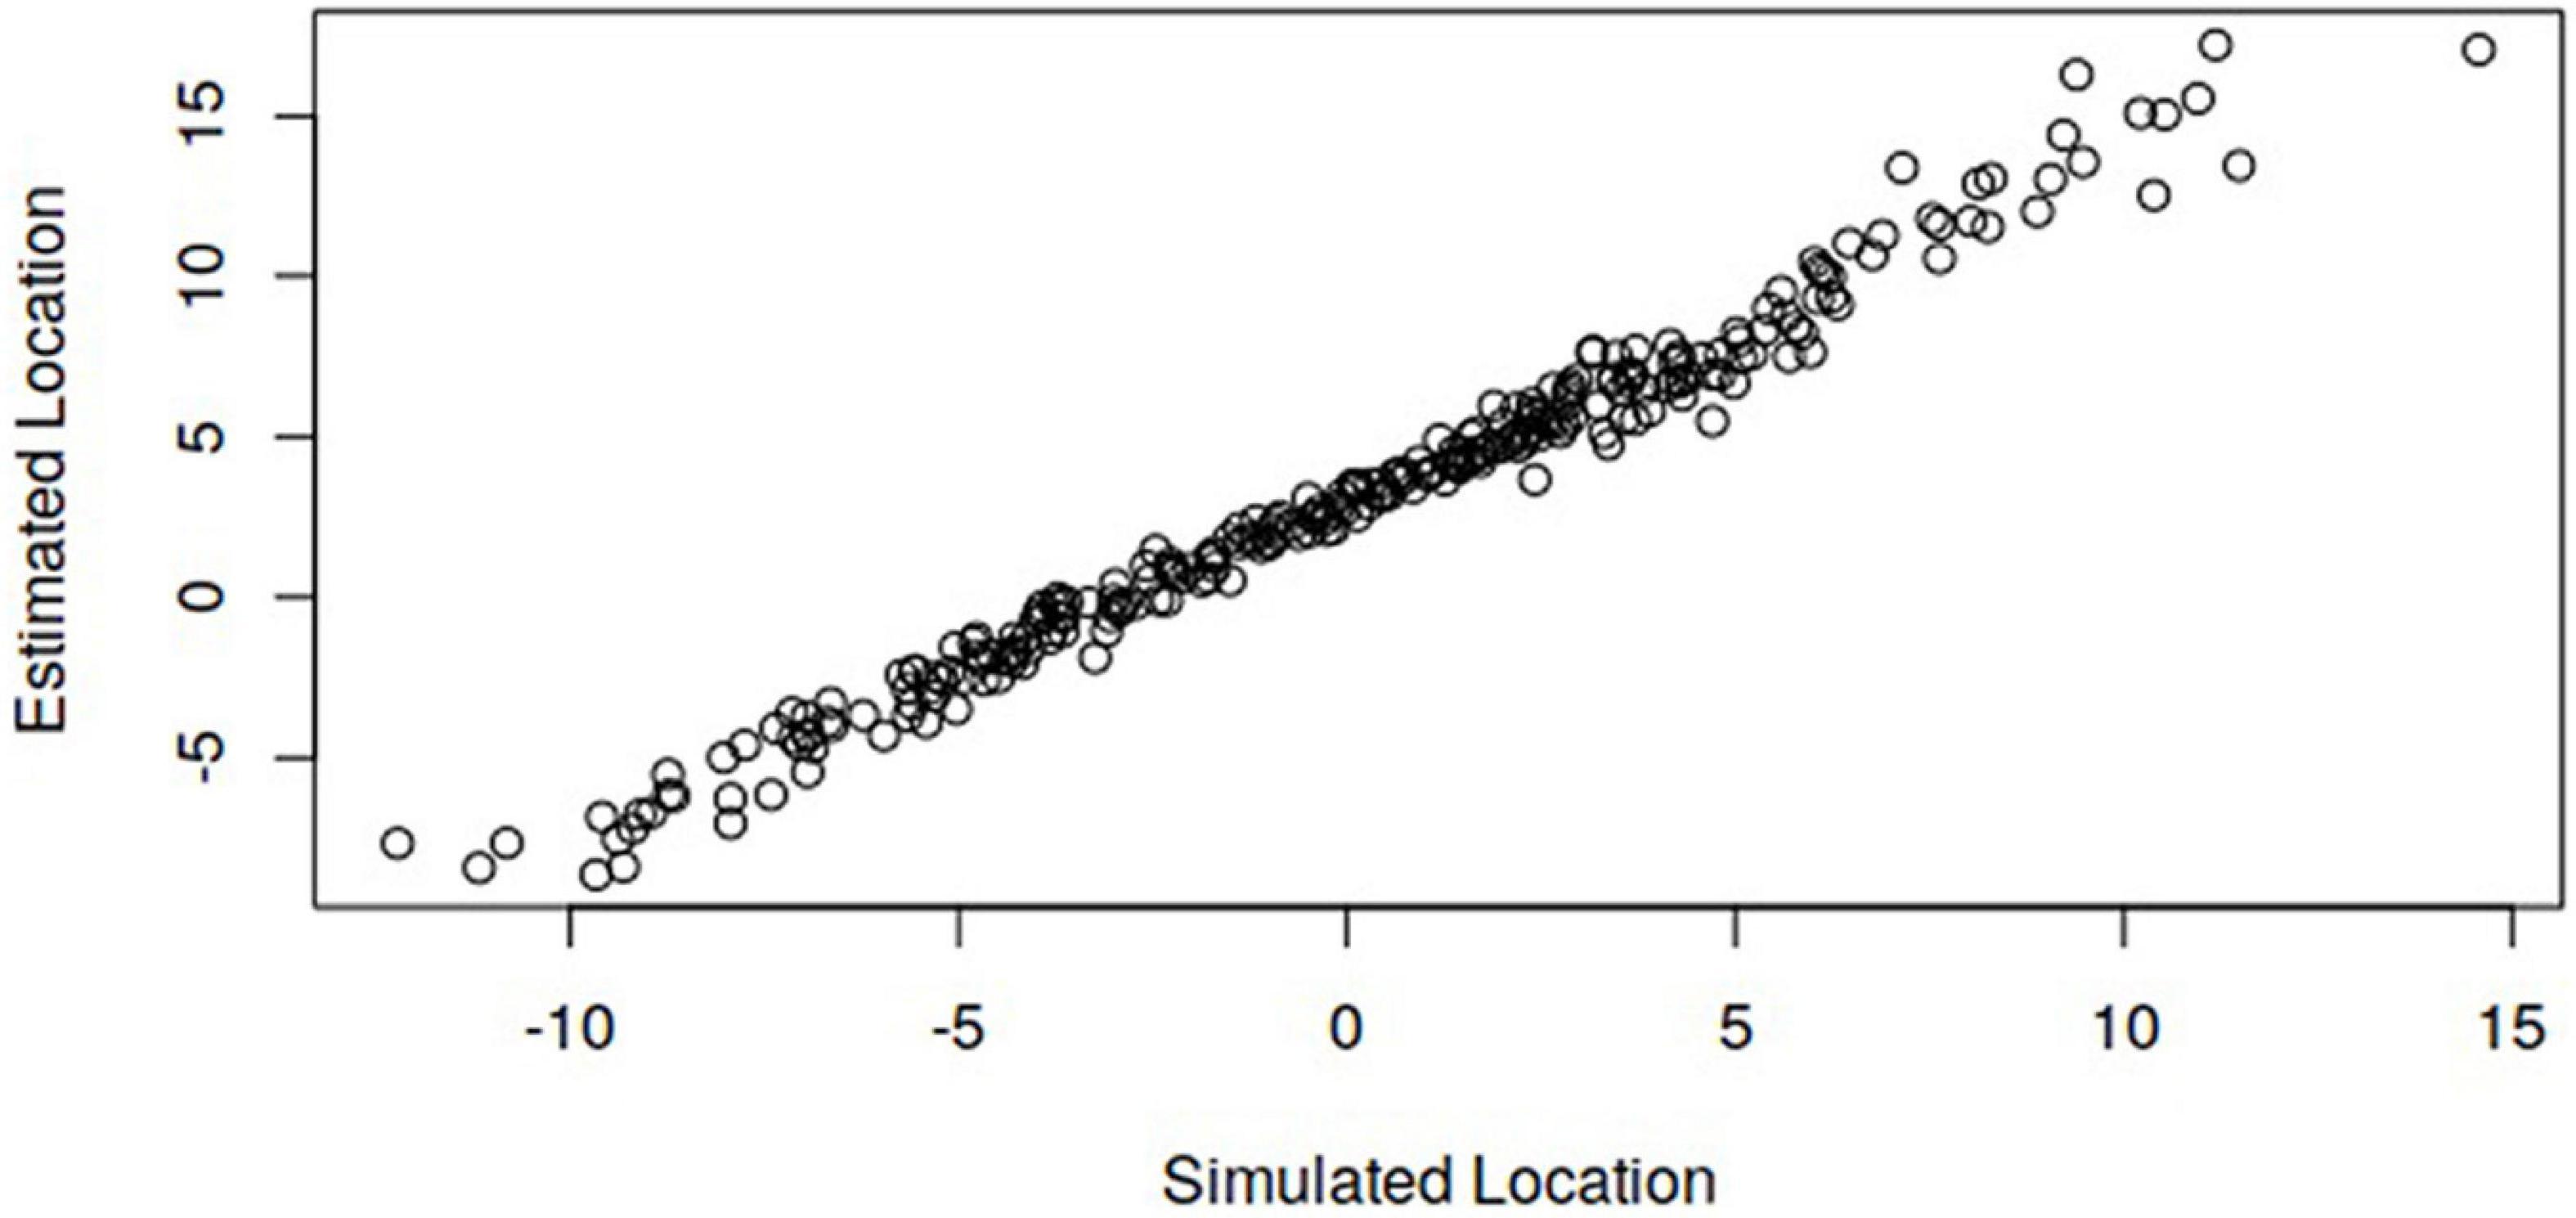
Figure 5. Simulated locations against estimated locations based on joint scaling of all 273 performances in the simulation study.
Results
Empirical study
The Person Separation Index of the joint scale was 0.977, indicating a generally high level of internal consistency among the judgments. On the same scale, 58 of the 273 performances had OUTFIT MNSQ values greater than 1.3, indicating that there was a number of performances with relatively poor fit to the model. On the other hand, a relatively large number of performances had OUTFIT MNSQ values below 0.7 (n = 143).
Of the link set of performances used to connect the scales, 8 of 82 primary and 3 of 32 secondary performances had OUTFIT MNSQ values greater than 1.3, indicating that the sets were connected by performances that mostly had acceptable fit to the BTL model.
To evaluate whether the scales were connected by performances whose locations had a linear association, the performances of the secondary non-core set were independently scaled based on: (i) primary standard pairs combined with the core vs. non-core comparisons; and (ii) secondary standard pairs. The resulting scatterplot of the two sets of estimates for the 32 secondary non-core performances is shown in Figure 2. The association is reasonably linear with a Pearson correlation of r = 0.751.
Table 2 shows the mean and standard deviation of the primary and secondary locations in the empirical study.
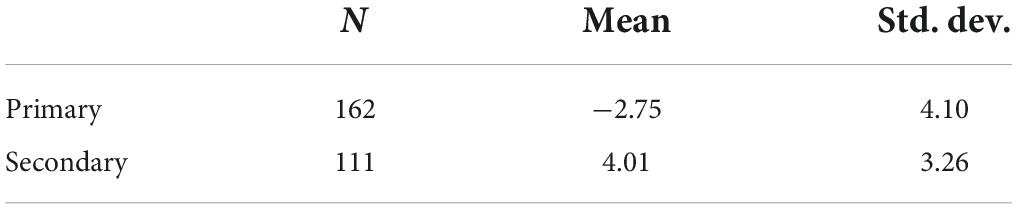
Table 2. Mean and standard deviation of location estimates for the primary and secondary performances in the empirical study.
Simulation study
The Person Separation Index for the joint scale of the core vs. non-core simulation study was 0.98 for all repetitions of the simulation. The Person Separation Index varied among simulation repetitions only by the third decimal place. This indicates a high level of internal consistency among the judgments. From joint scaling, on average across the 30 repetitions, 27 of the 273 performances had OUTFIT MNSQ values greater than 1.3 and 166 of the 273 performances had OUTFIT MNSQ values less than 0.7. The proportion of OUTFIT MNSQ values above 1.3 is somewhat higher than expected in theoretical terms. However, because the data was simulated strictly according to the model, it is likely that the high proportion is related to the specifics of the design. The information nevertheless provides a reference point for the results in the empirical study with its similar design.
Figure 5 shows the association between the simulated locations and the estimated locations, with the latter based on joint scaling of primary and secondary performances. The locations shown in Figure 5 are for a single repetition of the simulation and are indicative of results obtained in the simulations. It can be seen that the bivariate locations follow a single line, indicating the scales have been aligned such that primary and secondary locations are on the same scale.
Figure 3 shows the estimates of the secondary link performances from independent scaling of the secondary data on the x-axis and the primary linking set data on the y-axis. The Pearson correlation is r = 0.698, indicating a linear association that provides a good basis for connecting the two scales. The locations shown in Figure 3 are for a single repetition of the simulation.
The results from: (i) core vs. non-core pairings; and (ii) random pairings, were compared. The cross-set pairings provide information about secondary estimates relative to the primary estimates only if they have non-extreme scores on the primary scale. In the random pairings design, of the cross-set comparisons and averaged across simulations, 32.5% of pairs were involved in comparisons of secondary performances that had extreme estimates based on comparisons with primary performances. As explained in the justification for the approach, these pairs provide no information about the relation between secondary and primary estimates and are wasted for the purpose of aligning the scales. In the core vs. non-core design, of the cross-set comparisons, none of the pairs were involved in comparisons of secondary performances that had extreme estimates based on comparisons with primary performances; that is, none of the pairs were wasted.
The mean difference of the estimates indicates how well the origins of the scales are aligned with each other based on the comparisons. The mean difference between simulated secondary and primary performances is 6.970 on the common scale. The mean difference is more accurately estimated in the core vs. non-core design (7.273) than the random linking design (7.435). The standard deviation of the mean difference provides an estimate of the uncertainty of the estimate around the mean difference based on multiple simulations. The standard deviation is 2.25 times greater in the random linking design (0.162) than the core vs. non-core design (0.072). This effectively indicates a larger standard error of equating resulting from less information for aligning secondary performances on the primary scale. The estimates of the mean differences, in both designs, are larger than simulated due to some bias in the estimates of performances with the highest and lowest locations on the scale (see Figure 5).
The Person Separation Index for the joint scale of the random pairings simulation was 0.98, varying only by the third decimal place among the 30 repetitions of the simulation. From joint scaling, on average across the 30 repetitions, 21 of the 273 performances had OUTFIT MNSQ values greater than 1.3, and 213 of the 273 performances had OUTFIT MNSQ values less than 0.7.
Discussion
The empirical and simulation studies enable discussion of specific considerations applicable to the selection of core and non-core sets for the purpose of scale extension. The considerations apply to cases in which there are two or more non-core sets (which may be subsets of larger sets) that have been scaled based on internal comparisons.
Scaling performances with core vs. non-core comparisons adds flexibility in relevant contexts because this method takes advantage of a measurement scale already formed using standard pairwise comparisons. As the core set of performances have already been scaled, the number of all comparisons can be reduced relative to the standard pairwise method.
Using core and non-core sets enables practitioners to more effectively concentrate the use of available pairwise comparisons to achieve joint scaling given finite resources for comparisons. When resources are limited beyond a certain level, it may not be possible to obtain sufficient pairings to jointly scale sets unless a method is employed to focus the pairings to enable joint scaling.
The comparison of random pairings and core vs. non-core pairings shows that the latter makes more efficient use of available pairs for the purpose of aligning the two scales. Using the core vs. non-core method, the difference between secondary and primary means was more accurately estimated and the variation of the estimate of this difference was substantially less across simulations, indicating less error in aligning the scales. The gain in efficiency is larger when there is less overlap between the distributions of the two scales and that overlap can be judged based on available information. If the distributions overlap substantially, efficiency is not gained. However, even in this case the advantage still remains that performances can be selected based on fit. Additionally, in more general cases involving three or more sets, two or more separate scales can be efficiently joined through a single core scale, as shown in Figure 1. The number of low OUTFIT MNSQ values is larger for the random pairings simulation than in the full joint scaling analysis with core and non-core comparisons. This is likely due to higher level secondary performances being compared favorably against many or all primary performances, in which case many of the residuals are small.
The results of the empirical study indicate reasonably effective scale extension using the core vs. non-core method. The separation index for the scale based on all combined data was high. Fit to the model was not as good as in the simulation study, though reasonable for the applied objectives. In evaluating whether the primary scale could be extended to include secondary performances, a scatterplot was shown of the locations for the secondary (non-core) performances based on the analysis of: (i) the primary and linking set data; and (ii) the secondary data. This is useful to examine whether there is a linear association between the estimates of the core, linking set on the two scales. The scatterplot in Figure 2 shows a reasonably linear association for the empirical data; the corresponding scatterplot in Figure 3 shows a clear linear association with a very high correlation for the simulated data.
Once primary and secondary performances were jointly scaled in the empirical context, the secondary performances were qualitatively examined to ascertain whether their positions were defensible relative to the primary performances. These checks were conducted in the form of paired comparisons of secondary and primary, with an emphasis on performances with similar scale locations. The qualitative examination suggested that reasonable alignment of the scales was achieved and that there was not a systematic tendency for secondary performances to be placed too high or too low on the scale relative to the primary performances. In some cases, secondary performances did not appear to be placed well on the scale; however, this is to be expected given the standard errors associated with estimates.
The results of the simulation study showed a close correspondence between: (i) the simulated difference between the primary and secondary mean locations; and (ii) the difference between the mean locations of the estimates of the primary and secondary locations on the joint scale. This confirms that the core vs. non-core comparisons enable extension of the original primary scale with reasonable accuracy when there are a large number of comparisons, using a design of the kind implemented in the empirical study.
First, the method enables utilization of information from the existing scale in designing the scale extension exercise. In the present study, higher level performances were selected from the pre-existing primary scale because the secondary school performances would be compared better more often if lower-level performances had been selected, yielding extreme locations. It is possible to select core performances that have adequate fit also. That is, it is possible to select sets of performances for cross-set comparisons to optimize joint scaling results according to criteria for relative targeting and model fit of performances used.
Second, because the method avoids further within-set comparisons, effort by judges on comparisons is concentrated on comparisons that enable the scales to be equated. Theoretically, the standard errors of estimates in the core and non-core sets will decrease as a result of the addition of core vs. non-core comparisons due to additional Fisher information from additional comparisons. However, theoretically the standard errors of all other estimates will not decrease because there are no further comparisons to provide additional Fisher information. The method is therefore most appropriate where the priority is the efficient use of time available to make comparisons for the equating of scales. Given measurement of a common construct and appropriate targeting and fit, theoretically it is anticipated that a greater number of core vs. non-core comparisons will result in improved alignment of the two scales.
Third, the method potentially provides clearer diagnostic information about the robustness of the joining or equating of the scales than may otherwise be available. The evaluation of the association of locations, shown in Figure 2 for the empirical study and in Figure 3 for the simulation study, are possible due to the design. The objective of the project was to place the performances on a single scale. It is therefore expected that the non-core secondary performances will have the same relative scale locations when derived from comparisons against primary performances as when derived from comparisons against other secondary performances. In the present study, the design enables estimates of the secondary performances solely from comparisons of secondary against primary performances. These were compared with estimates obtained from standard pairwise comparison scaling of the secondary performances to evaluate whether there is a linear association between the independent estimates obtained from the two sets of comparisons.
In addition, for diagnostic purposes, performance-level fit statistics specifically for cross-set comparisons can be obtained to evaluate whether linking set comparisons fit the model adequately. Without the use of a linking set, it is more difficult to focus specifically on diagnostic information related to comparisons that connect the two sets of data.
The comparison of core vs. non-core performances ensures there are cross-set comparisons to enable joint scaling. In a given empirical context, the design and number of comparisons need to be selected to meet accuracy requirements for such applied objectives.
The context of the present study is analogous to vertical equating using an item response model. For equating, core performances need to be reasonably targeted to the non-core performances in terms of the latent ability of students as explained earlier in this article.
Although not the main focus of this article, as discussed above, the generation of core vs. non-core pairs is also applicable where the objective is to obtain scale estimates for performances on a pre-existing scale. That is, the generation of such pairs enables performances to be placed on an existing scale. This opens up the possibility of research into computer adaptive assessment procedures based on: (i) locations on an existing scale; and (ii) estimates of the locations of performances to be placed on the scale obtained after each successive comparison of a performance against a scaled performance. The nature of such an application is virtually identical to computer adaptive testing using IRT estimation. Consequently, practitioners can draw upon relevant literature regarding techniques, algorithms, and so forth as the basis of presenting pairs to judges in the same essential manner that items are presented to students in computer adaptive testing using calibrated item banks.
Limitations and delimitations
The present article aims to illustrate the method and its application in a particular empirical context that enables explanation of key considerations. It is beyond the scope of this article to investigate the number of core and non-core items and number of comparisons required to equate scales. Simulation studies could be used to ascertain the accuracy of equating under different conditions, given combinations of the following parameters: number of core performances; numbers of non-core performance sets; non-core performances per set; and numbers of core vs. non-core comparisons. Although such investigations are beyond the scope of this article, key considerations have been articulated, including the necessity to select core and non-core performances that have overlapping levels of achievement to the extent feasible. Selecting a range of performance levels is also desirable for checking there is a linear relationship as shown in Figures 2, 3.
With respect to the applied objective of the chosen context, the study shows that it is possible to equate primary and secondary persuasive writing scales according to the criteria adopted. The scatterplot showed a reasonably good correlation. Having said this, we consider that it would be ideal to have a higher correlation, above 0.8. The number of comparisons is a key factor affecting the precision of the estimates and, therefore, the highest correlation that can be obtained.
Further research would be needed to examine how generalizable the empirical finding is that primary Writing scales can be extended to include secondary school performances. It is noted, however, that in unpublished studies, primary and secondary English persuasive performances have been jointly scaled as part of the Australian National Assessment Program—Literacy and Numeracy for a number of years. The authors conducted work on these exercises and consider the model fit in such exercises generally good and similar to fit reported in Humphry and McGrane (2015). However, it is beyond the scope of this article to go into further depth about the generalizability of the empirical findings.
In addition to having adequate correlations and person separation indices, the ordering of the performances must validly reflect the latent trait of interest. Attention needs to be given to whether the ordering of the performances is considered to validly reflect the nature of the trait being measured, in terms of the progression of skills evident in performances with increasing scale locations.
Summary and conclusion
This article described and illustrated a method for the joint scaling of two or more sets of performances based on pairwise comparisons and illustrated its application in an empirical context. The article focused on a case in which there were only two sets of performances and subsets of primary and secondary performances were designated core and non-core. This method is applicable where there is an existing scale of student abilities and the objective is to equate one or more new scales onto the existing scale. The method is referred to as a linking set scale extension. The method is achieved by selecting a core linking set of performances and by generating core vs. non-core comparisons to equate any number of existing scales.
A simulation study was used to show that the method enables the extension of a scale under conditions similar to those in the empirical study with a larger number of comparisons. This article illustrated the application of the method to a persuasive Writing scale and used this context to summarize key applied considerations. Comparison of random pairings with core/non-core pairings showed the latter is more efficient and that for a given number of pairs, it provided more accurate alignment of the scales and less variation in the alignment across simulations.
The method described in this article can be used to equate two scales provided the scales measure the same latent trait, the two scales are based on responses to tasks of comparable difficulty, and there is sufficient overlap in the level of performances. This method is flexible and efficient, taking advantage of a pre-existing measurement scale to select core performances to extend a scale. A high level of internal reliability was obtained in the empirical study. Assessment of the validity of measurement of the intended construct can be achieved by qualitative examination of the progression of skills and knowledge with increasing scale locations.
Data availability statement
The raw data supporting the conclusions of this article will be made available by the authors, without undue reservation.
Ethics statement
The studies involving human participants were reviewed and approved by the University of Western Australian Education Human Research Ethics Committee. Written informed consent from the participants’ legal guardian/next of kin was not required to participate in this study in accordance with the national legislation and the institutional requirements.
Author contributions
Both authors listed have made a substantial, direct, and intellectual contribution to the work, and approved it for publication.
Funding
This research was partially funded by an Australian Research Council Linkage Project (ARC LP180100046). We acknowledge the funding received for this project from the Australian Research Council, Australian Catholic University, University of Western Australia and Partner Organisations: the Queensland Department of Education, Western Australian School Curriculum and Standards Authority, and Catholic Education Western Australia Limited.
Acknowledgments
We acknowledge the participation of relevant schools in Western Australia in the empirical study reported in this article.
Conflict of interest
The authors declare that the research was conducted in the absence of any commercial or financial relationships that could be construed as a potential conflict of interest.
Publisher’s note
All claims expressed in this article are solely those of the authors and do not necessarily represent those of their affiliated organizations, or those of the publisher, the editors and the reviewers. Any product that may be evaluated in this article, or claim that may be made by its manufacturer, is not guaranteed or endorsed by the publisher.
References
Andrich, D. A. (1978). Relationships Between the Thurstone and Rasch Approaches to Item Scaling. Appl. Psychol. Meas. 2, 451–462.
Bradley, R. A., and Terry, M. E. (1952). Rank Analysis of Incomplete Block designs: The Method of Paired Comparisons. Biometrika 39, 324–345.
Bramley, T. (2007). “Paired Comparison Methods,” in Techniques for monitoring the comparability of examination standards, eds P. Newton, J. Baird, H. Goldstein, H. Patrick, and P. Tymms (London: Qualifications and Curriculum Authority), 246–300.
Bredemeyer, K. (2021a). pair.generator: Pair performances for assessment using pairwise comparisons. R package version 0.3.2. Available online at: https://github.com/KenBredemeyer/pair.generator (accessed June 29, 2022).
Bredemeyer, K. (2021b). PairwiseComparisons: BTL modelling for pairwise comparisons. R package version 0.1.0. Available online at: https://github.com/KenBredemeyer/PairwiseComparisons (accessed June 29, 2022).
Heldsinger, S. A., and Humphry, S. M. (2010). Using the method of pairwise comparison to obtain reliable teacher assessments. Aust. Educ. Res. 37, 1–19. doi: 10.1007/BF03216919
Heldsinger, S. A., and Humphry, S. M. (2013). Using calibrated exemplars in the teacher-assessment of writing: an empirical study. Educ. Res. 55, 219–235. doi: 10.1080/00131881.2013.825159
Humphry, S. M., and Heldsinger, S. A. (2019). A Two-Stage Method for Classroom Assessments of Essay Writing. J. Educ. Meas. 56, 505–520. doi: 10.1111/jedm.12223
Humphry, S. M., and Heldsinger, S. A. (2020). A Two-Stage Method for Obtaining Reliable Teacher Assessments of Writing. Front. Educ. 56, 505–520. doi: 10.3389/feduc.2020.00006
Humphry, S. M., and McGrane, J. A. (2015). Equating a large-scale writing assessment using pairwise comparisons of performances. Aust. Educ. Res. 42, 443–460. doi: 10.1007/s13384-014-0168-6
Pollit, A. (2009). “Abolishing marksism and resuing validity. Cambridge Exam Research,” in A paper for the 35th Annual conference of the International Association for Educational Assessment, (Brisbane).
Pollit, A. (2012). Comparative Judgement for Assessment. Int. J. Techol. Des. Educ. 22, 157–170. doi: 10.1007/s10798-011-9189-x
R Core Team (2021). R: A language and environment for statistical computing. Vienna: R Foundation for Statistical Computing.
Smith, A. B., Rush, R., Fallowfield, L. J., Velikova, G., and Sharpe, M. (2008). Rasch Fit statistics and sample size considerations for polytomous data. Med. Res. Methodol. 8:33. doi: 10.1186/1471-2288-8-33
Steedle, J. T., and Ferrara, S. (2016). Evaluating Comparative Judgment as an Approach to Essay Scoring. Appl. Meas. Educ. 29, 211–223. doi: 10.1080/08957347.2016.1171769
Verhavert, S., Bouwer, R., Donche, V., and De Maeyer, S. (2019). A meta-analysis on the reliability of comparative judgement. Assess. Educ. Princ. Policy Pract. 26, 541–562. doi: 10.1080/0969594X.2019.1602027
Keywords: pairwise comparison, comparative judgment, linking set method, equating, efficiency
Citation: Humphry S and Bredemeyer K (2022) Pairwise comparison scale extension using core linking sets. Front. Educ. 7:826742. doi: 10.3389/feduc.2022.826742
Received: 01 December 2021; Accepted: 17 August 2022;
Published: 08 September 2022.
Edited by:
Tine Van Daal, University of Antwerp, BelgiumReviewed by:
Dries Debeer, Ghent University, BelgiumSoo Lee, American Institutes for Research, United States
Copyright © 2022 Humphry and Bredemeyer. This is an open-access article distributed under the terms of the Creative Commons Attribution License (CC BY). The use, distribution or reproduction in other forums is permitted, provided the original author(s) and the copyright owner(s) are credited and that the original publication in this journal is cited, in accordance with accepted academic practice. No use, distribution or reproduction is permitted which does not comply with these terms.
*Correspondence: Stephen Humphry, c3RlcGhlbi5odW1waHJ5QHV3YS5lZHUuYXU=
†These authors have contributed equally to this work