- 1Department of Professional Education and Life-Long Learning, Faculty of Education, University of Hamburg, Hamburg, Germany
- 2Department of Business Education and Development, School of Business, Economics and Social Sciences, University of Graz, Graz, Austria
- 3Institute for Business and Vocational Education and Training, Johannes Kepler University Linz, Linz, Austria
- 4Business Administration and Business Education, Department of Business Administration, Economics and Law, University of Oldenburg, Oldenburg, Germany
Learning analytics represent a promising approach for fostering personalized learning processes. Most applications of this technology currently do not use textual data for providing information on learning, or for deriving recommendations for further development. This paper presents the results of three studies aiming to make textual information usable. In the first study, the iota concept is introduced as a new content analysis measure to evaluate inter-coder reliability. The main advantage of this new concept is that it provides a reliability estimation for every single category, allowing deeper insight into the quality of textual analysis. The second study simulates the process of content analysis, comparing the new iota concept with well-established measures (e.g., Krippendorff’s Alpha, percentage agreement). The results show that the new concept covers the true reliability of a coding scheme, and is not affected by the number of coders or categories, the sample size, or the distribution of data. Furthermore, cut-off values are derived for judging the quality of the analysis. The third study employs the new concept, as it analyzes the performance of different artificial intelligence (AI) approaches for interpreting textual data based on 90 different constructs. The texts used here were either created by apprentices, students, and pupils, or were taken from vocational textbooks. The paper shows that AI can reliably interpret textual information for learning purposes, and also provides recommendations for optimal AI configuration.
Introduction1
Meta- and meta-meta analyses show that the integration of digital technologies increases the efficiency and effectiveness of learning processes (Kulik and Kulik, 1991; Means et al., 2010; Tamim et al., 2011; Bernard et al., 2014). Several meta-analyses have proven the usefulness of design principles for multimedia learning environments (Brom et al., 2018; Schneider et al., 2018; Mayer, 2019; Mayer and Fiorella, 2019; Mayer and Pilegard, 2019; Alpizar et al., 2020), and digital technologies are critical for designing state-of-the-art instructional processes.
The improvement potential offered by digital technologies can be enhanced even further if the design of instruction is adapted to the individual prerequisites of every single learner. The advantages of personalized instruction have been empirically supported by several studies (Schrader, 1989; Anders et al., 2010; Karst et al., 2014). For example, Bloom (1984) showed that individual tutoring is more effective than traditional classroom settings with 30 students per teacher. A study by VanLehn (2011) shows that computer-based intelligent tutoring systems are nearly as effective as one-on-one human tutoring.
One possibility for implementing personalized learning is via learning analytics which aims to improve learning (Rienties et al., 2020). These are “the collection, analysis, and application of data accumulated to assess the behavior of educational communities. Whether it be through the use of statistical techniques and predictive modeling, interactive visualizations, or taxonomies and frameworks, the ultimate goal is to optimize both student and faculty performance, to refine pedagogical strategies, to streamline institutional costs, to determine students’ engagement with the course material, to highlight potentially struggling students (and to alter pedagogy accordingly), to fine tune grading systems using real-time analysis, and to allow instructors to judge their own educational efficacy” (Larusson and White, 2014). The actual practice of learning analytics was reported in a literature review of 401 research papers by Jaakonmäki et al. (2020), showing that they are mostly applied for the evaluation of student performance, decision support, and clustering of learners. However, it was determined that the real-time analysis of students’ learning behavior, and the adaption of learning materials and demands to individual needs are only rarely conducted.
The reason for this low level of personalization can be traced to the high organizational and technical demands of implementation. This type of learning analytics represents the second-to-last level of organizational implementation in the learning analytics sophistication model proposed by Siemens et al. (2013). Another reason is the limited quality of data available for the purpose of learning analytics. For example, many studies use so-called log data, which represents the interaction of a learner with the learning environment. This includes elements such as the number of assessment attempts, time taken for assessments, videos seen, or videos viewed repeatedly (Ifenthaler and Widanapathirana, 2014; Liu et al., 2018; ElSayed et al., 2019). Other studies opt for a research approach to learning analytics that is based on the analysis of stable and/or historical data such as students’ social backgrounds and demographic characteristics, historical education records, or average historical grades (Ifenthaler and Widanapathirana, 2014; ElSayed et al., 2019). In their literature review, ElSayed et al. (2019) reported four additional data types that are used less frequently: multimodal data (e.g., heart rate, eye tracking), chat and forum conversations, video recordings, and self-reported data (e.g., questionnaires, interviews). On the one hand these data types are important for understanding individual learning, as well as for providing recommendations for further development, because empirical studies prove their predictive power. On the other hand this kind of data only provides limited insights about changes in students’ cognition and motivation as the analysis of the students’ interactions in terms of clicking in a digital learning environment does not provide enough ground for pedagogical decision-making (Reich, 2015).
What can be concluded from these studies is that data should be supplemented by textual data allowing a deeper analysis of the quality of learning processes and their outcomes. It is not only important to gather information on grades, gender, or how often a student repeats a video. It is also essential for fine-tuning future learning processes to understand which individual abilities, attitudes, and beliefs lead to current learning behavior and outcomes. Textual data can provide this kind of insight. For example, if teachers want to clarify whether their students have the “correct” understanding of “price” in an economy context, they could ask the students to write an essay in which they explain what a price is. The teachers can use this information to find a starting point for further instruction, especially if some students understand the concept in a “wrong” manner. Another example of this idea can be found in teacher education. Prospective teachers create learning materials containing textual data, such as learning task, explanations, and visualizations for a lesson plan. The information included in the textual components here strongly predicts what kind of learning processes a prospective teacher intends to apply. For example, the task “What kind of product assortment expansion can be characterized as ‘diversification’?” does not include any of the experiences of apprentices, i.e., it is a de-contextual task. In contrast, the task “Explain the factors that influence the range of goods in your training company and discuss it with your colleagues” explicitly refers to the experience apprentices gain at the company where they are doing their training. Based on the textual information of the task, a teacher educator can conclude the extent in which prospective teachers integrate the experiences of their learners when creating a learning environment, and further interventions can be planned based on their conclusions.
Intervention planning makes it necessary to sort information into pedagogical and didactical theories. As Wong et al. (2019) state: “(…) [L]earning analytics require theories and principles on instructional design to guide the transformation of the information obtained from the data into useful knowledge for instructional design” (see also Luan et al., 2020). This complex challenge is illustrated in Figure 1. With learning analytics applications, the computer program has to understand the textual information, summarize the information in categories of scientific models and theories, and derive the impact of the categories on further learning to provide recommendations for learners and teachers. In essence, learning analytics applications have to solve the same problems as human teachers: diagnose the preconditions of learners, and tailor adequately adapted learning processes based on scientific insights.
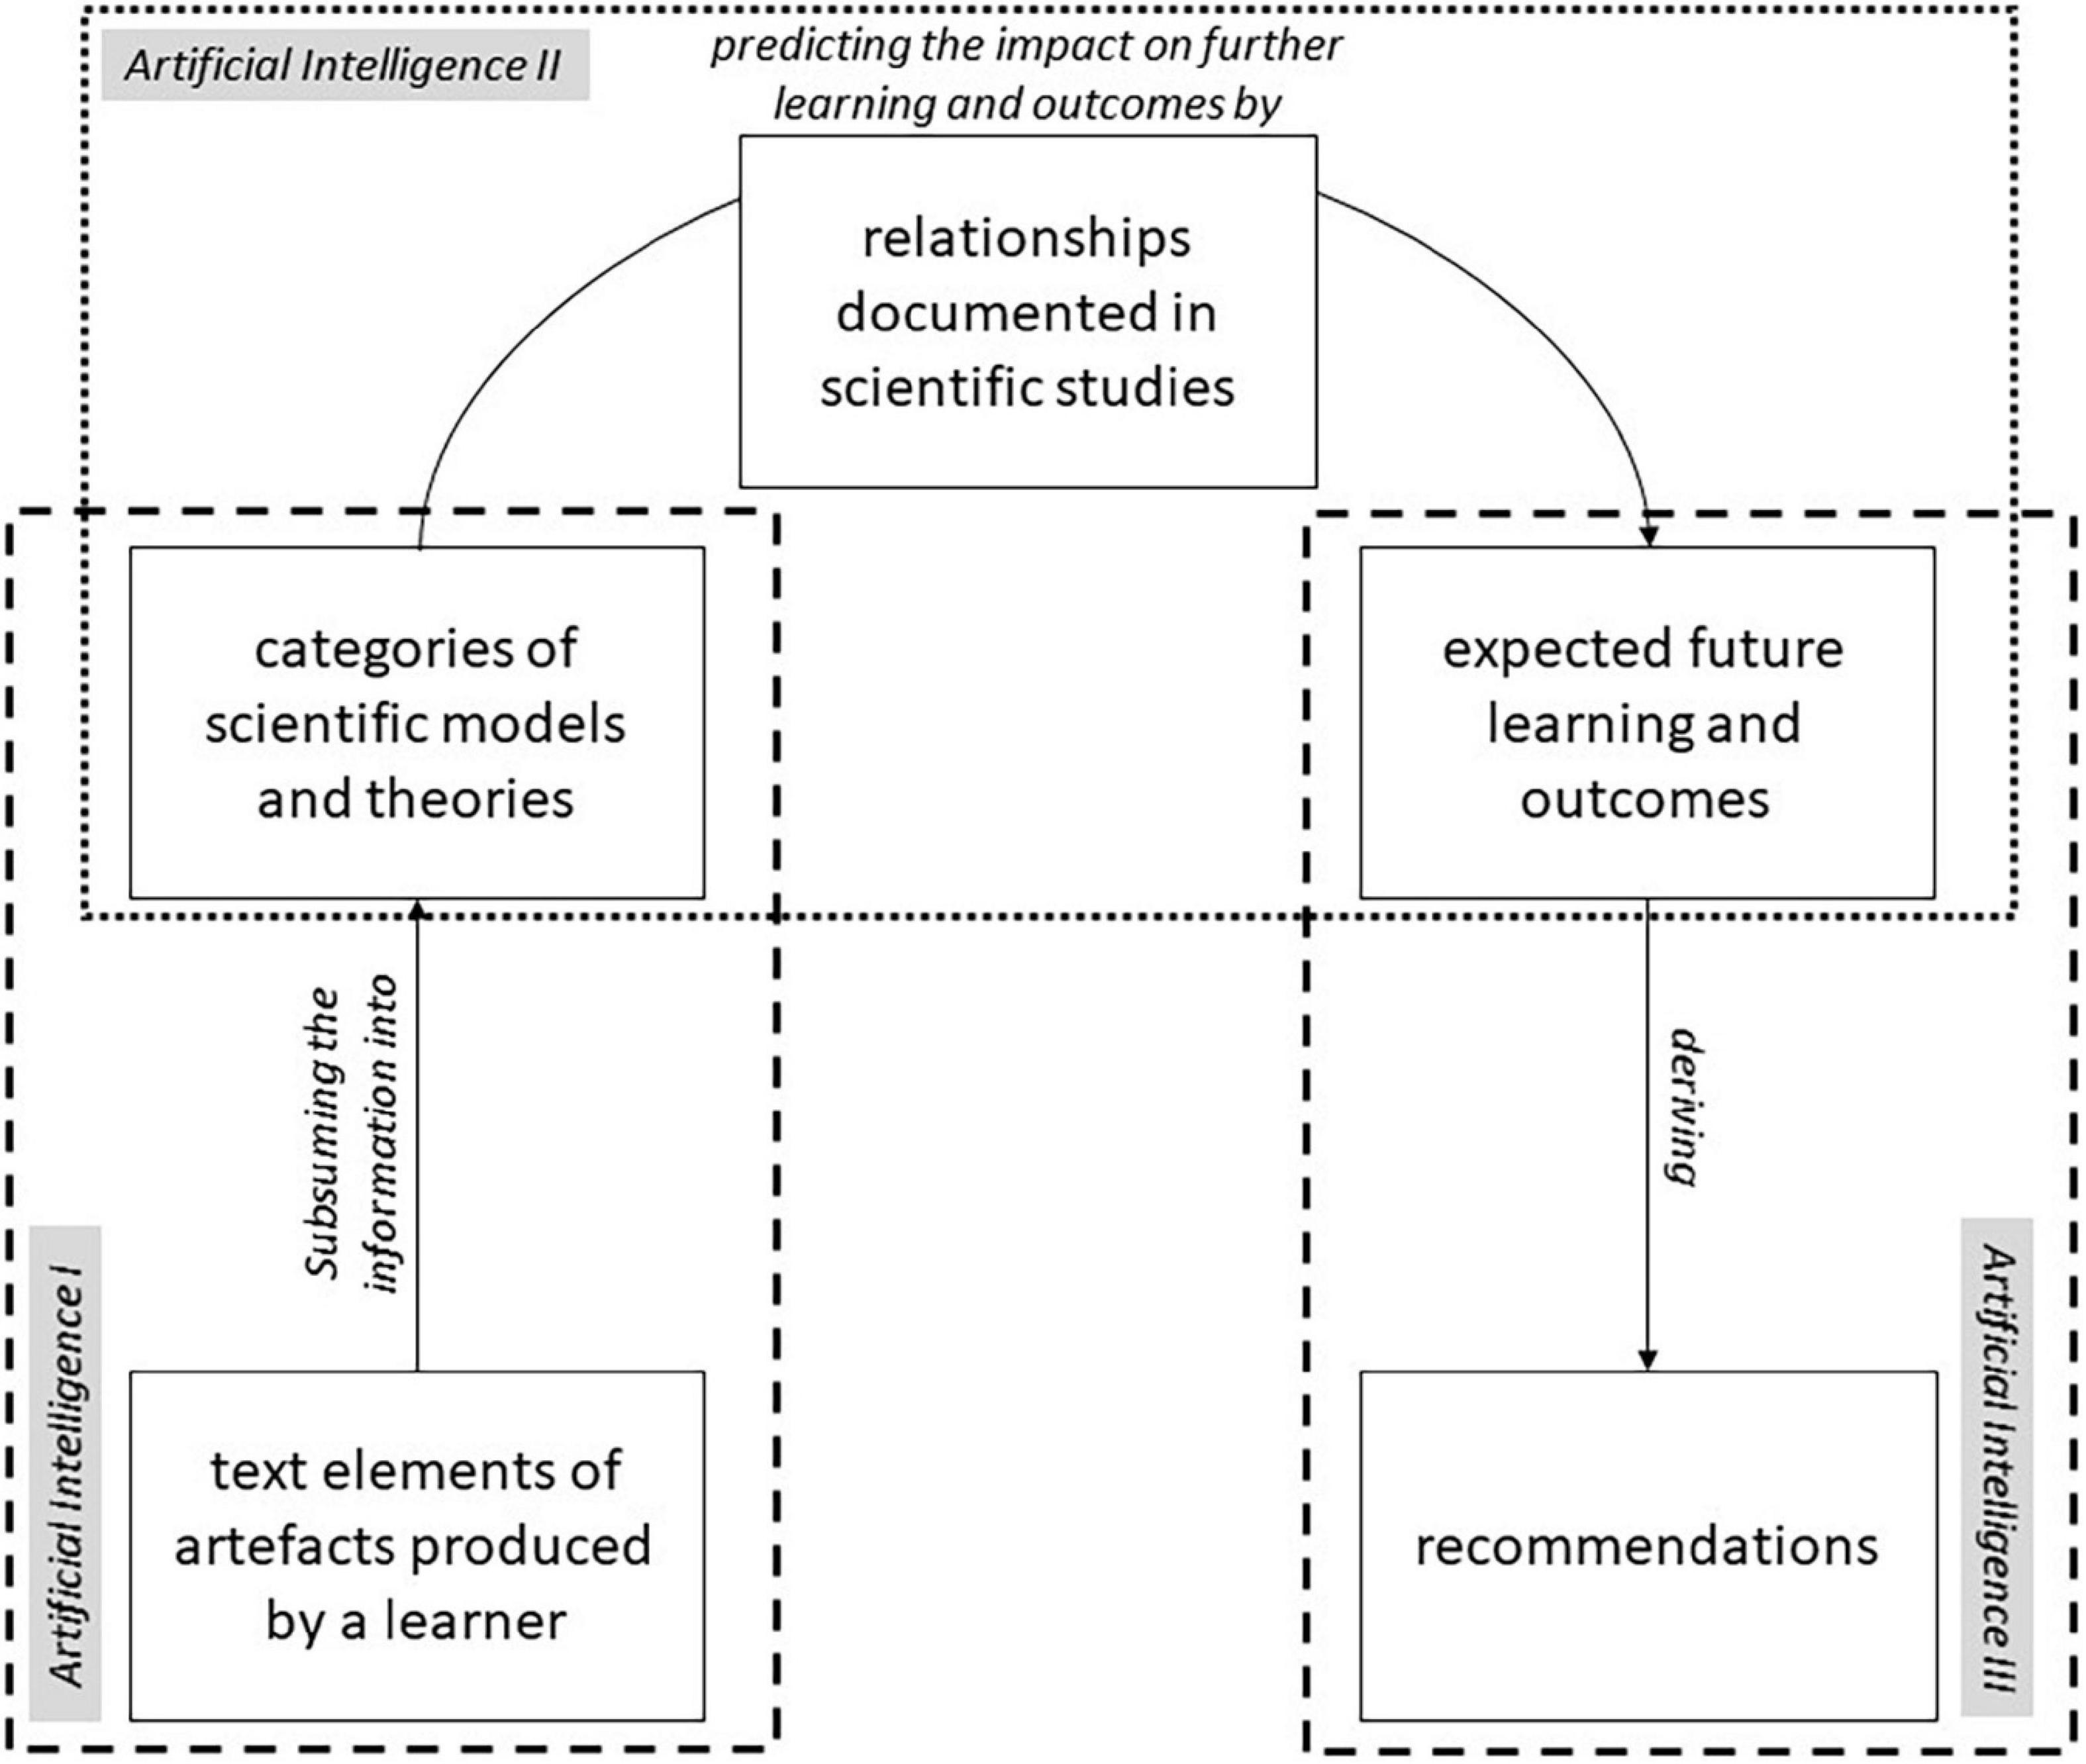
Figure 1. Summarizing information on individual learners into models and theories for deriving recommendations.
Learning analytics require the realization of complex tasks using artificial intelligence (AI). AI describes the attempt to simulate human actions by a computer (Kleesiek et al., 2020), and consists of machine learning (ML). In ML, a computer solves a problem by developing the necessary algorithm itself (Alpaydin, 2019; Lanquillon, 2019). With the different types of ML, supervised machine learning is able to realize the model of Figure 1, providing links to established scientific models and theories. In this special case, AI attempts to generate a prediction model which transforms input data into output data. In the model seen in Figure 1, the first step aims to sort the information of an individual learner based on textual data into models and theories. The input data represents texts (e.g., written essays, interviews, tasks, instructional texts), while the output data represents categories from didactical and pedagogical theories and models (AI I). The next step predicts further learning and outcomes based on the identified categories (AI II). In this case, the input data are the categories, and the output data are characteristics of other learning-related variables (e.g., grades, motivation, use of learning strategies). Finally, the information about the learning-related variables forms the input data for generating recommendations as output data (AI III). In this stage, AI can recommend interventions that produce the strongest impact for the variable relevant for learning based on the current state of these variables. For example, if a student has low grades and low motivation, AI can recommend interventions that promote the quality and quantity of motivation based on the self-determination theory of motivation (Ryan and Deci, 2012), such as an informative feedback or granting students freedom while working on a task (Euler and Hahn, 2014). The increased motivation increases the chance that the students improve their grades since motivation is related to the quality of actions (Cerasoli et al., 2014).
This paper focuses on the first step of this process (AI I). AI has to understand textual data and learn whether and how this information belongs to scientific categories. AI here requires a data collection of input and output data for identifying the relationship between the two data types (Lanquillon, 2019). AI essentially has to conduct parts of a content analysis by assigning texts (input data) to categories (output data) based on an initial content analysis of humans. As this paper concentrates on supervised machine learning, this means that humans have to develop a coding scheme. That is, humans have to define the categories to which the text can be assigned. They have to ensure sufficient quality of the coding scheme, and they need to have applied the coding scheme to a specific number of textual documents in order to generate the necessary input and output data for the training of AI. Only on the basis of this data, AI can learn to conduct a content analysis which is limited to the coding processes of a human developed coding scheme. As a result, the quality of the training data for AI is critical as Song et al. (2020) recognized in their simulation study. In their study, the quality of the initial data accounts for 62% of the variance of the mean absolute prediction error.
Because the quality of content analysis performed by humans and computers is critical for the process of learning analytics, the accuracy of the assignments has to be very high, meaning a powerful AI algorithm that includes a configuration that optimizes its accuracy has to be selected. This also requires an accurate initial content analysis by humans. Whereas a large number of studies compare the performance of different kinds of AI (e.g., Lorena et al., 2011; Hartmann et al., 2019), different configurations of parameters have rarely been investigated (e.g., Probst et al., 2019). These hyperparameters have to be chosen before the learning process of AI begins; they are normally not optimized during the learning process (Probst et al., 2019). Furthermore, most performance studies do not analyze how accurately AI interprets the texts of students for learning purposes. Previous studies analyze textual data such as product reviews on Amazon, social media comments on Facebook or user generated content on Twitter (Hartmann et al., 2019; Saura et al., 2022). As a consequence, there is a clear research gap as there is no empirical evidence how well AI can be used for the analysis of textual data generated in educational settings.
The issue of determining the performance of AI for interpreting texts generally increases, because there is no widely-accepted performance measure for content analysis reliability regardless whether it is conducted by human or artificial intelligence. Reliability is a central characteristic of any assessment instrument, and describes the extent to which the instrument produces error-free data (Schreier, 2012). Krippendorff (2019) suggests replicability as a fundamental reliability concept, which is also referred to as inter-coder reliability. This describes the degree to which “a process can be reproduced by different analysts, working under varying conditions, at different locations, or using different but functionally equivalent measuring instruments” (Krippendorff, 2019). Past decades have seen a large number of reliability measures being suggested. The study by Hove et al. (2018) shows that the 20 reliability measures they investigated differ in their numeric values for the same data. Thus, it is hard to decide which measure to trust for the judgment of quality in content analysis. Krippendorff’s Alpha is currently the most recommended reliability measure (Hayes and Krippendorff, 2007), as it can be applied to variables of any kind (nominal, ordinal, and metric); to any number of coders; to data with missing cases and unequal sample sizes; all while comprising chance correction (Krippendorff, 2019). Recent years, however, have seen the advantages of Krippendorff’s Alpha being questioned and controversially discussed (Feng and Zhao, 2016; Krippendorff, 2016; Zhao et al., 2018). Zhao et al. (2013) analyzed different reliability measures, concluding that Krippendorff’s Alpha contains problematic assumptions and produces the highest number of paradoxes and abnormalities. For example, they argue that Alpha penalizes improved coding, meaning that if coders correct errors, the values for Alpha can decrease (Zhao et al., 2013). Furthermore, cases exist where coder agreement is nearly 100%, while the Alpha values are about 0, indicating the absence of reliability. Thus, Krippendorff’s Alpha may lead to false conclusions about the reliability of a content analysis. This is problematic since this measure has become one of the most used measures in content analysis in the last 30 years (Lovejoy et al., 2016) and is used in simulation studies for estimating the initial data’s impact on the performance quality of AI (Song et al., 2020). As a result, there is a need for new reliability measures that overcome these difficulties (Zhao et al., 2013).
Feng and Zhao (2016) suggest to orientate a new reliability measure on the item response theory and not on the classical test theory. In the classical test theory reliability is characterized with measures such as Cronbach’s Alpha. These measures produce a single numeric value for a complete scale similar to the measure currently used in content analysis (e.g., Krippendorff’s Alpha, percentage agreement, Scott’s Pi, Cohen’s Kappa) (Lovejoy et al., 2016). From the perspective of the item response theory, this is an oversimplification since the reliability is not constant over the range of a scale. With the help of the test information curve, the reliability of a scale can be investigated for different scale characteristics (e.g., de Ayala, 2009; Baker and Kim, 2017). For example, a test for measuring the motivation of students can be more reliable in the middle than for the extreme poles implying that the test is reliable only for participants with medium motivation and less reliable for students with very low or very high motivation. Furthermore, some models of the item response theory such as Rasch models offer the opportunity to investigate if a scale produces a bias for different groups of individuals. That is, they allow to examine whether an instrument functions similarly for different groups of people (subgroup invariance) or not (e.g., Baker and Kim, 2017). Based on the previous example in this paragraph, a test may be more reliable for women with high motivation than for men with high motivation, leading to bias. Men with a high motivation may be falsely represented in the data. Current measures for content analysis do not provide these analytical opportunities.
In this context this paper has the following objectives:
(1) Developing a new performance measure for content analysis,
(2) Investigating and comparing the properties of the new measure with well-established measures,
(3) Analyzing the performance of AI based on the new measure, and deriving insights for the optimized configuration of AI in educational contexts.
By working on these objectives the originality of the present study is that
• it develops a new and innovative measure for content analysis based on the ideas of item response theory. That is, a measure that allows to assess the reliability of every single category of a coding scheme. Previous measures are limited to the scale level only.
• it develops a new measure for content analysis avoiding the problematic assumptions Krippendorff’s Alpha uses as discussed in literature (Zhao et al., 2013, 2018; Feng and Zhao, 2016; Krippendorff, 2016).
• it generates rules of thumb for the new measure to judge the quality of content analysis in practical applications.
• it applies a new and innovative approach for determining the performance of AI in the interpretation of textual data produced within educational settings.
Thus, this paper aims to contribute to a progression in the field of content analysis by transferring the basic ideas of the item response theory to content analysis and by offering an additional tool for understanding how AI generates new information based on textual data.
In order to reach these objectives, section “Development of the New Inter-coder Reliability Concept” presents the mathematical derivation of the new concept called Iota Reliability Concept. In order to prove if the new concept is really a progression, section “Simulation Study of the New Reliability Concept” presents a simulation study simulating 808,500 coding tasks with a varying number of coders and categories and varying sample sizes. With the help of the simulation, the new measure is compared with percentage agreement which represents the most intuitive measure of inter-coder-reliability, and with Krippendorff’s Alpha which represents the current state of research (Hayes and Krippendorff, 2007; Lovejoy et al., 2016). The simulation is also used to derive rules of thumb for judging the quality of content analysis in practical applications.
Section “Analyzing the Performance and Configuration of Artificial Intelligence” applies both the new and the established measures to real world cases by training three different types of AI to interpret 90 different didactical constructs. The data comprises essays written by students of different degrees and textual material out of textbooks. Training AI utilities mlr3 (Lang et al., 2019) which is the newest framework for machine learning in the statistical coding language R. This provides insights into the performance of AI for educational purposes.
The paper ends with a discussion of the results and provides recommendations for researchers and practitioners. Section “Conclusion” provides an example for the analysis of AI with the new measures in order to demonstrate the potentials of the new concept.
Development of the New Inter-Coder Reliability Concept
Overview
The aim of this new concept is to develop a reliability measure that provides information on every single category. To achieve this goal, we suggest a reliability concept consisting of three elements for every category: the alpha-, beta-, and iota-elements. The concept additionally provides an assignment-error matrix (AEM) offering information on how errors in the different categories influence the data in the others.
Reliability describes the extent of the absence of errors (Schreier, 2012), meaning the basic idea behind the alpha and beta elements is to take two different types of errors into account. These are described from the perspective of every single category. The alpha elements refer to the error of a coding unit being unintentionally assigned to the wrong category, e.g., when a unit is not assigned to A, although it belongs to A. The beta elements consider the error that a coding unit belonging to another category is unintentionally assigned to the category under investigation, e.g., when a unit is assigned to A, although it does not belong there.
This concept is based on six central assumptions:
(1) The core of content analysis is a scheme guiding coders to assign a coding unit to a category. Here, reliability is a property of a coding scheme, not of coders.
(2) The categories form a nominal or ordinal scale with discrete values.
(3) Every coding unit can be assigned to exactly one category.
(4) Every coding unit is assignable to at least one category.
(5) Coders judge the category of a coding unit by using a coding scheme or by guessing.
(6) Reliability can vary for each category.
The following sections systematically introduce the new concept and each of its elements.
Alpha Elements: Alpha Reliability and Alpha Error
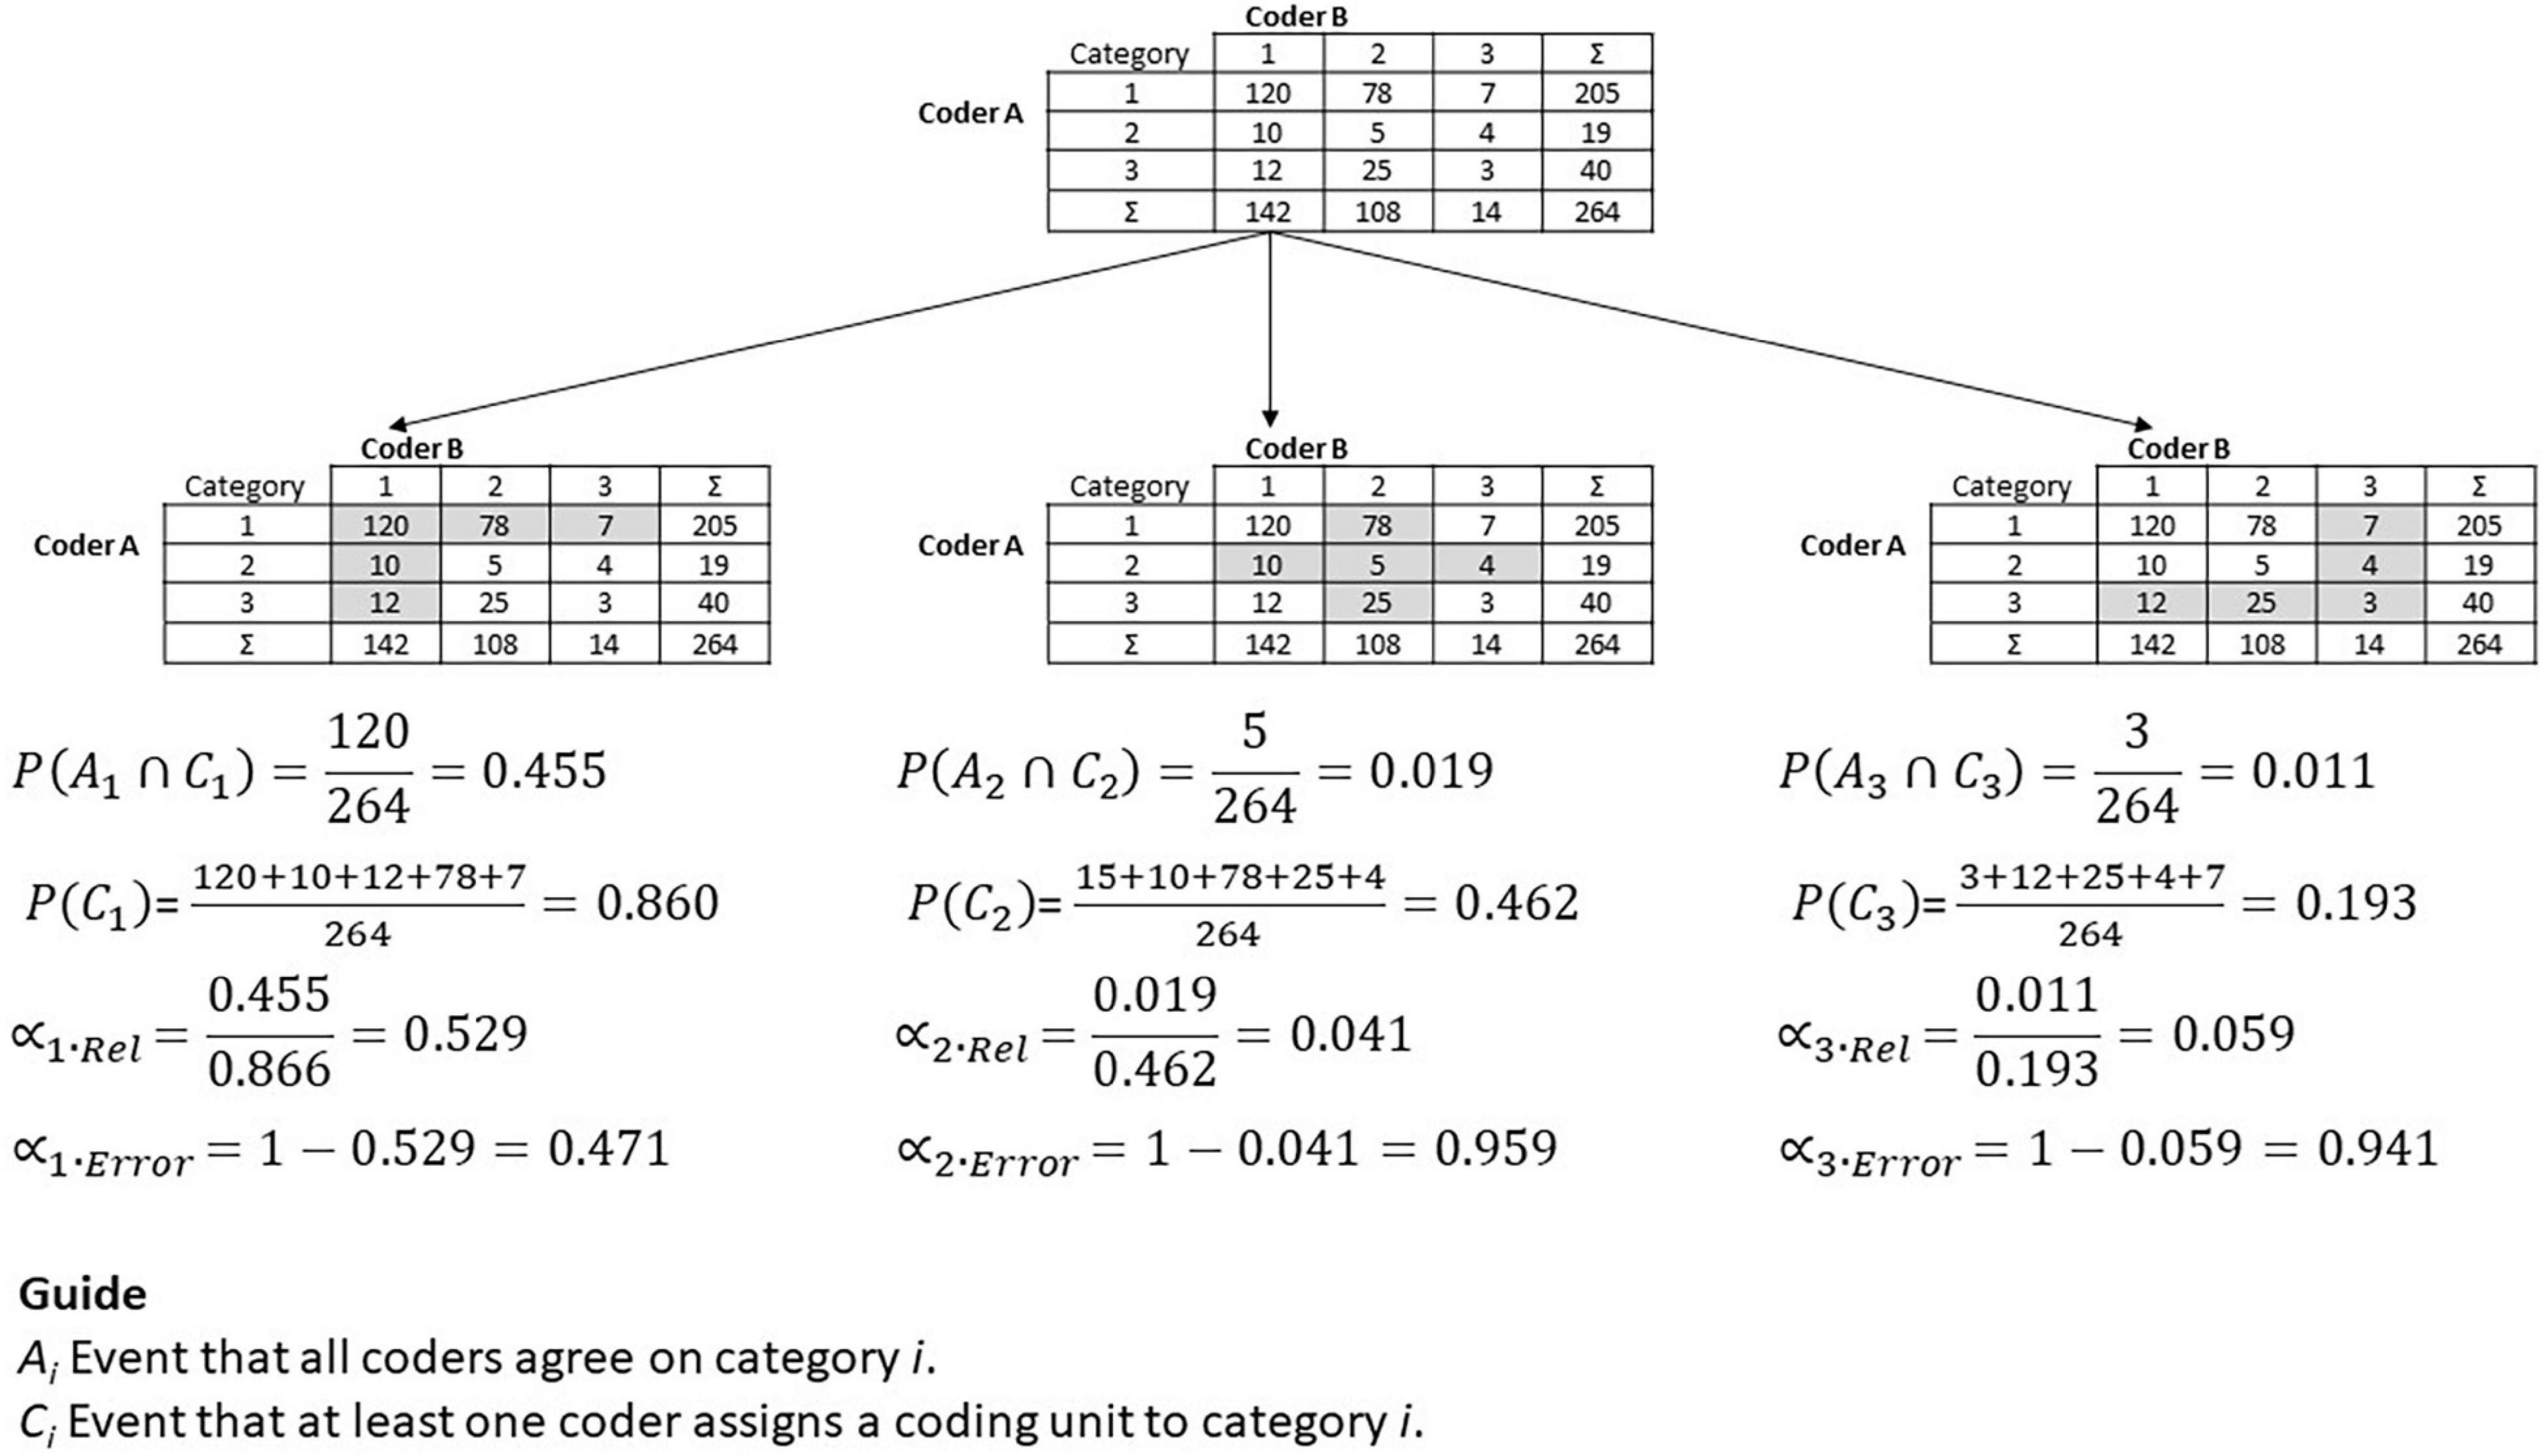
Developing a reliability concept that reflects the reliability of the coding scheme for each single category requires the focus to be shifted from all data to the data that involves the category under investigation. Figure 2 illustrates this idea for the case of two coders and three categories.
The gray cells in the tables show the relevant combinations for the categories. For example, in the table on the left, only the first row and the first column comprise coding judgments that involve category one. In the middle table, the gray cross represents all relevant coding for category two. The third row and the third column in the right table include coding for category three. The diagonal of the table shows all judgments for a category that the two coders agree on. For example, both coders agree that 120 coding units belong to category one, that five units belong to category two, and three coding units belong to category three.
The alpha reliability and the alpha error can be introduced based on this data and category perspective. The alpha reliability uses two basic ideas. First, the number of coding units all coders agree on for a specific category (e.g., 120 for category one, 5 for category two, etc.) represents the agreement of the coders regarding that category. Second, the number of all coding units that involve the specific category (e.g., 12 + 10 + 120 + 78 + 7 for category one) is an approximation of the number of coding units that belong to the specific category. Thus, the ratio of these two numbers describes the extent to which the coders agree on the specific category. Mathematically this idea can be expressed and extended by using conditional probabilities.
The probability of an event A under the condition C is generally described by . Applied to the current concept, we define event Ai as the case that all coders agree on category i. This means that all coders assign a coding unit to the same category. We define condition Ci as the case where at least one coder assigns a coding unit to category i. In Figure 2, event Ai is the corresponding cell on the diagonal, with event Ci reflected by the gray cells for each category. With these definitions in mind, we can define the alpha reliability and the alpha error for category i as
The alpha error is the complementary probability of the alpha reliability. Equations 1 and 2 provide the central interpretation of the alpha elements. The alpha reliability is the probability that all coders agree on the category of a coding unit if at least one coder assigns the coding unit to that category. The alpha error is the probability that not all coders agree on the category of a coding unit if at least one coder assigns the coding unit to that category.
We suggest treating alpha reliability as an approximation of the probability that a coding unit of category i is classified as category i, and the alpha error as the probability that a coding unit of category i is not classified as category i. The reason for this interpretation of the conditional probabilities of the alpha elements is that the true category cannot be known. This interpretation of the alpha elements assumes that the assignment of a coding unit to this category by at least one coder is an adequate approximation for the amount of coding units “truly” belonging to that category. Furthermore, this interpretation of the alpha elements makes them comparable to the alpha errors used in significance testing.
Figure 2 shows the computations for an example where the alpha reliability for category one is 0.529. This means that the probability that a coding unit of category one is correctly classified as category one is about 53%. The same probability is about 4% for category two, and about 6% for category three. Here, a coding unit belonging to category two or three is only rarely classified as category two or three respectively. The alpha error for both of these categories is very high, with a probability of about 94–96%.
The occurrence of an alpha error means that a coding unit is wrongly assigned to another category. In this case, the data of the other categories will be biased as a result of errors in other categories. The beta elements account for these errors.
Beta Elements: Beta Reliability and Beta Error
A category’s data is not only influenced by the alpha error of that category, but by errors in other categories as well. For example, a coding unit could be assigned to category one although it belongs to category two. When this occurs, the data of category one will be biased by errors made in category two. However, this error can only occur if an alpha error occurs in category two, meaning a coding unit truly belonging to category two is wrongly assigned to category one. The same influence can be expected for every other category.
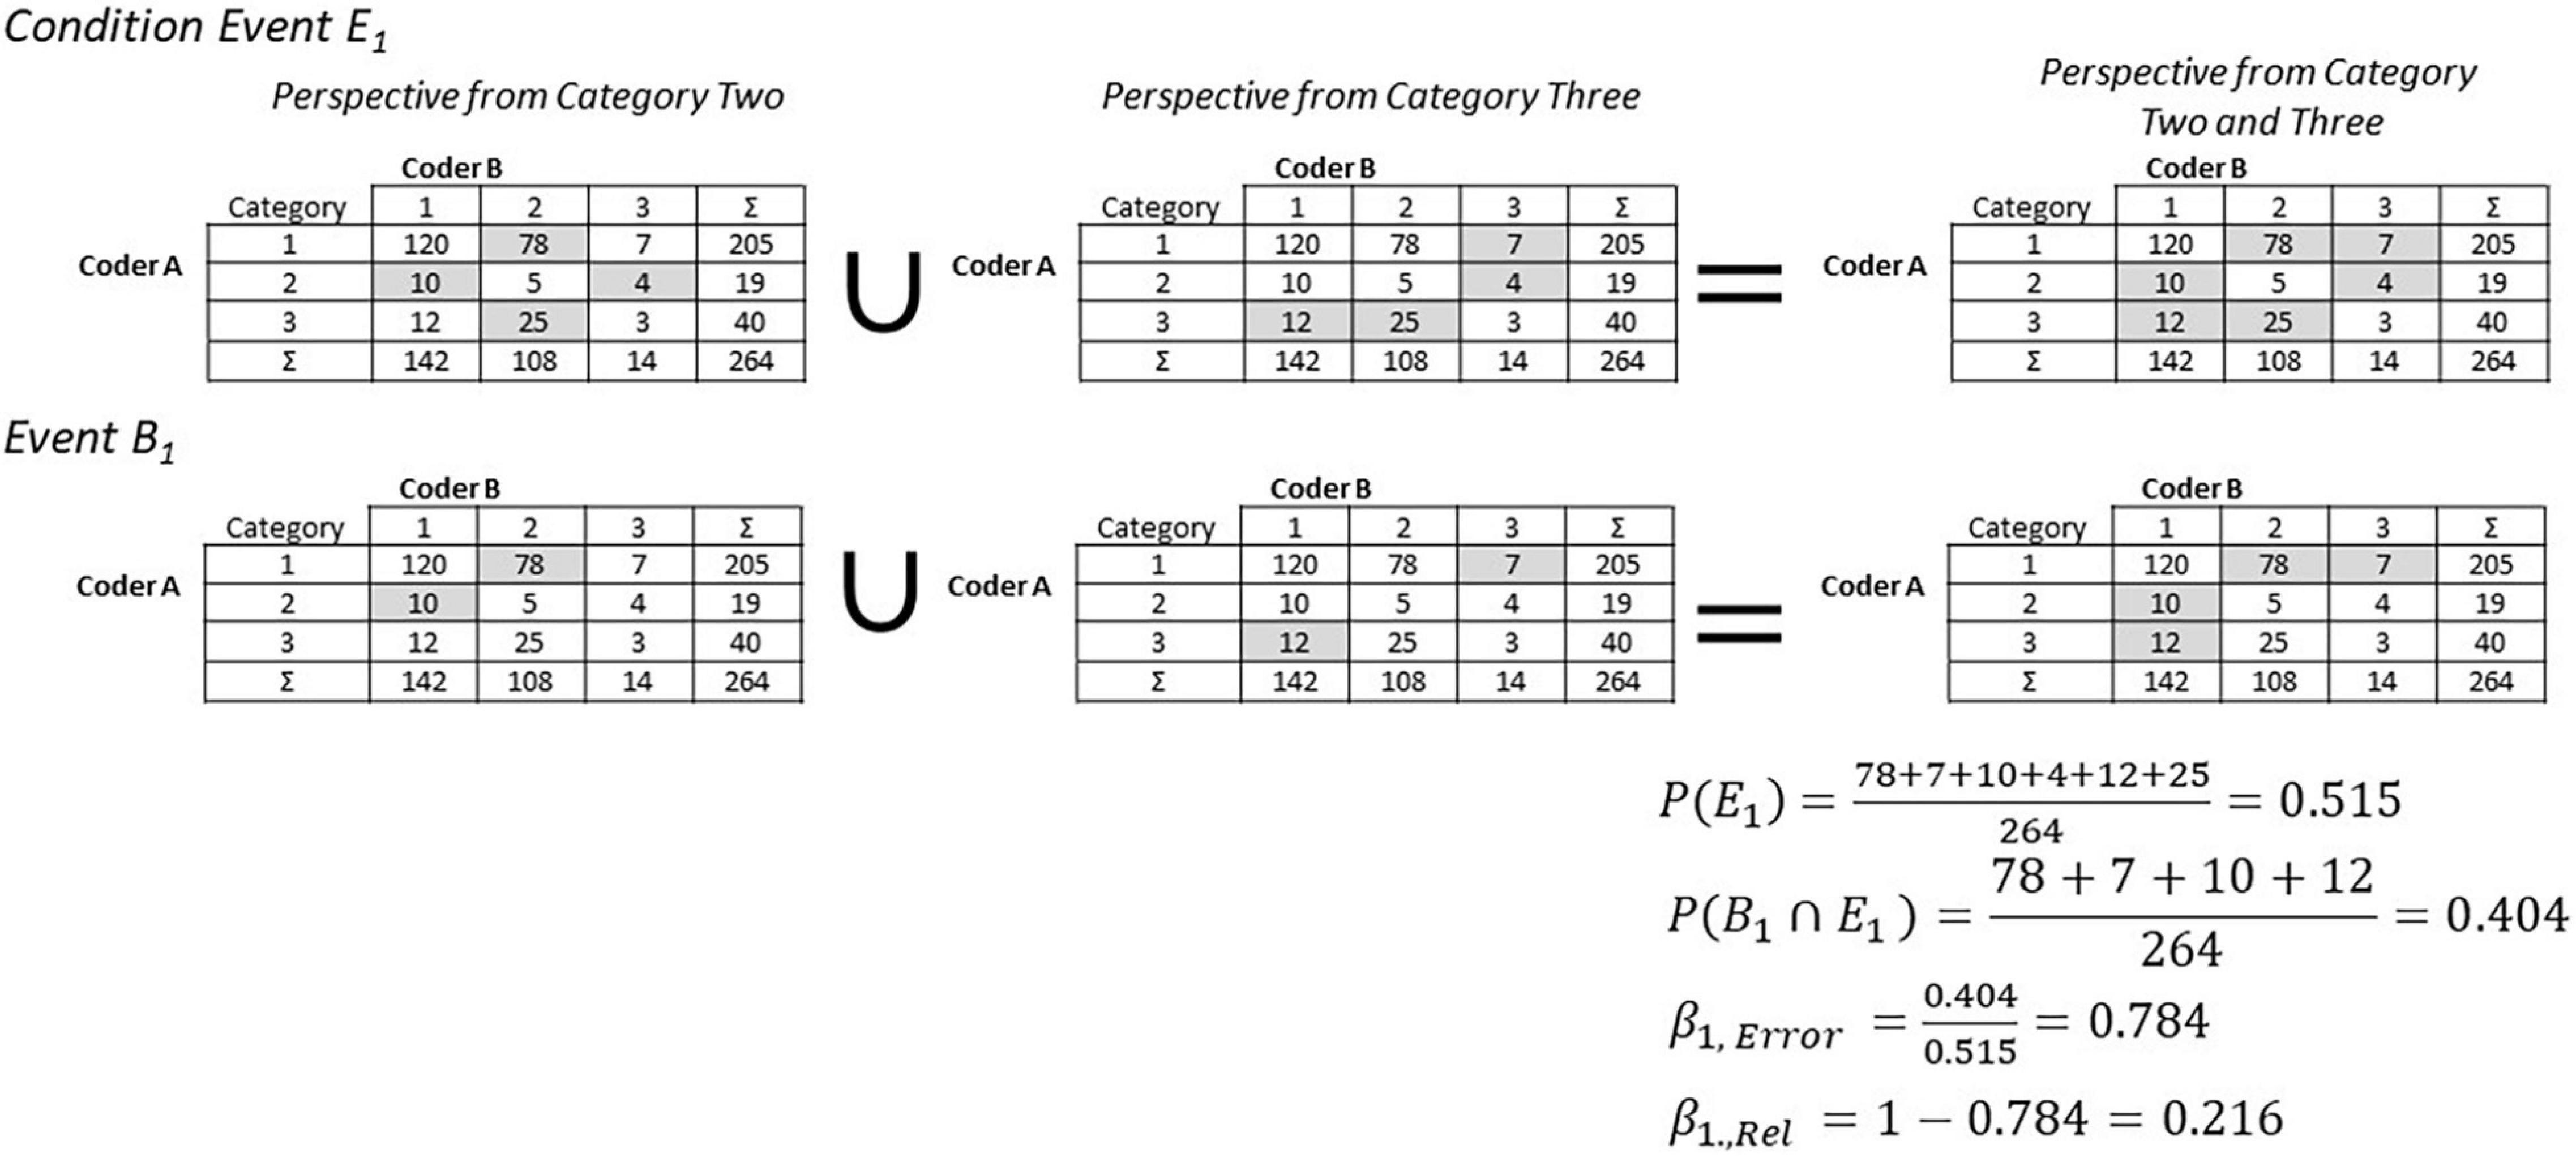
This relationship can be mathematically expressed with conditional probabilities. The event Ej represents all cases where an alpha error of category j occurs. In Figure 3, this is illustrated by the gray cells for category two and three. Alpha errors of all other categories are relevant for estimating the beta error of category one. This situation is illustrated on the right side of Figure 3. The condition here for the beta error of category i is an occurrence of an alpha error in all other categories. In general, event Ei is defined as all cases where an alpha error occurs in all other categories except i.
To be relevant for category one, only those parts of the alpha errors of the other categories are relevant that guide coders to assign a coding unit to category one. This situation is illustrated in the second row of Figure 3. The corresponding event Bi represents all cases where at least one coder assigns a coding unit to category i, without the cases where all coders assign a coding unit to category i. The reason for the exclusion of the cases where all coders assign a coding unit to category i is that these cases do not represent an error. The beta error of category i is therefore defined as:
Mathematical equation 3 can be simplified for computations by applying the concept of contemporary probabilities. As shown in the first row on the right side of Figure 3, P(Ei) can be expressed as the complementary probability of the event that all coders agree on different categories (the diagonal of the table). Furthermore, as shown in the second row on the right side of Figure 3, P(Bi∩Ei) can be expressed by the complementary probability of the event that no coder assigns a coding unit to category i and that all coders assign a coding unit to category i (white cells).
Similar to the alpha elements, the beta reliability is the complementary probability to the beta error, describing the probability that no beta error will occur.
Using the example of Figure 3, the beta error for category one is 0.784. This means that the probability of assigning a coding unit to category one if an alpha error occurs in categories two or three is about 78%. The beta elements and the alpha elements offer the possibility to analyze the influence of errors in greater detail with the help of the assignment-error matrix (AEM).
The Assignment-Error Matrix
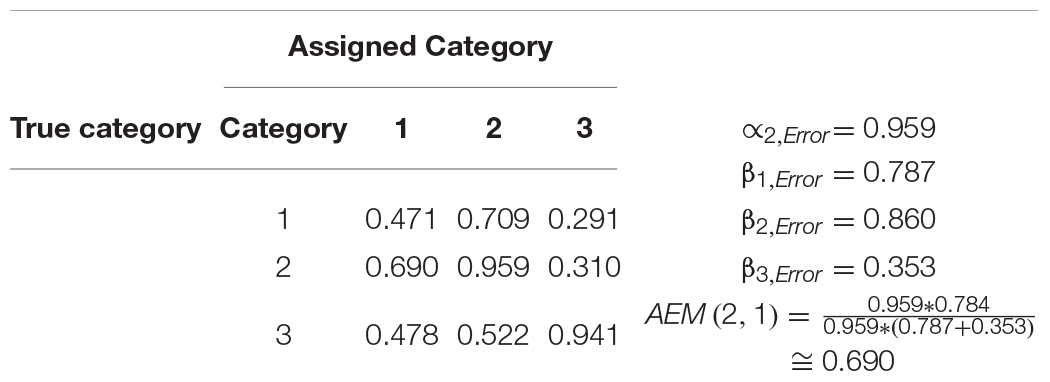
The assignment-error matrix is a tool for analyzing the influence of errors in one category on other categories. The diagonal cells show the alpha error for the specific category. The remaining cells describe the probability that an alpha error guides coders toward assigning a coding unit to another specific category. The interpretation of this matrix can best be explained using the example shown in Table 1. The alpha error for category one is about 47%, i.e., in about 47% of the cases, a coding unit that truly belongs to category one is assigned to another category. When this error occurs, about 71% of the cases are assigned to category two, and about 29% of the cases to category three. Here, category two is more strongly impacted by the coding errors of category one than category three.
The alpha error of category two is about 96%, meaning that in about 96% of the cases, a coding unit truly belonging to category two is assigned to another category. When this error occurs, about 69% of the cases are assigned to category one, and 31% of the cases to category three. Here, category one is more strongly impacted by the coding errors in category two than category three.
The assignment-error matrix provides detailed information about how errors influence the data. With this example, category one and two are not well differentiated, meaning the development of the coding scheme should concentrate on creating better definitions and coding rules for distinguishing category one and two. In contrast, errors in category one and two do not strongly influence category three. If an alpha error occurs in category three, both remaining categories are impacted by this error in a similar way.
The values for the cells outside the diagonal can be easily estimated with the alpha and beta elements. The condition is that an alpha error occurs in the category under investigation, and that a beta error occurs in all other categories. The target event is that an alpha error occurs in the category under investigation, and a beta error in the other respective category. Equation 5 expresses this relationship.
The iota elements comprise the final aspect of this concept.
Iota Elements
The last part of this concept summarizes the different types of errors while correcting the values for chance agreement, providing the final reliability measure for every category. In a first step, the alpha error and the beta error have to be calculated under the condition of guessing. The concept here assumes that every coder randomly chooses a category, and that every category has the same probability of being chosen. The probability for every combination with k categories and c coders is . The equations (1), (2), (3), and (4) introduced in Section “Alpha Elements: Alpha Reliability and Alpha Error” and “Beta Elements: Beta Reliability and Beta Error” can now be applied for the calculation of the corresponding values.
The chance corrected and normalized alpha reliability is
Please note that normalization means here that the values can only range between 0 and 1. Although the definition of αi appears clear, the equation for βi still has to be explained. The beta errors are designed in such a way that they describe how errors influence the data of the category under investigation if errors occur in the other categories. However, they do not provide direct information about the probability of a beta error occurring, meaning that the probability for the condition of the beta errors has to be estimated in a first step. As described in Section “Beta Elements: Beta Reliability and Beta Error,” P(Ei) represents the probability for the condition of beta errors, and can be expressed as the complementary probability of the event that all coders agree on the different categories (the diagonal of the table in Figure 3). For the beta error under the condition of guessing, the corresponding probability is 1−k*p. The realized beta errors with chance correction are shown in Equation 11.
The complementary probability represents the corresponding realized beta reliability as shown in Equation 12. Equation 13 represents the normalized beta reliability.
The utilization of the absolute value for αi und βi is inspired by the chi-square statistic in contingency analysis. The idea behind this approach is that the more a system is behind the observed data, the more data values deviate from a data set generated by random guessing. With this in mind, the final iota is defined as shown in Equation 14.
Ii can be roughly interpreted as the average probability that no error occurs. It is 1 in the case of no error, and 0 if the errors equal the amount of errors expected by guessing.
Iota describes the reliability of every single category. In some situations additional information on the reliability of the complete scale is necessary. In order to aggregate the single iota values, the Iota Concept suggests the average iota and the minimal iota as possible indicators. The average iota represents the mean of all iota values taking all available information into account. This, however, implies the opportunity that the reliability is overestimated as a low reliability in one category can be compensated by a high reliability in other categories. This problem is addressed with the minimum iota using only the information of the category with the lowest reliability.
The following chapter presents the results of a simulation study aiming to generate cut-off values for the new reliability measure, and provides insight into its statistical properties.
Simulation Study of the New Reliability Concept
Simulation Design
A simulation study was conducted with R to provide an answer to the following questions:
(1) How strongly are the reliability values of the new concept correlated with the true reliability of a coding scheme?
(2) How does the distribution of the data influence the reliability values?
(3) How does the number of categories influence the reliability values?
(4) How does the number of coders influence the reliability values?
(5) How does the new measure perform in comparison to other reliability measures?
(6) Which cut-off values should be used for judging the reliability of a coding scheme?
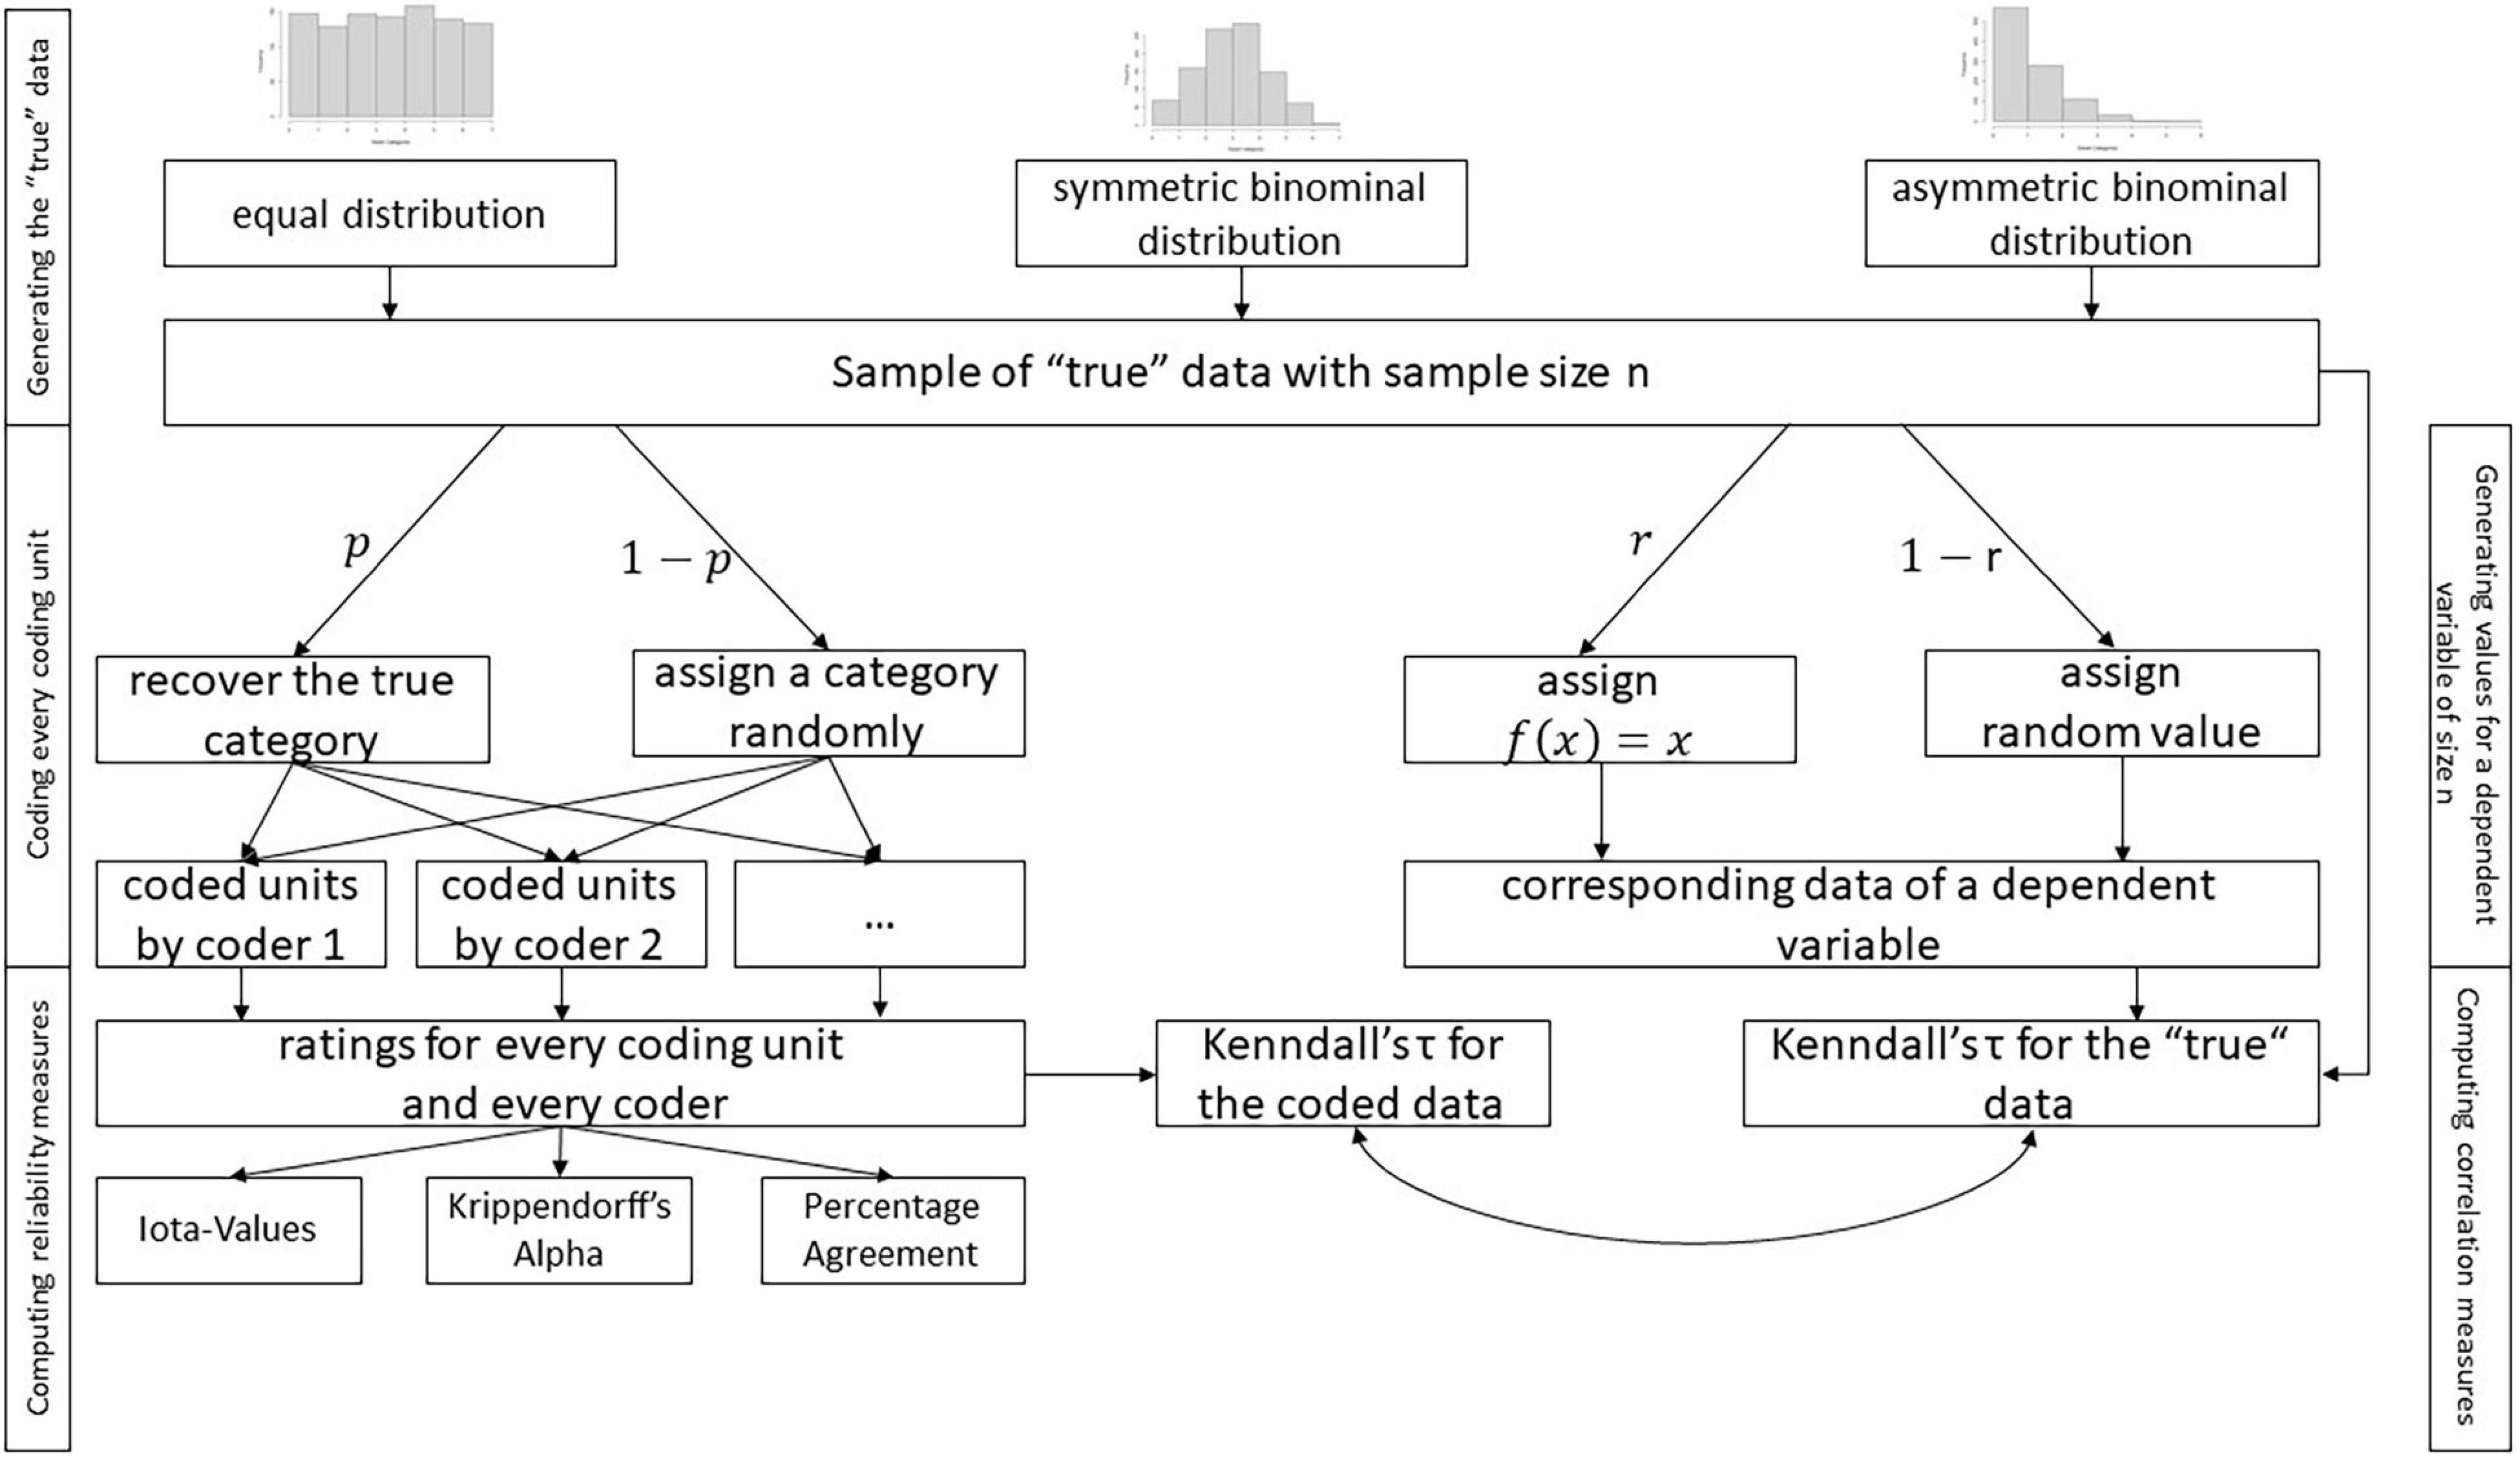
A simulation study was performed to answer these questions. Figure 4 shows the design of the simulation.
The first step generated coding units. For modeling the distribution of the categories of the coding units in the population, an equal distribution (probability for every category 1/k), a symmetric binominal distribution (probability 0.5, size k−1), and an asymmetric binominal distribution (probability 0.2, size k−1) were used. For every distribution, a sample was drawn with different sample sizes n = 10, 20, 30, 40, 50, 100, 250, 500, 1000, 1500. This procedure was repeated 50 times.
The coding process was simulated after generating samples of true data, i.e., every coding unit was coded by a coder who applied a coding scheme. The coding scheme guided a coder to recover the true category with the probability p. If the coder failed, a category was randomly assigned to the coding unit. To simplify the simulation, it was assumed that p was equal for each category. In the case of p = 0, there was no reliability, with a coder randomly assigning a category to a coding unit. The coding fluctuated unsystematically. In the case of p = 0.99, the coding scheme led a coder to assign the same category if the coding unit offered the corresponding indication. The coding systematically provided stable results. The value of p represented the reproducibility of the coding scheme and could be interpreted as true reliability. This process was repeated for different p values ranging from “0” to “0.99” and for every coder.
The coding of every coder provided the basis for computing different reliability measures. The new iota values, Krippendorff’s alpha, and the percentage agreement were applied in the current simulation. Krippendorff’s alpha and percentage agreement provided comparison standards for the new measure. Percentage agreement represented a more liberal measure, and Krippendorff’s alpha a more conservative one (Zhao et al., 2013). The average iota and the minimum iota were computed to generate a measure for the complete coding scheme. The process described above was repeated for up to eight categories and up to eight coders. This simulation helped answer questions 1–5.
A dependent variable was simulated in a similar way to answer question 6. The idea behind this attempt was that the cut-off value for judging the reliability of a coding scheme should consider the effects of further statistical computations and derived decisions. As a result, the correlation of the true data in a sample was compared to the correlation estimated based on the coded data. This attempt allowed the estimation of the expected deviation between the true and the observed correlation for different reliability values. The correlation was measured with Kendall’s tau, which is applicable for ordinal data. As a result, this simulation focused only on ordinal data, using a simple relationship. The strength of the correlation was simulated with the probability r. The corresponding values for tau are outlined in Supplementary Appendix B, and the results are reported in the following sections.
Results of the Simulation Study
Results on the Scale Level
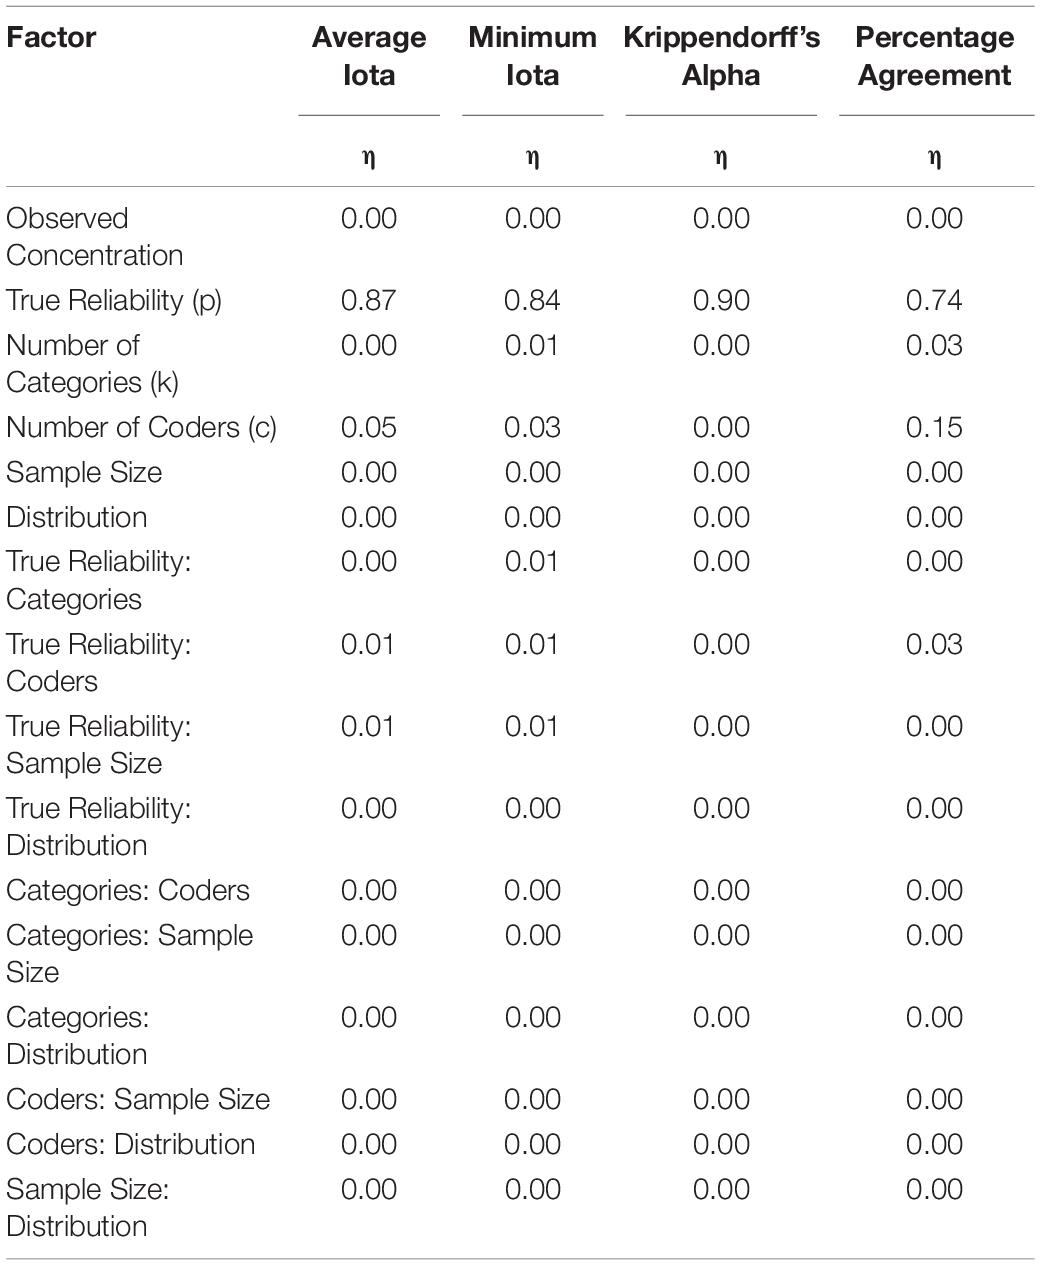
A data set of 808,500 cases was generated. Table 2 shows the results of an ANOVA focusing on the effect sizes. According to Cohen (1988), an η2 of at least 0.01 represents a small effect; of at least 0.06 a medium effect; and of at least 0.14 a strong effect.
About 87–90% of the variance can be explained by the true reliability for the average iota and Krippendorff’s Alpha. The true reliability can explain about 84% of the variance of the minimal iota values. Average iota, minimum iota, and Krippendorff’s alpha show a very strong relationship with the true reliability, and are able to provide an adequate indication of it. In contrast, the true reliability can only account for about 74% of the variance of the percentage agreement; percentage agreement is more problematic than the other measures since it may be influenced by construct irrelevant sources.
Whereas Krippendorff’s alpha is not influenced by any other source of variance (e.g., the number of categories or the number of coders), the number of coders influences average iota. However, this effect is very small, with an η2 of 0.05, making it practically not important. Minimum iota shows a small bias with respect to the number of categories, with an η2 of 0.03, which is also of minimal practical relevance. In contrast, the number of coders heavily influences the reliability estimation by the percentage agreement, with an η2 of 0.15. Thus, the values for percentage agreement are not comparable across coding with a different number of coders.
The simulated distributions, the sample size, and the number of categories do not bias the values of Krippendorff’s alpha, the average iota, and the minimum iota. In contrast, percentage agreement is influenced by the number of categories, but not by the sample size. However, this effect is very small.
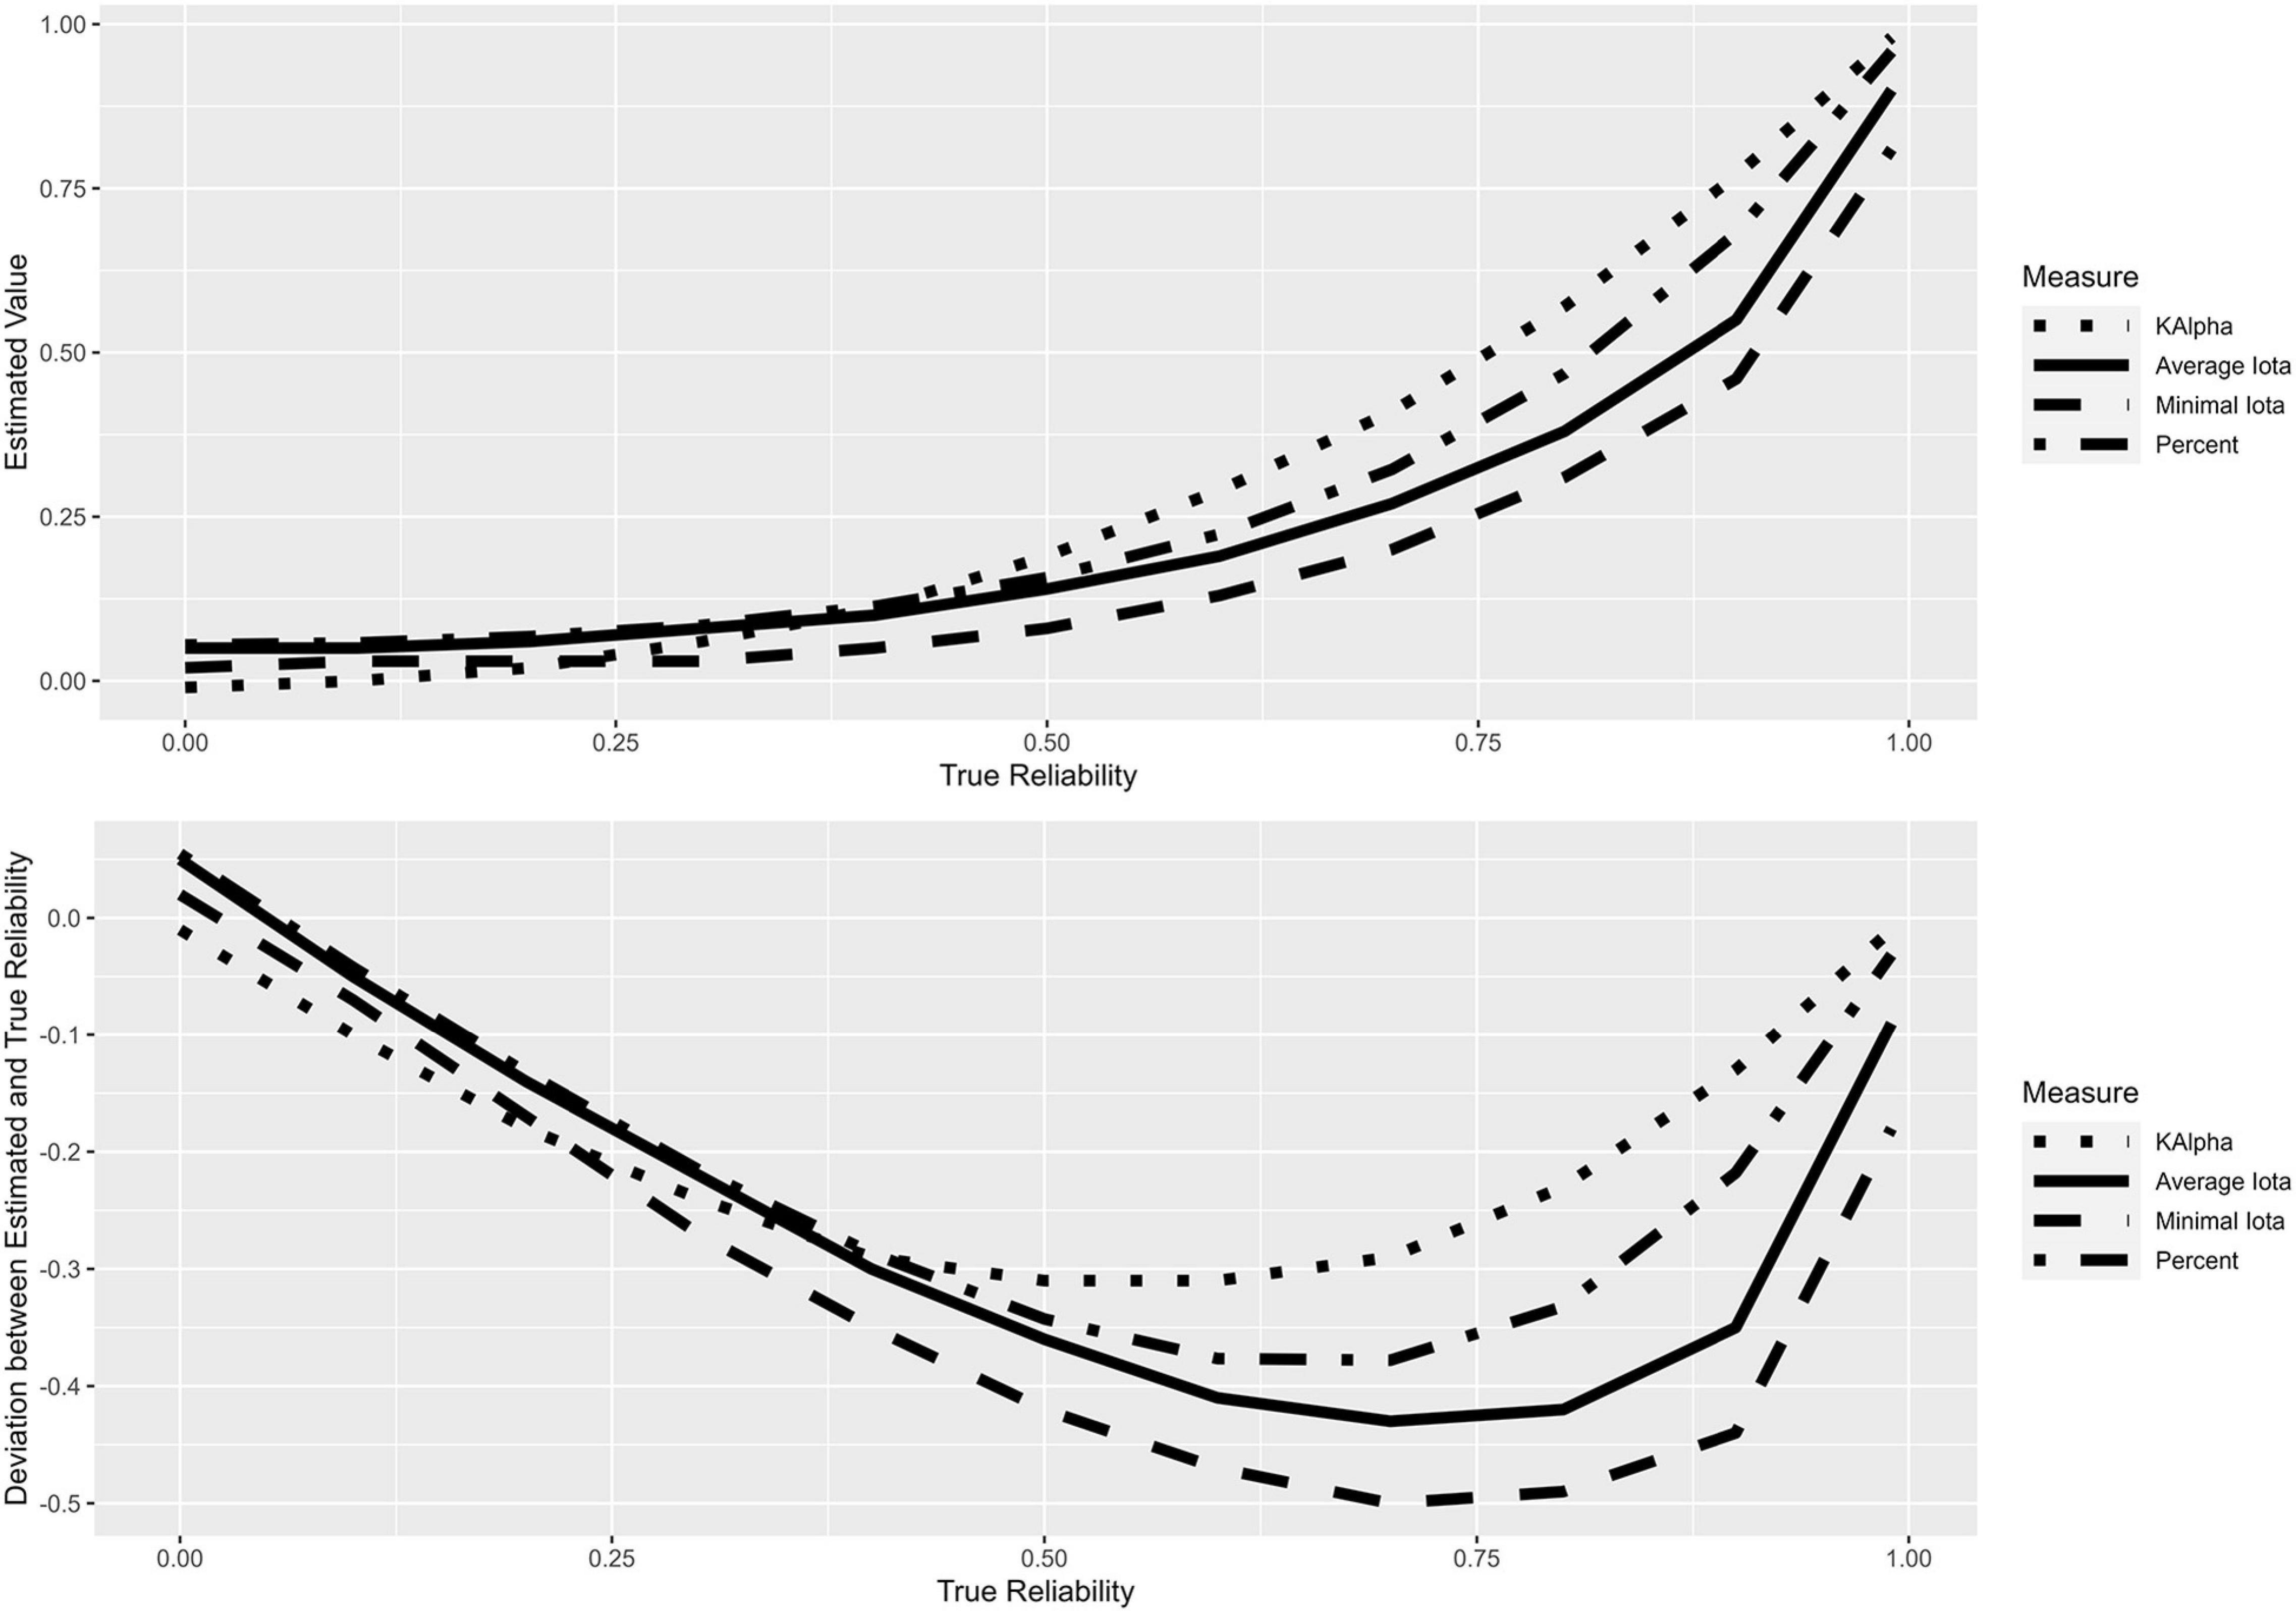
Figure 5 shows the estimated marginal means for the different configurations of the true reliability and the deviation of the estimated values from the true reliability. It becomes clear that no measure stands in a linear relationship with the true reliability; all measures underestimate this. Average iota, minimum iota, and percentage agreement show the highest degree of underestimation near 0.75, while Krippendorff’s alpha shows the maximum deviation near 0.50. In this sense, all measures can be classified as rather conservative.
Polynomial functions from degree one to four are calculated to describe the relationship between the reliability measures and the expected deviation of Kendall’s tau. Table 3 reports the R2 values for the different functions to select an appropriate model.
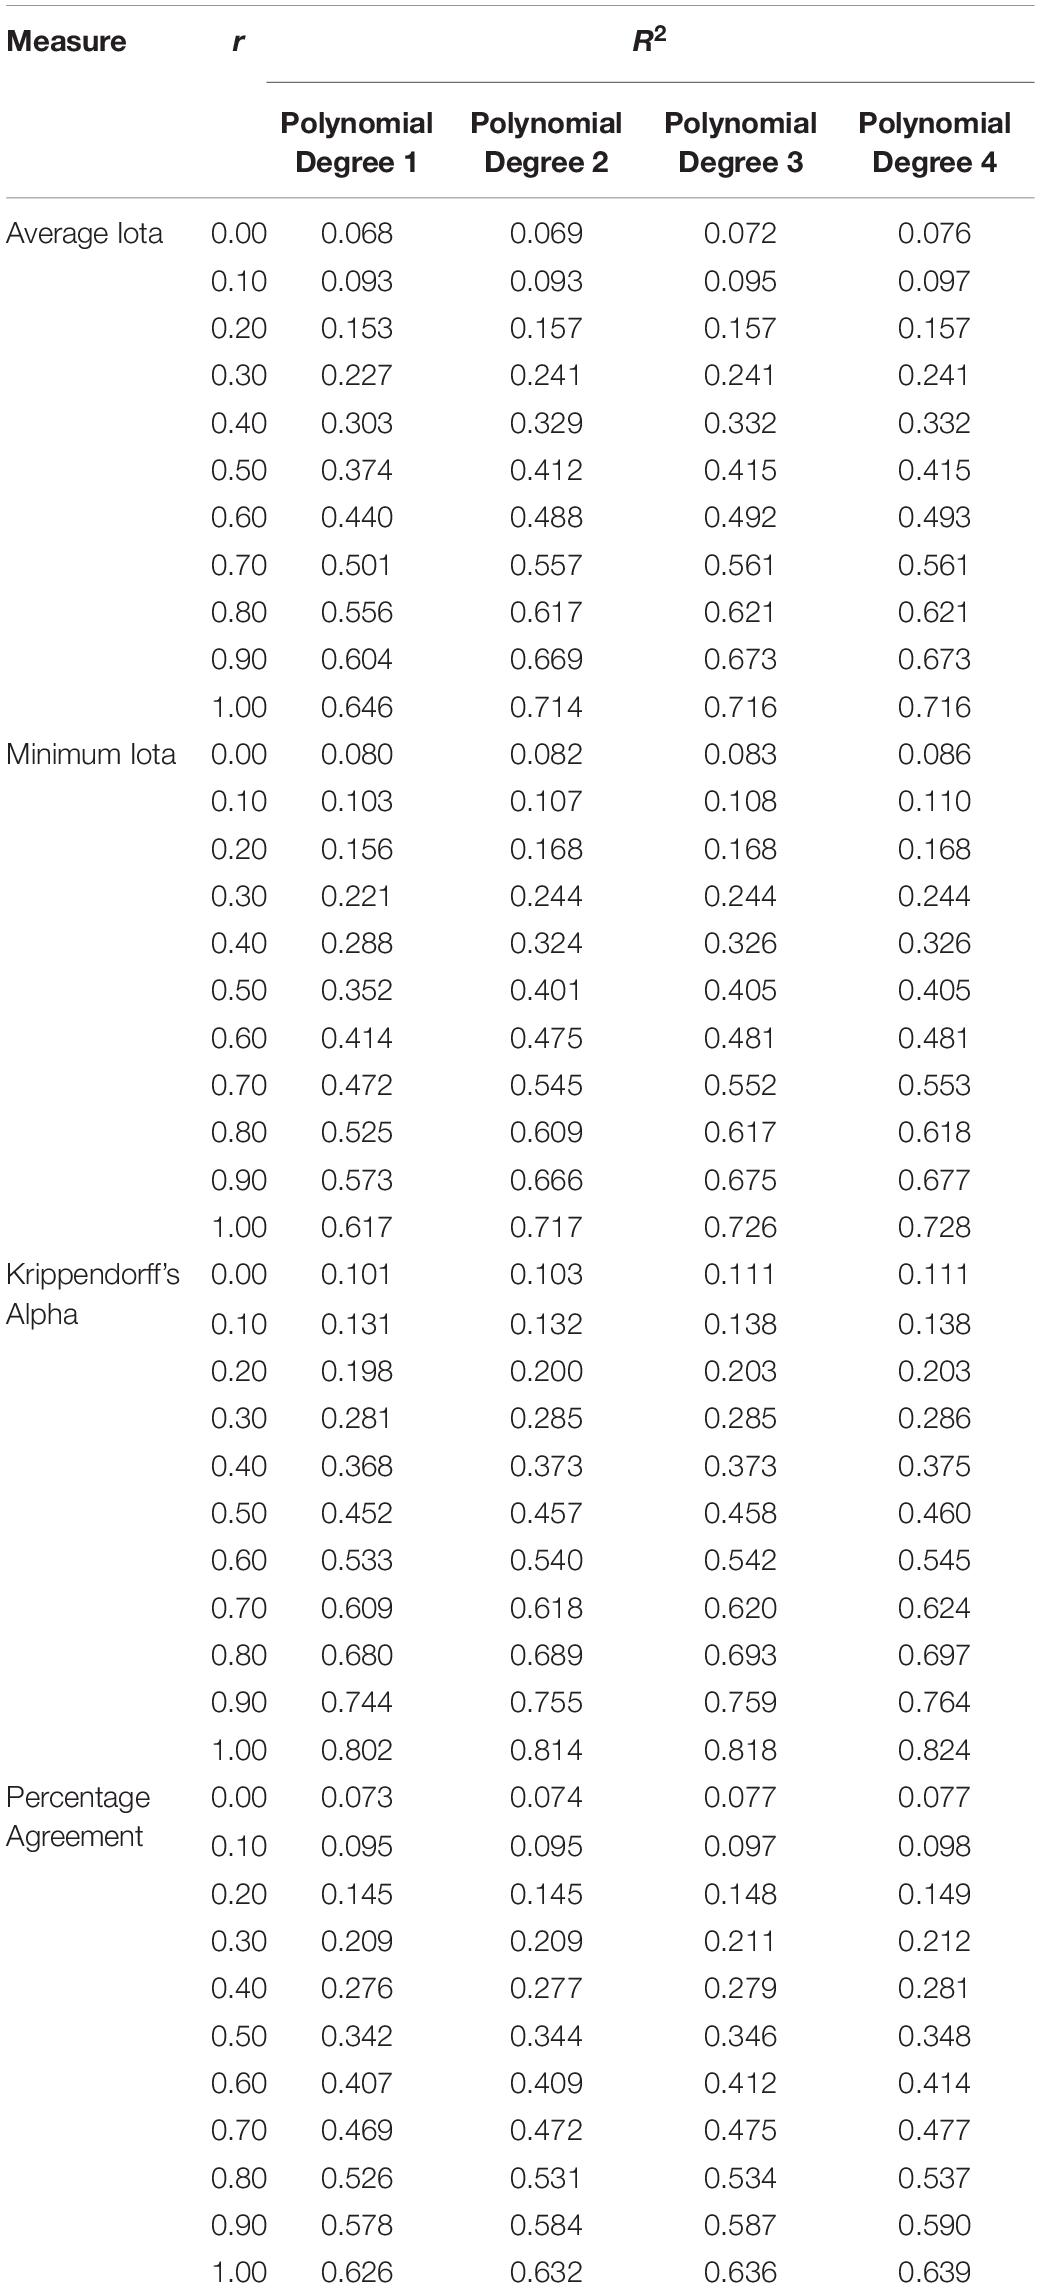
Table 3. Modeling the relationship of different reliability measures and the absolute deviation for Kendall’s tau.
R2 increases when r increases, regardless of which performance measure is under investigation. This means the impact of reliability on the data is more important in situations where a strong relationship exists than in situations where there is only a weak relationship. For the average and minimum iota, a polynomial function of degree two accounts for more variance as a linear function (degree one). However, polynomials of degree three and four do not noticeably improve the R2. The relationship between the iota measures and the deviation can therefore be characterized best with a polynomial of degree two. In contrast, Krippendorff’s alpha and percentage agreement can be best characterized by a linear relationship.
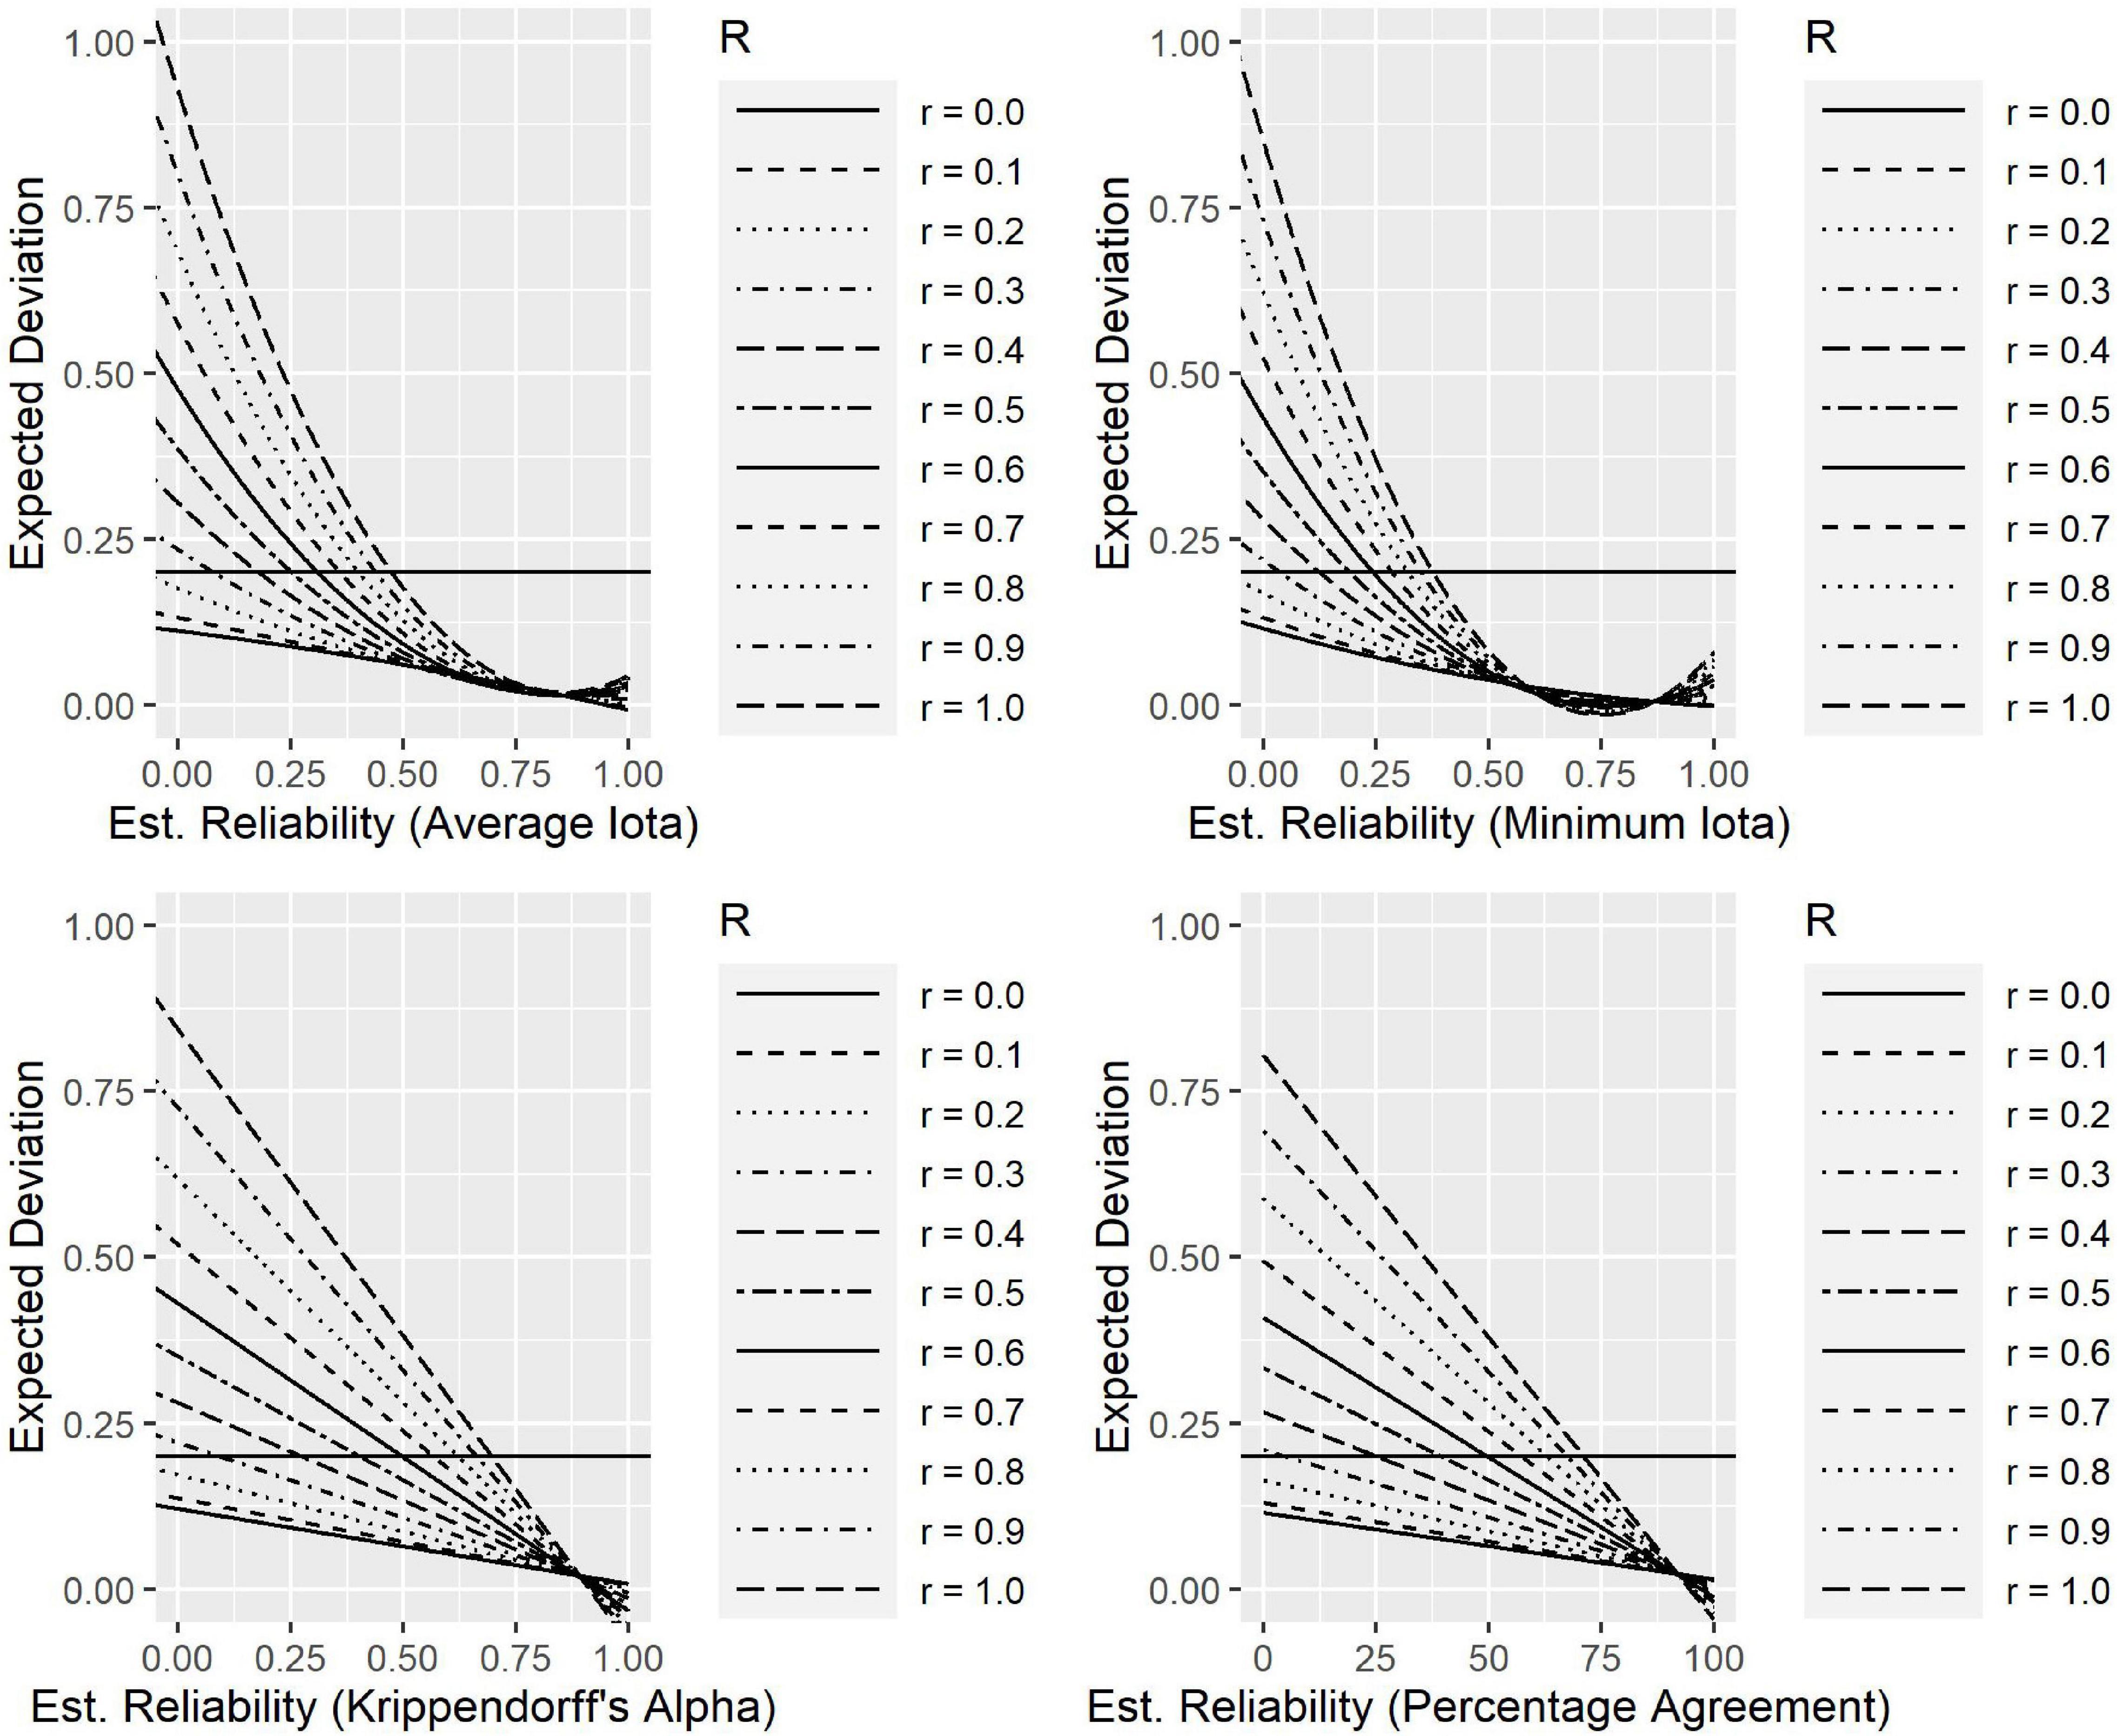
Figure 6 shows the polynomials for the different reliability measures describing the expected deviations from the true correlation within a sample. The horizontal lines in Figure 6 show where the deviation between the estimated expected Kendall’s tau, and the true Kendall’s tau is 0.20. This information can be used to derivate cut-off values for judging the quality of a coding scheme. If a researcher allows an expected deviation of at most 0.20 between the true and the estimated Kendall’s tau, the average iota should be at least 0.474, the minimum iota should be at least 0.377, Krippendorff’s alpha at least 0.697, and percentage agreement at least 0.711. This can be seen by the intersection of the horizontal line for 0.20 and the curve for r = 1.0.
Results on the Categorical Level
An ANOVA was performed to describe the relationship between the true reliability and the estimated iota values on the level of single categories. The effect sizes eta and omega are: true reliability (p): 0.84, number of categories (k): 0.00, number of coders (c): 0.03, true reliability: categories: 0.00, true reliability: coders: 0.01, and categories: coders: 0.00. First, the true reliability is the central source of variance for iota on a categorical level. It explains about 84% of the variance. Iota is thus a strong indicator of the reliability on the categorical level. Only the number of coders slightly influences iota, but according to Cohen (1988), only with a minor effect.
In order to describe the relationship between the true reliability and the caused iota values, several functions are fitted to the data. The function f(x) = x3.861705 reveals a residual standard error of 0.1231 by 3,891,774 degrees of freedom. This function has the advantage that it comprises the extreme points of the scale “zero” and “one,” which is why this function is used for further modeling: it is invertible in the necessary range of values. The inverse function is:
Applying this inverse function on iota will produce linearized iota values which allow an interpretation as probabilities. Based on the new measure, the following chapter analyzes the performance and configuration of AI in the context of business education.
Analyzing the Performance and Configuration of Artificial Intelligence
Simulation Design
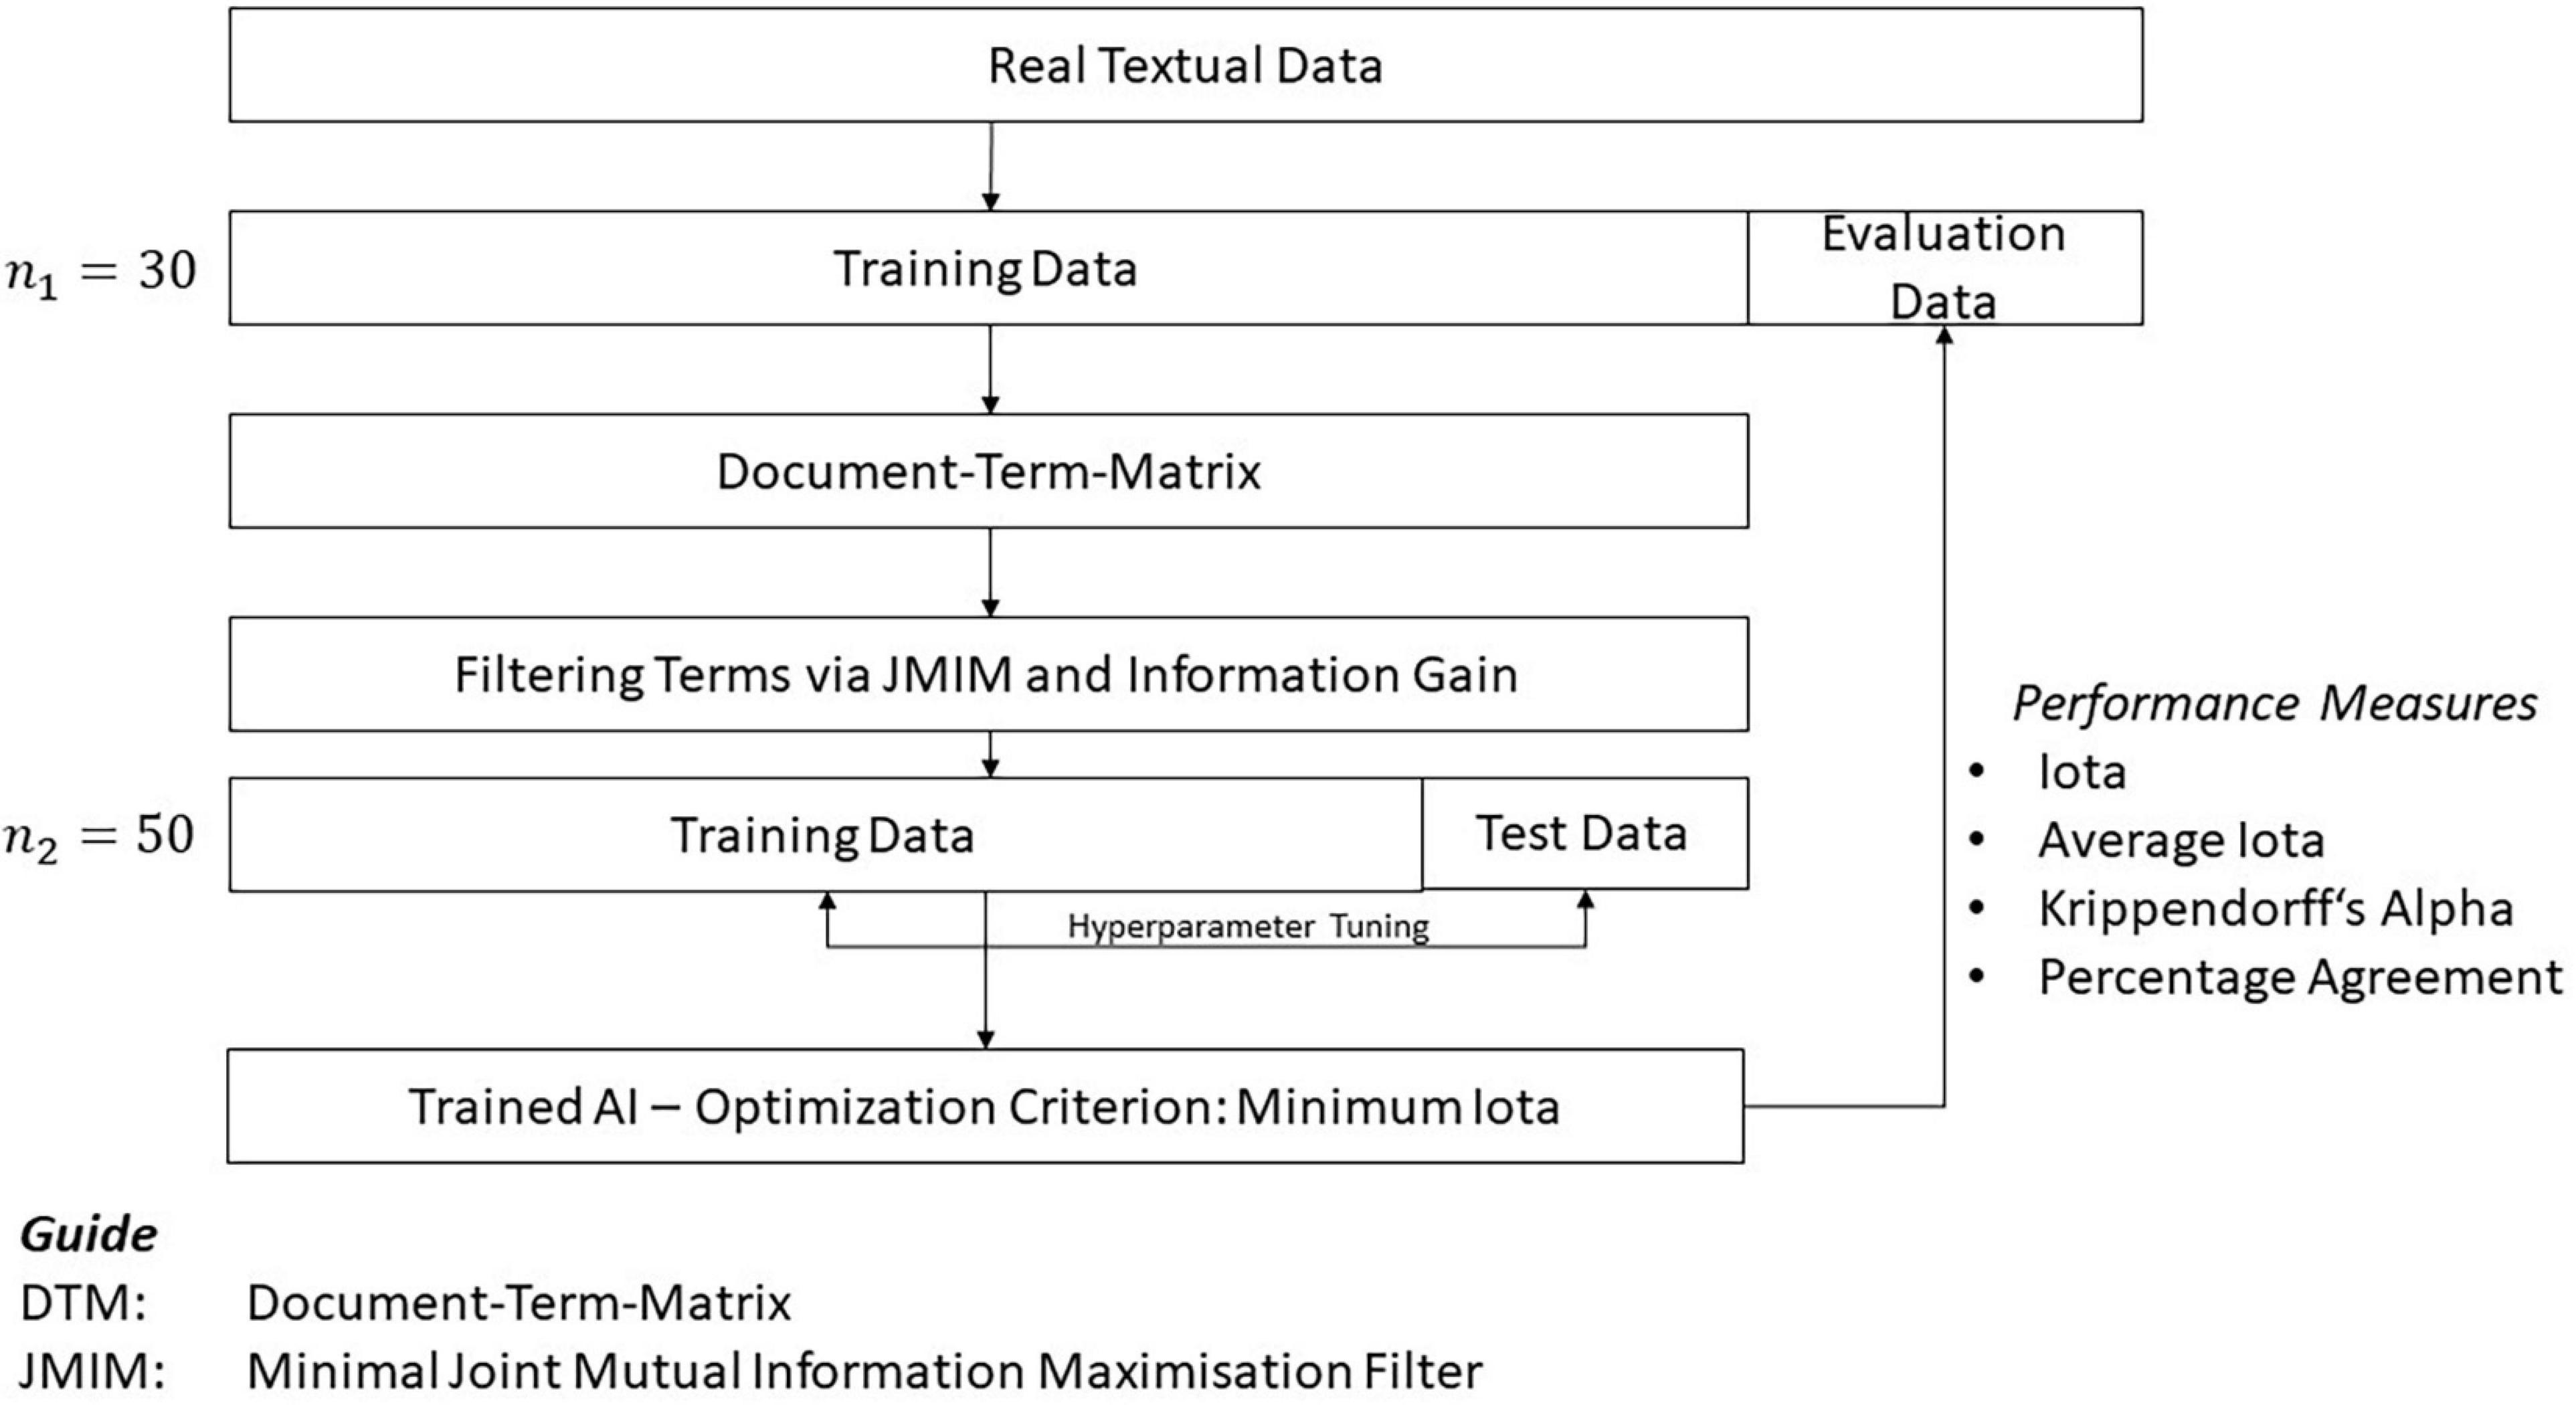
Several algorithms of AI exist to analyze textual data. The current study focuses on decision tree-based algorithms and neural nets; these two kinds of AI show different characteristics. Decision trees are well-suited for classification tasks and have the advantage that the results are understandable for people (Lanquillon, 2019; Richter, 2019). This is a very important feature because the results of a learning analytics application should be understood by students and educators as they foster confidence in the recommendations derived. Understanding the way an AI produces a result is also crucial within a legal context whenever the results provided by the software are used for decisions that potentially have a strong impact on the further education of students. Although neural nets are very powerful concepts of AI, understanding the transformation from input data to output data is more difficult. In the current study, the concept of decision trees is implemented using the packages rpart (Therneau et al., 2019) and ranger (Wright and Ziegler, 2017). To realize neural nets, the study uses the package nnet (Venables and Ripley, 2007). The current study analyzes the performance of these three implementations in an attempt to find hyperparameter configurations optimizing their performance. Figure 7 presents the corresponding research design.
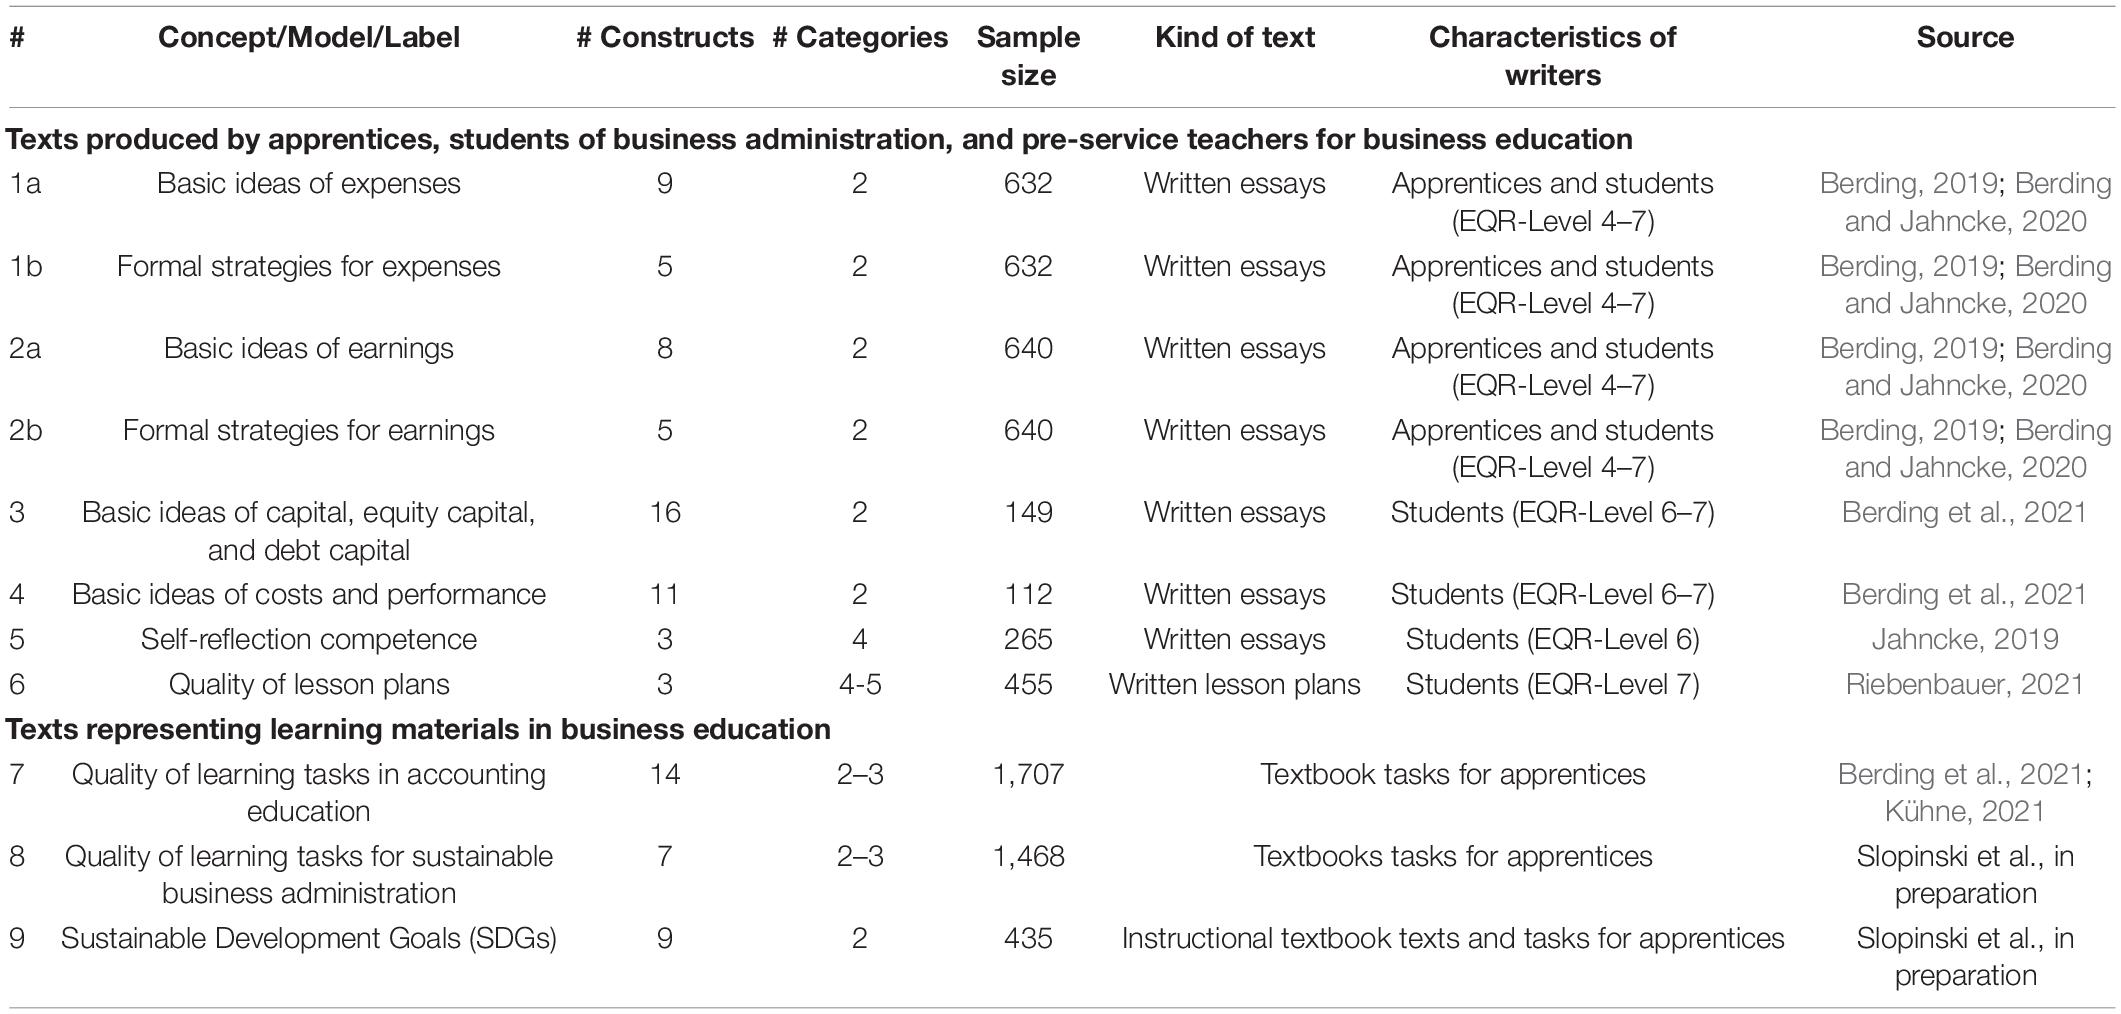
The simulation study is based on real empirical textual data which was analyzed in several studies. Table 4 provides an overview of the different data sets. A detailed list of the inter-coder reliability can be found in Supplementary Appendix A. Every data set is divided into training and evaluation data. 75% of the complete data is used for training, and the remaining data for evaluation. AI performance can be tested here with textual data that is unknown by AI. The iota concept, Krippendorff’s Alpha, and percentage agreement are used for performance evaluation. Data splitting is repeated 30 times by applying stratified custom sampling.
A numerical representation of the texts was created based on the training data of a sample. Here, the texts were transformed into a document-term matrix (DTM) showing the documents in the rows and the frequency of the words in the columns (bag-of-words approach). This was done by applying the package quanteda (Benoit et al., 2018). The words were reduced to nouns, verbs, adjectives, and adverbs, helping reduce the dimension of the DTM, and limiting the analysis to the words carrying the most semantic meaning (Papilloud and Hinneburg, 2018). The words were also lemmatized. These steps were performed with UDPipe (Straka and Straková, 2017; Wijffels et al., 2019), using the HDT-UD 2.5 created by Borges Völker et al. (2019).
In a next step, the words were filtered with the two approaches of joint mutual information maximization (JMIM) (Bennasar et al., 2015) and information gain, each provided by the praznik package (Kursa, 2021). With the help of these filters, the number of words was reduced to 5, 10, 15, 20, and 25% of the initial number. This step was very important for neural nets in light of how they typically have the curse of dimensionality.
The training of the different forms of AI was conducted based on the filtered DTM. The data was here again divided into training data and test data to perform hyperparameter tuning, with the aim to find the best configuration for the different algorithms. The hyperparameter tuning used 50 custom samples of training and test data. 75% of the data was for training, and the remaining part for testing. The hyperparameter tuning was done with random search (Bergstra and Bengio, 2012) because it was not clear which hyperparameters were the most important for analyzing didactical and pedagogical texts. Table 5 reports the standard configuration and the search space for the different parameters. A description of the meaning of the different parameters can be found in the documentation of the applied R packages.
A central problem for most algorithms of AI is that they achieve good performance for categories with a high frequency, and low performance for categories with a low frequency (Haixiang et al., 2017). This is problematic in the context of learning analytics, because extreme characteristics of relevant learning concepts imply individualized learning processes, even though these extreme characteristics usually have a low frequency. For example, underachievers and overachievers need individual learning processes to fully develop their potential. However, this requires a reliable diagnosis of characteristics. Different approaches exist to solve this problem of imbalanced data. The current study applied an oversampling strategy where artificial data sets were generated to balance the frequencies of the different categories. According to Haixiang et al. (2017), this approach should be used if the frequencies of some categories are very small and can be implemented using the synthetic minority oversampling technique (SMOTE). The relevant parameters for SOMTE were also added to the hyperparameter tuning. All computations were done with the mlr3 interface (Lang et al., 2019). The following section reports the results.
Results
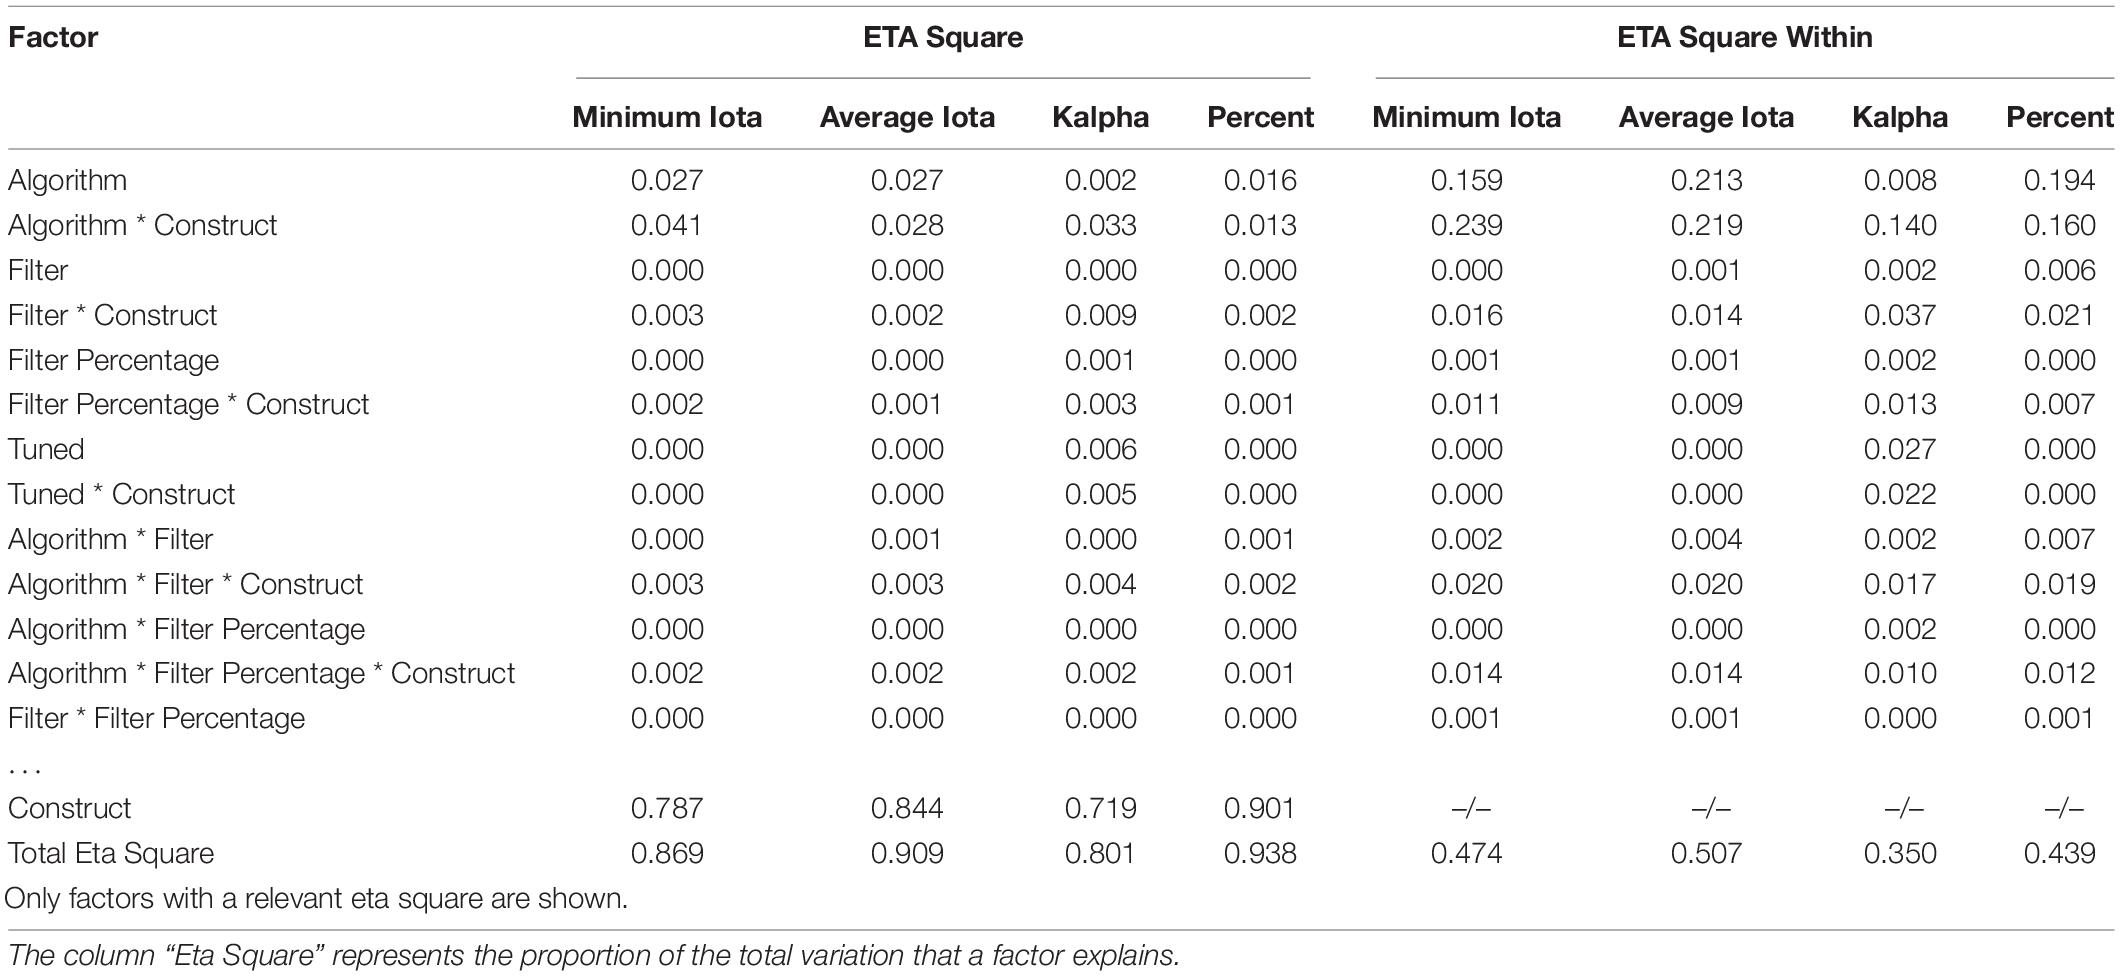
An ANOVA was performed using the SPSS software to generate first insights. Table 6 reports the effect sizes for the different factors. A detailed list of the achieved performance measures for every construct can be found in Supplementary Appendix A.
About 90% of the variation in the percentage agreement and the average iota is explained by the factors shown in Table 6. In contrast, the investigated configuration explains about 87% of the variation of minimum iota, and only 78% of Krippendorff’s Alpha. In each case, it depends on the operationalization of the construct under investigation, as this is the most important factor for explaining the performance of AI. The construct explains at least 72% of the total variation. Thus, the configuration of AI only slightly affects its performance. The AI configuration explains between 3.6% of the total variation of the percentage agreement, and up to 7.8% of the minimum iota.
Surprisingly, the operationalization of a construct is more important for the percentage agreement and the average iota than for the minimum iota and Krippendorff’s Alpha. Krippendorff’s Alpha is the least influenced by the constructs under investigation. In this context, operationalization means the quality of how a construct is defined and described in the coding scheme of a content analysis.
Shifting the focus from the total variation to the variation within a construct (“ETA Square Within”), there is a clear impact of the algorithm on determining AI. The main effect of the algorithm varies from 1% for Krippendorff’s Alpha to 21% for average iota. In some cases, the interaction between the construct and the algorithm is more important than the main effect. For example, the interaction explains about 24% of the within variation for minimum iota, while the main effect explains only 16%. The other configurations are less important. Again, Krippendorff’s Alpha is least influenced by the different options for the configuration of AI.
A three-level structural equation model was computed with MPlus 8.6 using the Bayes estimation to generate more detailed insights into the configuration of AI. In the current case, a multi-level modeling approach is more appropriate because the generated data is nested within construct and sample selections (see Figure 7). As Wang and Wang (2020) summarize, Bayes estimation has many advantages. The most important ones are that models can include both categorical and continuous data, that estimation of complex models is possible, and that this kind of estimation prevents problematic solutions (e.g., negative residual variances). Table 8 reports these findings.
As the values for R2 indicate, the hyperparameter tuning does not explain much of the variation of the different performance measures. In most cases, the application of the filter method “information gain” leads to decreased performance values, meaning that JMIM is the superior filter method. Regarding the number of features included in the training, most coefficients are negative. This means that including a smaller number of words leads to an increased performance for all three algorithms. The following section discusses the approach, results, and implications.
Discussion
Learning analytics is an emerging technology that supports stakeholders in the improvement of learning and teaching (Larusson and White, 2014; Rienties et al., 2020). The current state of that technology uses data from different sources providing valuable knowledge and recommendations (Ifenthaler and Widanapathirana, 2014; Liu et al., 2018; ElSayed et al., 2019). However, the currently used kinds of data only represent students’ learning actions on a surface-level and provide only a limited insight into students’ cognition and motivation (Reich, 2015). Textual data can close this gap and further increase the value of learning analytics for learning and teaching by providing a deeper insight into students’ knowledge, concepts, attitudes, and beliefs.
Realizing this potential requires the application of AI, since learning analytics applications have to understand and to interpret textual data in order to generate valuable knowledge based on scientific models and theories (Wong et al., 2019; Luan et al., 2020). In other words, AI has to conduct parts of a content analysis with a sufficient accuracy as the interpretation leads to corresponding interventions and recommendations. This paper has developed an original contribution to the field of content analysis and its application with AI in several forms:
(1) Previous measures often used in content analysis such as Krippendorff’s Alpha, percentage agreement, Scott’s Pi, and Cohen’s Kappa (Lovejoy et al., 2016) are based on the basic ideas of classical test theory and describe the reliability of a scale with one single numeric value assuming that the reliability is constant for the complete scale (Feng and Zhao, 2016). The Iota Concept is based on the basic ideas of modern test theory (de Ayala, 2009; Baker and Kim, 2017; Bonifay, 2020; Paek and Cole, 2020) and provides a measure for every category and for the complete scale allowing a deeper insight into the quality of content analysis. Furthermore, the new Iota Concept provides a gate to apply other tools developed in item response theory for content analysis (see theoretical implications for more details).
(2) The previous measures are based on problematic assumptions as Zhao et al. (2013) worked out. The Iota Concept avoids these problematic assumptions since it is based completely on the mathematical concept of conditional probabilities which allows a clear interpretation. Of course, the basic assumptions have to be discussed in further research. For example, the current version of iota assumes complete randomness as a kind of random selection with repetition. This could be problematic as complete randomness does not occur in practice (Zhao et al., 2013). However, the Iota Concept provides other measures that do not make a chance correction and thus avoid this problematic assumption. Thus, false conclusions can be avoided with the help of the new concept.
(3) Besides contributions to a progression in the field of content analysis, the current study offers insights in how well AI can interpret textual data from educational contexts and how the judgment of the quality depends on the chosen measure of reliability (see theoretical implications for more details). For practical applications this paper offers suggestions for the optimal configuration of AI that save researchers and users of AI both time and costs (see practical implications for more details).
(4) The Iota Concept can be used to evaluate possible bias in the recommendations of AI-supported learning technologies. Thus, this concept contributes to fill a gap identified by Luan et al. (2020). They determined that AI can reproduce bias and disadvantages minorities. With the help of the assignment-error-matrix these systematic errors can be discovered (see theoretical implication for an example).
In comparison to Krippendorff’s Alpha, the new iota concept captures a similar amount of true reliability (84 and 87% in comparison to 90%) on a scale level. The main advantage of this new concept is that it provides reliability estimates for every single category. Here, iota is determined to be 84% of the true reliability. Similar to Krippendorff’s Alpha, iota is not biased by the number of coders, the number of categories, the distribution of the data, or the sample size. As a consequence, it can be considered an adequate performance measure for inter-coder reliability.
Another advantage is that this new measure is based on less problematic assumptions (for details, see Zhao et al., 2013). Although the equations for αi, αi,Rel, βi, and βi,Rel appear similar to equations 3 and 6 in Zhao et al. (2013), the definition of its components is different. For example, αi,Rel compares the number of units where all coders agree on with the number of all units of that category. This conceptualization prevents paradox 3 of “comparing apples with oranges” (Zhao et al., 2013). In the current study, only a few cases show results that can be clearly described as paradox, as Supplementary Appendix A shows. For example, the construct “validate” of the content analysis of tasks in accounting textbooks achieves a Krippendorff’s Alpha near zero, and a percentage agreement of about 99%. The reliability estimates of every single category with iota show that both categories are measured reliably.
Surprisingly, Krippendorff’s Alpha is the least influenced by the different constructs (72%), whereas percentage agreement is most influenced (90%) by them. Average iota and minimum iota land in between. Intuitively, a strong influence of the constructs should be seen as a good characteristic of a reliability measure, as it reflects how sensitive the measure is for the operationalization of the constructs. The same results occur for the within-subject factors. The different configurations can explain about 35% of the within-subject variation for Krippendorff’s Alpha, and between 44 and 51% for the remaining measures. As the different configurations lead to different predictions of AI, a performance measure should be sensitive to the configuration. The new iota concept as a result can help to understand how different configurations of AI affect data.
The simulation study also provides first insights into meaningful cut-off values for different measures. By applying Figure 6, researchers can determine which amount of reliability is at least necessary for their study: Figure 6 provides an estimation of the expected deviation between the true and the estimated sample correlation. If a researcher is interested in accurate results, the necessary reliability value can be defined. For example, the results of this simulation study show that the proposed cut-off value for Krippendorff’s Alpha of at least 0.67 results in an expected deviation of 0.225, and the recommended cut-off value of 0.800 leads to an expected deviation of 0.105 (Krippendorff, 2019). Cohen (1988) does not explicitly develop effect sizes for Kendall’s tau, although he does describe a classification system where the impact of correlations changes every 0.20 units (lower 0.10: no practical relevant effect, 0.10 to lower 0.30: small effect, 0.30 to lower 0.50: medium effect, 0.50 and above: strong effect). An Alpha of at least 0.67 ensures that the deviation has only a small practical effect; and of at least 0.800, no practical effect. Similar results can be derived accordingly for the other measures, as shown in Table 9.
The performance of AI can be discussed based on the cut-off values for the different reliability measures. Based on Supplementary Appendix A, Table 9 reports the number of constructs that reach the different cut-off values.
According to Table 9, only 9–13 out of 90 constructs reach the minimal level for Krippendorff’s Alpha. The recommended reliability level is only reached by two constructs. In contrast, between 73 and 79 out of 90 constructs achieve the cut-off values according to the percentage agreement. The evaluation of the AI performance for content analysis therefore largely depends on the chosen reliability measure. This finding is in line with the results generated by Hove et al. (2018) who found that different measures produce different numeric values for the same data.
As shown in this study, iota recovers an amount of reliability similar to Krippendorff’s Alpha, is not practically influenced by other sources of variance, and relies on less problematic assumptions. The results of the new measure therefore appear more valid. According to average iota, between 64 and 70 constructs, and according to minimum iota, between 65 and 73 constructs achieve the minimal reliability requirements. In particular, minimum iota ensures that every single category is measured with a minimum degree of reliability. Based on this measure, AI can provide useful information about students’ learning by analyzing textual data. The following section derives theoretical and practical implications of these findings.
Conclusion
Theoretical Implications
The Iota Concept provides a first step in the application of item response theory concepts to content analysis by providing a reliability measure for each category. Further research can build upon this approach and transfer further analytical tools to content analysis. From the different measures provided by the Iota Concept the assignment-error-matrix seems to be very promising. This matrix describes how coding units belonging to different true categories are assigned by coders to a specific category. Thus, this matrix represents how the data is generated.
Since the assignment-error-matrix characterizes the functionality of a coding scheme it can be used in the context of learning analytics to characterize if a content analysis produces similar data for different groups of people. In item response theory this problem is describes with the term “subgroup invariance” (e.g., Baker and Kim, 2017). Further research can address this idea for content analysis by developing corresponding significance tests.
As Seufert et al. (2021) found, at least two challenges occur when using AI for educational purposes. Firstly, AI may become so complex that humans are unable to understand the results generated. Secondly, AI may reproduce a bias which is part of a data set. As a result of these challenges, AI-literacy – defined as a “set of competencies that enables individuals to critically evaluate AI technologies; communicate and collaborate effectively with AI; and use AI as a tool online, at home, and in the workplace [italic in the original]” (Long and Magerko, 2020) – includes the ability to understand how AI processes data and generates implications (Long and Magerko, 2020). The assignment-error-matrix can address both challenges since this matrix describes the data generation process. This idea can be illustrated with the following example based on the dataset from Berding and Jahncke (2020).
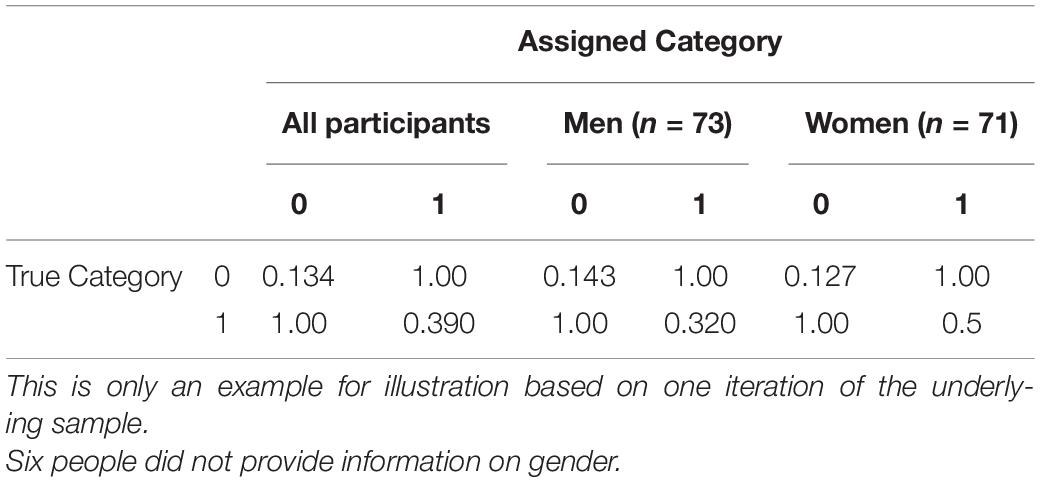
The dataset comprises 450 essays written by apprentices of business education. The corresponding coding scheme includes a scale for assessing whether the students acquired the concept that “expense” in accounting means that values are used for creating products and services, or not. After training an AI with the data from 300 participants, AI should assign the categories for the remaining 150 students. Based on these coding and the coding of a human coder, Table 7 reports the resulting assignment-error-matrix.
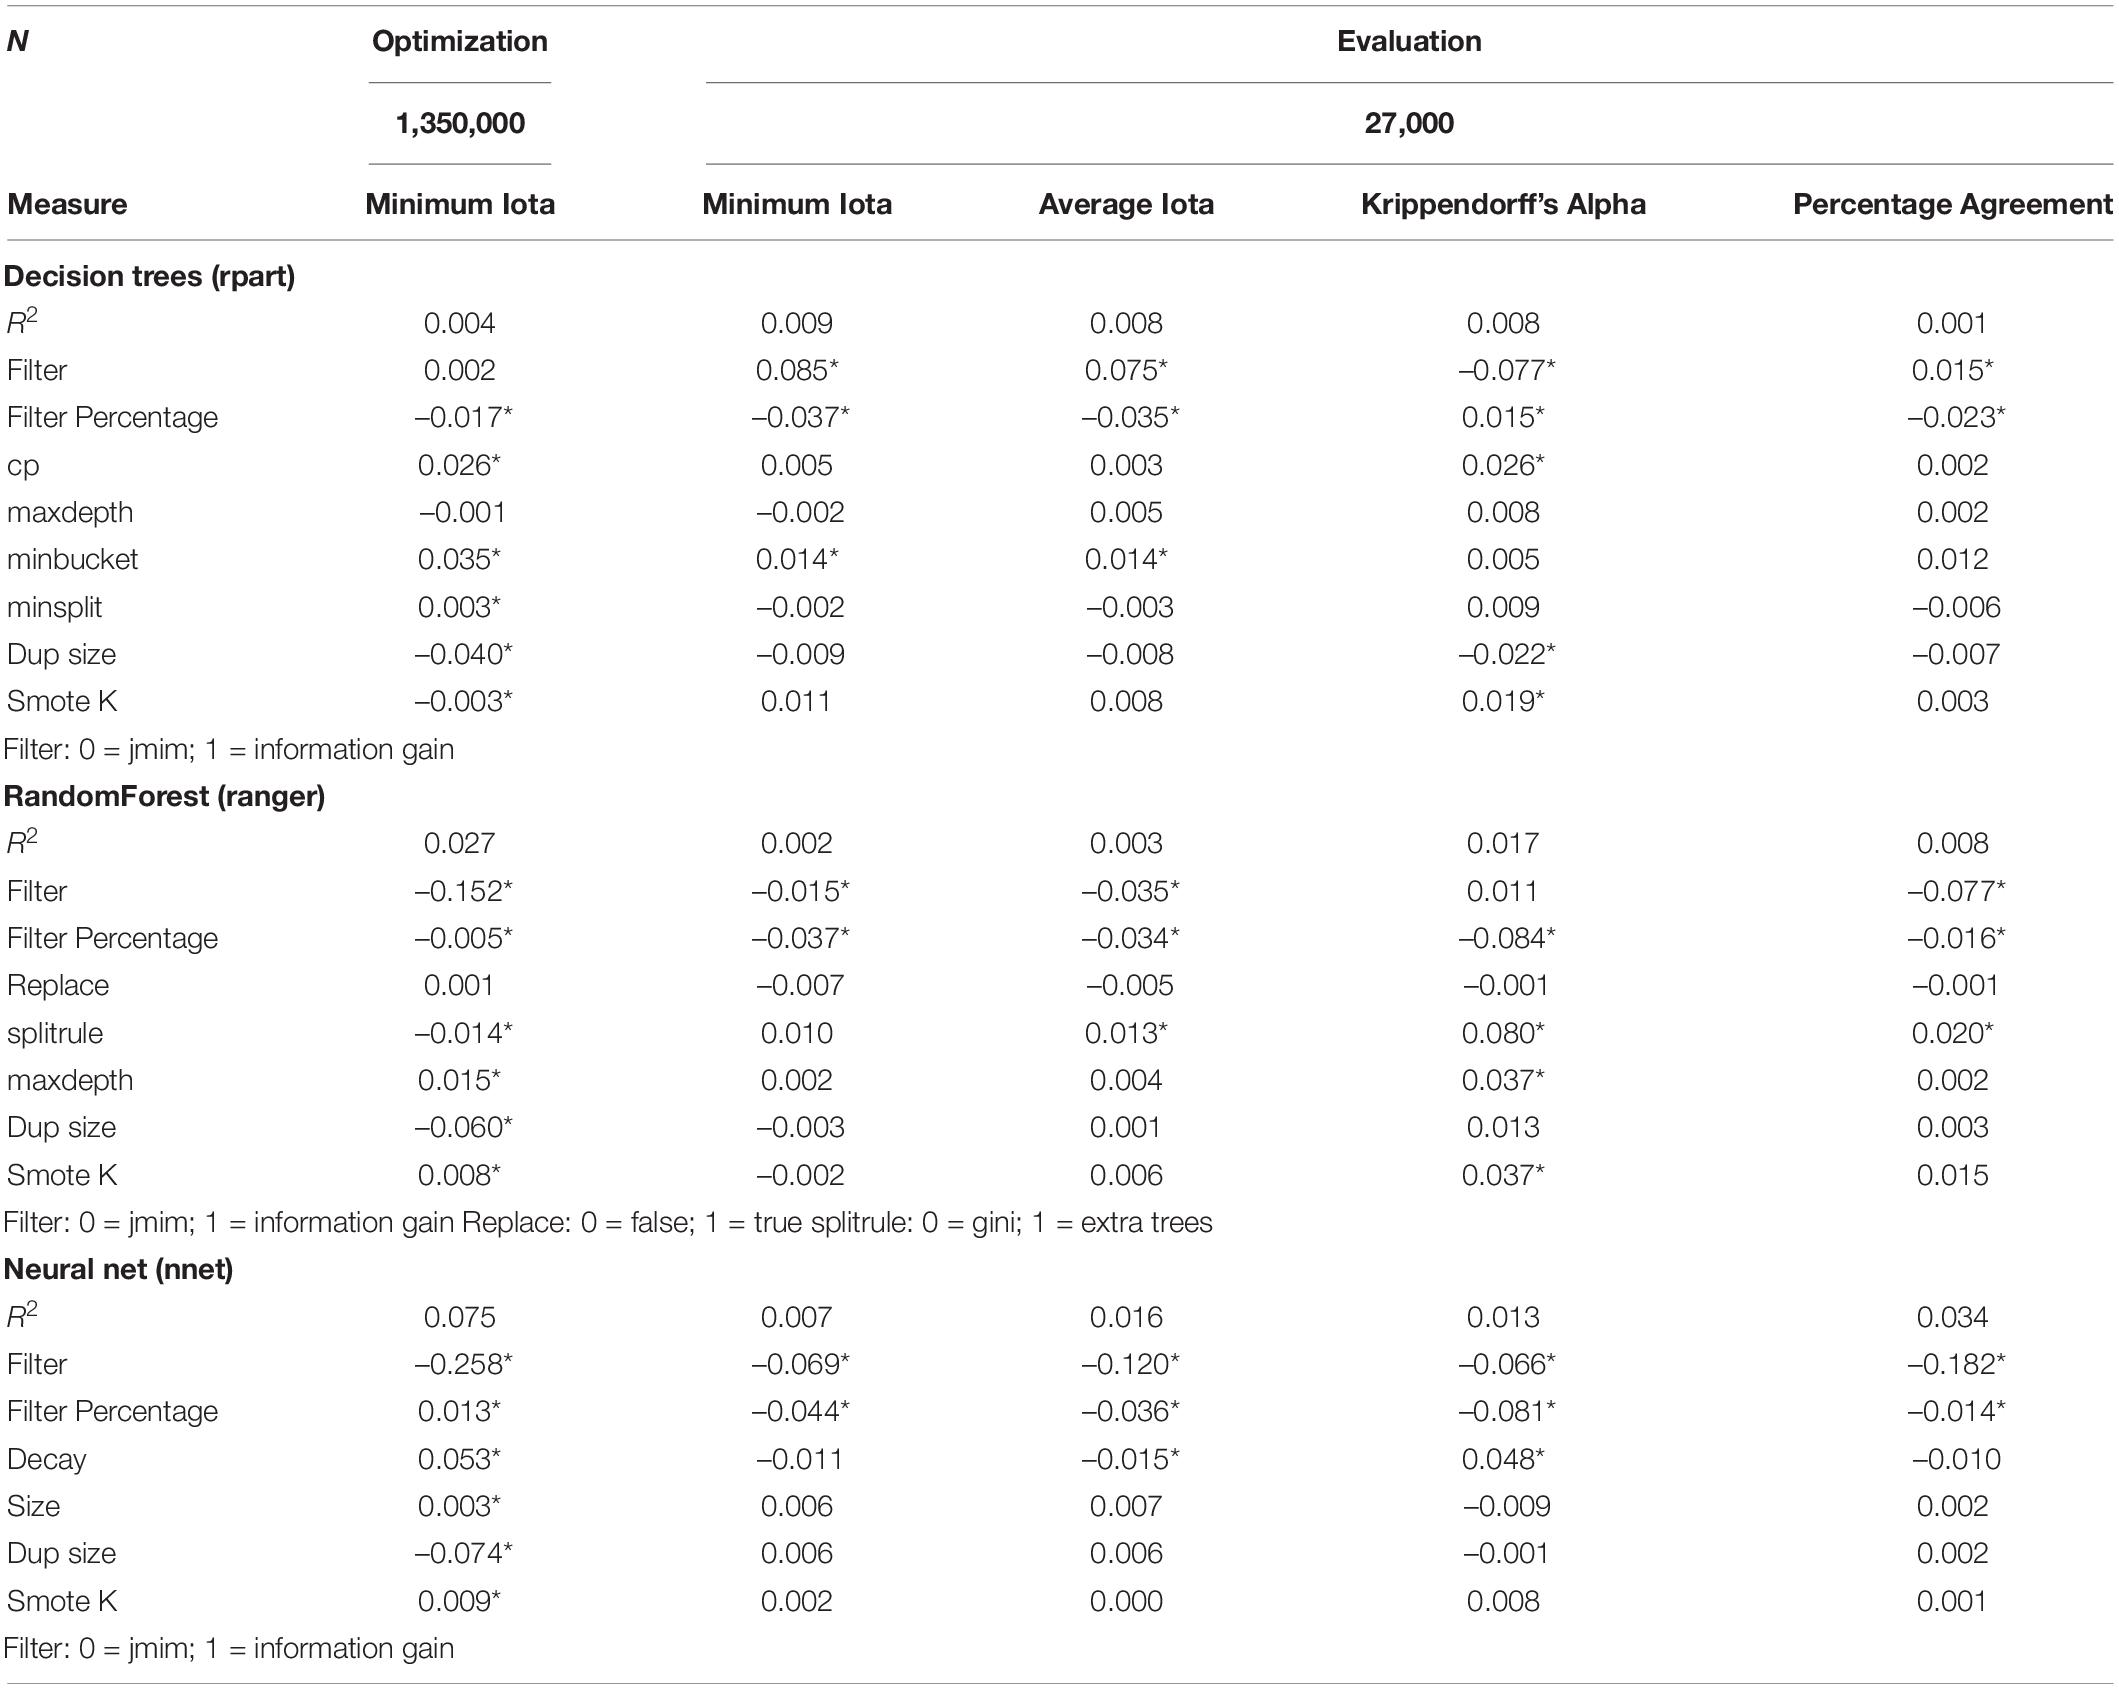
Table 8. Standardized coefficients for decision trees (rpart), RandomForest (ranger), and neural net (nnet).
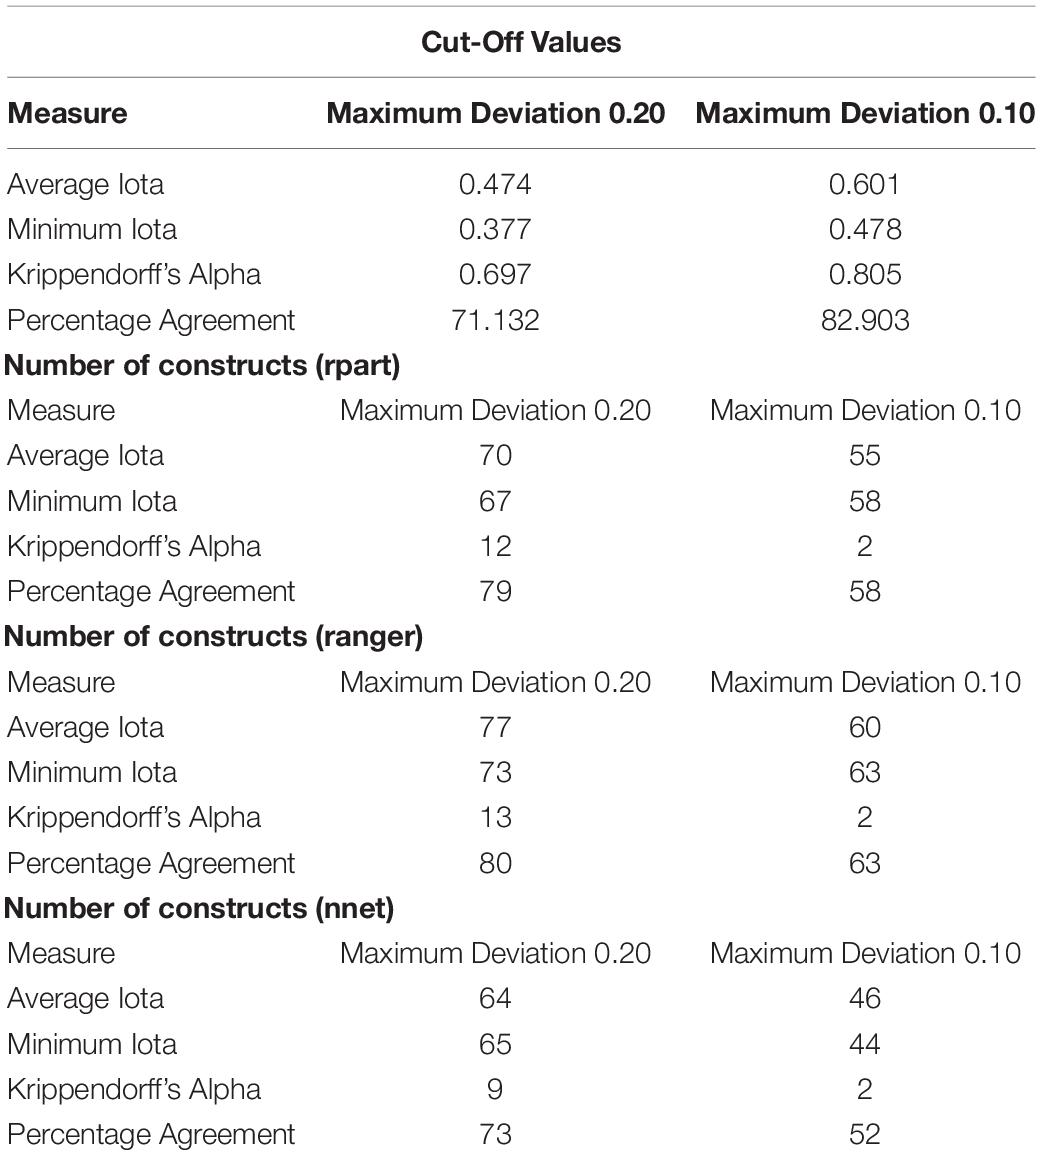
Table 9. Cut-off values for different measures, and number of constructs that reach the different cut-off values.
As can be seen in Table 7, the alpha error is relatively low for both categories. Regarding the different sub-groups of men and women, the assignment-error-matrices differ. For example, the alpha error for the women in category 1 (concept is acquired) is about 0.18 percentage points higher than for the men. Thus, the coding scheme guides human coders more often to assign the texts of women to category 0 (concept not acquired) although the text truly indicates the acquisition of that concept. This bias in reproduced by the AI with the consequence that women are not correctly represented in the data. Furthermore, the data generation underestimates the performance of women in comparison to men. This can lead to false conclusions in research studies or biased recommendations in learning analytics applications.
Referring to the AI literacy of Long and Magerko (2020), the assignment-error-matrix could be a tool that is easy to interpret for understanding how AI may be biased and to foster the AI literacy of students. Furthermore, the assignment-error-matrix can help mitigate the problem of bias in learning analytic applications which currently remains a great challenge for that technology (Seufert et al., 2021).
The requirements for a reliable assessment of students’ characteristics for learning analytics can be further discussed from another perspective. If the results generated by AI are used for judging the qualifications of learners, the demand for objectivity, reliability, and validity must be very high (Helmke, 2015), as errors can dramatically affect the educational path of learners. If the results are used only for fostering individual learning processes, the standards can be lower because the results provide orientation for teachers and educators in daily practice (Helmke, 2015). In daily practice, a high precision is not important as long as the direction of the conclusion leads to the right decisions (Weinert and Schrader, 1986). Here, the sign is more important than the concrete value. Thus, for fostering learning processes, less strict cut-off values are sufficient. Further studies should address which level of reliability is necessary for learning analytics applications to support individual learning (to be sure, the reliability of scientific studies has to adhere to higher standards).
Practical Implications
By providing information on every single category, developers of coding schemes gain orientation whenever a coding scheme needs revision. This allows a straighter process of development, can reduce costs, and improves the quality of content analysis. Furthermore, readers of studies using content analysis gain deeper insights into the quality of the data. They can form an opinion regarding which parts of the data correctly reflect a phenomenon, and where the data may be biased. A very helpful tool for evaluating the quality is the assignment-error matrix which provides information on how the categories may confound one another.
Based on the results of this study, the authors of this paper recommend complementing the data of learning analytics by using the textual data of students. This approach offers the opportunity to gain deeper insights into the cognition of learners while building a bridge to the conceptual work of different scientific and vocational disciplines. Furthermore, AI applications should present the reliability of every single category by using the new Iota Concept. It appears reasonable that the content analysis used in scientific studies should report the reliability of every single category using the cut-off values presented in Table 9. We recommend using the minimum iota, as this value ensures a minimal reliability standard for every single category that cannot be compensated by the superior reliability of other categories.
The calculation can be easily done with the package iotarelr which was developed simultaneously to this paper. Currently the package is only available at github. A submission to CRAN is planned in the future. News, introductions, and guides on how to use the package can be found via the project page3.
Regarding the configuration of AI, the results in Table 9 show which hyperparameters should be explicitly configured, and which parameters should be minimized/maximized. Of particular importance are the filter method and the number of features/words used for creating AI, since the standardized coefficients are relatively large. The aim of training AI under the condition of small sample sizes is the creation of a compressed textual representation relying on the most important information. Based on this study, JMIM can be used for selecting relevant words. The number of words should then be clearly filtered to about 5% of the initial number or even lower. Further research could focus the impact of other methods to create compressed textual representations. Technically, factor analysis, latent semantic analysis, latent Dirichlet allocation, and global vectors may be interesting for this purpose.
Limitations and Further Research
The limitations of this study point toward the need for future research. First, the simulation study uses only a simple linear relationship for ordinal data to derive cut-off values for the new measures. Further studies could investigate more complex relationships for ordinal and nominal variables. Second, the dependent variable is assumed as being measured with perfect reliability. This assumption does not hold in practice. Consequently, the cut-off values have to be higher. To derive more meaningful cut-off values, further simulation studies should therefore vary the reliability of the dependent variable. Third, the simulation study assumes that the true reliability is the same for all categories. Further research should investigate the relationship between iota and the true reliability for more varying values between the categories. Forth, the data for training AI was gathered from existing studies. The structure of the data did not allow to include an indicator of the quality of the initial data into the analysis although the study by Song et al. (2020) showed that this is a critical factor. Therefore, future studies should include corresponding indicators in their analysis.
In the current study, only a limited number of filter methods and kinds of AI could be applied. Additional research should include more of these different methods to find the best algorithms for varying conditions.
Data Availability Statement
The raw data supporting the conclusions of this article will be made available by the authors, without undue reservation.
Ethics Statement
Ethical review and approval was not required for the study on human participants in accordance with the local legislation and institutional requirements. Written informed consent from the participants’ legal guardian/next of kin was not required to participate in this study in accordance with the national legislation and the institutional requirements.
Author Contributions
All authors listed have made a substantial, direct, and intellectual contribution to the work, and approved it for publication. The iota concept itself was developed by FB.
Funding
These simulations were performed at the HPC Cluster CARL, located at the University of Oldenburg (Germany), and funded by the DFG through its Major Research Instrumentation Program (INST 184/157-1 FUGG), and the Ministry of Science and Culture (MWK) of the State of Lower Saxony in Germany.
Conflict of Interest
The authors declare that the research was conducted in the absence of any commercial or financial relationships that could be construed as a potential conflict of interest.
Publisher’s Note
All claims expressed in this article are solely those of the authors and do not necessarily represent those of their affiliated organizations, or those of the publisher, the editors and the reviewers. Any product that may be evaluated in this article, or claim that may be made by its manufacturer, is not guaranteed or endorsed by the publisher.
Supplementary Material
The Supplementary Material for this article can be found online at: https://www.frontiersin.org/articles/10.3389/feduc.2022.818365/full#supplementary-material
Footnotes
- ^ A preprint of this manuscript was published 03/2022 as Berding et al. (2022).
- ^ https://fberding.github.io/iotarelr/
References
Alpizar, D., Adesope, O. O., and Wong, R. M. (2020). A meta-analysis of signaling principle in multimedia learning environments. Educ. Technol. Res. Dev. 68, 2095–2119. doi: 10.1007/s11423-020-09748-7
Anders, Y., Kunter, M., Brunner, M., Krauss, S., and Baumert, J. (2010). Diagnostische Fähigkeiten von Mathematiklehrkräften und ihre Auswirkungen auf die Leistungen ihrer Schülerinnen und Schüler. Psychol. Erzieh. Unterr. 57, 175–193. doi: 10.2378/peu2010.art13d
Baker, F. B., and Kim, S.-H. (2017). The Basics of Item Response Theory Using R. Cham: Springer International Publishing.
Bennasar, M., Hicks, Y., and Setchi, R. (2015). Feature selection using Joint Mutual Information Maximisation. Expert Syst. Appl. 42, 8520–8532. doi: 10.1016/j.eswa.2015.07.007
Benoit, K., Watanabe, K., Wang, H., Nulty, P., Obeng, A., Müller, S., et al. (2018). quanteda: an R package for the quantitative analysis of textual data. J Open Source Softw. 3, 1–4. doi: 10.21105/joss.00774
Berding, F. (2019). Rechnungswesenunterricht: Grundvorstellungen und ihre Diagnose. Augsburg: Hampp.
Berding, F., and Jahncke, H. (2020). “Die Rolle von Grundvorstellungen in Lehr-Lern-Prozessen im Rechnungswesenunterricht – Eine Mehr-Ebenen-Analyse zu den Überzeugungen von Lehrkräften und Grundvorstellungen, Motivation, Modellierungsfähigkeit und Noten von Lernenden,” in Moderner Rechnungswesenunterricht 2020: Status quo und Entwicklungen aus wissenschaftlicher und praktischer Perspektive, eds F. Berding, H. Jahncke, and A. Slopinski (Wiesbaden: Springer), 227–258. doi: 10.1007/978-3-658-31146-9_11
Berding, F., Riebenbauer, E., Stütz, S., Jahncke, H., Slopinski, A., and Rebmann, K. (2022). Performance and Configuration of Artificial Intelligence in Business Education Learning Analytics Applications. A Content Analysis-Based Approach. Preprint doi: 10.31235/osf.io/trvcy
Berding, F., Stütz, S., Jahncke, H., Holt, K., Deters, C., and Schnieders, M.-T. (2021). Kosten und leistungen, eigenkapital und fremdkapital. Grundvorstellungen von realschülerinnen und realschülern sowie studierenden und ihr einfluss auf lernprozesse und lernerfolge. Z. Berufs Wirtschaftspädagog. 117, 560–629. doi: 10.25162/zbw-2021-0023
Bergstra, J., and Bengio, Y. (2012). Random Search for Hyper-Parameter Optimization. J. Mach. Learn. Res. 13, 281–305.
Bernard, R. M., Borokhovski, E., Schmid, R. F., Tamim, R. M., and Abrami, P. C. (2014). A meta-analysis of blended learning and technology use in higher education: from the general to the applied. J. Comput. High. Educ. 26, 87–122. doi: 10.1007/s12528-013-9077-3
Bloom, B. S. (1984). The 2 Sigma Problem: the Search for Methods of Group Instruction as Effective as One-to-One Tutoring. Educ. Res. 13:4. doi: 10.2307/1175554
Borges Völker, E., Wendt, M., Hennig, F., and Köhn, A. (2019). “HDT-UD: A very large Universal Dependencies Treebank for German,” in Proceedings of the Third Workshop on Universal Dependencies (UDW, SyntaxFest 2019), eds A. Rademaker and F. Tyers (Stroudsburg, PA, USA: Association for Computational Linguistics), 46–57.
Brom, C., Stárková, T., and D’Mello, S. K. (2018). How effective is emotional design? A meta-analysis on facial anthropomorphisms and pleasant colors during multimedia learning. Educ. Res. Rev. 25, 100–119. doi: 10.1016/j.edurev.2018.09.004
Cerasoli, C. P., Nicklin, J. M., and Ford, M. T. (2014). Intrinsic motivation and extrinsic incentives jointly predict performance: a 40-year meta-analysis. Psychol. Bull. 140, 980–1008. doi: 10.1037/a0035661
Cohen, J. (1988). Statistical Powe Analysis for the Behavioral Sciences. New York: Taylor & Francis.
de Ayala, R. J. (2009). The theory and practice of item response theory. New York, London: The Guilford Press.
ElSayed, A. A., Caeiro-Rodríguez, M., Mikic-Fonte, F. A., and Llamas-Nistal, M. (2019). “Research in Learning Analytics and Educational Data Mining to Measure Self-Regulated Learning: a Systematic Review,” in The 18th World Conference on Mobile and Contextual Learning (Netherlands: Delft University of Technology).
Feng, G. C., and Zhao, X. (2016). Do Not Force Agreement. Methodology 12, 145–148. doi: 10.1027/1614-2241/a000120
Haixiang, G., Yijing, L., Shang, J., Mingyun, G., Yuanyue, H., and Bing, G. (2017). Learning from class-imbalanced data: review of methods and applications. Expert Syst. Appl. 73, 220–239. doi: 10.1016/j.eswa.2016.12.035
Hartmann, J., Huppertz, J., Schamp, C., and Heitmann, M. (2019). Comparing automated text classification methods. Int. J. Res. Mark. 36, 20–38. doi: 10.1016/j.ijresmar.2018.09.009
Hayes, A. F., and Krippendorff, K. (2007). Answering the Call for a Standard Reliability Measure for Coding Data. Commun. Methods Meas. 1, 77–89. doi: 10.1080/19312450709336664
Helmke, A. (2015). Unterrichtsqualität und Lehrerprofessionalität. Diagnose, Evaluation und Verbesserung des Unterrichts. Seelze: Kallmeyer.
Hove, D., ten Jorgensen, T. D., and van der Ark, L. A. (2018). “On the Usefulness of Interrater Reliability Coefficients,” in Quantitative Psychology, eds M. Wiberg, S. Culpepper, R. Janssen, J. González, and D. Molenaar (Cham: Springer International Publishing), 67–75. doi: 10.1007/978-3-319-77249-3_6
Ifenthaler, D., and Widanapathirana, C. (2014). Development and Validation of a Learning Analytics Framework: two Case Studies Using Support Vector Machines. Technol. Knowl. Learn. 19, 221–240. doi: 10.1007/s10758-014-9226-4
Jaakonmäki, R., vom Brocke, J., Dietze, S., Drachsler, H., Fortenbacher, A., Helbig, R., et al. (2020). Learning Analytics Cookbook. Cham: Springer.
Jahncke, H. (2019). Selbst-)Reflexionsfähigkeit: Modellierung, Differenzierung und Beförderung mittels eines Kompetenzentwicklungsportfolios. München: Hampp.
Karst, K., Schoreit, E., and Lipowsky, F. (2014). Diagnostische Kompetenzen von Mathematiklehrern und ihr Vorhersagewert für die Lernentwicklung von Grundschulkindern. Z. für Pädagog. Psychol. 28, 237–248. doi: 10.1024/1010-0652/a000133
Kleesiek, J., Murray, J. M., Strack, C., Kaissis, G., and Braren, R. (2020). Wie funktioniert maschinelles Lernen? Der Radiologe 60, 24–31. doi: 10.1007/s00117-019-00616-x
Krippendorff, K. (2016). Misunderstanding Reliability. Methodology 12, 139–144. doi: 10.1027/1614-2241/a000119
Kühne, V. (2021). Modellierungskompetenz im Rechnungswesenunterricht: Eine empirische Analyse von Schulbüchern. Master thesis. Oldenburg.
Kulik, C.-L., and Kulik, J. A. (1991). Effectiveness of computer-based instruction: an updated analysis. Comput. Hum. Behav. 7, 75–97. doi: 10.1016/0747-5632(91)90030-5
Lang, M., Binder, M., Richter, J., Schratz, P., Pfisterer, F., Coors, S., et al. (2019). mlr3: a modern object-oriented machine learning framework in R. J. Open Source Softw. 4:1903. doi: 10.21105/joss.01903
Lanquillon, C. (2019). “Grundzüge des maschinellen Lernens,” in Blockchain und maschinelles Lernen: Wie das maschinelle Lernen und die Distributed-Ledger-Technologie voneinander profitieren, eds S. Schacht and C. Lanquillon (Heidelberg: Springer), 89–142.
Larusson, J. A., and White, B. (2014). “Introduction,” in Learning Analytics: From Research to Practice, eds J. A. Larusson and B. White (New York, NY: Springer New York), 1–12. doi: 10.1093/oso/9780198854913.003.0001
Liu, M.-C., Yu, C.-H., Wu, J., Liu, A.-C., and Chen, H.-M. (2018). Applying Learning Analytics to Deconstruct User Engagement by Using Log Data of MOOCs. J. Inf. Sci. Eng. 34, 1174–1186. doi: 10.6688/JISE.201809_34(5).0004
Long, D., and Magerko, B. (2020). “What is AI Literacy? Competencies and Design Considerations,” in Proceedings of the 2020 CHI Conference on Human Factors in Computing Systems (New York, NY, USA: ACM).
Lorena, A. C., Jacintho, L. F., Siqueira, M. F., de Giovanni, R., Lohmann, L. G., Carvalho, A. C., et al. (2011). Comparing machine learning classifiers in potential distribution modelling. Expert Syst. Appl. 38, 5268–5275. doi: 10.1016/j.eswa.2010.10.031
Lovejoy, J., Watson, B. R., Lacy, S., and Riffe, D. (2016). Three Decades of Reliability in Communication Content Analyses. Journal. Mass Commun. Q. 93, 1135–1159. doi: 10.1177/1077699016644558
Luan, H., Geczy, P., Lai, H., Gobert, J., Yang, S. J. H., Ogata, H., et al. (2020). Challenges and Future Directions of Big Data and Artificial Intelligence in Education. Front. Psychol. 11:580820. doi: 10.3389/fpsyg.2020.580820
Mayer, R. E. (2019). “Principles based on social cues in multimedia learning: Personalization, voice, image, and embodiment principle,” in The Cambridge handbook of multimedia learning, ed. R. E. Mayer (New York: Cambridge University Press), 345–368. doi: 10.1017/cbo9781139547369.017
Mayer, R. E., and Fiorella, L. (2019). “Principles for reducing extraneous processing in multimedia learning: Coher-ence, signaling, redundancy, spatial contiguity, and temporal contiguity principle,” in The Cambridge handbook of multimedia learning, ed. R. E. Mayer (New York: Cambridge University Press), 279–315. doi: 10.1017/cbo9781139547369.015
Mayer, R. E., and Pilegard, C. (2019). “Principles for managing essential processing in multimedia learning: Seg-menting, pre-training, and modality principle,” in The Cambridge handbook of multimedia learning, ed. R. E. Mayer (New York: Cambridge University Press), 316–344. doi: 10.1017/cbo9781139547369.016
Means, B., Toyama, Y., Murphy, R., Bakia, M., and Jones, K. (2010). Evaluation of evidence-based practices in online learning: A meta-analysis and review of online learning studies. Available Online at: www.ed.gov/about/offices/list/opepd/ppss/reports.html (accessed July 30, 2020).
Paek, I., and Cole, K. (2020). Using R for item response theory model applications. Abingdon, Oxon, New York, NY: Routledge.
Papilloud, C., and Hinneburg, A. (2018). Qualitative Textanalyse mit Topic-Modellen: Eine Einführung für Sozialwissenschaftler. Wiesbaden: Springer.
Probst, P., Boulesteix, A.-L., and Bischl, B. (2019). Tunability: importance of Hyperparameters of Machine Learning Algorithms. J. Mach. Learn. Res. 20, 1–32. doi: 10.1007/978-1-4842-6579-6_1
Reich, J. (2015). Education research. Rebooting MOOC research. Science 347, 34–35. doi: 10.1126/science.1261627
Riebenbauer, E. (2021). Kompetenzentwicklung im Masterstudium Wirtschaftspädagogik. Längsschnittstudie zur Unterrichtsplanung im Rechnungswesen. Bielefeld: wbv Media. doi: 10.3278/9783763970216
Rienties, B., Køhler Simonsen, H., and Herodotou, C. (2020). Defining the Boundaries Between Artificial Intelligence in Education, Computer-Supported Collaborative Lea128rning, Educational Data Mining, and Learning Analytics: a Need for Coherence. Front. Educ. 5:128. doi: 10.3389/feduc.2020.00128
Ryan, R. M., and Deci, E. L. (2012). “Motivation, personality, and development within embedded social contexts: An overview of Self-Determination Theory,” in The Oxford handbook of human motivation, ed. R. M. Ryan (Oxford: Oxford University Press), 84–108. doi: 10.1093/oxfordhb/9780195399820.013.0006
Saura, J. R., Ribeiro-Soriano, D., and Zegarra Saldaña, P. (2022). Exploring the challenges of remote work on Twitter users’ sentiments: from digital technology development to a post-pandemic era. J. Bus. Res. 142, 242–254. doi: 10.1016/j.jbusres.2021.12.052
Schneider, S., Beege, M., Nebel, S., and Rey, G. D. (2018). A meta-analysis of how signaling affects learning with media. Educ. Res. Rev. 23, 1–24. doi: 10.1016/j.edurev.2017.11.001
Schrader, F.-W. (1989). Diagnostische Kompetenzen von Lehrern und ihre Bedeutung für die Gestaltung und Effektivität des Unterrichts. Ph.D. thesis. Frankfurt am Main: Universität Heidelberg.
Seufert, S., Guggemos, J., and Ifenthaler, D. (2021). “Zukunft der Arbeit mit intelligenten Maschinen: Implikationen der Künstlichen Intelligenz für die Berufsbildung,” in Künstliche Intelligenz in der beruflichen Bildung: Zukunft der Arbeit und Bildung mit intelligenten Maschinen?, eds S. Seufert, J. Guggemos, D. Ifenthaler, H. Ertl, and J. Seifried (Stuttgart: Franz Steiner Verlag), 9–27.
Siemens, G., Dawson, S., and Lynch, G. (2013). Improving the Quality and Productivity of the Higher Education Sector: Policy and Strategy for Systems-Level Deployment of Learning Analytics. Available Online at: https://solaresearch.org/wp-content/uploads/2017/06/SoLAR_Report_2014.pdf (accessed Oct 31, 2020).
Song, H., Tolochko, P., Eberl, J.-M., Eisele, O., Greussing, E., Heidenreich, T., et al. (2020). In Validations We Trust? The Impact of Imperfect Human Annotations as a Gold Standard on the Quality of Validation of Automated Content Analysis. Polit. Commun. 37, 550–572. doi: 10.1080/10584609.2020.1723752
Straka, M., and Straková, J. (2017). Tokenizing, POS Tagging, Lemmatizing and Parsing UD 2.0 with UDPipe. Available Online at: https://www.aclweb.org/anthology/K17-3009.pdf (accessed July 03, 2020).
Tamim, R. M., Bernard, R. M., Borokhovski, E., Abrami, P. C., and Schmid, R. F. (2011). What forty years of research says about the impact of technology on learning: a second-order meta-analysis and validation study. Rev. Educ. Res. 81, 4–28. doi: 10.3102/0034654310393361
Therneau, T., Atkinson, B., and Ripley, B. (2019). rpart: Recursive Partitioning and Regression Trees. Available Online at: https://CRAN.R-project.org/package=rpart (accessed May 9, 2022).
VanLehn, K. (2011). The Relative Effectiveness of Human Tutoring, Intelligent Tutoring Systems, and Other Tutoring Systems. Educ. Psychol. 46, 197–221. doi: 10.1080/00461520.2011.611369
Venables, W. N., and Ripley, B. D. (2007). Modern applied statistics with S. New York, NY: Springer.
Wang, J., and Wang, X. (2020). Structural Equation Modeling: Applications Using Mplus. Hoboken: Wiley.
Weinert, F. E., and Schrader, F.-W. (1986). “Diagnose des Lehrers als Diagnostiker,” in Schülergerechte Diagnose, eds H. Petillon, J. E. Wagner, and B. Wolf (Weinheim: Beltz), 11–29. doi: 10.1007/978-3-322-87640-9_2
Wijffels, J., Straka, M., and Straková, J. (2019). udpipe: Tokenization, Parts of Speech Tagging, Lemmatization and Dependency Parsing with the ‘UDPipe’ ‘NLP’ Toolkit. Available Online at: https://CRAN.R-project.org/package=udpipe (accessed May 9, 2022).
Wong, J., Baars, M., de Koning, B. B., van der Zee, T., Davis, D., Khalil, M., et al. (2019). “Educational Theories and Learning Analytics: From Data to Knowledge,” in Utilizing Learning Analytics to Support Study Success, eds D. Ifenthaler, D.-K. Mah, and J. Y.-K. Yau (Cham: Springer International Publishing), 3–25. doi: 10.1007/978-3-319-64792-0_1
Wright, M. N., and Ziegler, A. (2017). ranger : a Fast Implementation of Random Forests for High Dimensional Data in C++ and R. J. Stat. Soft. 77, 1–17. doi: 10.18637/jss.v077.i01
Zhao, X., Feng, G. C., Liu, J. S., and Deng, K. (2018). We agreed to measur o measure agreement - Redefining r eement - Redefining reliability de-justifies eliability de-justifies Krippendorff’s alpha. China Media Res. 14, 1–15.
Keywords: learning analytics, artificial intelligence, content analysis, reliability, hyperparameter, neural net, decision trees, random forest
Citation: Berding F, Riebenbauer E, Stütz S, Jahncke H, Slopinski A and Rebmann K (2022) Performance and Configuration of Artificial Intelligence in Educational Settings. Introducing a New Reliability Concept Based on Content Analysis. Front. Educ. 7:818365. doi: 10.3389/feduc.2022.818365
Received: 19 November 2021; Accepted: 02 May 2022;
Published: 23 May 2022.
Edited by:
Manuel Gentile, Istituto per le Tecnologie Didattiche (CNR-ITD), ItalyReviewed by:
Josef Guggemos, University of St. Gallen, SwitzerlandJose Ramon Saura, Rey Juan Carlos University, Spain
Copyright © 2022 Berding, Riebenbauer, Stütz, Jahncke, Slopinski and Rebmann. This is an open-access article distributed under the terms of the Creative Commons Attribution License (CC BY). The use, distribution or reproduction in other forums is permitted, provided the original author(s) and the copyright owner(s) are credited and that the original publication in this journal is cited, in accordance with accepted academic practice. No use, distribution or reproduction is permitted which does not comply with these terms.
*Correspondence: Florian Berding, Zmxvcmlhbi5iZXJkaW5nQHVuaS1oYW1idXJnLmRl
 Florian Berding
 Elisabeth Riebenbauer
 Simone Stütz
 Heike Jahncke4