 Kaitlin Richard
 Katrina Pisani1
 Chantal L. Barriault
- 1Education and Evaluation, Science North, Sudbury, ON, Canada
- 2Faculty of Science, Engineering and Architecture, Laurentian University, Sudbury, ON, Canada
The aim of this study was to evaluate and report on the impact of an in-school science outreach program on children’s self-reported science knowledge, engagement, and skills through a case study of the Science North in-school outreach program “Mission to Mars.” A logic model method was used to outline the specific inputs, outputs, and measurable outcomes of the program. The program outcomes evaluated in this study were (1) experimentation skills, (2) critical thinking skills, and (3) sense of wonder. Results from pre-post surveys demonstrated that participants had increased program topic knowledge. Students self-reported positive emotions toward science more frequently following exposure to the program. Students’ sense of wonder toward science and toward space also increased post-program. This increase in positive emotion toward science could, in the short-term, increase student motivation toward science, which could lead to lasting interests in science in the long-term. Only a small number of students reported an increase in experimentation and critical thinking skills post-program. These skills take time to develop, and the single short-term program evaluated in this study may not have given students enough exposure to these skills for them to experience and show a noticeable change. The results of this study can provide informal science institutions like science centers with important insights into the potential learning impact of their in-school outreach programs, and can be used to improve current and future programs. Other organizations with in-school science outreach programs can benefit from using the methodology in this study to evaluate their programs, as this research includes a combination of innovative data collection methods such as concept maps to determine what students associate with the word “science,” and the use of an emoji scale to capture student emotions toward science. From a larger perspective, this study evaluating the impacts of in-school science outreach could demonstrate the potential benefits and outcomes of this unique area of informal learning, further solidifying the importance of incorporating these inquiry-based programs into classrooms.
Introduction
It is now well accepted that science learning is a continuous, on-going process with elements that span beyond the walls of formal school classrooms (Dierking et al., 2003; Stocklmayer et al., 2010; Falk and Dierking, 2019). Science learners engage with science through interacting with the natural world, lived experiences, prior knowledge, and everyday interactions (Dierking et al., 2003; Bell et al., 2009; Falk and Dierking, 2018a), and much of science learning occurs in informal environments such as libraries, museums, after-school programs, and by engaging with digital media (Falk et al., 2007; Rennie, 2014; Reiss, 2020). Recent curriculum reforms are encouraging the integration of inquiry-based methods into classrooms, however from lack of training and funding, to political and cultural barriers, there are still many hurdles for teachers to successfully implement them (Davis, 2003; Schwarz and Stolow, 2006; Stocklmayer et al., 2010). The current model of formal science education remains bound by curriculum constraints, transmission-based teaching methods, a hierarchical nature, and a focus on imparting specific knowledge that is assessed for sequence (Davis, 2003; Corrigan et al., 2018). Informal science learning however, places emphasis on learner interest, and is usually voluntary, inquiry-based, and self-directed (Dierking et al., 2003; Rennie, 2007; Fenichel and Schweingruber, 2010).
In order to fill gaps within traditional school-based science learning, informal science learning experiences can be integrated into formal learning environments (Malcolm et al., 2003; Stocklmayer et al., 2010). In fact, many education researchers are calling for more collaborations between schools and informal science institutions (Bevan and Semper, 2006; Bell et al., 2009; Bevan et al., 2010; Stocklmayer et al., 2010; Falk and Dierking, 2019). These collaborations could reduce barriers faced by schools by creating more equity and access to informal science programs and their benefits (Bell et al., 2009; Bevan et al., 2010). Echoing this, Falk and Dierking (2018b) have recently suggested an “ecosystem-based” approach to science education, which would give learners access to a network of different intersecting science learning opportunities that include formal schooling with a variety of other free-choice learning opportunities.
Students typically access free choice or informal science learning opportunities through supplementary class room experiences (like field trips, activities, or events), collaborations between formal and informal institutions to create changes in curriculum, out-of-school programs, teacher professional development, and updated and increased infrastructure (Bevan et al., 2010). Field-trips are the most common form of free-choice science experiences and these have been researched extensively for student and teacher outcomes (Bell et al., 2009, examples, Kisiel, 2005; DeWitt and Osborne, 2007; DeWitt and Storksdieck, 2008). As mentioned by Stocklmayer et al. (2010), schools face many barriers supporting class visits to out-of-school sites such as time restraints, liability, and expenses. These authors instead suggest a “third space” where students can engage with informal science within their own schools. The potential for a particularly unique type of science learning experience that blurs the lines between schools and their community is that of in-school science outreach programs. In-school science outreach is an engagement opportunity that is offered by science center or university outreach teams, private organizations, or after-school clubs (Stocklmayer et al., 2010). These programs are unique as they require a special connection to formal science learning and usually adhere to curriculum guidelines to some degree, to enrich classroom learning (Stocklmayer et al., 2010). The goal of many science outreach initiatives is to reach under-represented and under-served audiences in various communities to increase science literacy and science skills, and to enable these groups to potentially pursue a career in science, technology, engineering, or math (STEM) (Komoroske et al., 2015).
While in-school science outreach may fit within the framework of a science learning ecosystem, there is still a lack of evidence demonstrating the concrete outcomes of these types of programs (Bevan et al., 2010). In order for these in-school outreach programs to be fostered and seen as valuable, student outcomes need to be measured in a way that aligns with the goals of both school learning goals (i.e., knowledge gain), and informal institutional goals (i.e., engagement and positive affective outcomes) (Bevan et al., 2010). There are some examples of research demonstrating students’ increased knowledge in a particular subject following outreach programs (Komoroske et al., 2015), while other studies focus specifically on career and skill outcomes for students (Beck et al., 2006; Laursen et al., 2007). Many of these studies focus on in-school science outreach conducted by universities and their graduate students or researchers, leaving a gap in our understanding of the impacts of in-school science outreach delivered by informal science institutions like science centers.
Considering the lack of research and evaluative studies demonstrating the outcomes of in-school science outreach offered by science centers, this study uses a systematic approach to evaluate an in-school science program through a case study of one of Science North’s outreach programs. Science North is a science center in Sudbury, Ontario that delivers science education experiences to schools across Northern Ontario that are distant from the main science center. We, the authors, work collaboratively with Science North as partners in Laurentian University’s Science Communication graduate program.
In order to evaluate one of Science North’s in-school outreach programs, we needed to determine intended outcomes anticipated for participants in the program. This was done using a logic model—a systematic approach that illustrates the links between goals, activities, and principles of a project or program and creates measurable outcomes for evaluation (Bonney et al., 2011). To identify outcomes, we referred to the National Science Foundation’s (NSF) Framework for Evaluating Impacts of Informal Science Education and Outreach, which we will refer to as the NSF Framework (Friedman, 2008). The NSF Framework was created to assist practitioners and program developers with the evaluation of informal programming, which includes impact categories that are commonly found in logic models for informal programs. The framework identifies six impact categories: (1) knowledge, (2) engagement, (3) attitude, (4) behavior, (5) skills, and (6) other (Friedman, 2008). These impact categories are common learning outcomes identified in the development of informal science programs, and are used by many researchers to evaluate program impacts (Beck et al., 2006; Devictor et al., 2010; Komoroske et al., 2015; Jensen, 2014). For example, a summary of evaluation reports from afterschool STEM programs by Afterschool Alliance (2011) outlined three similar types of outcomes determined in STEM afterschool programs: improved attitudes toward STEM fields and careers, increased STEM knowledge and skills, and higher likelihood of pursuing a STEM career. Several of the NSF impact categories also align with Science North program goals of increasing experimentation and critical thinking (NSF impact category of skills), and igniting a sense of wonder (NSF impact category of engagement). The NSF impact category of knowledge mirrors a common outcome supported by schools, which tend to focus on students gaining knowledge guided by curriculums.
With this literature in mind, a logic model was developed to define measurable goals mirroring NSF impact categories from the NSF Framework (Friedman, 2008) to answer the following research question:
What are the cognitive, skill-related, and affective outcomes for students participating in a Science North in-school outreach program?
To answer this, we conducted a summative evaluation of Science North’s “Mission to Mars” in-school outreach program to assess if, and to what extent, students in the program engage in three specific outcomes laid out in the logic model:
(A) Experimentation
(B) Critical Thinking
(C) Sense of wonder
Materials and Methods
Creating a Logic Model
Figure 1 outlines the logic model developed for Science North’s in-school outreach programs delivered to provincially funded schools, which was developed using the evaluation guide by the Center for the Advancement of Informal Science Education (Bonney et al., 2011).
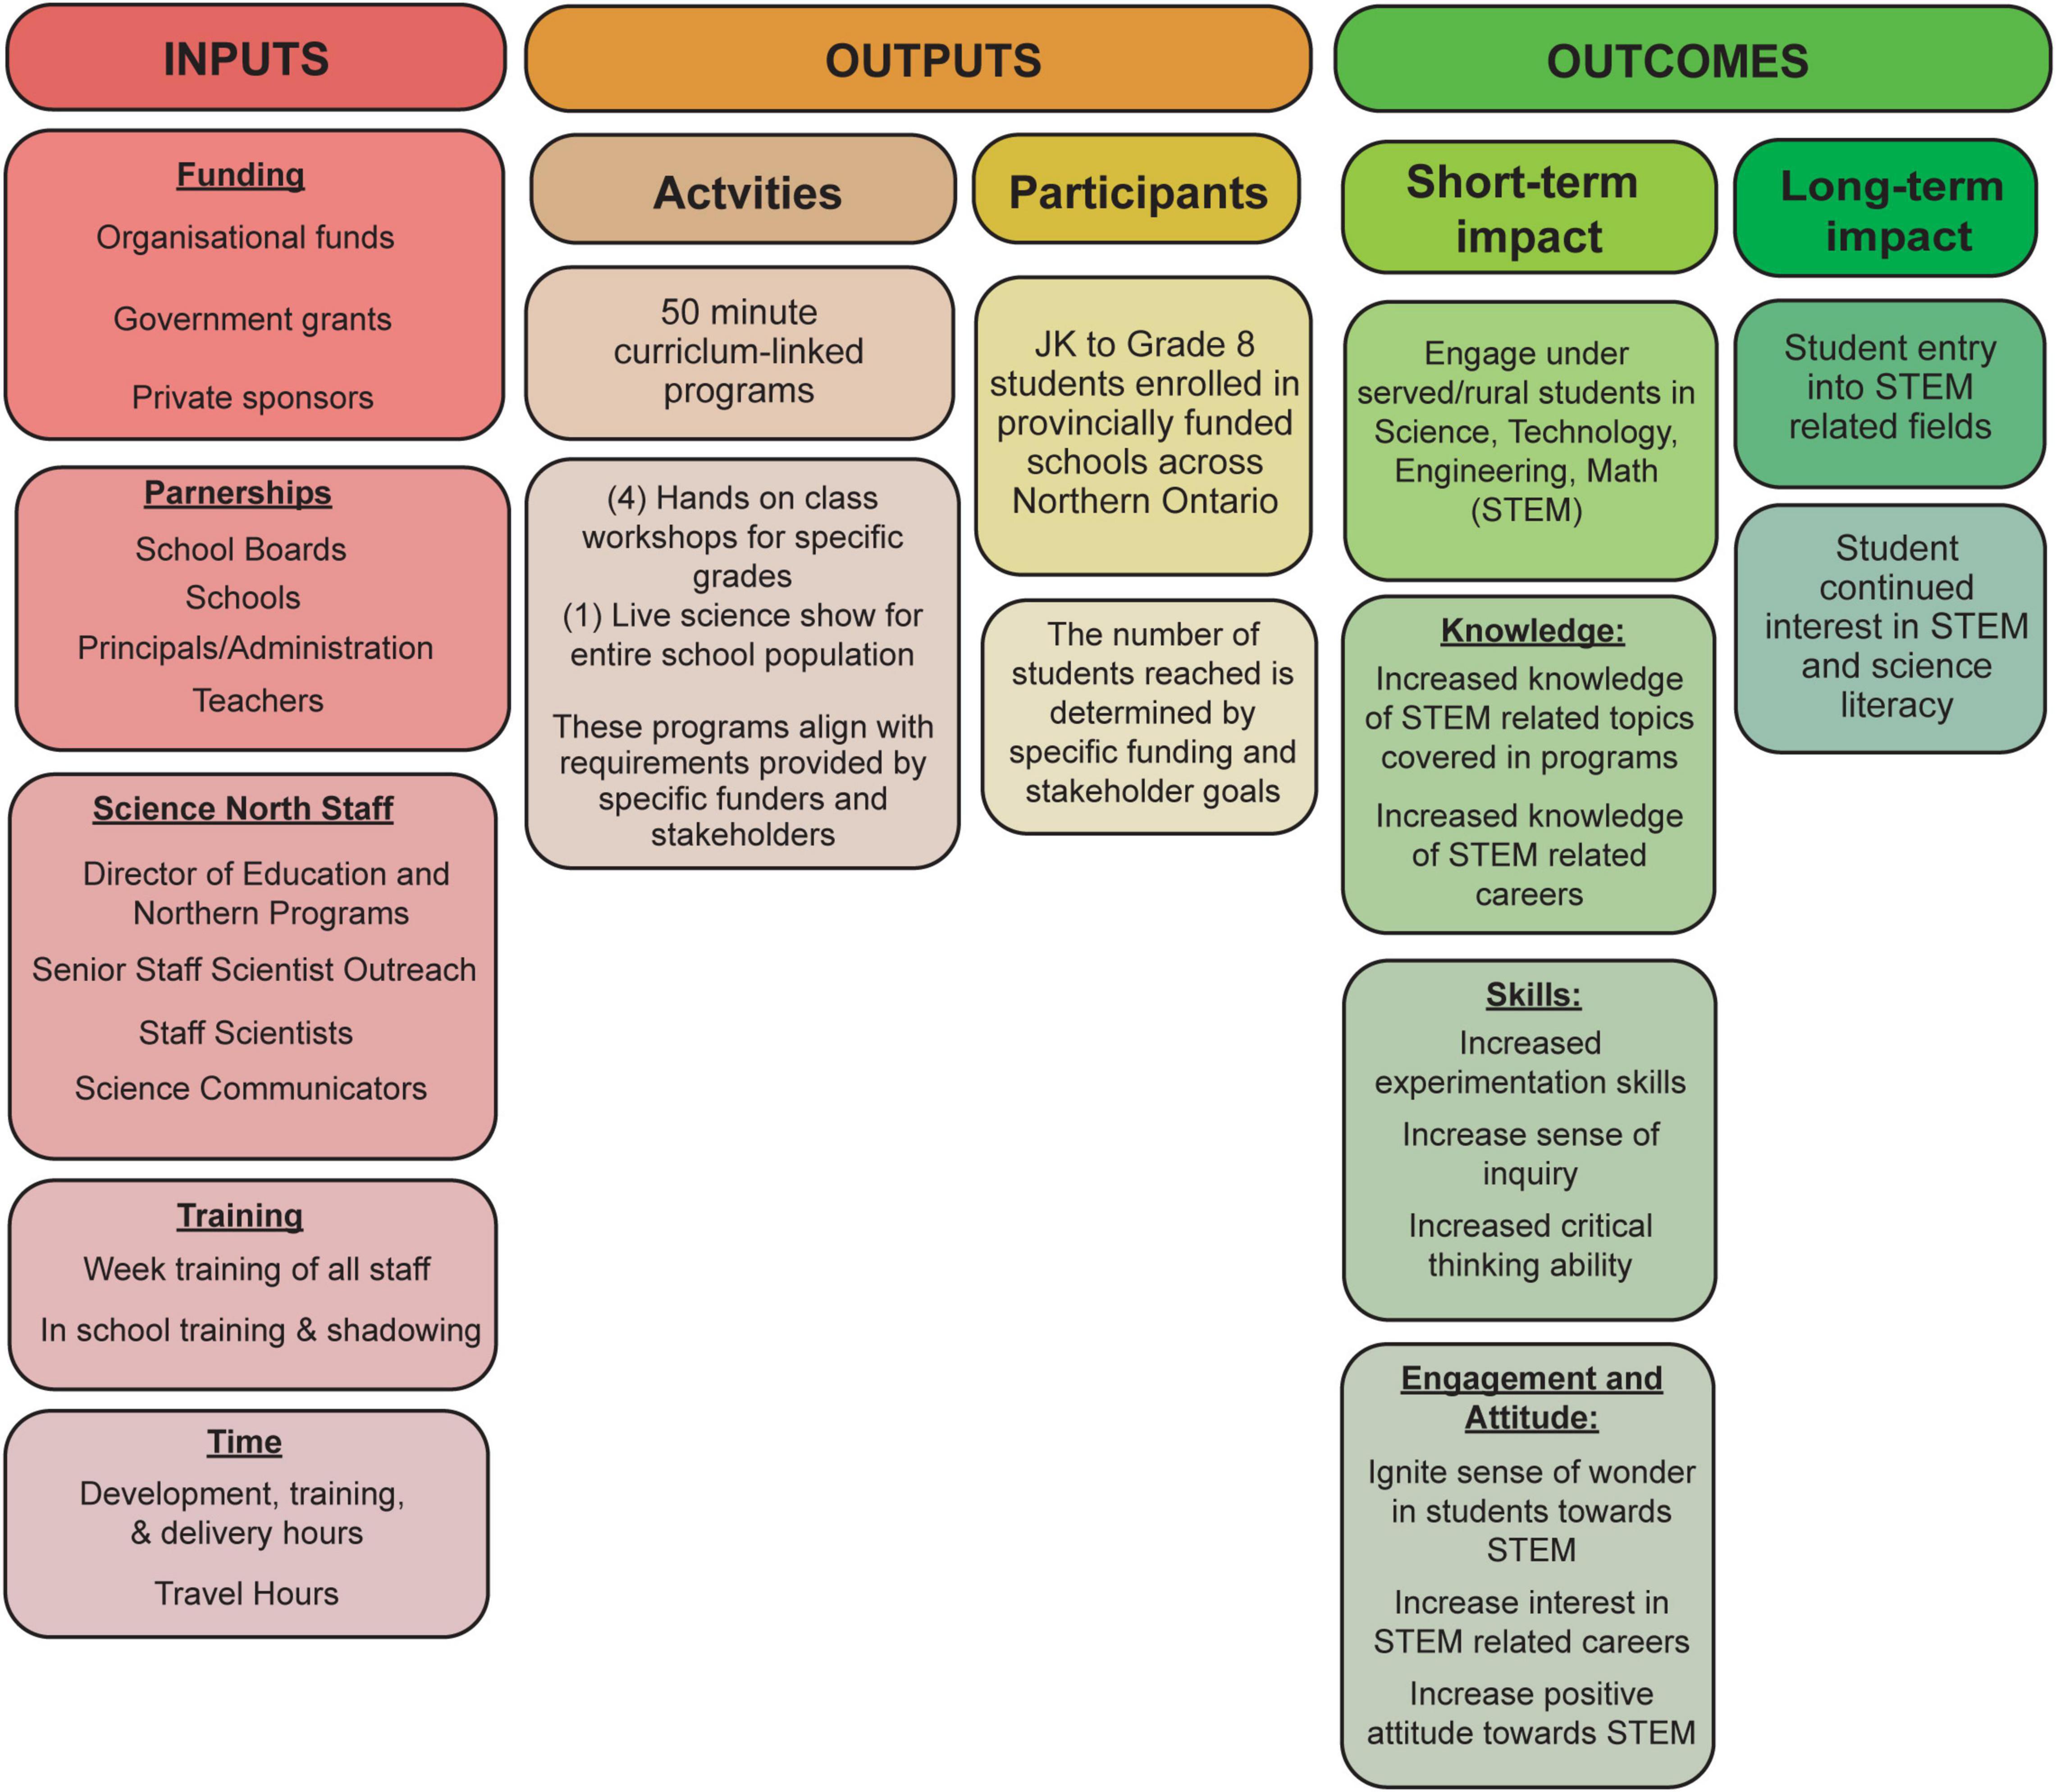
Figure 1. Science North provincially funded in-school outreach initiatives logic model. This logic model demonstrates the inputs and outputs of Science North in-school outreach programs as well as the measurable outcomes that were evaluated throughout this study.
The first column of the logic model describes all of the Inputs required for in-school outreach programs. These Inputs include yearly organizational funds and key financial stakeholders that support the programs. Also included in the inputs are the school boards, schools, school administration, and teachers directly involved in scheduling in-school outreach program days and supervising students that participate in programs. Within Science North, Inputs include program staff that directly support in-school outreach programs in all stages of program development and implementation.
The second column describes the Outputs, which includes the activities offered by Science North and the participants of these programs. Science North offers 50-min curriculum linked programs to provincially funded elementary schools (JK to Grade 8) across Northern Ontario.
The third column, Outcomes, describes the intended measurable short-term impacts, and the potential long-term impacts. Overall, Science North delivers in-school outreach programs to engage typically under-served students in Science, Technology, Engineering, and Math (STEM). These programs are intended to make an impact on students in three impact categories as guided by National Science Foundation’s Framework (Friedman, 2008):
Knowledge:
- Increased knowledge of STEM related topics covered in programs
- Increased knowledge of STEM related careers covered in the programs
Skills:
- Increased experimentation skills
- Increased sense of inquiry
- Increased critical thinking ability
Engagement and Attitude:
- Ignite a sense of wonder (curiosity) in students toward STEM
- Increase interest in STEM related careers
- Increase positive attitude toward STEM
Long-term, Science North aims to have an impact on students’ likelihood of pursuing STEM related careers in the future, and to give students a life-long continued interest in STEM and continued science literacy skills that will be used throughout a student’s lifetime.
Evaluating Program Outcomes
Approach
Our summative evaluation investigated the changes in student behavioral, cognitive, and/or affective outcomes after participating in a Science North in-school outreach program. The mixed-methods study took place over 2 weeks in three schools, during which we collected both qualitative and quantitative data. The study design is a quasi-experimental pre-post design, comparing the data from the same group of students before and after an initiative has been implemented, without a control group (O’Leary, 2017). Quantitative data was used to capture the change in students’ self-reported cognitive, behavioral, and affective outcomes after the program. Open-ended questions were used to collect qualitative data to explore the experience of the participants.
Sampling and Recruitment
The population that participates in Science North in-school outreach programs are school-aged students in grades JK—Grade 8 (ages 3–14) who attend provincially funded schools in Northern Ontario. Considering this large age range, this study specifically evaluated the change in Grade 5 and 6 students (ages 10 and 11 years old), who engaged in the Grade 5/6 “Mission to Mars” program offered by Science North. The sample can be described as representative of Grade 5 and 6 students, ages 10 and 11, who typically participate in Science North’s in-school outreach programs in Northwestern Ontario.
This study was carried out after full research ethics board review and approval from the Laurentian University Research Ethics Committee (refer to Supplementary Material for research ethics certificate of approval). This study followed all protocols required when researching vulnerable human participants, including all necessary approvals, consents, and assents. Several measures were put in place to ensure confidentiality and anonymity of the subjects throughout the study.
Following school board approval, three schools agreed to participate in the study. From those schools, eight Grade 5 and 6 teachers were contacted and five agreed to participate. Of the 126 students within the five classes that agreed to participate, 45 students provided the required consent and assent forms and therefore were the participants of this study.
Data Collection
Surveys and Distribution
Pre-post surveys were used in this study as they are commonly used to evaluate the changes in cognitive, affective, and behavioral outcomes resulting from instructional intervention (Dugard and Todman, 1995). The surveys were modified from successful survey instruments from previous studies for students in this age range (refer to Supplementary Material for survey instrument), and included anonymous identifier questions to ensure pre and post surveys could be matched to the same participant, and ensuring confidentiality.
Students were given the pre-survey 1 week prior to the delivery of the “Mission to Mars” program. One week following program delivery, students completed the post-survey. Only the surveys from students with parental consent and personal assent were used in data analysis.
In-School Outreach Program
The “Mission to Mars” program was designed and delivered fully by Science North Staff Scientists and is directly linked to the provincial Science and Technology curriculum for the intended age range. This program was offered to schools as a part of Science North’s traveling outreach program that are delivered to classes across Northern Ontario.
The “Mission to Mars” program aims to provide students with basic knowledge of the planet Mars, and gives insight on why humans take part in space exploration through the use of technology, like rovers. Participants in the program are given the opportunity to practice critical thinking and experimentation skills through the planning, designing, testing, and rebuilding their own Mars rover sensor protection device.
In hopes of promoting a sense of wonder within students participating program, Science North program staff begin the session by providing the class with a virtual reality tour of the surface of Mars. Using the virtual reality headsets, students see 360° images of Mars and the Mars rover Curiosity. Students are then given a challenge in which they are told that they are working for a space agency that is sending a rover to Mars to gather planetary information. The Science North program instructor advises the students that the rover has a sensor that relays important information about the Mars rover, including the gravitational force upon landing. In groups, the students are tasked to protect this sensor as the launching acceleration and landing on Mars can damage the sensor and break it before it sends any information to Earth. Critical thinking skills are tested as each group is given a budget to purchase materials (cotton balls, cups, elastics, etc.), and are asked to create a design sheet for their unique sensor protection device. Students are then challenged to build and launch their sensor held within the constructed protection device with a leaf blower through a launching tube. Each sensor is Bluetooth connected to a cell phone that provides each group with the live updates of the gravitational force that the sensor is experiencing. Experimentation skills are tested as students are asked to reduce the gravitational force that the sensor experiences each time it is launched by changing their design and re-launching. Additional challenges, such as parachute attachments, are added depending on the progression of the class. The program concludes with discussions summarizing the student findings while having them discuss how the experiment would be different if it took place in space, and not in a classroom (variables to consider like gravity, weather, etc.).
Survey Instrument
The survey began with a concept map question with science as the central concept. Students were asked to write and/or draw what they think of when they hear the word science. Concept maps were used because they can provide insight into students’ mental models, which reflects experiences, beliefs, and understanding students may have of a topic, how this information is represented, and how these ideas are organized in students’ minds (Kinchin et al., 2000; Halford, 2014).
To capture how they feel about science, students were asked to choose one of seven emojis that had a corresponding affective word describing the emojis. The emojis and connected affective words used were chosen from a study by Gallo et al. (2017), which demonstrated their effectiveness in representing emotional response to stimuli in children ages 8–11 (refer Supplementary Materials for the emoji scale within the student survey). Emoji use for child research has been validated as a child-centered visual research method that can assist with allowing children’s opinions and experiences to be heard (Fane et al., 2018). Using emoji scales in informal science program evaluation has not been explored extensively, allowing us to give commentary on the use of this method for this purpose. Emoji photos used were designed by OpenMoji.
The remaining questions in the survey were adapted from the formal evaluation of the 4-H Science Initiative by Mielke et al. (2002). Questions one through five were Noyce enthusiasm scale questions adapted from Mielke et al. (2002), used to determine interest in science and assessing the change in sense of wonder. Questions six and seven were taken from the Children’s Science Curiosity scale (Harty and Beall, 1984), and focus on curiosity and interest in relation to space science. Questions 8–11 assessed critical thinking, and were adapted by Mielke et al. (2002) from Perkins and Mincemoyer (2002). The final set of questions was adapted from the Science Process Skills Inventory (Arnold and Bourdeau, 2009), specifically for ages 9–12, and assessed the outcome of experimentation.
Data Analysis
Concept Map
The data collected from the concept map with science as the central concept was coded using thematic analysis. Using the coding methods outlined in Braun and Clarke (2006), we began by reading all concept map answers to familiarize themselves with the data and to generate initial codes. Each concept map was transcribed in a final list of all words, phrases, and drawings—drawings were transcribed into a word or phrase based on semiotic analysis using part of Charles S. Peirce theory of icon, index, and symbol. In this theory, an icon is interpreted as what it directly resembles, an index is considered for its true connection to an object, and a symbol is interpreted as representative of a symbolic meaning (Burks, 1949). In one of the most recent studies investigating the use of semiotics at the primary school level, the most frequently used indicator by children was the icon (Türkcan, 2013). For this reason, and in alignment with scope of this study, the drawings were only analyzed as icons; images were interpreted at the physical level for the object they appeared to represent.
The final themes were guided by the NSF Framework (Friedman, 2008) for evaluating informal science programs which includes the impact categories of knowledge, skills, attitude, engagement, behaviors, and other. The theme of knowledge was divided into sub-categories of six common science subjects: biology, chemistry, earth science, physics, technology, and space. The theme of engagement was split into two sections of positive and negative emotions. Each word or drawing that was coded as affective was further defined as either positive or negative using the open source opinion lexicon by NRC Word-Emotion Association Lexicon (Mohammad and Turney, 2013). For an example of knowledge icon interpretation, if a student drew what appeared to be a rocket, this was coded as the word “rocket,” which was subsequently added to the space category within the NSF knowledge theme. For an example of engagement icon interpretation, if a student drew what appeared to be a sad face (circle, two eyes, and mouth with sides declined), this was coded as “sad,” and was added to the negative emotion category.
Emoji Scale
Responses were analyzed quantitatively based on the frequency at which each emoji was chosen in the pre and post surveys. Frequencies were recorded as percentages and capture occasions when students chose multiple emojis.
Science Engagement and Skills
Each group of science engagement questions were analyzed based on the survey instrument they were adapted from, and the intended outcome they assessed. If students chose more than one answer, or if they did not give an answer for any of the 11 Likert questions or the five Science Process Skills Inventory questions, the answer was reported as “undecided.”
Questions one through five from the Noyce Science Enthusiasm survey instrument (Mielke et al., 2002) were assessed as indicators of science enthusiasm, or sense of wonder. Questions six and seven from Children’s Science Curiosity Scale (Harty and Beall, 1984) were assessed for the Science North outcome of sense of wonder. Questions 8–11, were used to assess critical thinking. The final five questions were used to assess the Science North outcome of experimentation. Table 1 summarizes the survey instrument’s sources, the NSF Framework impact category (Friedman, 2008), and Science North outcomes these instruments assessed. Cronbach alpha was calculated for each survey section with 3 or more statements to determine internal consistency. Pre and post evaluation data was converted to numerical data, and means were calculated for each set of questions by variable, found in Table 2. Note: Lower numerical mean indicates that students were more likely to agree with the statements, i.e., “strongly agree” = 1, “agree” = 2, “disagree” = 3, and “strongly disagree” = 4.
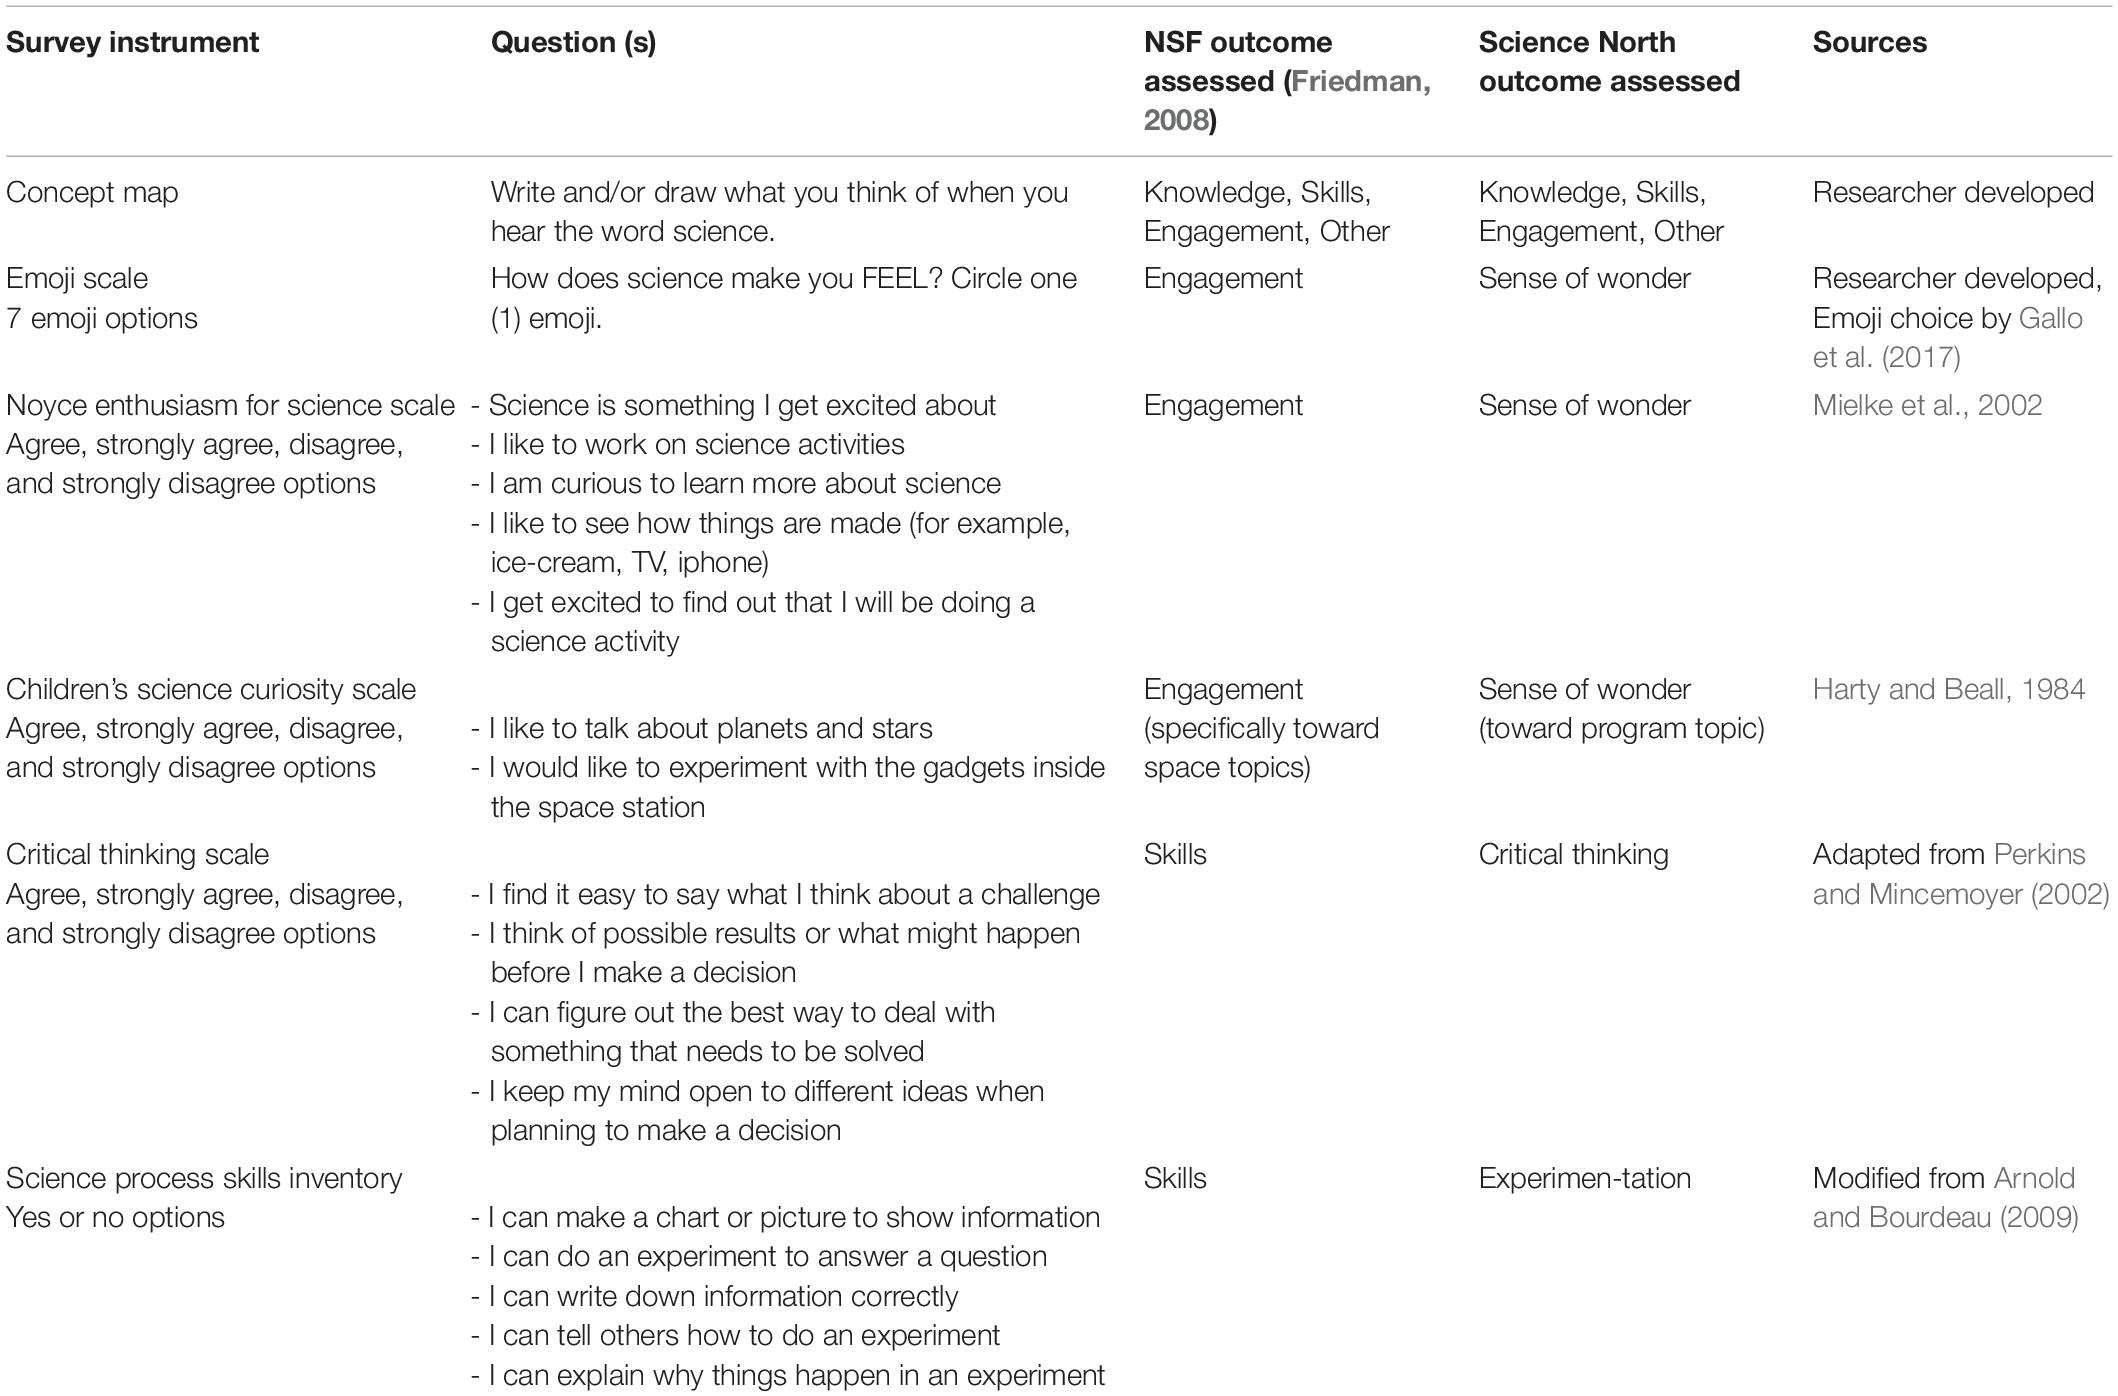
Table 1. Survey instruments used to evaluate Science North In-school outreach program outcomes.
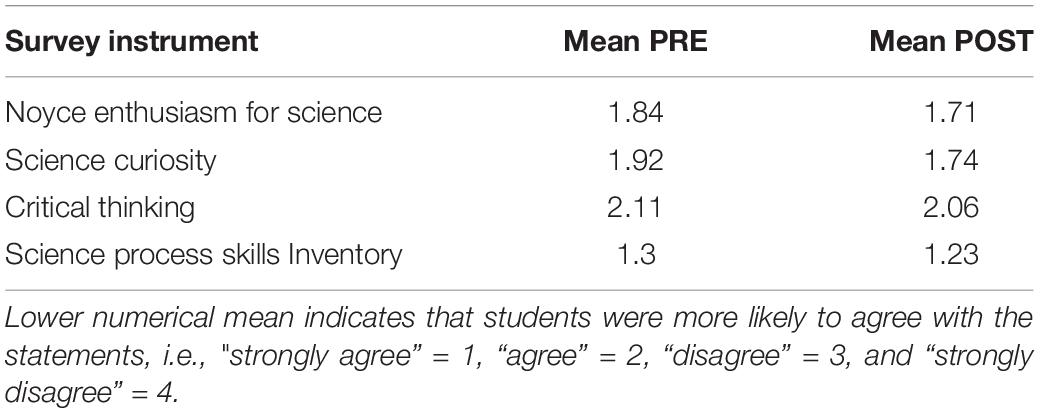
Table 2. Mean survey instrument responses for participants pre and post survey.
Table 3 summarizes the mean findings pre and post survey. Paired t-tests were run for each variable to conduct statistical significance.
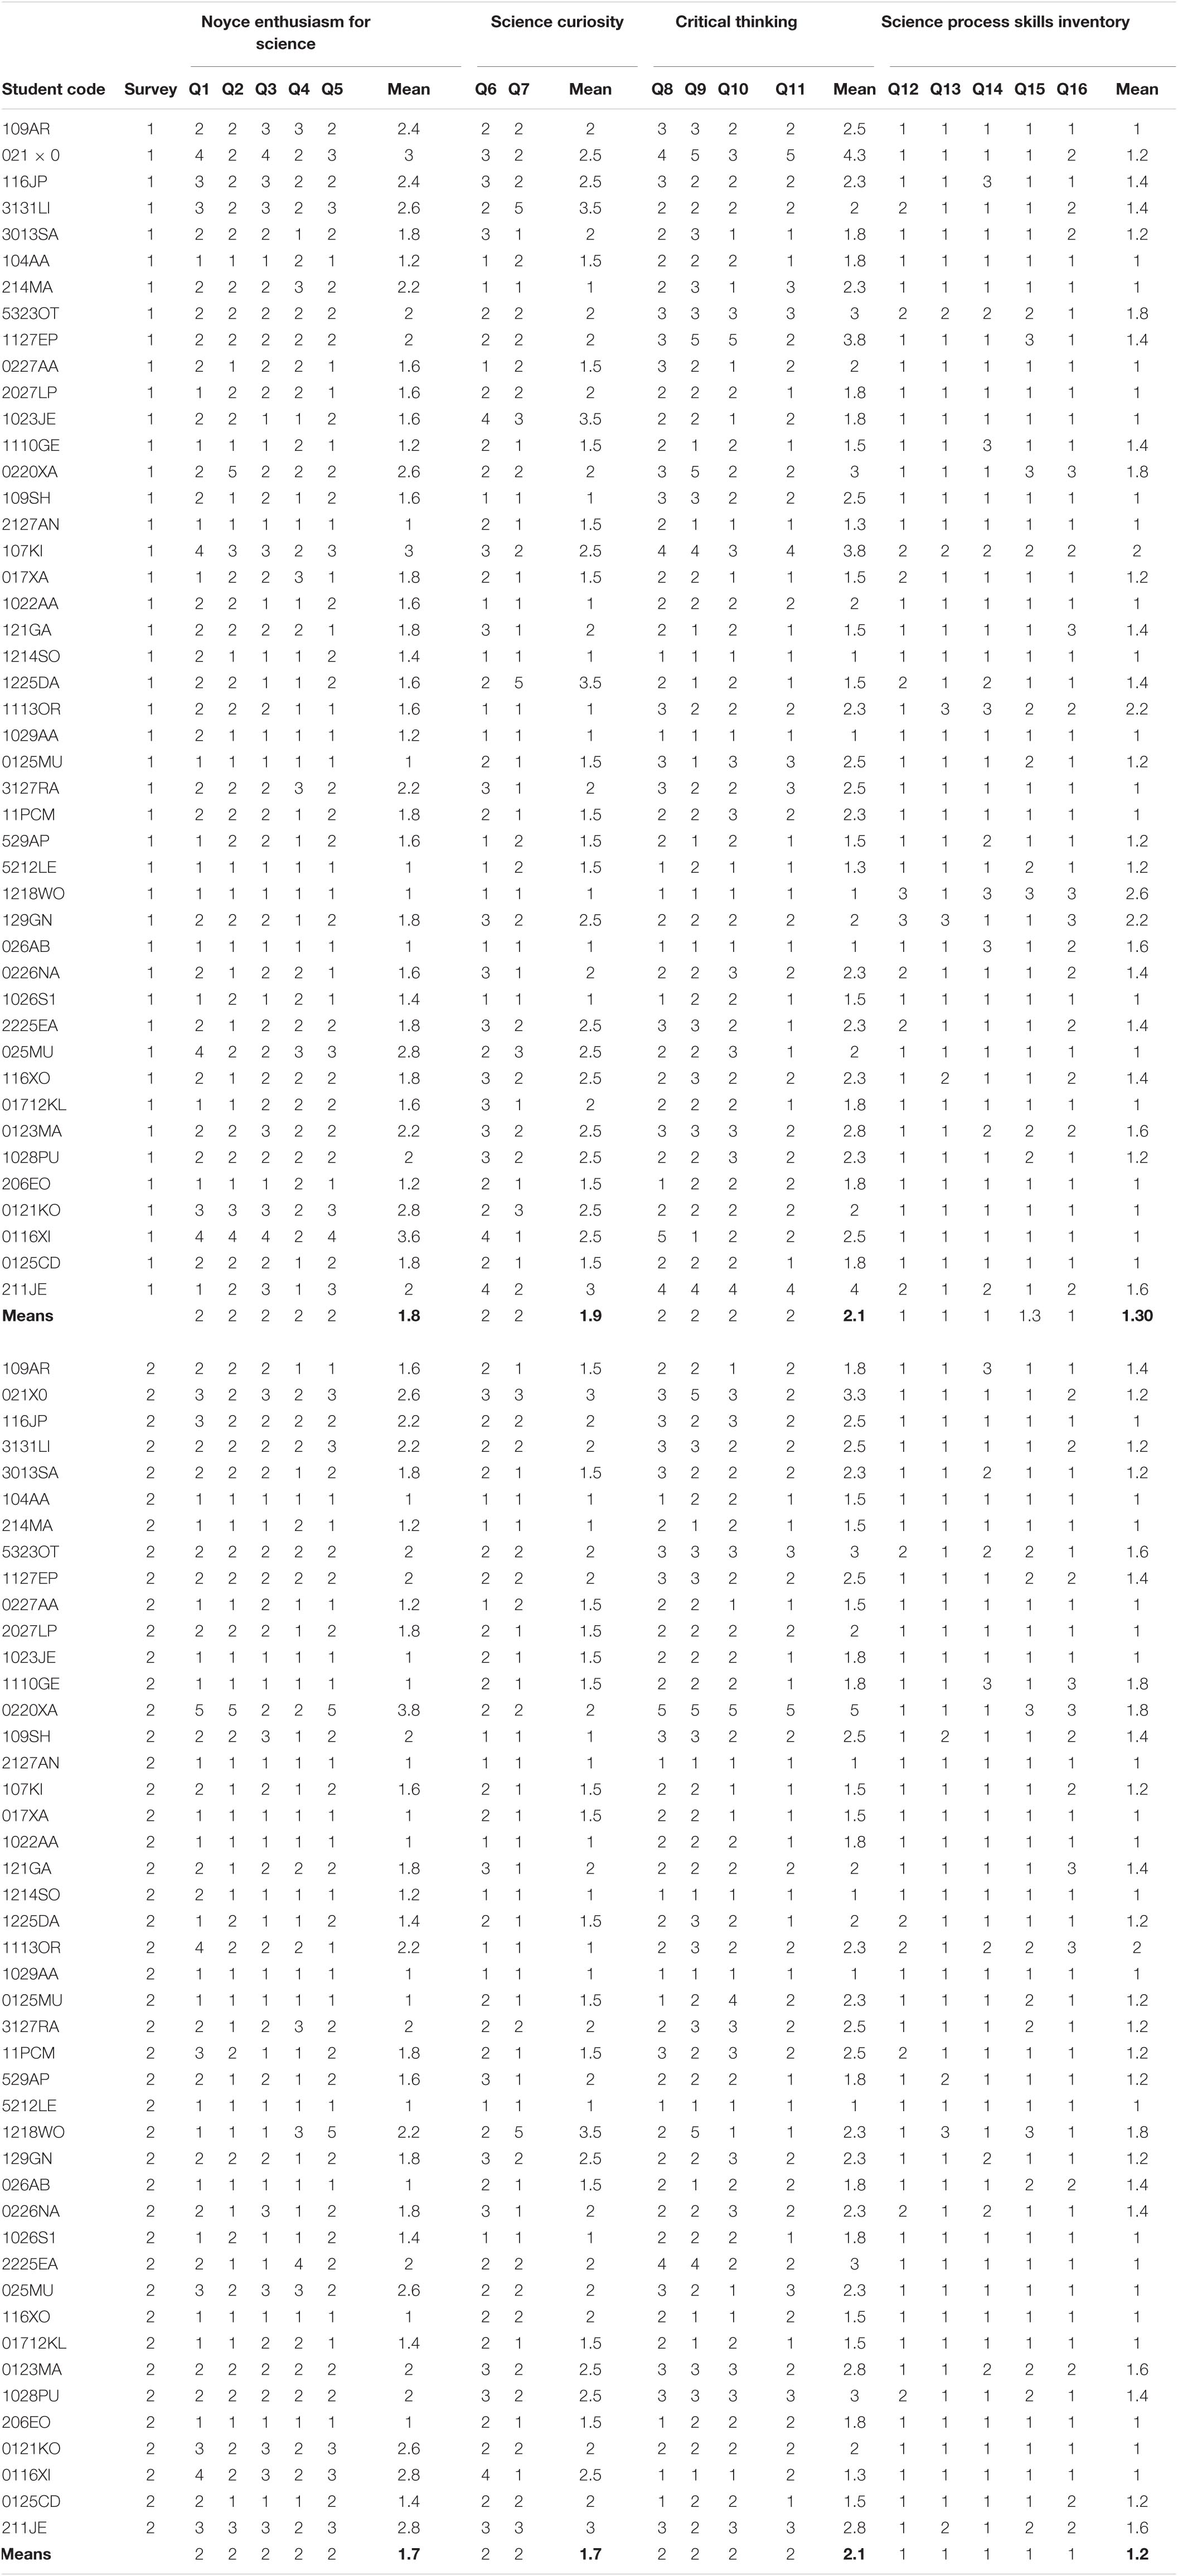
Table 3. Numerical participant survey responses with mean values pre and post survey.
Results
Concept Map
Of the 45 surveys, eight students did not complete the concept map pre-program, and seven students did not post-program delivery. Using thematic coding, the text and drawings from the concept maps were coded into four of the NSF impact categories from the NSF Framework (Friedman, 2008): (1) knowledge, (2) engagement, (3) skills, and (4) other. The knowledge category had the highest frequency of responses out of all of the categories, and also had the largest change in frequency from pre to post survey with an increase of 34 occurrences. Within the skills category, there was an increase of 11 occurrences from pre to post survey. The largest change that occurred within skills was in the sub-category of “experimentation,” which increased by seven occurrences from pre to post survey. Table 4 displays the concept map codes and frequencies of occurrence pre and post survey.
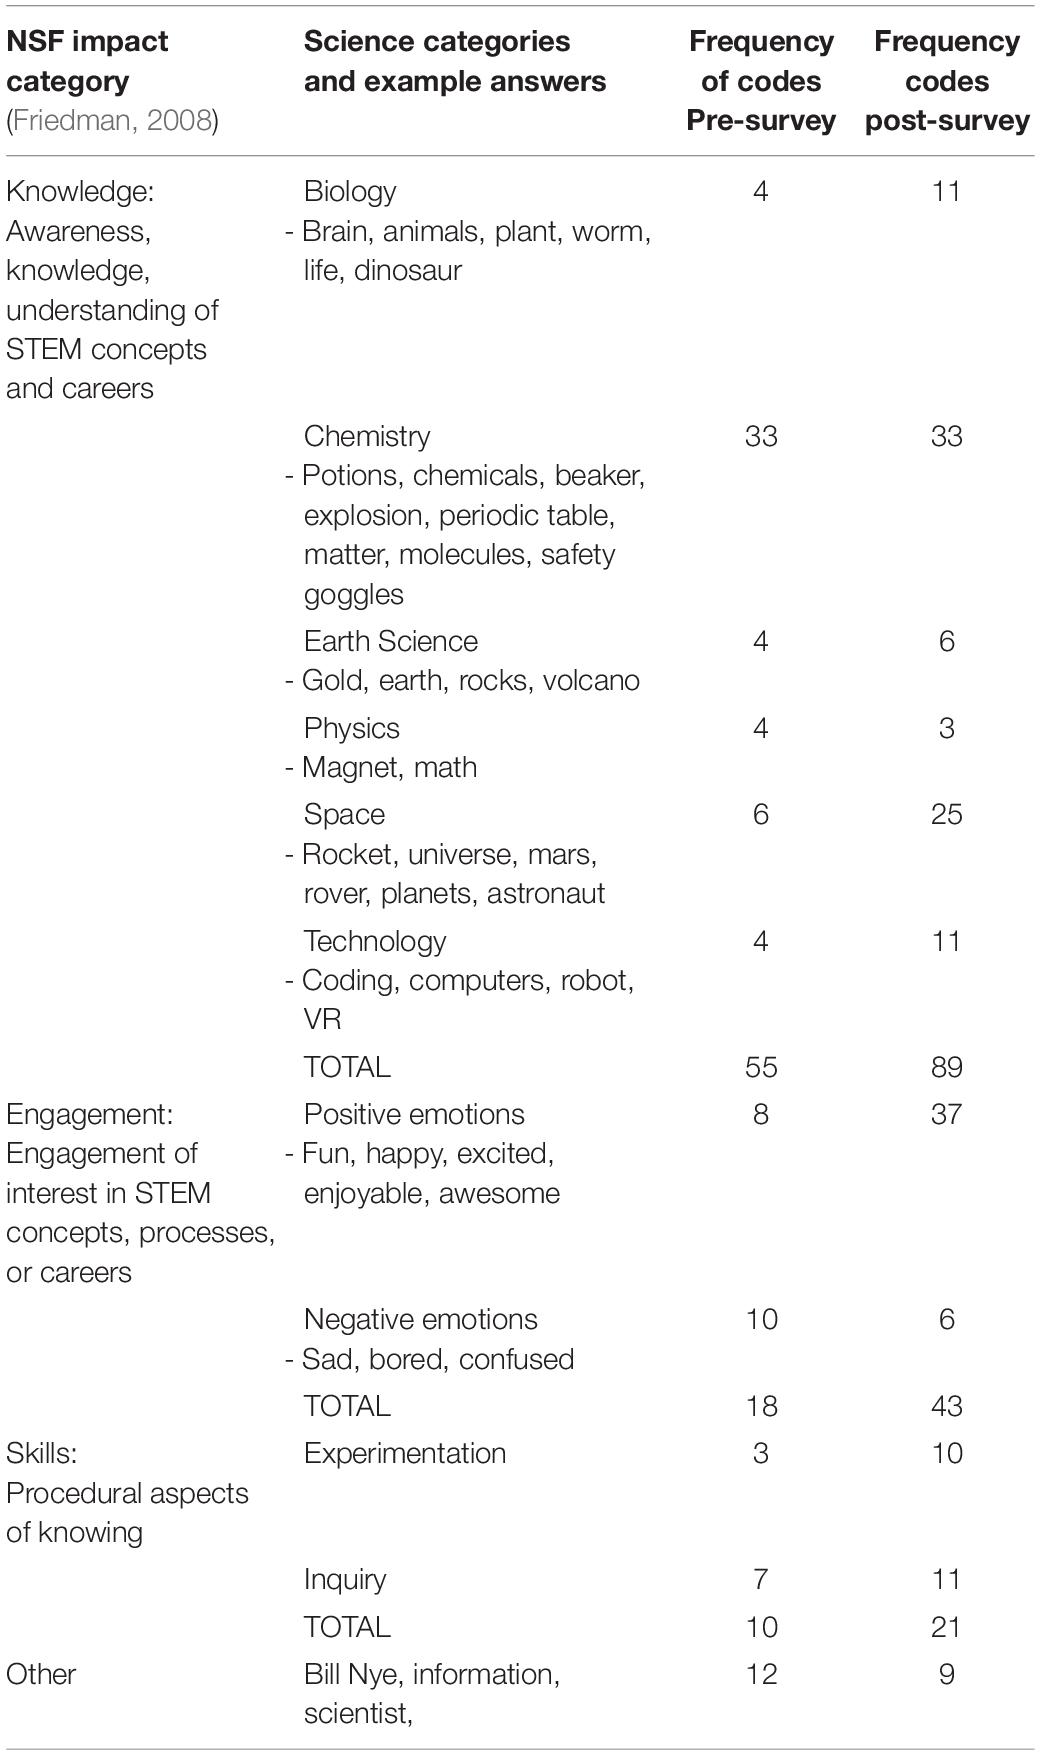
Table 4. Concept Map NSF impact categories and frequency of codes pre and post survey.
The outcome of knowledge was split into six sub-categories: chemistry, technology, physics, earth science, biology, and space. The frequency of occurrences for each of these can be found in Figure 2. Chemistry had the highest frequency with 33 occurrences pre and post. Space showed the largest change in frequency with an increase of 19 occurrences from pre to post survey.
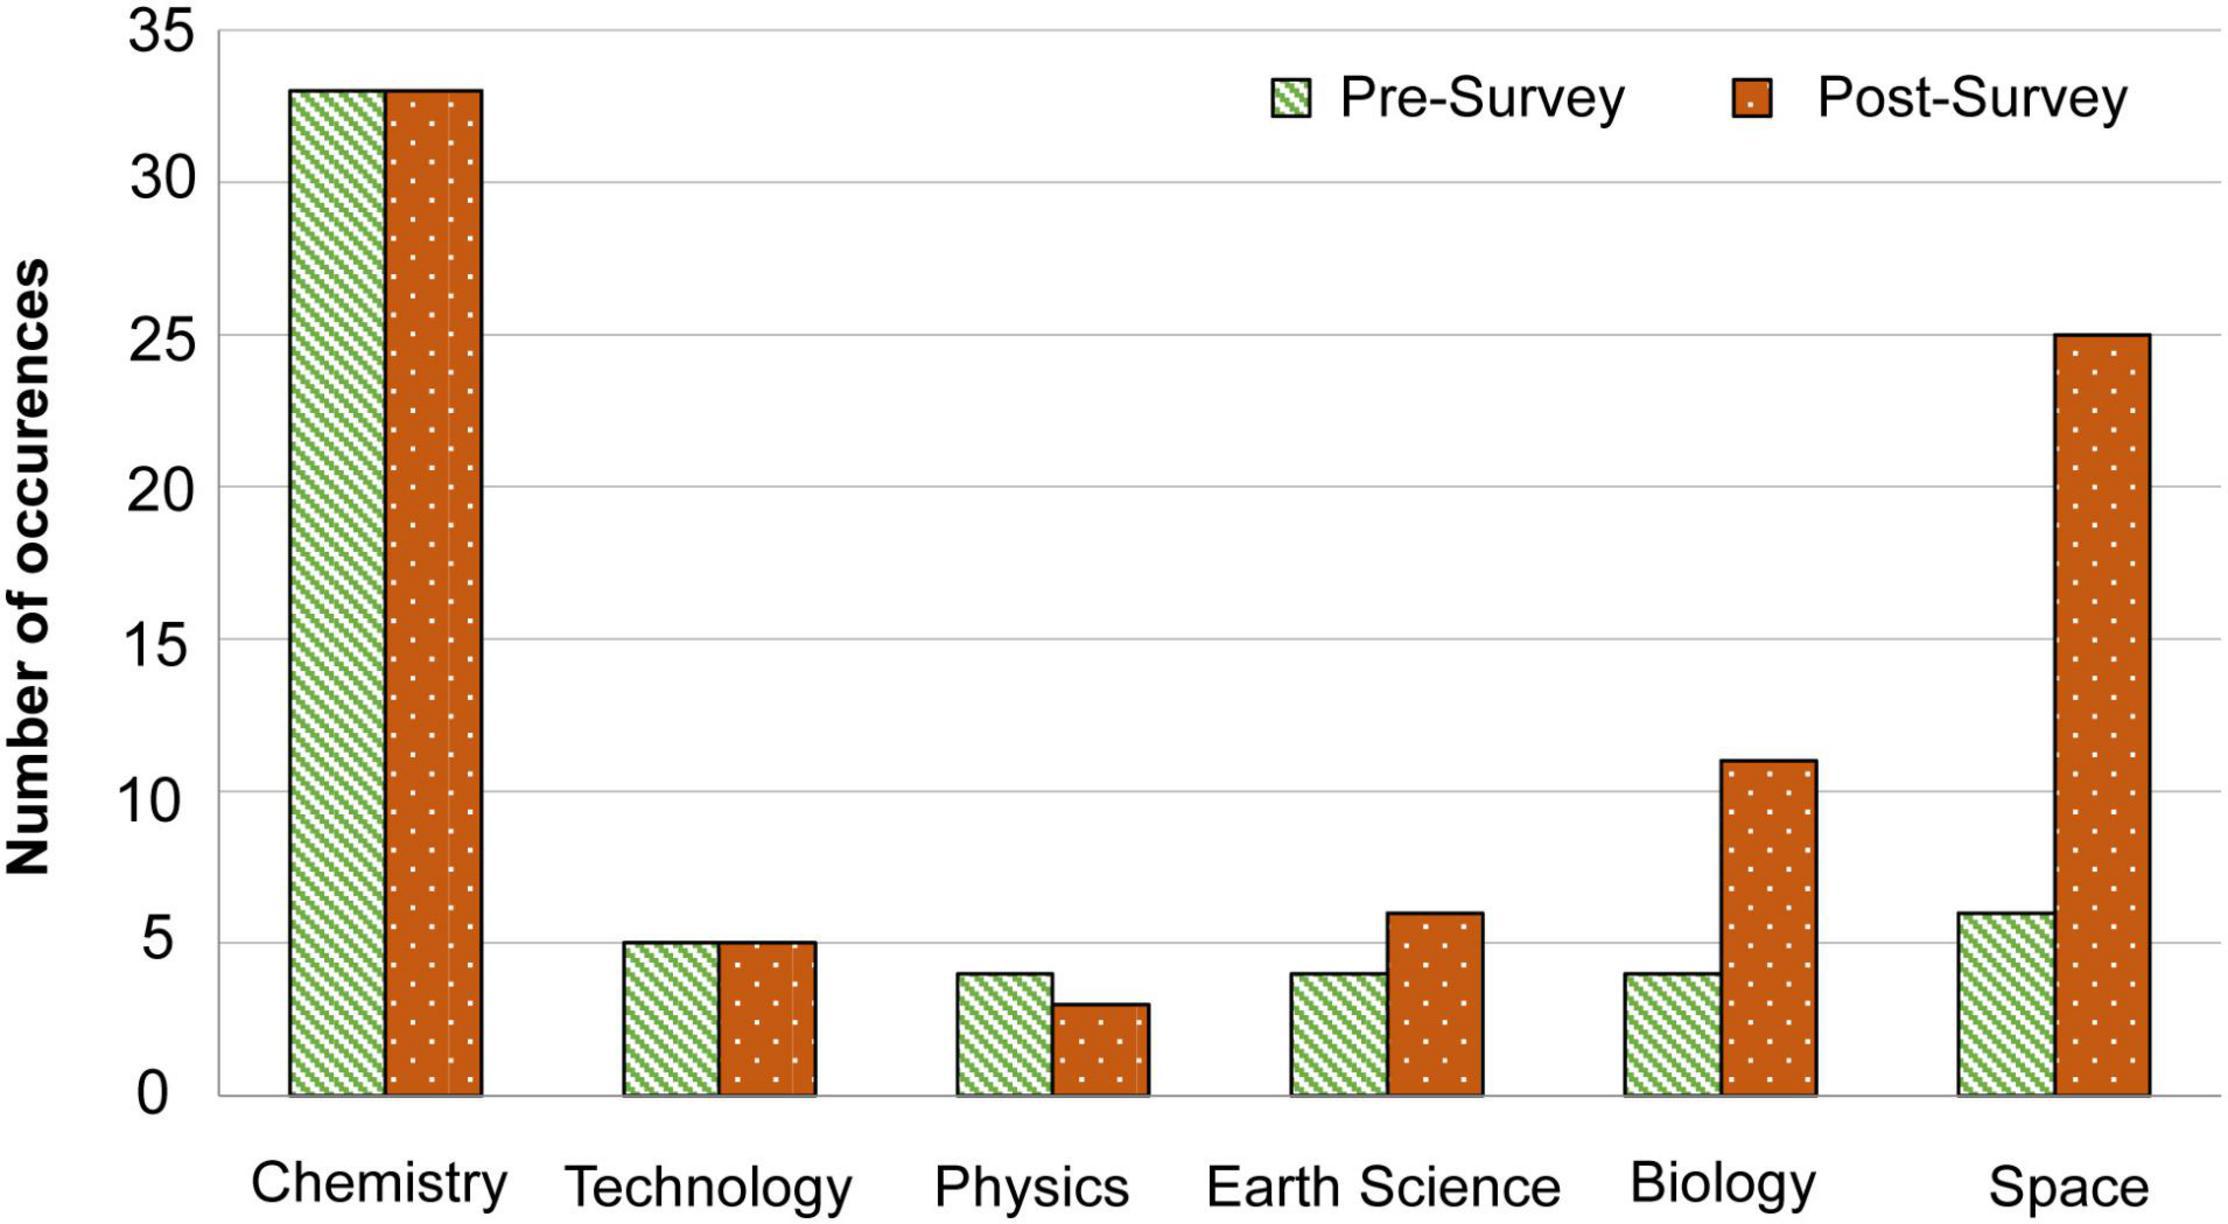
Figure 2. Frequency of knowledge sub-categories. Results depicting the frequency of science subjects mentioned in the concept map question both pre and post survey. These subjects were coded through thematic analysis of question 1, which asked students to “write and/or draw what you think of when you hear the word science.”
The NSF Framework (Friedman, 2008) impact category of engagement saw the second largest increase in occurrences from 18 in the pre-survey to 43 in the post-survey. The Engagement sub-categories of positive and negative emotions included an increase for positive emotions by 29 from pre survey to post survey. The frequency of a negative emotion decreased by four. These changes can be found in Figure 3.
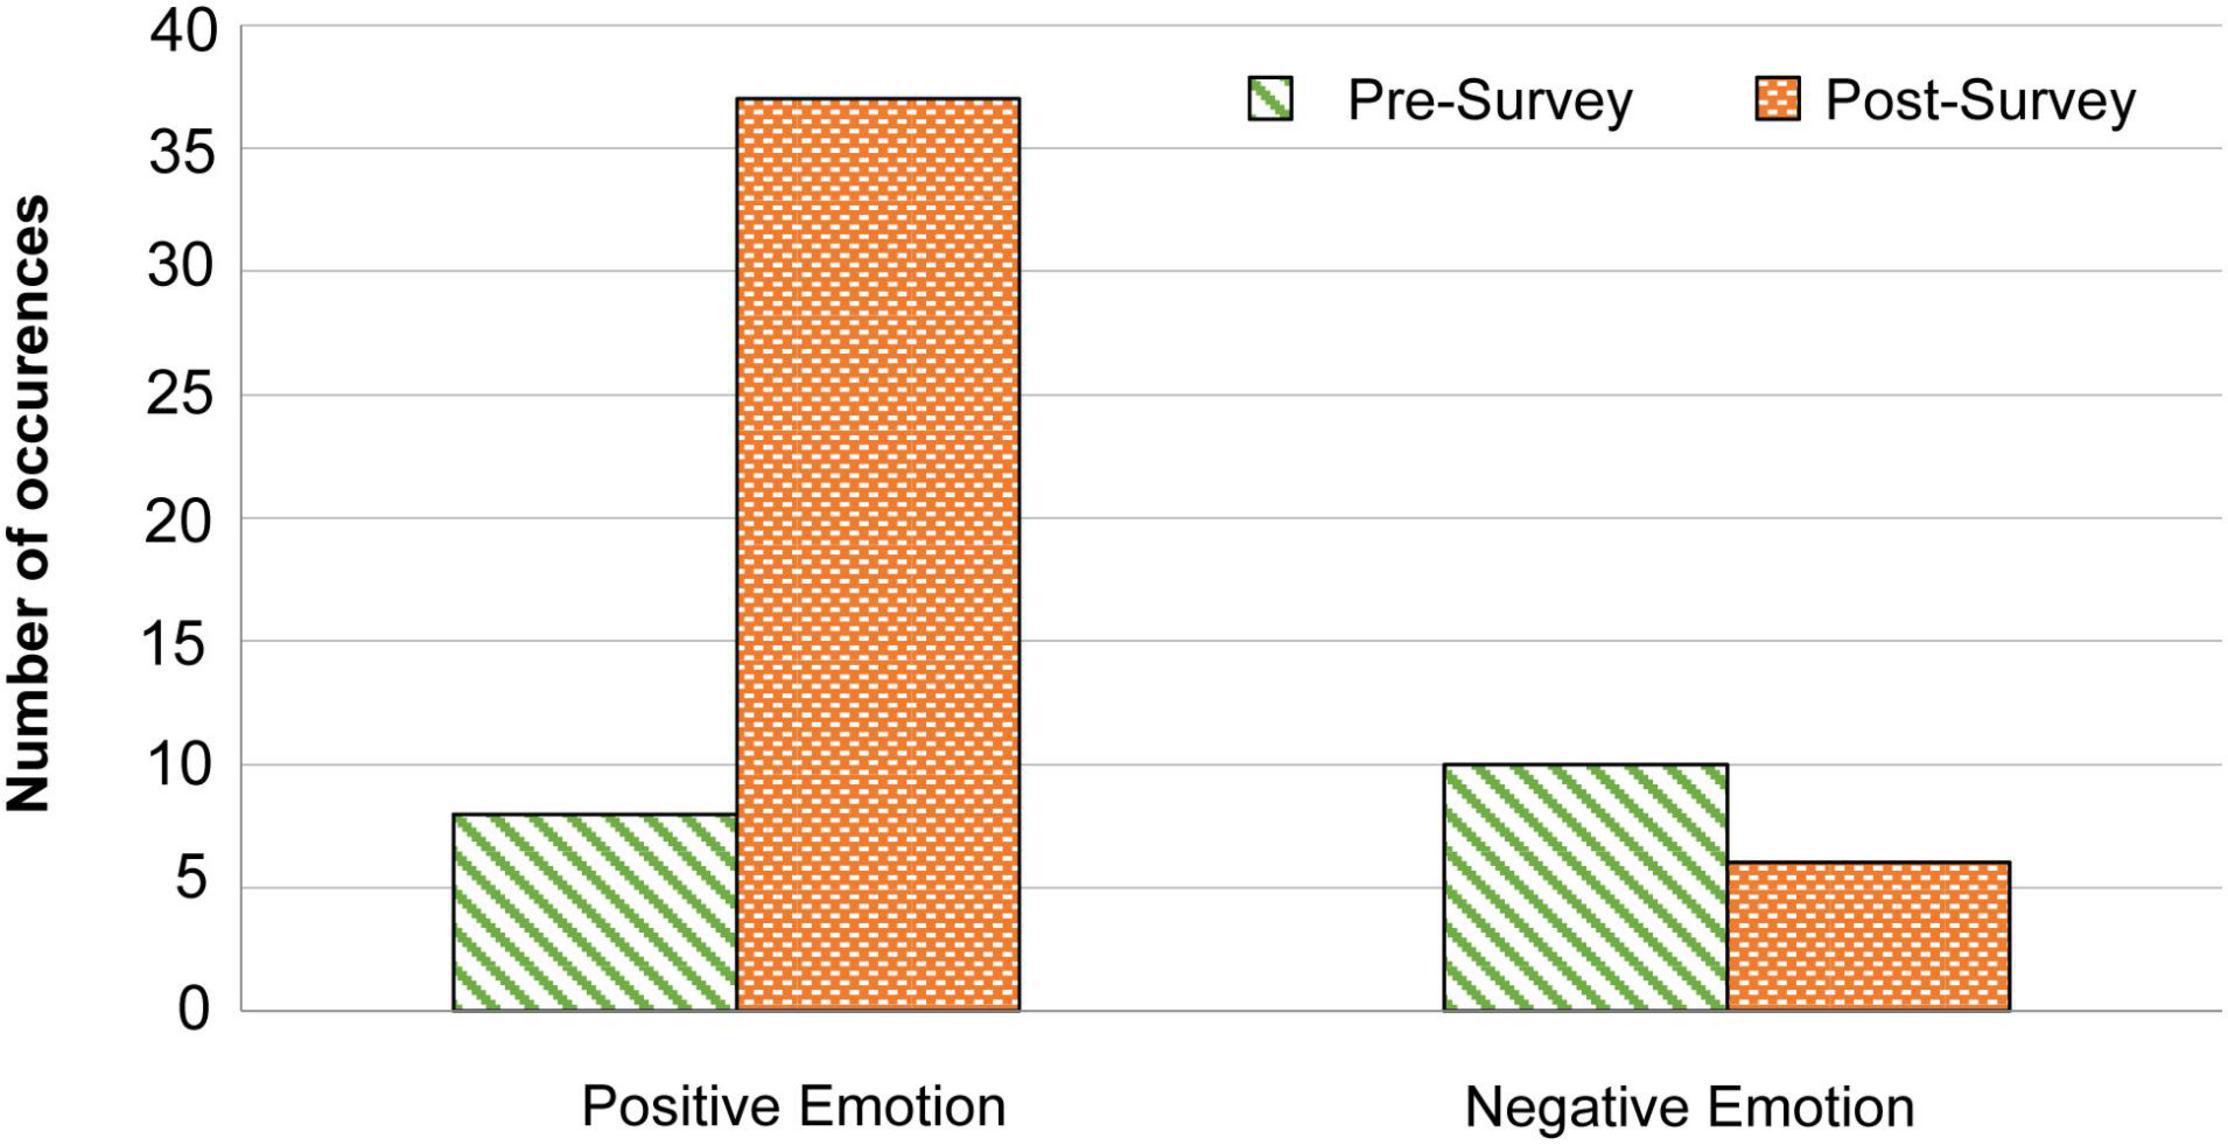
Figure 3. Frequency of engagement sub-categories, positive and negative emotion. Results depicting the frequency of positive and negative emotions found in question 1 of the pre and post survey. These emotions were coded through thematic analysis of question 1, which asked students to “write and/or draw what you think of when you hear the word science.”
Emoji Scale
All respondents on both the pre and post survey answered the emoji scale question, and several students chose multiple emojis. There were 51 emojis selected in the pre survey and 49 selected in the post survey. Prior to the program, the majority of students reported feeling excited (43% of responses) and happy (24% of responses) toward science. After the program, there was an increase of 16.1% of students who reported feeling excited toward science, which was the largest change across all the emoji choices from pre to post survey. In addition, there was a decrease of 5.1% in students who reported being happy, a decrease of 7.6% of students who reported being confused, a decrease of 1.6% in students who reported being bored, and a decrease of 5.7% in students who reported being shocked. No students chose the emoji representing sadness in either the pre or post survey.
No students reported feeling angry in the pre survey, however two students did post-program—an increase of 4.1%. The changes in percentage of emoji selection from pre to post survey can be found in Figure 4.

Figure 4. Emoji selection pre to post survey. Results depict the percentage of frequency that each emoji was selected during pre and post surveys. Students were asked to select an emoji describing how science made them feel. Total number of occurrences of each emoji was divided by the total amount of emoji selections to determine percentage out of 100%. Pre survey had a total of 51 emojis selected, and post survey had 49. All emojis designed by OpenMoji.
Science Engagement and Skills
Questions one through five, taken from the Noyce Enthusiasm Scale (Mielke et al., 2002), were statements assessed alongside each other as seen in Figure 5. In these questions, frequencies “strongly agree” and “agree” represent students who reported a high or moderate enthusiasm toward science, while “disagree” and “strongly disagree” represent students who reported little or no enthusiasm toward science. Cronbach alpha for these statements were calculated to be 0.83 and 0.83 for pre and post survey, respectively.
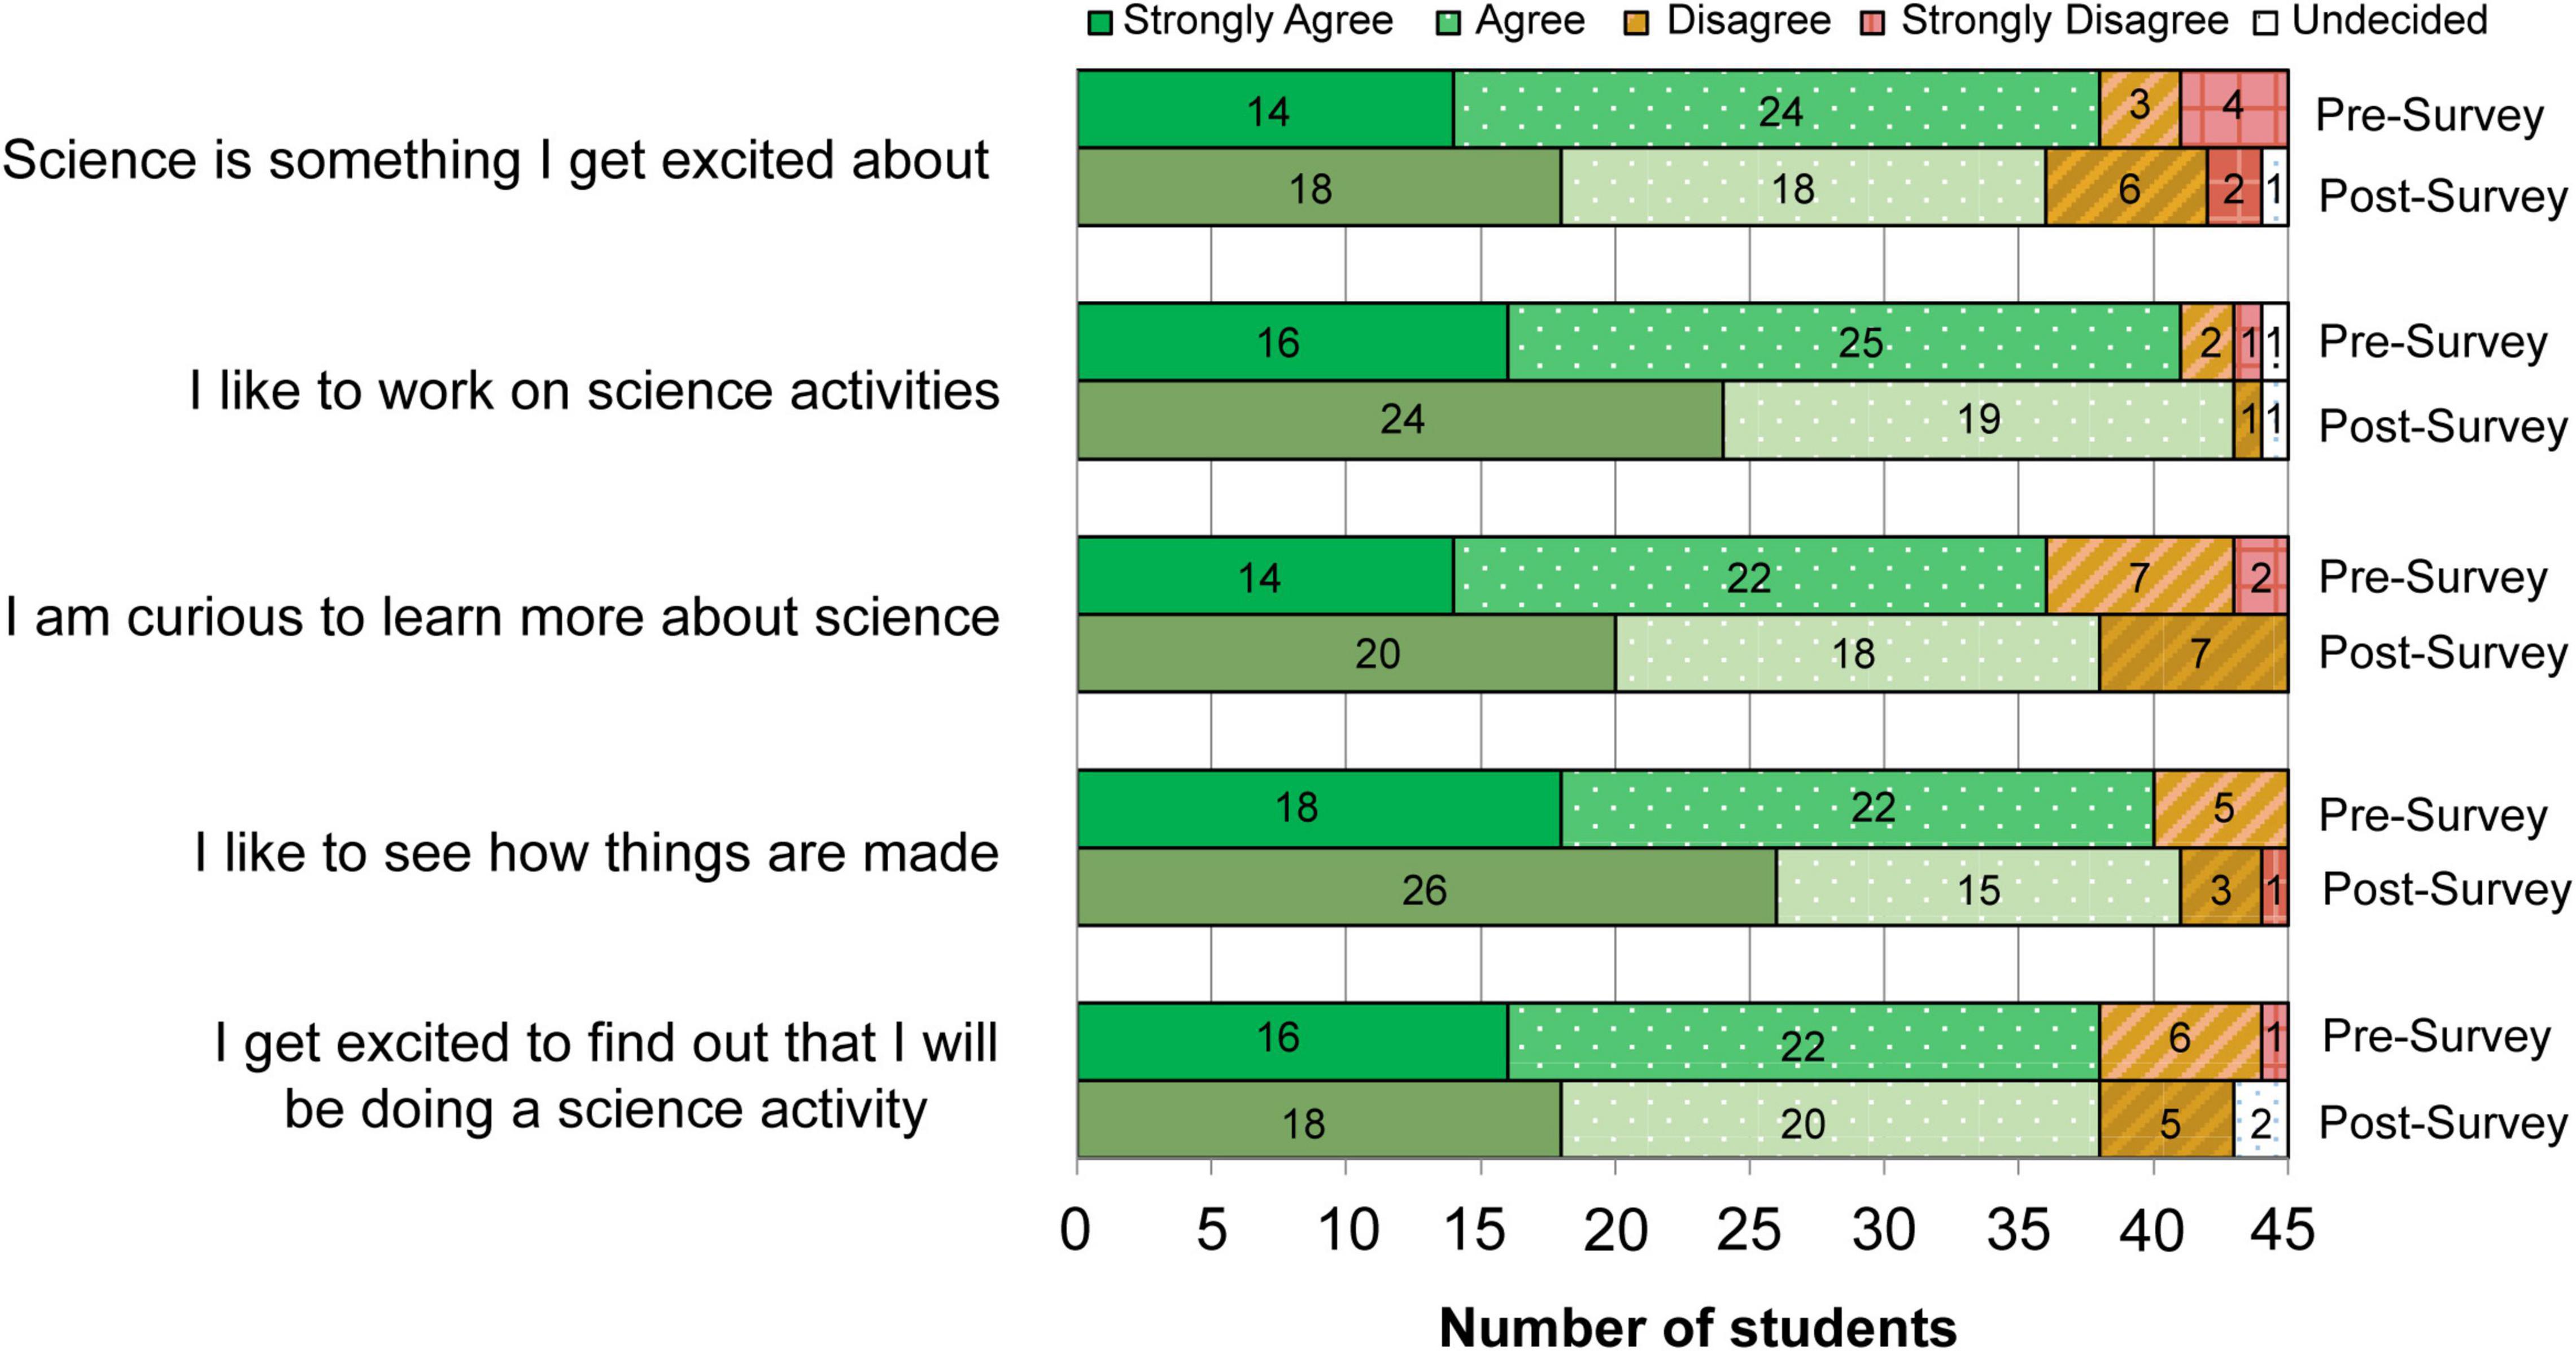
Figure 5. Noyce enthusiasm for science statements. Results from the questions that evaluate enthusiasm toward science learning. Demonstrates the number of students that selected each answer. Pre and post survey answers are stacked directly, respectively, on top of each other for each question. Cronbach alpha 0.831 and 0.827 for pre and post survey, respectively.
Following the “Mission to Mars” program, there was an overall increase in students who reported a high level of enthusiasm toward science, and a decrease in students who reported a moderate level of enthusiasm. The largest change occurred for the statement “I like to see how things are made,” which had a decrease of seven occurrences of “disagree,” and the frequency of “strongly agree” increased by eight. Generally, all statements showed a decrease in students who reported having little to no enthusiasm for science post-program.
Statements six and seven were adapted from the Children’s Science Curiosity Scale (Harty and Beall, 1984) and were assessed alongside each other in Figure 6. In these questions, frequencies of “strongly agree” and “agree” represent students who reported a high or moderate curiosity toward science, while “disagree” and “strongly disagree” represent students who reported little or no curiosity toward science. Cronbach alpha for these statements were calculated to be 0.83 and 0.83 for pre and post survey, respectively.
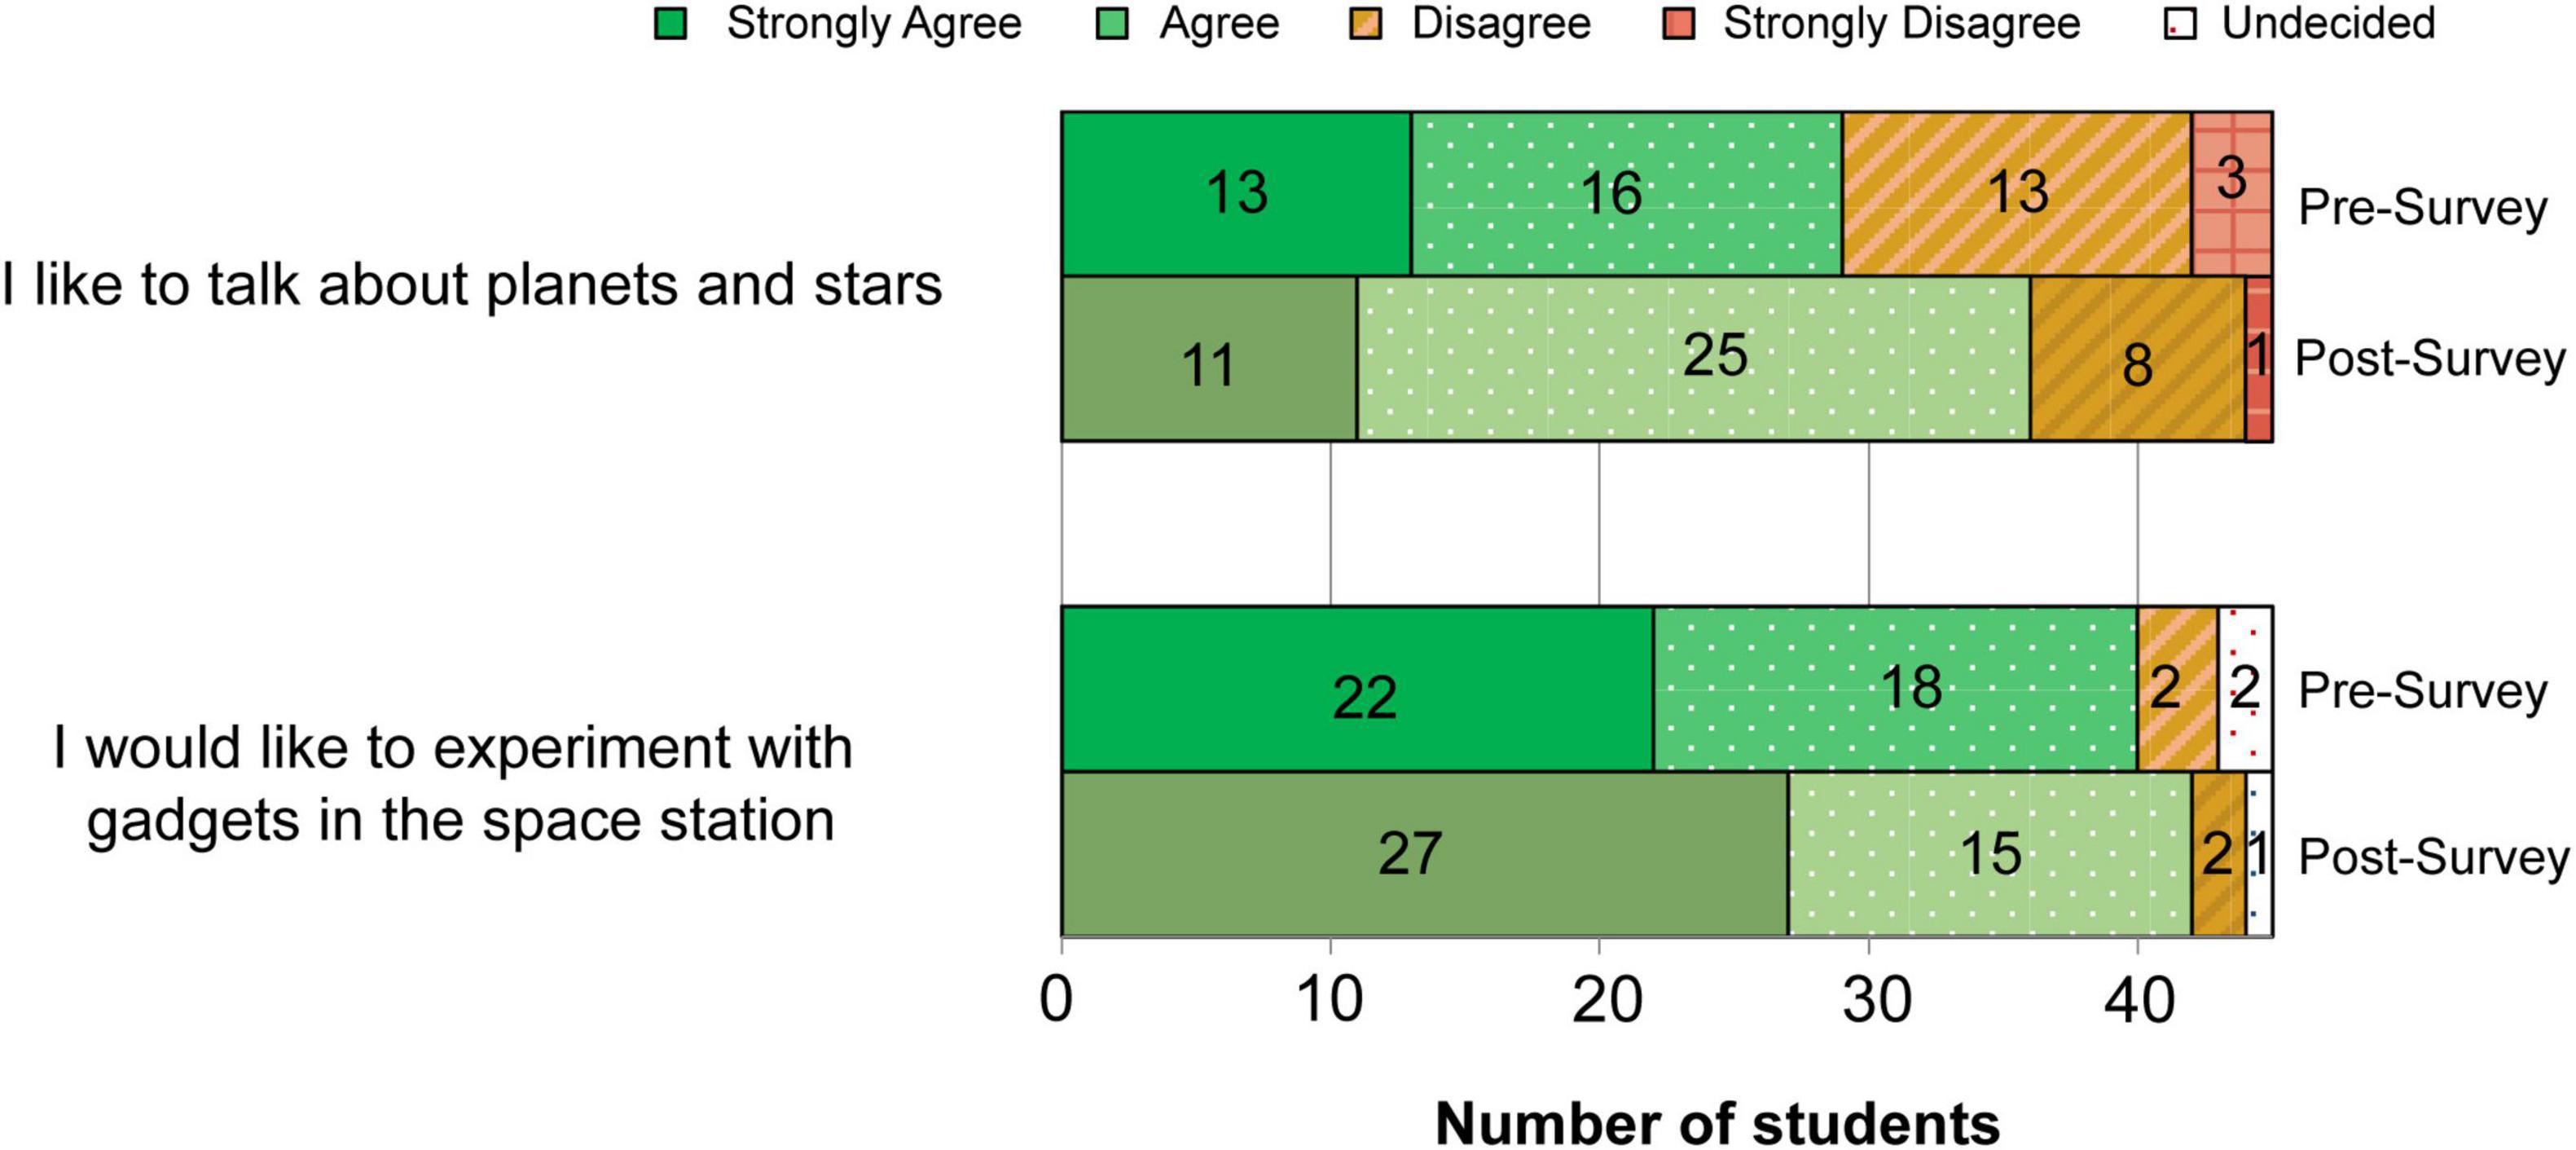
Figure 6. Children’s science curiosity scale statements. Results from the questions that assess student curiosity toward science learning from Harty and Beall (1984). Demonstrates number of students that selected each answer. Pre and post survey answers are stacked directly, respectively, on top of each other for each question.
Responses for both statements showed that students had curiosity for science prior to the program, which increased post-program. Prior to the program, students agreed with the statement “I like to talk about planets and stars,” the most, with 29 out of 45 students choosing “agree” or “strongly agree.” When comparing both statements, “I would like to experiment with gadgets in the space station” had a greater number of students who agreed or strongly agreed in comparison to “I like to talk about planets and stars” in both the pre and post survey. There were more students however who strongly agreed or agreed that they like to talk about planets and stars from pre to post survey, as the frequency increased by nine. Both statements saw an increase in the number of students who agreed and strongly agreed, and a decrease in students who disagreed, strongly disagreed, and who were undecided from pre to post survey.
The four statements found in Figure 7 were used to assess students’ critical thinking, adapted from Mielke et al. (2002). In these questions, frequencies of “strongly agree” and “agree” represent students who reported high or moderate scientific critical thinking skills, while “disagree” and “strongly disagree” represent students who reported little or no scientific critical thinking skills. Cronbach alpha for these statements were calculated to be 0.66 and 0.4 for pre and post survey, respectively.
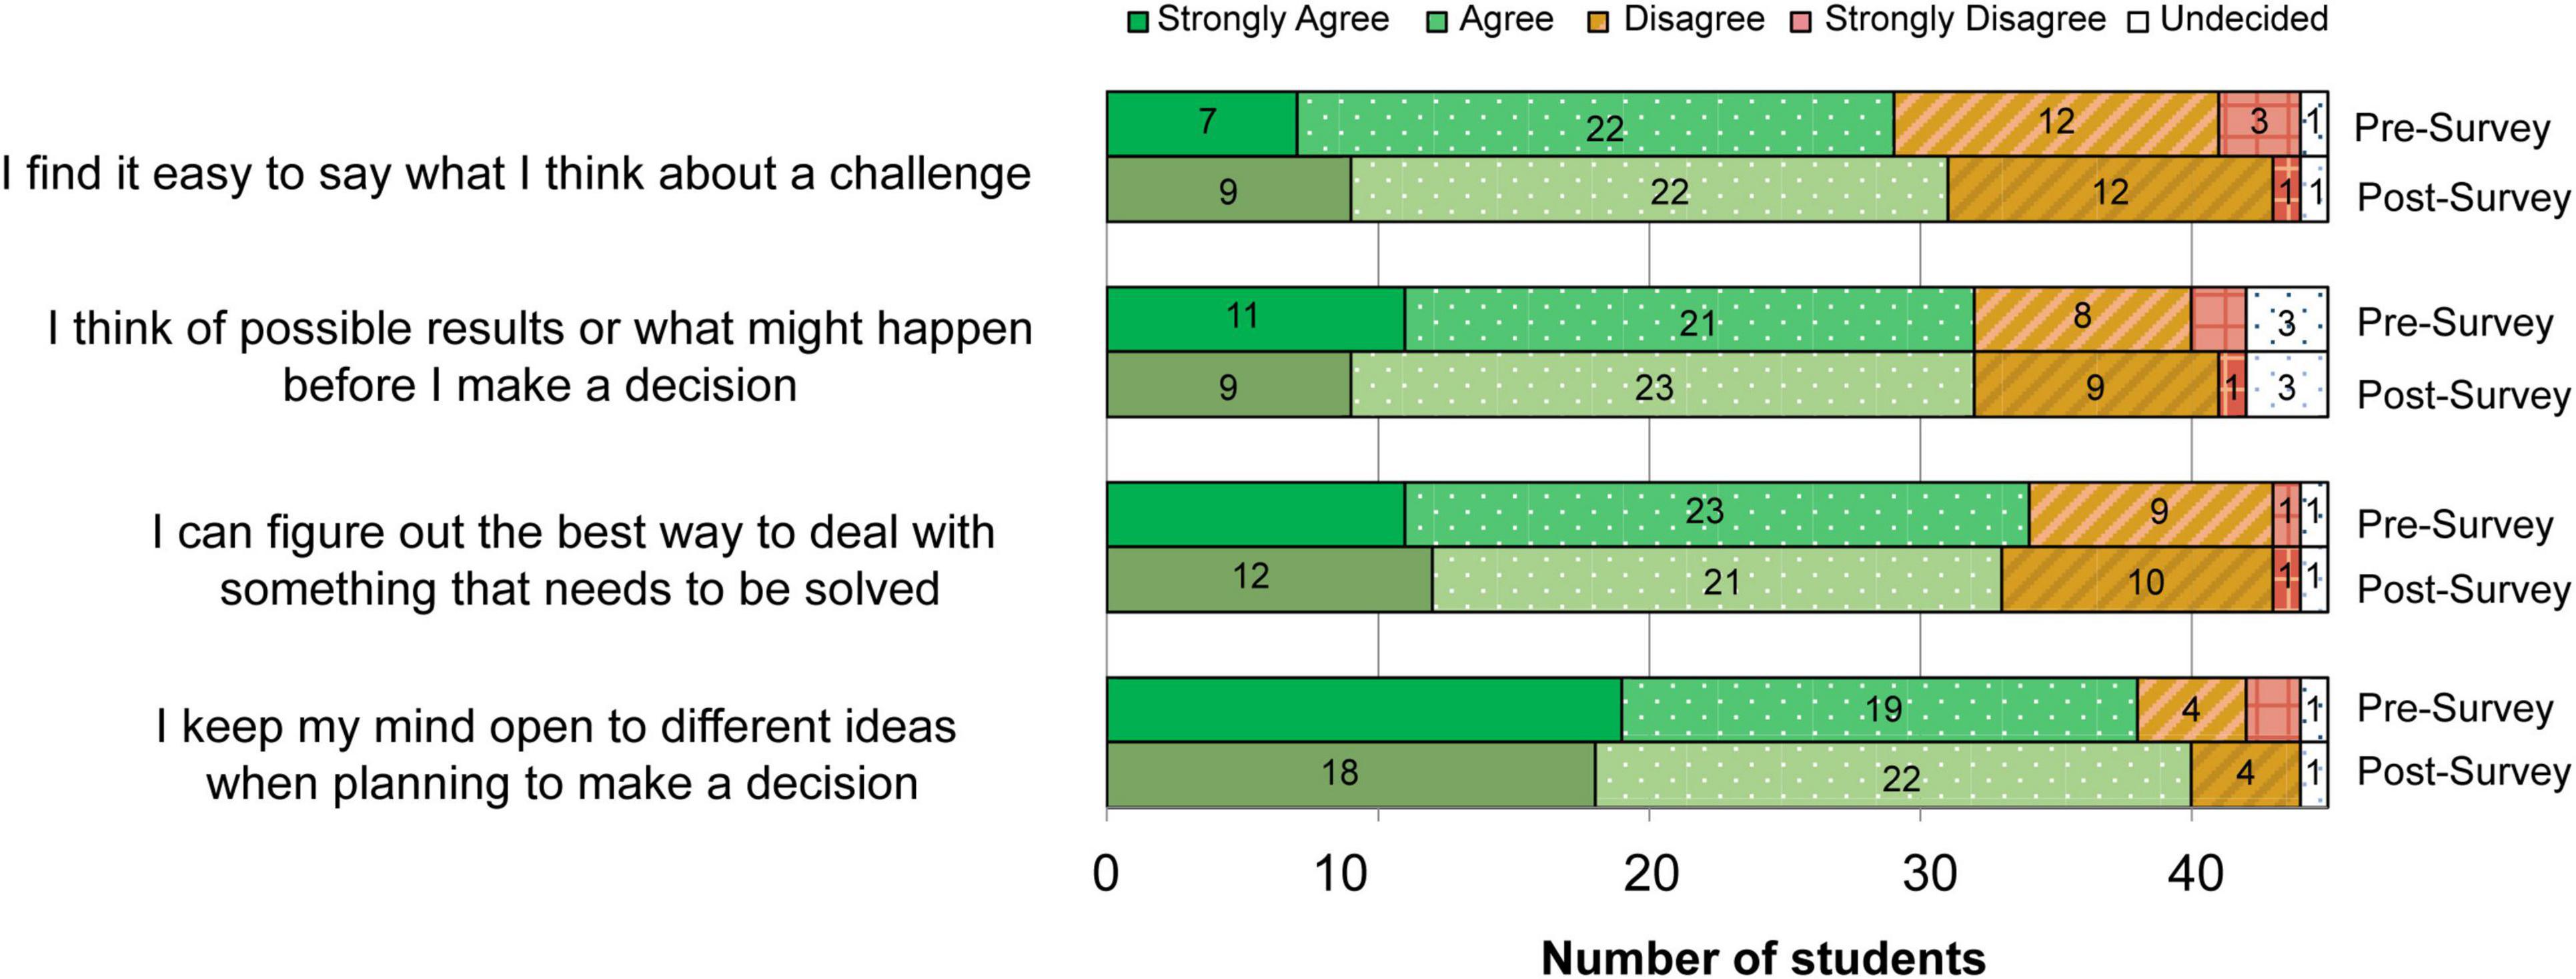
Figure 7. Critical thinking statements. Results from the questions that evaluate critical thinking in science learning adapted from Perkins and Mincemoyer (2002). Demonstrates number of students that selected each answer. Pre and post survey answers are stacked directly, respectively, on top of each other for each question. Cronbach alpha 0.826 and 0.831 for pre and post survey, respectively.
Overall, the majority of students reported that they had critical thinking skills before and after the program. The statement which students agreed or strongly agreed with the most was that they can keep their minds open to different ideas when planning to make a decision, and this statement saw the largest increase from pre to post survey. The number of students who strongly agreed or agreed that they find it easy to say what they think about a challenge increased, while students who think of possible results or what might happen before they make a decision remained the same from pre to post. This statement saw the highest number of undecided remaining at three students from pre to post. There was a decrease in the number of students who agreed or strongly agreed that they can figure out the best way to deal with something that needs to be solved.
The final five survey questions asked students to agree or disagree with statements that assessed experimentation skills, the results of which can be found in Figure 8. Overall, the majority of students (ranging from 30 to 41 responses out of 45) reported that they could do all five experimentation actions. The action that most students reported being able to accomplish is doing an experiment to answer a question. The action that students reported being able to do the least was explaining why things happen in an experiment. From pre to post survey, there was an increase in students reporting that they could complete four of the five experimental actions. The only experimental action with a decrease was being able to tell others how to do an experiment. Of all of the survey questions, these experimentation statements had the highest frequency of students selecting “undecided” as their responses.
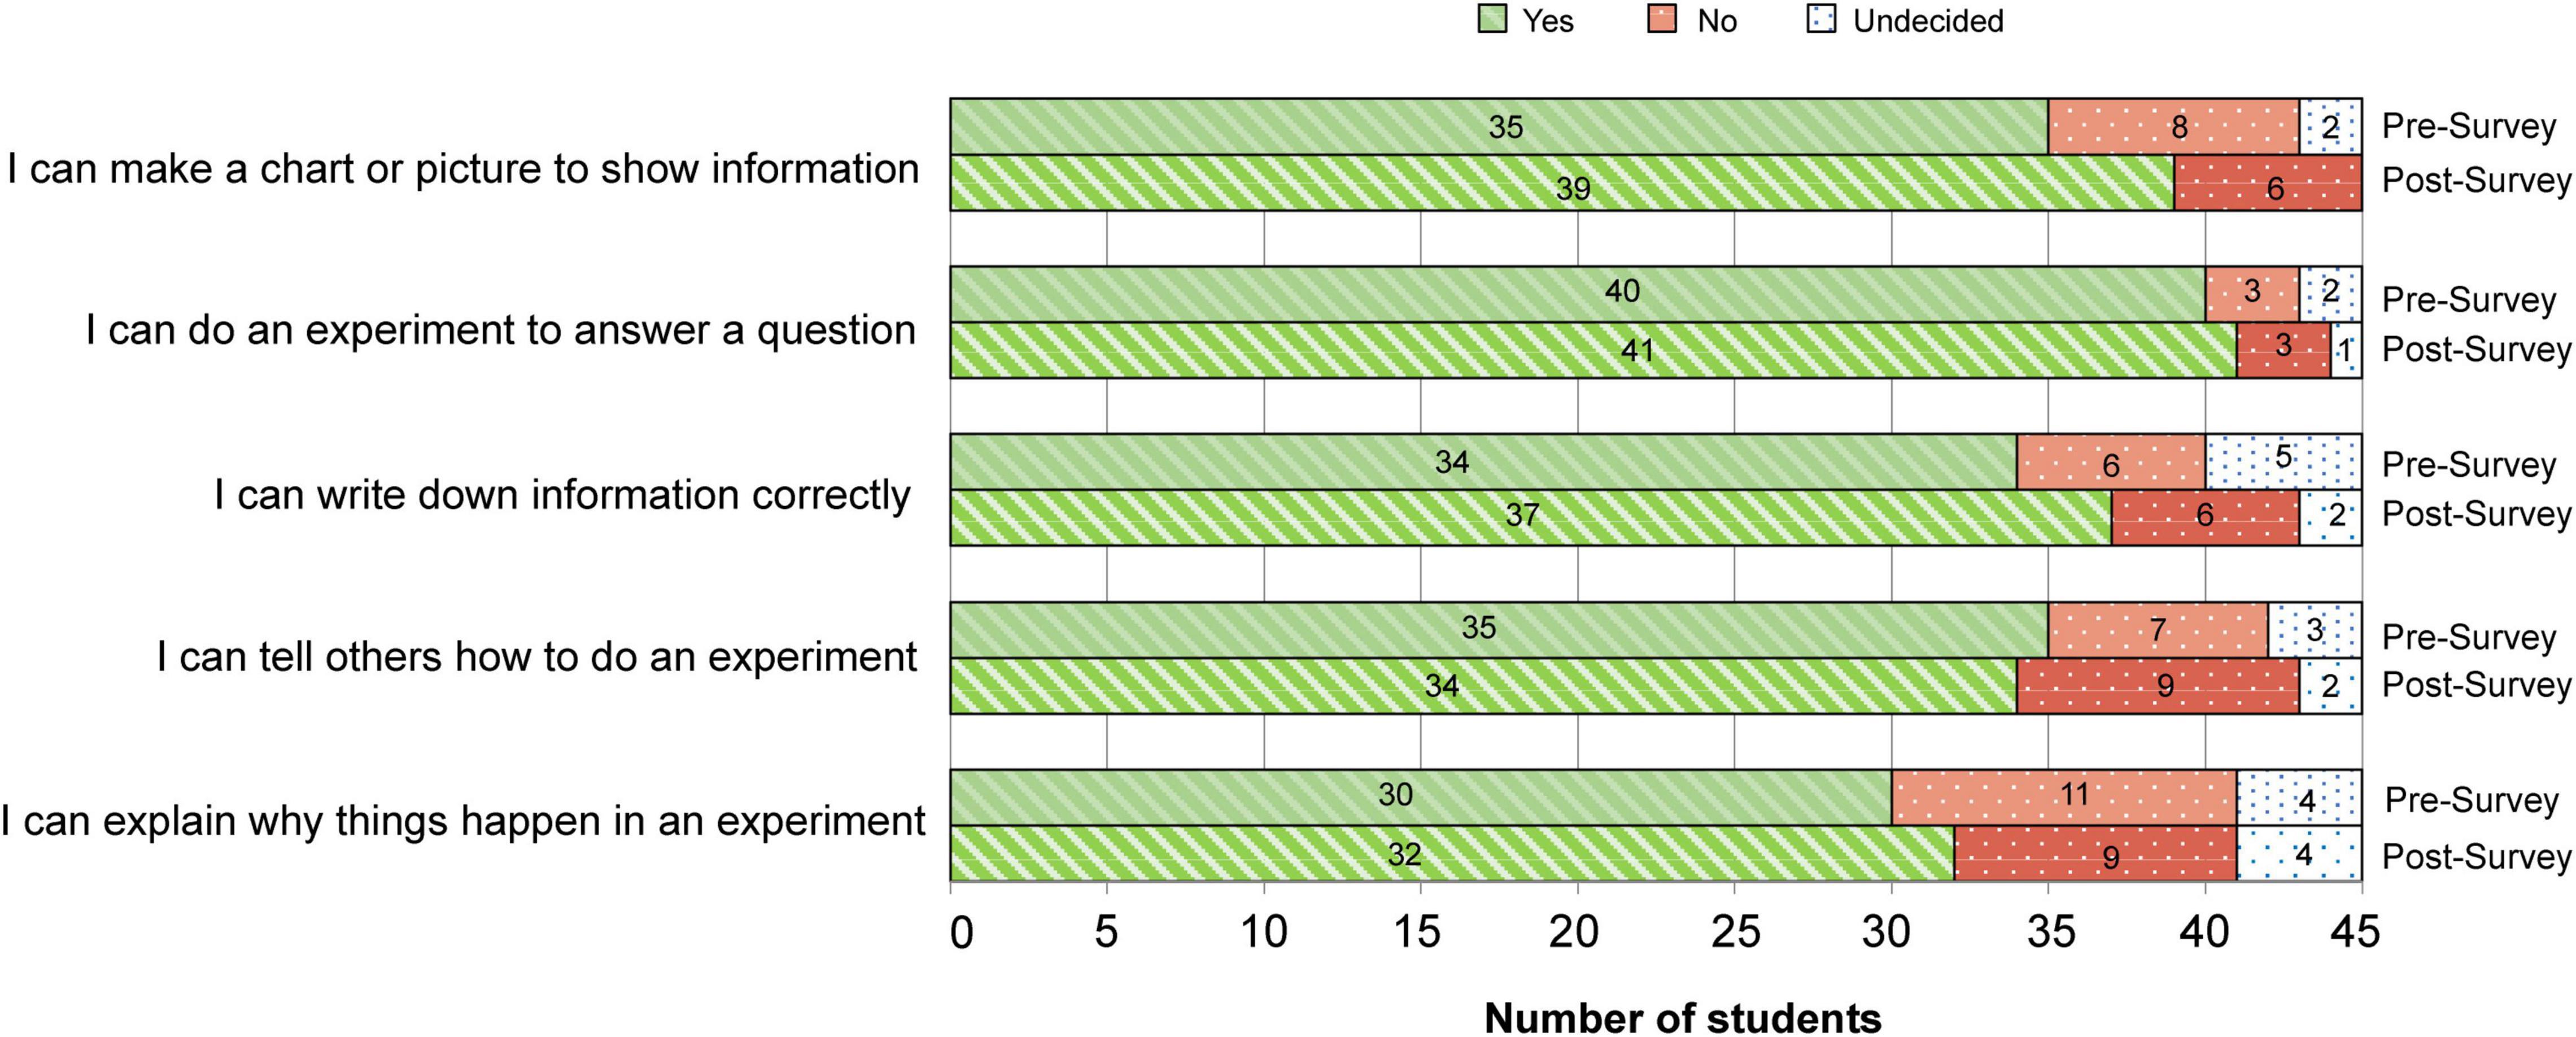
Figure 8. Science process skills inventory statements. Results from the questions that assess experimentation adapted from Arnold and Bourdeau (2009). Demonstrates number of students that selected each answer. Pre and post survey answers are stacked directly, respectively, on top of each other for each question. Cronbach alpha 0.659 and 0.4 for pre and post survey, respectively.
The overall numerical mean scores for each set of questions representing different engagement and skills, decreased from pre to post survey. This indicates that participants chose answers more toward “strongly agree” and “agree” post survey as these were given lower numerical values of 1 and 2 for data analysis in comparison to “disagree” and “strongly disagree” (numerical values of 3 and 4, respectively). Paired t-tests were run for each variable, as found in Table 5, and demonstrated no significant differences between students’ ratings from pre to post evaluation with a p-value at 0.05.
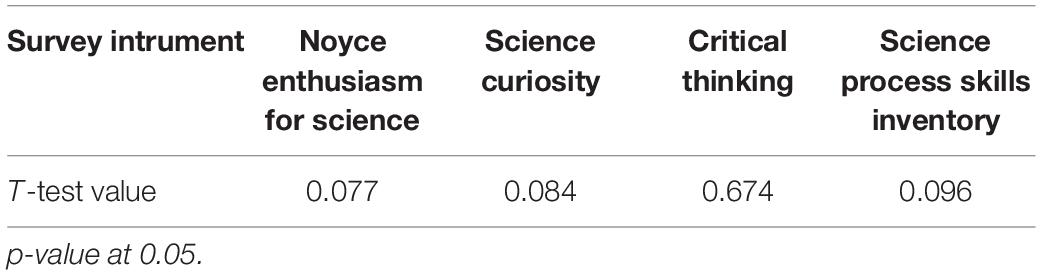
Table 5. Paired t-tests for survey instrument results.
Discussion
This study evaluated an in-school informal science outreach program in order to assess the impacts of such programming on student interest and engagement in science, and to explore the potential benefits of collaborations between formal and informal science institutions, specifically between schools and science centers.
In our evaluation, we found the logic model process valuable in clearly articulating the measurable student outcomes intended for the program. This step is a helpful starting point for program evaluation, assisting researchers in visualizing the resources being used on projects, the activities and participants in the programs, the intended outcomes, and how these aspects are inter-related. It is recommended that these logic models be created in partnership with schools to ensure the goals of both parties are being evaluated, thus supporting more valuable partnerships.
The logic model outlined the NSF Framework’s (Friedman, 2008) impact of knowledge, engagement, and skills. These program outcomes were evaluated using pre and post surveys. Overall, our study found the following impacts subsequent to student participation in the “Mission to Mars” program:
• an increase in student knowledge on the program topic (space), aligning with school-related curriculum goals,
• an increase in student engagement, as more students reported more positive emotions, feelings of excitement, and sense of wonder toward science, and
• a small increase in the number of students reporting they have skills in experimentation and critical thinking skills following the program.
The findings of the program’s impact on the NSF impact categories are described in more detail below.
Knowledge
Students mentioned the knowledge NSF impact category (Friedman, 2008) most frequently in the concept map question. The subject of “space” saw the greatest increase of occurrences after the “Mission to Mars” program. This program is based on space science and Mars exploration, which likely caused an increase in student knowledge of space-related themes. This increase can be considered a successful benchmark in the program as increased knowledge of STEM related topics is a goal outlined in the logic model. This result also supports school curriculum goals on increasing student knowledge about space concepts.
Chemistry had the highest frequency of occurrences in both pre and post surveys which mirrors findings by studies that use the “Draw a Scientist Test” developed by Chambers (1983); children most commonly associate scientists as working in a lab, with chemicals, and other chemistry related equipment (Barman, 1999; Steinke et al., 2007). Diverse influencers, like television, books, or the internet, shape learners’ views of science, or what a scientist is (Moje et al., 2004; Steinke et al., 2007), and students in the present study seemed to have similar preconceived notions of science, heavily focused on chemistry related themes as in these other studies. The frequency of the code “Bill Nye” supports this notion, as he is a well-known scientist figure that fits many stereotypes of a typical scientist found in the “Draw a Scientist Test.” The increase in biology related codes could be attributed to external factors like learning biology related topics in class between pre and post surveys.
Students completed our surveys in a formal learning environment, and the physical environment where learning takes places can impact what a leaner expects to happen (Falk and Dierking, 2018a). It could be speculated that they referred to prior experiences of knowledge reporting in a classroom setting, like doing a test for example, when completing these surveys. This may have led to more knowledge-based answers vs. other outcomes, like skills or engagement, within the open-ended concept map question.
Engagement
Engagement was the second most frequently coded NSF Framework impact category (Friedman, 2008) and was separated into two sub-categories: positive and negative emotion. There was an increase of 29 occurrences (from 8 to 37) of positive emotions following exposure to the “Mission to Mars” program, which could be an indication that the program had a positive impact on how students feel about science. From pre to post survey, the overall number of emotional words increased from 18 to 43. This increase could indicate that students were emotionally impacted by the program as they were not prompted to report emotions or feelings in this question.
The results of the emoji scale showed that feelings of excitement toward science increased following the program, and was the greatest increase across the emoji scale. Excitement affects motivation, which is a key characteristic of informal learning, and in creating long-term intrinsic interests in science long after programs are complete (Bell et al., 2009). Positive emotions are a beneficial outcome as student engagement in school science continues to suffer, especially near adolescence (Corrigan et al., 2018). In-school outreach programs can bridge this gap by sparking excitement and motivation for STEM learning. The Science North Program “Mission to Mars” incorporates many hands-on learning opportunities with specialized tools, such as virtual reality and sensor building experiment. These interactive experiences are added to the program with the intent to increase a sense of wonder and engagement from students, which may have been a factor in the change in student engagement. Many studies have demonstrated that interactive science experiences support learning across the six strands from NSF and “seem to spark interest and maintain learners’ engagement while also increasing knowledge and providing opportunities for reasoning” (Fenichel and Schweingruber, 2010). Recent studies investigating the use of virtual reality in science education suggest that its immersive aspect can increase motivation and engagement for learning science (Yamada-Rice et al., 2017; Fauville et al., 2020; Zhao, 2020).
Using the Noyce Enthusiasm Scale for Science statements (Mielke et al., 2002), the majority of students reported having a sense of wonder or enthusiasm toward science even before participating in the “Mission to Mars” program. This is likely from previous science learning, personal interest, or everyday experiences (Hein, 2009). Our results also suggest that students who initially reported a moderate sense of wonder toward science reported a higher sense of wonder as a result of their experience with the program. From pre to post program, nine students went from reporting feeling little to no enthusiasm toward the statement “I like to talk about planets and stars,” to feeling enthusiasm post-program. These emotional changes are important for brain functions like attention, reasoning, memory, and learning (Tyng et al., 2017), and positive emotions, like excitement and sense of wonder, can lead to further curiosity and long-term interest in science (Hein, 2009). The increase in positive emotions toward science may play a part in the cognitive abilities of students learning science concepts, and may spark long-term interest—a common goal across informal science programs. The Cronbach alpha results for the Noyce Enthusiasm for Science statements demonstrate a good internal consistency (0.83 and 0.83 for pre and post survey, respectively).
It is important to consider that reported emotions and affective outcomes may be influenced by a variety of factors, such as socioeconomic aspects, family life, or physiological needs like hunger (Tyng et al., 2017), and students may have had difficulties recognizing specific emotions they were feeling. For example, if a student was frustrated during the program due to teamwork issues or program difficulties, “angry” may have been selected in the post survey as “frustrated” was not an option. This could explain the two students who chose “angry” in the post survey. Similarly, the word “shocked” can be associated with surprise, and it is found in the negative opinion lexicon in the NRC Word-Emotion Association Lexicon (Mohammad and Turney, 2013), suggesting that shock or surprise might be a negative emotion to some students, possibly explaining why this emotion appeared less frequently in the post survey.
Skills
Skills had the second lower number of occurrences (“other” being the most frequent) of the NSF Framework (Friedman, 2008) impact categories we assessed with our survey. Friedman (2008) argues that although there is a difference between doing and knowing, learners may not be able to acknowledge or describe the skill they possess, and this may explain the few responses received for this outcome.
Experimentation
The number of students associating the skill of experimentation with science increased post-program, and experimentation was coded most frequently in the qualitative data because students wrote the word “experiment” on their concept maps. This increase post-program may not mean students felt their ability to conduct an experiment increased, but could suggest greater awareness that experimentation is part of the scientific process.
The ability to explain why things happen in an experiment was the skill least reported from the Science Process Skills Inventory (Arnold and Bourdeau, 2009) both pre and post. While more students were able to report being able to do an experiment to answer a question, fewer students reported being able to explain the “why” of an experiment. Similarly, Knaggs and Schneider (2012) determined that process understanding proceeds concept understanding, and in their study, students reported they had the skills required to complete experiments, but lacked the scientific reasoning skills to explain the phenomena that were occurring. They inferred that this higher-level thinking in science is a skill that takes time to develop, and so the single, short-term program evaluated in the present study may not have given the students enough exposure to these skills for there to be a noticeable change. A long-term study with frequent programs offered by in-school science outreach organizations would be needed to assess potential change in students’ reported science-based skills.
Within the “Mission to Mars” program, student experimentation skills were tested through building and launching sensor protection devices, which could have caused the increase in experimentation codes within the concept map. While students may have understood that they needed to construct a device that protects their sensor during launch, perhaps there was a lack of information within the program regarding why this process was being done, and the larger implications (i.e., a more protected sensor means the rover can successfully land on Mars and deliver). This could explain for the lower number of students self-reporting that they could explain why things happen in an experiment.
Critical Thinking
The majority of students self-reported that they were able to do several critical thinking actions pre-program, and the frequency of students reporting that they could do these actions post-program showed little change. Within the program, students critical thinking skills were challenged through spending a budget on materials for their sensory protection device, and through planning, designing, and testing their device. Students were challenged to alter the device so that it would cause the lowest impact (gravitational force), thus protecting the sensor inside. While the program intended to see a change in student critical thinking skills, according to Piaget’s theory of cognitive development, children develop abstract reasoning skills between the ages of 11 and 16, including the development of critical thinking skills (Piaget and Inhelder, 1972). Our student participants were in Grade 5 and 6 (10 and 11 years of age), suggesting that they may have just started developing these critical thinking abilities. While these survey instruments were intended for the age range of this study, further research could utilize a similar method with older students to determine if there is a greater change in critical thinking and experimentation understanding. The Cronbach alpha results for the Science Process Skills Inventory statements demonstrate poor internal consistency (0.66 and 0.40 for pre and post survey, respectively). This result demonstrates that these statements may not be consistent with one another in measuring critical thinking and thus these statements may not effectively evaluate critical thinking.
Paired t-tests were run for each survey instrument variable and demonstrated no significant differences between students’ ratings from pre to post evaluation with a p-value at 0.05. We can speculate that the lack of significant difference has been impacted by a small n as this can diminish power when comparing these types of data sets. This, however, does not mean the program did not have impact on the students, and when we consider the goals of informal science programs like this, each piece of science communication is meant to add impact over exposure, over time. The results show an upward trend of students self-reported science awareness, positive emotional response, and enthusiasm and curiosity toward science. From this, we can conclude that more research needs to be done in depth to strengthen the reliability and validity of these findings.
Implications
Teachers face barriers in implementing inquiry-based science into classrooms, however, incorporating informal science learning through in-school outreach may address time-restraints, funding, and lack of technical skill (Davis, 2003; Schwarz and Stolow, 2006; Stocklmayer et al., 2010). These partnerships echo the recent push for an “ecosystem-based” approach to science education, allowing learners access to a network of intersecting science learning opportunities, creating a rich science learning experience (Falk and Dierking, 2018b). Informal science organizations’ partnerships with formal education institutions could especially benefit under-served and rural schools as they may encounter more barriers and have even less resources to incorporate inquiry-based learning into classrooms (Bell et al., 2009; Bevan et al., 2010).
Evaluating the impacts of in-school science outreach demonstrates the potential benefits and outcomes of this type of programming on students’ knowledge, engagement, and skills in science, further solidifying the role that these science center-based in-school learning opportunities can have.
Limitations
Sample Size
By evaluating a single program within a single school board, we recognize that the results cannot be used to make inferences about entire populations of students participating in Science North programs, and without a control group, it is difficult to determine other factors that may have influenced the changes we documented with this sample. We saw a large reduction in sample size (Figure 9) from an expected 240 students to 45 students mostly due to consent requirements.
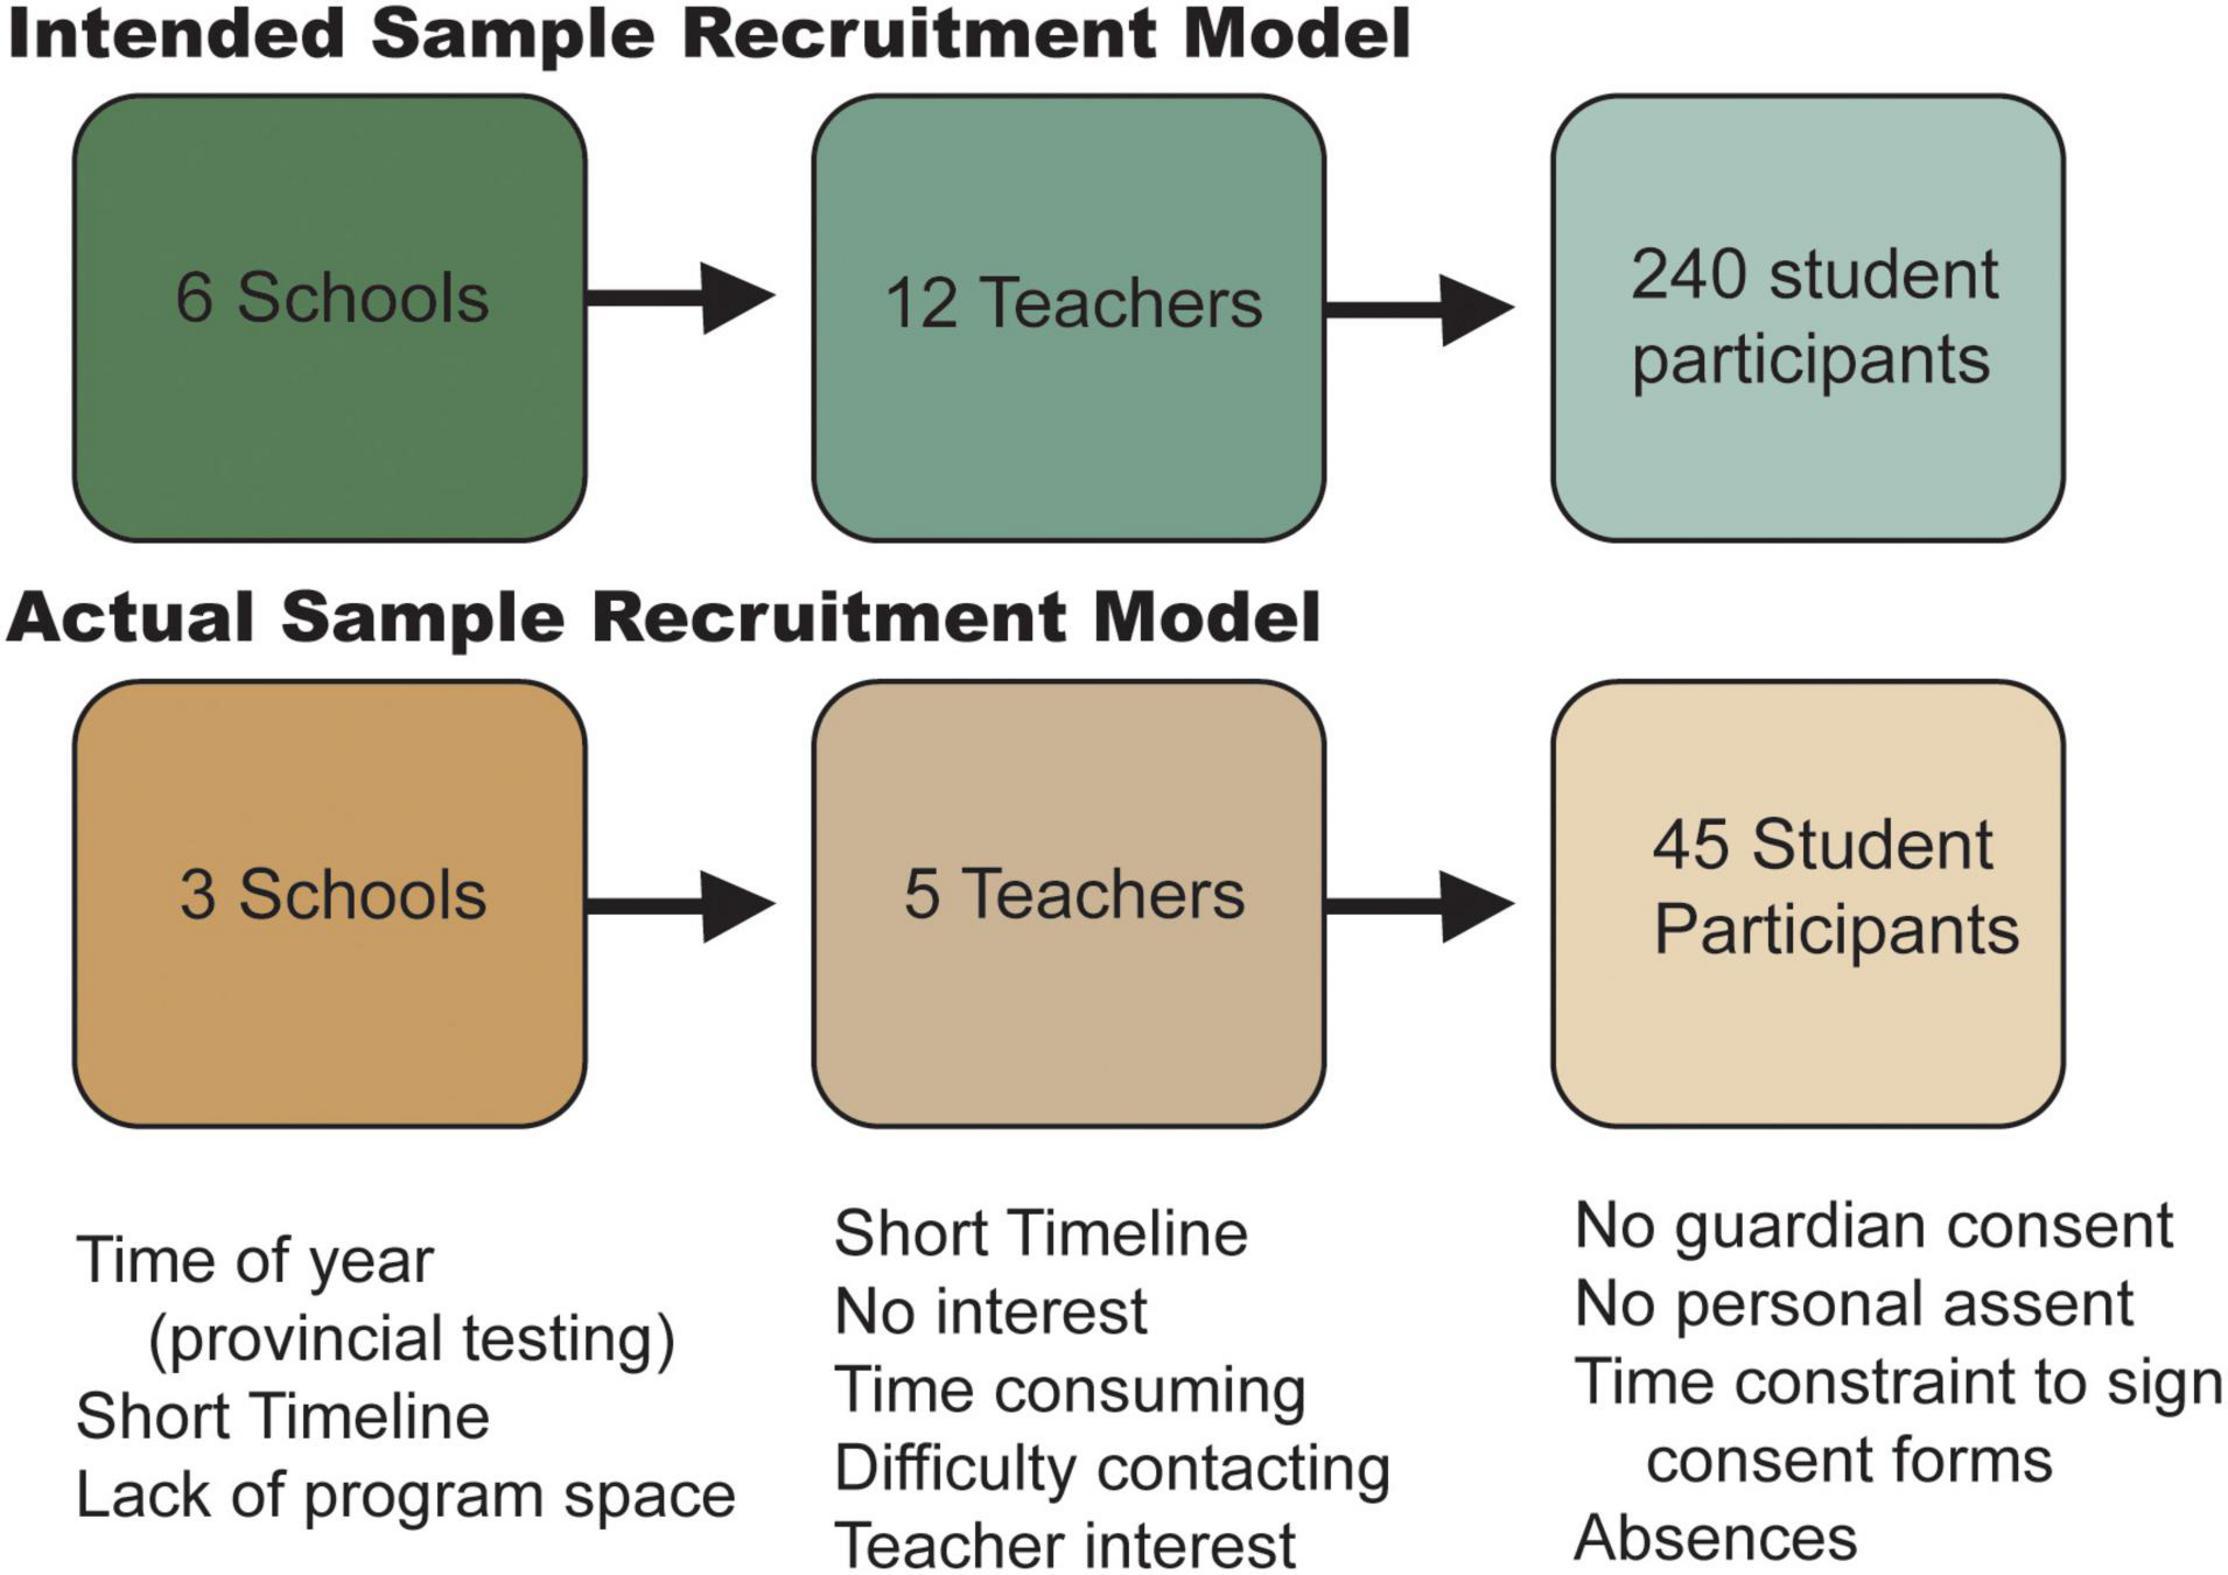
Figure 9. Sample attrition model. Model demonstrating the loss of potential participants at each step of the recruitment process. The top diagram models the optimum flow of recruitment, ending with 240 student participants, while the bottom demonstrates the actual flow of recruitment along with reasons for potential participant attrition below each step.
Concept Map Method
Student concept map drawings were interpreted as icons, or what they appeared to represent physically at surface level, and were translated into single words or phrases. Interpreting a drawing strictly on physical resemblance can lose the complex, deeper meaning that could have been intended. Türkcan (2013) assessed drawings by children and found that even among similar drawings, students had different mental models of what these images meant. This deeper level assessment of student drawings, as well as the actual organization and layout of the concept maps, would be an interesting analysis for future studies to gain a deeper understanding the impact of in-school outreach programs.
Use of Emoji Scale
Emoji scale results demonstrated that students chose multiple emojis, indicating feelings of more than one emotion toward science. In addition, the emoji representing sadness was not chosen in either the pre or post survey, indicating that this may not be an emotion commonly felt toward science. Future use of emoji scales in studies with children should take these findings into consideration when designing such scales.
Interval of Time Between Pre- and Post-surveys
A 7-day interval between the pre-survey and the in-school outreach program, followed by another 7-day interval before the post-survey allowed other variables to potentially affect students’ self-reported outcomes, including additional science lessons and discussions about the Science North program. While these other learning opportunities and events support the notion of a science learning eco-system, it creates difficulties in determining the direct outcomes of specific program interventions.
Additional Methods of Data Collection
Other methods of data collection such as interviews and focus groups, although not feasible during this study due to time constraints, are certainly desirable for a study examining what student experiences lead to changes in their experimentation skills, critical thinking skills, and their sense of wonder. Future investigations could consider such methods of data collection to gain a deeper understanding of the students’ perspectives following in-school outreach programs.
Conclusion
In-school science outreach is a unique form of informal science education, done in collaboration with formal institutions, that can positively impact students’ science knowledge, engagement, and skills. Research investigating the outcomes of these programs can further support the inclusion of science center-led, in-school outreach science programs in science classrooms.
Our study evaluated an in-school science outreach program through a case study of the Science North program “Mission to Mars.” The use of a logic model to establish program goals and outcomes was valuable in this evaluation and is recommended for other institutions. The logic model we created can be used as a template for other organizations doing similar in-school informal science outreach. It is recommended that these be created in partnership with schools to create mutually beneficial programs with student outcomes that align with goals of all organizations involved. We used the logic model to determine student changes in outcomes that align with the NSF Framework (Friedman, 2008) impact categories of knowledge, skills, and engagement, which are also related to Science North strategic goals of increasing: (1) experimentation, (2) critical thinking, and (3) sense of wonder.
Our pre and post surveys demonstrated increased student knowledge on the program topic, aligning with school-related curriculum goals. Students self-reported higher engagement levels through an increase in positive emotions and feelings of excitement toward science following exposure to the program. The Science North outcome of sense of wonder, aligning with our evaluation of student curiosity for science, increased following post-program, and sense of wonder toward space-related science also increased. Increases in students’ positive emotion toward science could, in the short-term, increase student motivation toward science, leading to long-lasting interests in science. Finally, only a small number of students reported an increase in skills such as experimentation and critical thinking post-program. These skills take time to develop, and it can be argued that the single, short-term program evaluated in this study did not provide the students with enough exposure for them to self-report a change, and at ages 10–11, they may be in the initial stages of gaining, and recognizing these important skills in relation to science.
Integrating inquiry-based methods of teaching into classrooms may be challenging for some schools, but partnering with an informal science institution, like a science center, can bring engaging science learning opportunities for students. Evaluating the impacts of in-school science outreach helps demonstrate measurable outcomes on students’ science learning and engagement with science topics, while providing empirical evidence of the potential benefits of these science center-led programs to formal science education.
Data Availability Statement
The raw data supporting the conclusions of this article will be made available by the authors, without undue reservation.
Ethics Statement
The studies involving human participants were reviewed and approved by the Laurentian University Research Ethics Board. Written informed consent to participate in this study was provided by the participants’ legal guardian/next of kin.
Author Contributions
KR conducted the study, drafted the manuscript with guidance, and edited contributions from CB (research supervisor), and KP (co-supervisor). All authors contributed to the article and approved the submitted version.
Conflict of Interest
The authors declare that the research was conducted in the absence of any commercial or financial relationships that could be construed as a potential conflict of interest.
Publisher’s Note
All claims expressed in this article are solely those of the authors and do not necessarily represent those of their affiliated organizations, or those of the publisher, the editors and the reviewers. Any product that may be evaluated in this article, or claim that may be made by its manufacturer, is not guaranteed or endorsed by the publisher.
Supplementary Material
The Supplementary Material for this article can be found online at: https://www.frontiersin.org/articles/10.3389/feduc.2022.675306/full#supplementary-material
References
Afterschool Alliance (2011). STEM Learning in Afterschool: An Analysis of Impact and Outcomes. Washington, DC: Afterschool Alliance.
Arnold, M. E., and Bourdeau, V. D. (2009). The Science Process Skills Inventory (SPSI). Corvallis, OR: Oregon State University.
Barman, C. (1999). Students’ views about scientists and school science: engaging K-8 teachers in a national study. J. Sci. Teacher Educ. 10, 43–54. doi: 10.1023/A:1009424713416
Beck, M., Morgan, E., Strand, S., and Woolsey, T. (2006). Volunteers bring passion to science outreach. Science 314, 1246–1247. doi: 10.1126/science.1131917
Bell, P., Lewenstein, B., Shouse, A. W., and Feder, M. A. (eds) (2009). Learning Science in Informal Environments: People, Places and Pursuits. Washington, DC: The National Academies Press, doi: 10.17226/12190
Bevan, B., Dillon, J., Hein, G. E., Macdonald, M., Michalchik, V., Miller, D., et al. (2010). Making Science Matter: Collaborations Between Informal Science Education Organizations and Schools. A CAISE Inquiry Group Report. Washington, D.C: Center for Advancement of Informal Science Education (CAISE).
Bevan, B., and Semper, R. J. (2006). Mapping Informal Science Institutions Onto the Science Education Landscape. Exploratorium. Available online at: https://www.researchgate.net/publication/255581833_Mapping_Informal_Science_Institutions_onto_the_Science_Education_Landscape (accessed February 18, 2022).
Bonney, R., Hellenga, R., Luke, J., Marcussen, M., Palmquist, S., Phillips, T., et al. (2011). Principal Investigator’s Guide: Managing Evaluation in Informal STEM Education Projects. Available online at: https://www.informalscience.org/sites/default/files/caisevsapi_guide.pdf (accessed February 18, 2022).
Braun, V., and Clarke, V. (2006). Using thematic analysis in psychology. Qual. Res. Psychol. 3, 77–101. doi: 10.1191/1478088706qp063oa
Burks, W. A. (1949). Icon, index, and symbol. Philos. Phenomenol. Res. 9, 673–689. doi: 10.2307/2103298
Chambers, D. (1983). Stereotypic images of the scientist: the draw-a-scientist test. Sci. Educ. 67, 255–265. doi: 10.1002/sce.3730670213
Corrigan, D., Buntting, C., Jones, A., and Loughran, J. (2018). Navigating the Changing Landscape of Formal and Informal Science Learning Opportunities. Berlin: Springer International Publishing, doi: 10.1007/978-3-319-89761-5
Davis, K. (2003). Change is hard: what science teachers are telling us about reform and teacher learning of innovative practices. Sci. Educ. 87, 3–20. doi: 10.1002/sce.10037
Devictor, V., Whittaker, R., and Beltrame, C. (2010). Beyond scarcity: citizen science programmes as useful tools for conservation biogeography. Divers. Distrib. 16, 354–362. doi: 10.1111/j.1472-4642.2009.00615.x
DeWitt, J., and Osborne, J. (2007). Supporting teachers on science-focused school trips: towards an integrated framework of theory and practice. Int. J. Sci. Educ. 29, 685–710. doi: 10.1080/09500690600802254
DeWitt, J., and Storksdieck, M. (2008). A short review of school field trips: key findings from the past and implications for the future. Visit. Stud. 11, 181–197. doi: 10.1080/10645570802355562
Dierking, L. D., Falk, J. H., Rennie, L., Anderson, D., and Ellenbogen, K. (2003). Policy statement of the ‘informal science education’ ad hoc committee. J. Res. Sci. Teach. 40, 108–111. doi: 10.1002/tea.10066
Dugard, P., and Todman, J. (1995). Analysis of pre-test-post-test control group designs in educational research. Educ. Psychol. 15, 181–198. doi: 10.1080/0144341950150207
Falk, J. H., and Dierking, L. D. (2018a). Learning from Museums (2nd ed). Lanham, MD: Rowman & Littlefield.
Falk, J. H., and Dierking, L. D. (2018b). “Viewing science learning through an ecosystem lens: a story in two parts,” in Navigating the Changing Landscape of Formal and Informal Science Learning Opportunities, eds D. Corrigan, C. Buntting, A. Jones, and J. Loughran (Berlin: Springer International Publishing), 9–29. doi: 10.1007/978-3-319-89761-5
Falk, J. H., and Dierking, L. D. (2019). Reimagining public science education: the role of lifelong free-choice learning. Discip. Interdiscip. Sci. Educ. Res. 1, 1–8. doi: 10.1186/s43031-019-0013-x
Falk, J. H., Storksdieck, M., and Dierking, L. D. (2007). Investigating public science interest and understanding: evidence for the importance of free-choice learning. Public Underst. Sci. 16, 455–469. doi: 10.1177/0963662506064240
Fane, J., MacDougall, C., Jovanovic, J., Redmond, G., and Gibbs, L. (2018). Exploring the use of emoji as a visual research method for eliciting young children’s voices in childhood research. Early Child Dev. Care 188, 359–374. doi: 10.1080/03004430.2016.1219730
Fauville, G., Muller Queiroz, A. C., and Bailenson, J. N. (2020). “Virtual reality as a promising tool to promote climate change awareness,” in Technology and Health: Promoting Attitude and Behavior Change, Chap. 5, eds J. Kim and H. Song (Cambridge, MA: Academic Press), 91–108. doi: 10.1016/B978-0-12-816958-2.00005-8
Fenichel, M., and Schweingruber, H. A. (2010). Surrounded by Science: Learning Science in Informal Environments. Board on Science Education, Center for Education, Division of Behavioral and Social Sciences and Education. Washington, DC: The National Academies Press.
Friedman, A. (ed.) (2008). Framework for Evaluating Impacts of Informal Science Education Projects [On-line]. Available online at: http://insci.org/resources/Eval_Framework.pdf (accessed February 18, 2022).
Gallo, K. E., Swaney-Stueve, M., and Chambers, D. H. (2017). A focus group approach to understanding food-related emotions with children using words and emojis. J. Sens. Stud. 32:e12264. doi: 10.1111/joss.12264
Halford, G. S. (2014). Children’s Understanding: The Development of Mental Models. Hove: Psychology Press, doi: 10.4324/9781315801803
Harty, H., and Beall, D. (1984). Toward the development of a children’s science curiosity measure. J. Res. Sci. Teach. 21, 425–436.
Hein, G. (2009). Learning science in informal environments: people, places, and pursuits. Mus. Soc. Issues 4, 113–124. doi: 10.1179/msi.2009.4.1.113
Jensen, E. (2014). Evaluating children’s conservation biology learning at the zoo. Conserv. Biol. 28, 1004–1011. doi: 10.1111/cobi.12263
Kinchin, I. M., Hay, D. B., and Adams, A. (2000). How a qualitative approach to concept map analysis can be used to aid learning by illustrating patterns of conceptual development. Educ. Res. 42, 43–57. doi: 10.1080/001318800363908
Kisiel, J. (2005). Understanding elementary teacher motivations for science fieldtrips. Sci. Educ. 89, 936–955. doi: 10.1002/sce.20085
Knaggs, C. M., and Schneider, R. M. (2012). Thinking like a scientist: using Vee maps to understand process and concepts in science. Res. Sci. Educ. 42, 609–632. doi: 10.1007/s11165-011-9213-x
Komoroske, L. M., Hameed, S. O., Szoboszlai, A. I., Newsom, A. J., and Williams, S. L. (2015). A scientist’s guide to achieving broader impacts through K–12 stem collaboration. Bioscience 65, 313–322. doi: 10.1093/biosci/biu222
Laursen, S., Liston, C., Thiry, H., and Graf, J. (2007). What good is a scientist in the classroom? Participant outcomes and program design features for a short-duration science outreach intervention in k-12 classrooms. CBE Life Sci. Educ. 6, 49–64. doi: 10.1187/cbe.06-05-0165
Malcolm, J., Hodkinson, P., and Colley, H. (2003). The interrelationships between informal and formal learning. J. Workplace Learn. 15, 313–318. doi: 10.1108/13665620310504783
Mielke, M., LaFleur, J., Butler, A., and Sanzone, J. (2002). 4-H Science Initiative: Youth Engagement, Attitudes, and Knowledge Study. Washington, DC: Policy Studies Associates, Inc.
Mohammad, S. M., and Turney, P. D. (2013). Crowdsourcing a word-emotion association lexicon. Comput. Intell. 29, 436–465. doi: 10.1111/j.1467-8640.2012.00460.x
Moje, E. B., Ciechanowski, K. M., Kramer, K., Ellis, L., Carrillo, R., and Collazo, T. (2004). Working toward third space in content area literacy: an examination of everyday funds of knowledge and discourse. Read. Res. Q. 39, 38–70. doi: 10.1598/RRQ.39.1.4
O’Leary, Z. (2017). The Essential Guide to Doing your Research Project, 3rd Edn. Thousand Oaks, CA: SAGE Publications.
Perkins, D. F., and Mincemoyer, C. C. (2002). Skills for Everyday Living. University Park, PA: The Pennsylvania State University.
Reiss, M. (2020). “The educational benefits of out-of-classroom learning,” in Curious About Nature: A Passion for Fieldwork (Ecology, Biodiversity and Conservation), eds T. Burt and D. Thompson (Cambridge, MA: Cambridge University Press), 116–130. doi: 10.1017/9781108552172
Rennie, L. J. (2007). “Learning science outside of school,” in Handbook of Research on Science Education, eds S. K. Abell and N. G. Lederman (Mahwah, NJ: Lawrence Erlbaum), 125–167.
Rennie, L. J. (2014). “Learning science outside of school,” in Handbook of Research on Science Education, Vol. 2, eds N. G. Lederman and S. K. Abell (New York, NY: Taylor & Francis), 120–144.
Schwarz, E., and Stolow, D. (2006). Twenty-first century learning in afterschool. New Dir. Youth Dev. 110, 81–99. doi: 10.1002/yd.169
Steinke, J., Lapinski, M., Crocker, N., Zietsman-Thomas, A., Williams, Y., Evergreen, S., et al. (2007). Assessing media influences on middle school–aged children’s perceptions of women in science using the draw-a-scientist test (DAST). Sci. Commun. 29, 35–64. doi: 10.1177/1075547007306508
Stocklmayer, S. M., Rennie, L. J., and Gilbert, J. K. (2010). The roles of the formal and informal sectors in the provision of effective science education. Stud. Sci. Educ. 46, 1–44. doi: 10.1080/03057260903562284
Türkcan, B. (2013). Semiotic approach to the analysis of children’s drawings. Educ. Sci. Theory Practice 13, 600–607.
Tyng, C. M., Amin, H. U., Saad, M. N. M., and Malik, A. S. (2017). The influences of emotion on learning and memory. Front. Psychol. 8:1454. doi: 10.3389/fpsyg.2017.01454
Yamada-Rice, D., Mushtaq, F., Woodgate, A., Bosmans, D., Douthwaite, A., Douthwaite, I., et al. (2017). Children and Virtual Reality: Emerging Possibilities and Challenges. Available online at: https://researchonline.rca.ac.uk/id/eprint/3553 (accessed on January 7, 2022).
Keywords: evaluation, in-school science outreach, experimentation, critical thinking, knowledge, science center, informal science
Citation: Richard K, Pisani K and Barriault CL (2022) Evaluating Changes in Experimentation, Critical Thinking, and Sense of Wonder in Participants of Science North’s In-School Outreach Programs. Front. Educ. 7:675306. doi: 10.3389/feduc.2022.675306
Received: 02 March 2021; Accepted: 09 February 2022;
Published: 16 March 2022.
Edited by:
Chunxia Qi, Beijing Normal University, ChinaReviewed by:
Peter Vollbrecht, Western Michigan University, United StatesSteven Greenstein, Montclair State University, United States
Copyright © 2022 Richard, Pisani and Barriault. This is an open-access article distributed under the terms of the Creative Commons Attribution License (CC BY). The use, distribution or reproduction in other forums is permitted, provided the original author(s) and the copyright owner(s) are credited and that the original publication in this journal is cited, in accordance with accepted academic practice. No use, distribution or reproduction is permitted which does not comply with these terms.
*Correspondence: Kaitlin Richard, cmljaGFyZEBzY2llbmNlbm9ydGguY2E=