 Rodrigo Santos
 David Anderson
 Marina Milner-Bolotin
- Department of Curriculum and Pedagogy, University of British Columbia, Vancouver, BC, Canada
This paper reports on the results of a descriptive analysis of 675 publications included in the proceedings of five editions of the International Science, Technology, Engineering, and Mathematics in Education Conferences held in Australia, Canada, and China over 9 years between 2012 and 2021. Peer-reviewed academic journals are traditional sources of high quality and established research. Yet these papers might take months and sometimes years to get published. On the other hand, an analysis of research foci represented at international STEM conferences can be used as a source of the most recent trends in the field, and the developments of STEM education research across time and by national origins. In this analysis, 675 abstracts from five editions of the International STEM in Education Conference were coded into eight topics, followed by a descriptive analysis of the results. Four countries were consistently the top four contributors: Australia, Canada, China, and the United States. Thus, the study conducted a descriptive analysis and discussion of the trends among these countries. The results revealed trends in STEM education research, among which policy, curriculum, assessment; K-12 teaching and learning, are dominant topics of research investigation, while postsecondary STEM teaching and learning are less investigated. The results also demonstrated the dominance of some topics over others among the countries that most contributed to the conferences. For instance, Canada dominated in the studies of culture, gender, and social issues and in postsecondary STEM education. China paid much less attention to these topics, while putting more emphasis on historical and epistemological perspectives on STEM, policy and curriculum, and K-12 teaching and learning. Australian research focused on policy and curriculum; K-12 teaching and learning; and industry. Meanwhile, the United States showed the least difference in percentages between topics. Overall the analysis indicates a relatively low interest in postsecondary STEM education research, despite the growing demand for STEM professionals. This highlights the need for STEM education research focused on institutions of higher education. This analysis interprets the trend results in light of the issues in STEM education confronting various national jurisdictions.
1. Introduction
Promoting a science, technology, engineering, and mathematics (STEM) education has been one of the main goals of recent educational reforms worldwide (Madani and Forawi, 2019; Nugroho et al., 2019; Yamada, 2019). Around the globe governments’ efforts and budgets have prioritized the elaboration of STEM policies to govern school science and mathematics, and STEM related research and education (Freeman et al., 2019). These educational reforms attempt to address the demands from global and local markets for a STEM-skilled workforce and skilled STEM educators (Diekman and Benson-Greenwald, 2018; Sharma and Yarlagadda, 2018).
In the last decace, the number of publications in STEM education journals has significantly increased, and the field of STEM education research and the professional identity of many academic journals in STEM education have been consolidated (Li et al., 2020). With the rapid growth of the STEM education research field, it is crucial to keep track of changes as well as identify the overall trends of research focus. To explore these trends and related issues in STEM education across time this paper analyzes the proceedings of a series of biennial International STEM in Education Conferences.1 We believe that the analysis of research foci represented at such conferences can be used as a source of further information about the development of STEM education research now and into the future.
While the acronym STEM stands for Science, Technology, Engineering, and Mathematics, STEM can have a variety of meanings for different researchers and different stakeholders involved in STEM education research (Herranen et al., 2021; Martinovic and Milner-Bolotin, 2022). The most common notion is that STEM uses the integration of the four disciplines to solve real-world problems (Sanders, 2008). Worldwide, researchers have focused either on this interdisciplinary feature of STEM education or on the individual STEM disciplines. However, even within each institution of higher education, scholars have different operational definitions and conceptualizations of STEM, its applications, and of STEM teacher education (Breiner et al., 2012; Ben-David Kolikant et al., 2020). Common trends in STEM education are observed around the globe and, with governments attentive to other countries’ successful initiatives, there is considerable convergence in the field STEM regarding policies (Marginson et al., 2013). However, the political, social, and educational contexts in which STEM education policies and initiatives are developed and implemented are also varied worldwide. Policies, professional practices, and research are always built upon national political cultures, local histories, and research traditions. Each jurisdiction will develop STEM initiatives in response to their own contexts.
Accordingly, the analysis of research in STEM education by national jurisdiction can reveal the diverse emphases given to STEM education research and how different countries contribute to the field of STEM education. For this paper we conducted a descriptive analysis of 675 publications included in the proceedings of five editions of the International STEM in Education Conferences held between the years 2012 and 2021 (see text footnote 1). The variety of meanings and the rapidly evolving pace of the field of STEM education research internationally makes it challenging for researchers to identify research in STEM education (Li et al., 2019). The multidisciplinary characteristic of STEM allows scholars to publish in a large variety of journals in different fields of knowledge making it difficult for researchers to identify STEM education papers. Despite these challenges reviews about the trends in STEM education can be found in the literature (Brown, 2012; Mizell and Brown, 2016; Li, 2019; Li et al., 2019, 2020; Kayan-Fadlelmula et al., 2022). To address these challenges most reviews in the field limit their scope of study to the publications that self-identify as STEM, considering only the papers that contain the acronym STEM in their titles, abstracts, and/or keywords.
While academic journals are considered sources of high quality and recent research (Xu et al., 2019), academic papers take months and sometimes even years to publish. On the other hand, publications in conferences are much more current and are also more open to students and to a wider range of contributors; teachers and people involved in implementing STEM as well as STEM education researchers can participate. Academic conferences play an important role in providing a forum to exchange novel ideas, discuss new and ongoing research, develop academic communities, and expand professional networking for new scholars (Subramanian, 2020). STEM conferences are also a site for teacher professional development, playing a key role in the integration of STEM into future teaching practices in schools (Holmes et al., 2017; Anderson et al., 2021). We consider that the analysis of the research foci of the International STEM in Education Conferences can be helpful in revealing and examining trends and the development of the field of STEM education research in different countries. Further, it can also help us to better comprehend the trends previously identified in literature reviews. Academic conferences, as sites of knowledge dissemination, can be valuable sources for identifying currently emerging research trends in the STEM education field in ways that academic journals might not due to the lengthy time required to publish in such journals.
We recognize that these conferences are a bounded system of knowledge dissemination within STEM education research activity, and it is important to define the boundaries of such an investigation. Thus, this paper aims to identify the general trends and hot topics in five proceedings of the International STEM in Education Conferences that took place from 2012 to 2022. We also analyze the trends for the top four contributing countries: Canada, China, Australia, and the United States (US). Specifically, we conduct a descriptive analysis of the proceedings to address the following questions:
1. Which countries were the biggest contributors to the five consecutive biennial International STEM in Education Conferences across the years 2012 to 2021?
2. What were the dominant research foci of the conferences’ publications by year and by country of origin?
2. The International STEM in Education Conference
The STEM in Education Conference is a biennial international conference that focuses on STEM education across formal and informal contexts. The conference provides a forum for teachers, scholars, businesses, industries, and private and public agencies around the world to share and discuss their innovative practices, research initiatives, and educational tools that advance STEM education.
Currently, the conference is supported by a worldwide consortium of universities, namely: The University of British Columbia, Canada; University of Calgary, Canada; Beijing Normal University, China; Northeast Normal University, China; Southwest University, China; Shanghai Normal University, China; University of Sydney, Australia; and Queensland University of Technology, Australia. The conference has been hosted biennially a consortium member in their country since 2010: the first and fifth International STEM in Education Conferences were held by Queensland University of Technology in 2010 and 2018; the second and fourth editions of the conference were held by Beijing Normal University in 2012 and 2016; and the third and the sixth editions were held by the University of British Columbia in 2014 and 2021, respectively.
This regularly occurring conference was selected because two of the authors (DA and MMB) have been part of the consortium that has been organizing the conference since 2012 and all authors were part of the STEM 2021 Organizing Committee. Moreover, since the consortium is composed mostly of institutions of higher education located on the Pacific Rim the proceedings of this conference could be an interesting source of data different from the academic journals and databases usually used in literature reviews in the field, or other conferences organized by North American and European organizations. While international conferences claim to be global, it is reasonable to argue that they are limited by different communities of knowledge dissemination within STEM education research activity. International conferences are often hosted by organizations that are not international but dominated by one country. One of the objectives of the International STEM in Education Conference is to create a forum where collaborators from different regions of the world can be heard and exchange ideas on an equal footing. Four different countries took the lead over the years, and the conference has had great diversity in terms of worldwide participation (29 countries). Even though, we acknowledge that the trends presented in this paper are informed primarily by what is occurring in the Pacific Rim due to the structure of the consortium.
3. Materials and methods
In this paper we analyzed five proceedings of the International STEM in Education Conferences that took place in 2012 (China), 2014 (Canada), 2016 (China), 2018 (Australia), and 2021 (Canada). Since the inaugural STEM in Education Conference in 2010 (Australia) did not have proceedings, it was not included in this study. This investigation considered all the publications in the conference proceedings, which included all types of submissions accepted for presentation. In the five proceedings analyzed in this study the STEM in Education Conference accepted five types of publications: paper presentations, poster presentations, panels, symposia, and workshops.
To address the research questions, the abstracts of 675 proceedings publications were coded into eight categories. All authors participated in the coding process. The first author initiated the coding process. The second and third authors revised the initial coding. Any discrepancies were discussed until all three authors agreed. Seven of the categories were consistent with the ones employed by Li et al. (2019, 2020) in their recent systematic review of journal publications in STEM education. As the STEM in Education Conferences invited sponsor industry-partner presentations, an additional category (STEM and industry) had to be created. The eight categories used to code the abstracts are as follows:
1. K-12 teaching, teacher, and teacher education in STEM (including both preservice and in-service teacher education).
2. Postsecondary teacher and teaching in STEM (including faculty development, etc).
3. K-12 STEM learner, learning, and learning environment.
4. Postsecondary STEM learner, learning, and learning environments (excluding preservice teacher education).
5. Policy, curriculum, evaluation, and assessment in STEM (including literature review about a field in general).
6. Culture, social, and gender issues in STEM education.
7. History, epistemology, and perspectives about STEM and STEM education.
8. STEM and industry.
Due to the multidisciplinary nature of STEM education and STEM education research each abstract was coded into as many as four of the categories when possible. This strategy enabled a more encompassing and faithful representation of the research foci across the publications. Regarding authorship nationality, we considered the institutional affiliations of those listed as first authors. After the coding process was completed, the descriptive analysis for all the countries identified four countries that were consistently in the top four contributors to the five proceedings. Thus, the study proceeded to conduct a descriptive analysis and discussion of the trends among these countries.
4. Results and discussion
4.1. Which countries were the biggest contributors to the five consecutive biennial STEM in Education Conferences across the years 2012–2021?
Figure 1 shows the number of publications across the five proceedings of the STEM in Education Conference. The conference published 77 publications in the 2012 proceedings, 213 publications in 2014, 68 publications in 2016, 124 publications in 2018, and 194 publications in 2021. The results show that the conferences hosted in Canada had more presentations than the conferences hosted in China and in Australia. Moreover, the number of submissions has increased in the last two conferences. The reasons for the popularity of the conferences in Canada might be its proximity to the United States (a country actively involved in STEM education research), the popularity of the host city (Vancouver), and a heavy involvement of Canadian graduate students and teachers. As the conference series became more popular, the number of participants has also grown over time.
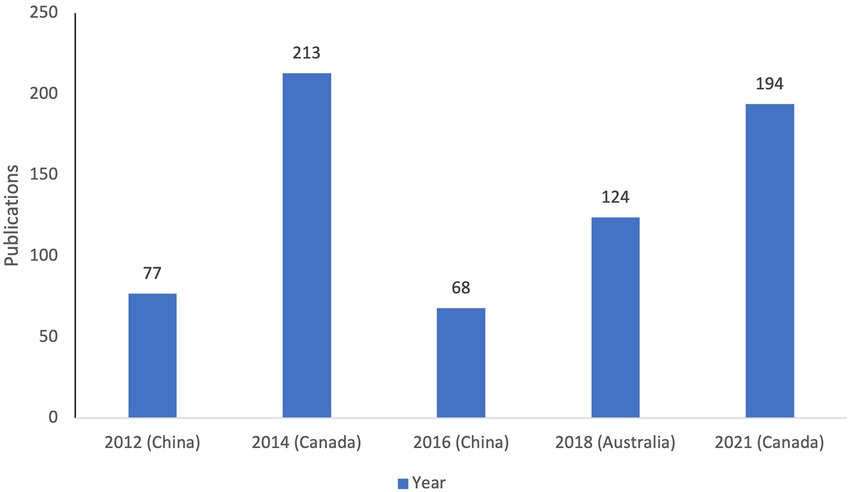
Figure 1. Number of publications by country during five International STEM in Education Conferences.
Figure 2 shows the total number of publications per country over all five proceedings. Overall, the 10 countries with the most publications in the STEM in Education Conference are Canada, Australia, China, United States, South Korea, Japan, Israel, Taiwan, Nigeria, and United Kingdom. This distribution is consistent with the previous reviews (Li et al., 2020) that show Australia, Canada, and Taiwan as the major contributors to the field of STEM education and indicates that countries/regions in Asia are becoming active in the field. Half of the countries in the top 10 are from Asia.
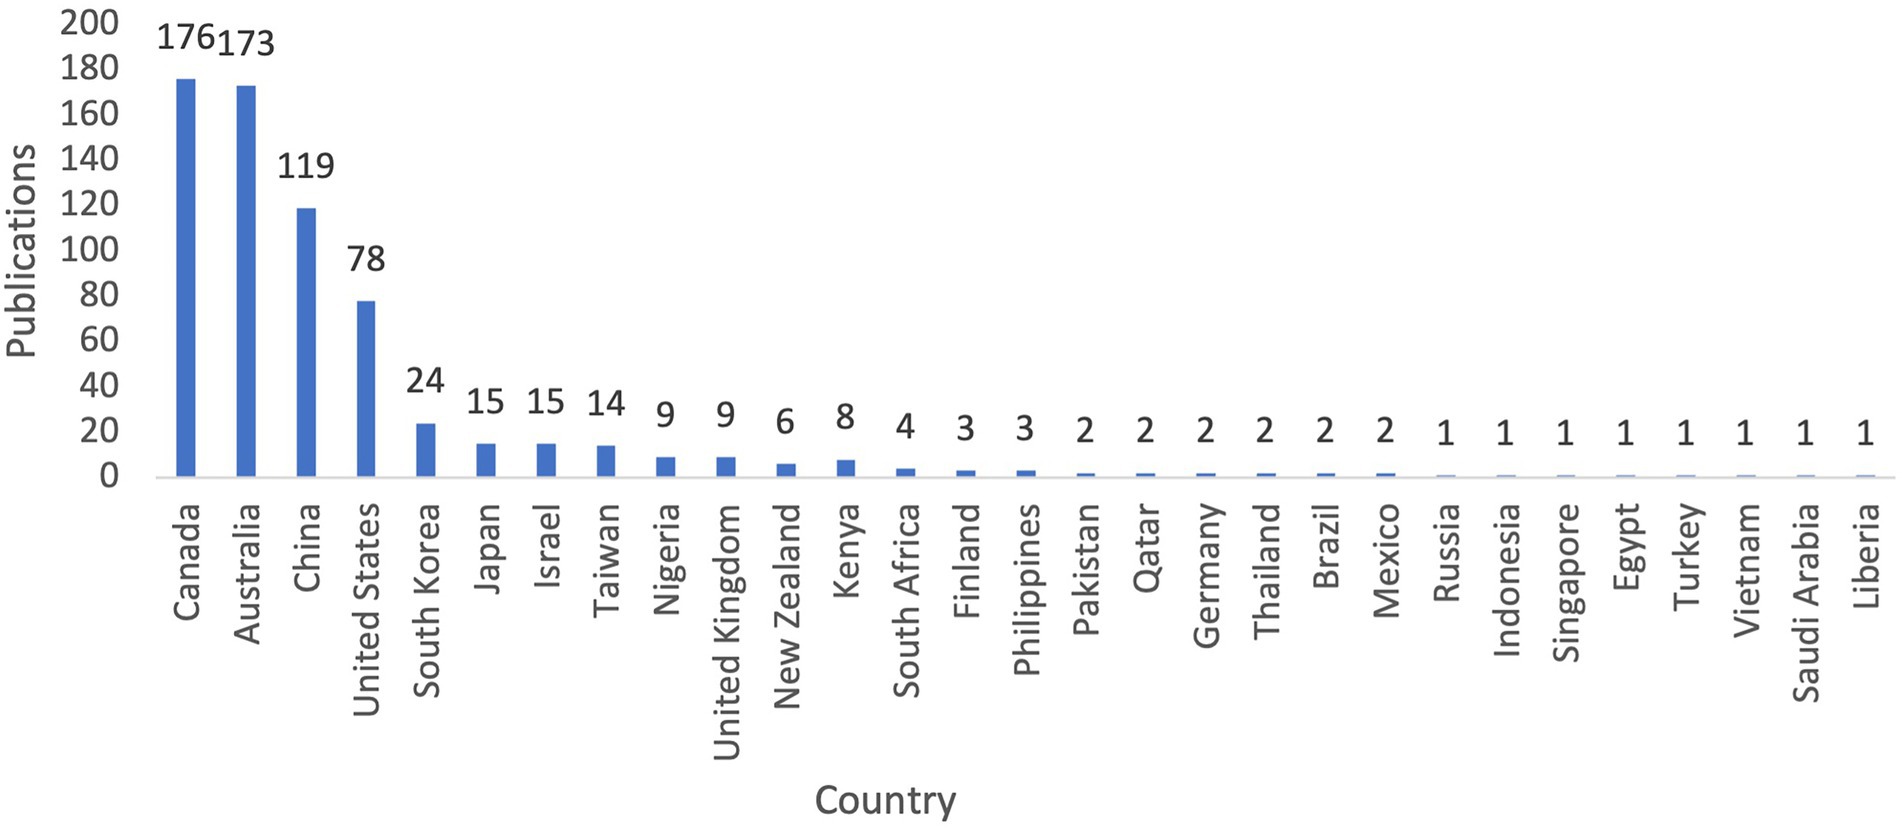
Figure 2. Total number of publications per country.
Table 1 shows that Australia had the highest number of publications in the first two proceedings analyzed (2012 and 2014). After 2014 the host country for each conference had the highest number of publications in 2016, 2018, and 2021. The results also show that authors from Canada and United States presented more publications when the conferences were hosted in Canada in 2014 and 2021; it is easier for scholars from United States to participate in and submit publications to conferences hosted in Canada due to the geographical proximity between the two countries and relatively simple visa procedures.
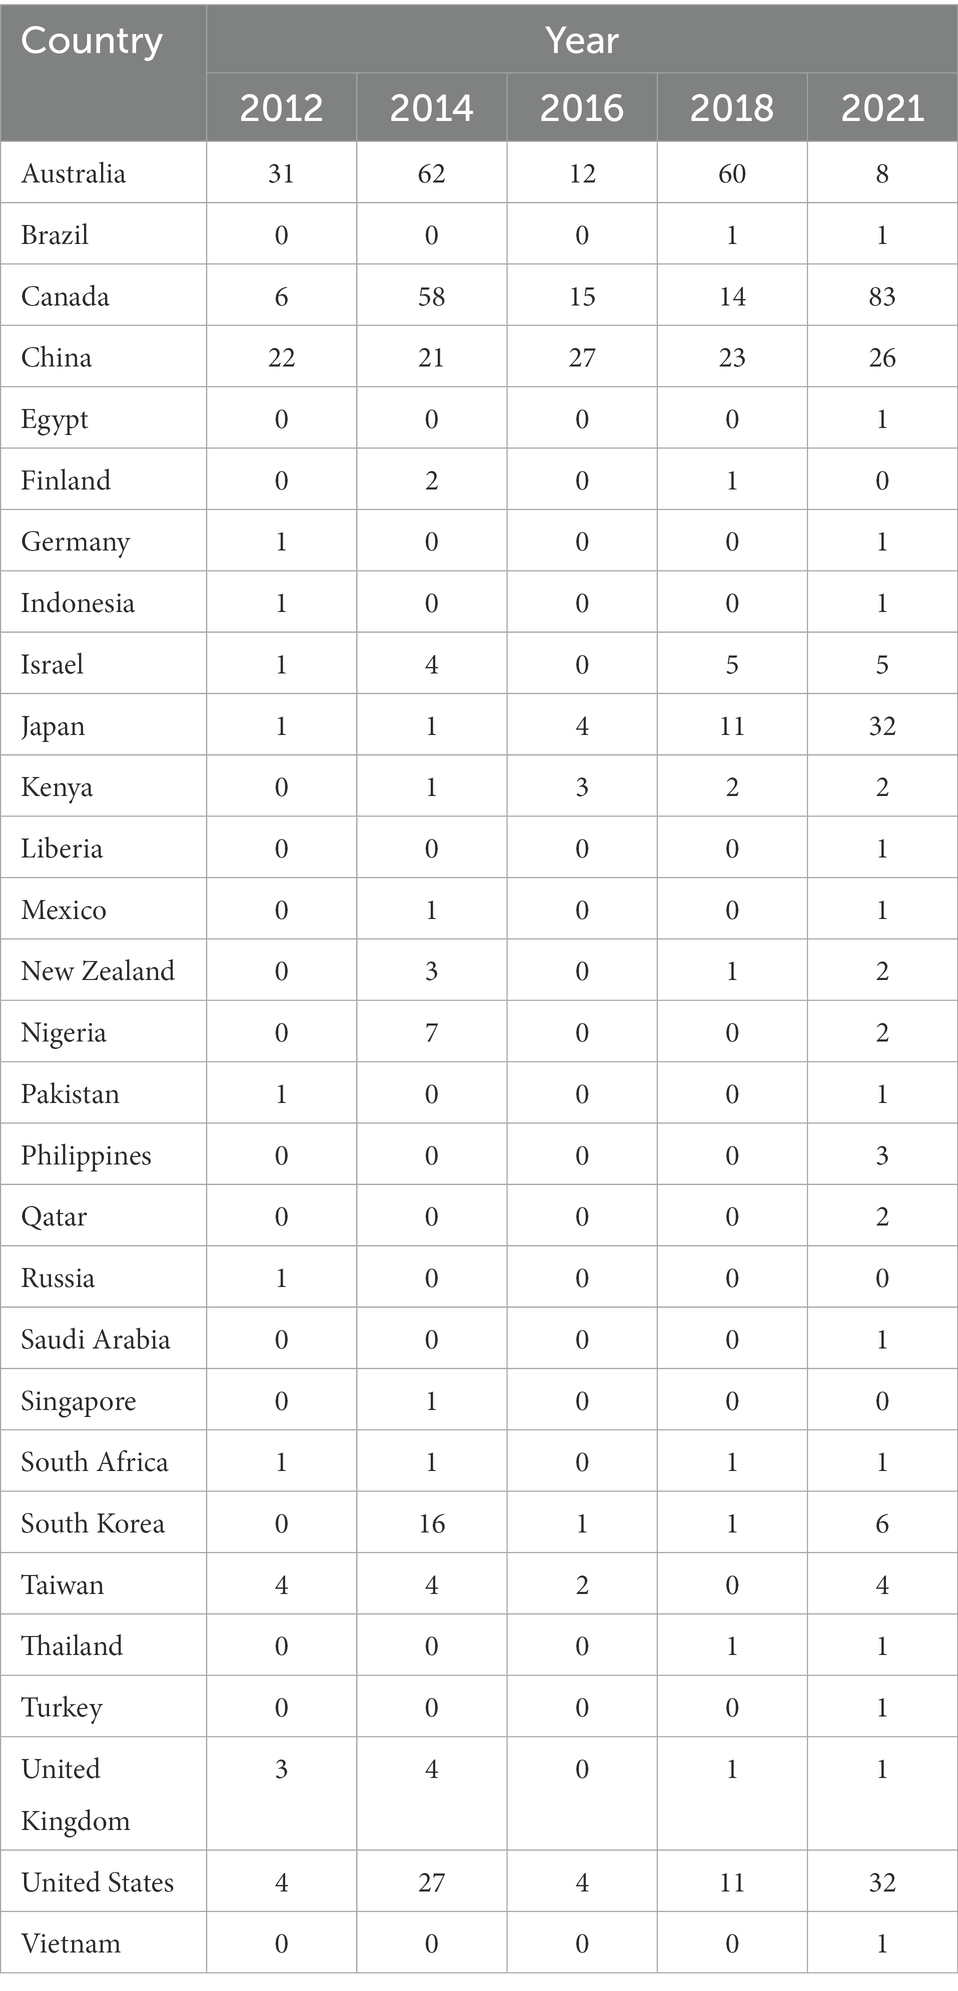
Table 1. Publications for all countries.
Australia, Canada, China, and United States ranked in the top four across all conferences. While the results show that host countries have consistently ranked in the top four, Australia, Canada, and United States are also among the countries most published in science education and STEM education journals in the last decades. Tsai and Lydia Wen (2005) shows that from 1998 to 2002 United States, the United Kingdom, Australia, and Canada were the major contributors of publications in science education. More recently, the Chomphuphra et al. (2019) review of publications in STEM education found United States, Australia, and Canada as the top three publishing countries considering the SCOPUS database, Journal of STEM Teacher Education, and International Journal of STEM Education from 2007 to 2017. Research by Li et al. (2020) shows that most publications in STEM education research were by the authors from United States followed by Australia, Canada, and Taiwan. On the one hand, China’s ranking as one of the top contributing countries in the five proceedings of the STEM in Education Conference could be an indication that a country being a host and part of the conference organizing consortium significantly increases the number of presentations by that country. On the other hand, it could also indicate that recent reviews in the field could have been challenged to identify Chinese scholarly publications in STEM education since the majority of them are published in Mandarin-language journals and so are not counted in the English based analyses.
4.2. What were the dominant research foci of the conferences’ publications by year?
Table 2 shows the percentage of topics for each year. Policy, curriculum, evaluation, and assessment in STEM education and K-12 teaching, teacher, and teacher education in STEM presented an average percentage of 24 and 28%, respectively. They were the most popular topics in every edition of the STEM in Education Conference consistently presenting a higher publication percentage than other topics. K-12 teaching, teacher, and teacher education in STEM stood out presenting a higher percentage than any other topic for all proceedings. These topics are followed by K-12 STEM learner, learning, and learning environment and History, epistemology, and perspectives about STEM and STEM education with an average percentage of 18 and 12%, respectively. Cultural, social, and gender issues, Postsecondary STEM learner, learning, and learning environments and Postsecondary teacher and teaching in STEM presented an average below 10% for all publications in all proceedings. STEM and industry was the topic with the fewest publications in all conferences, with an average of 1% of all publications.
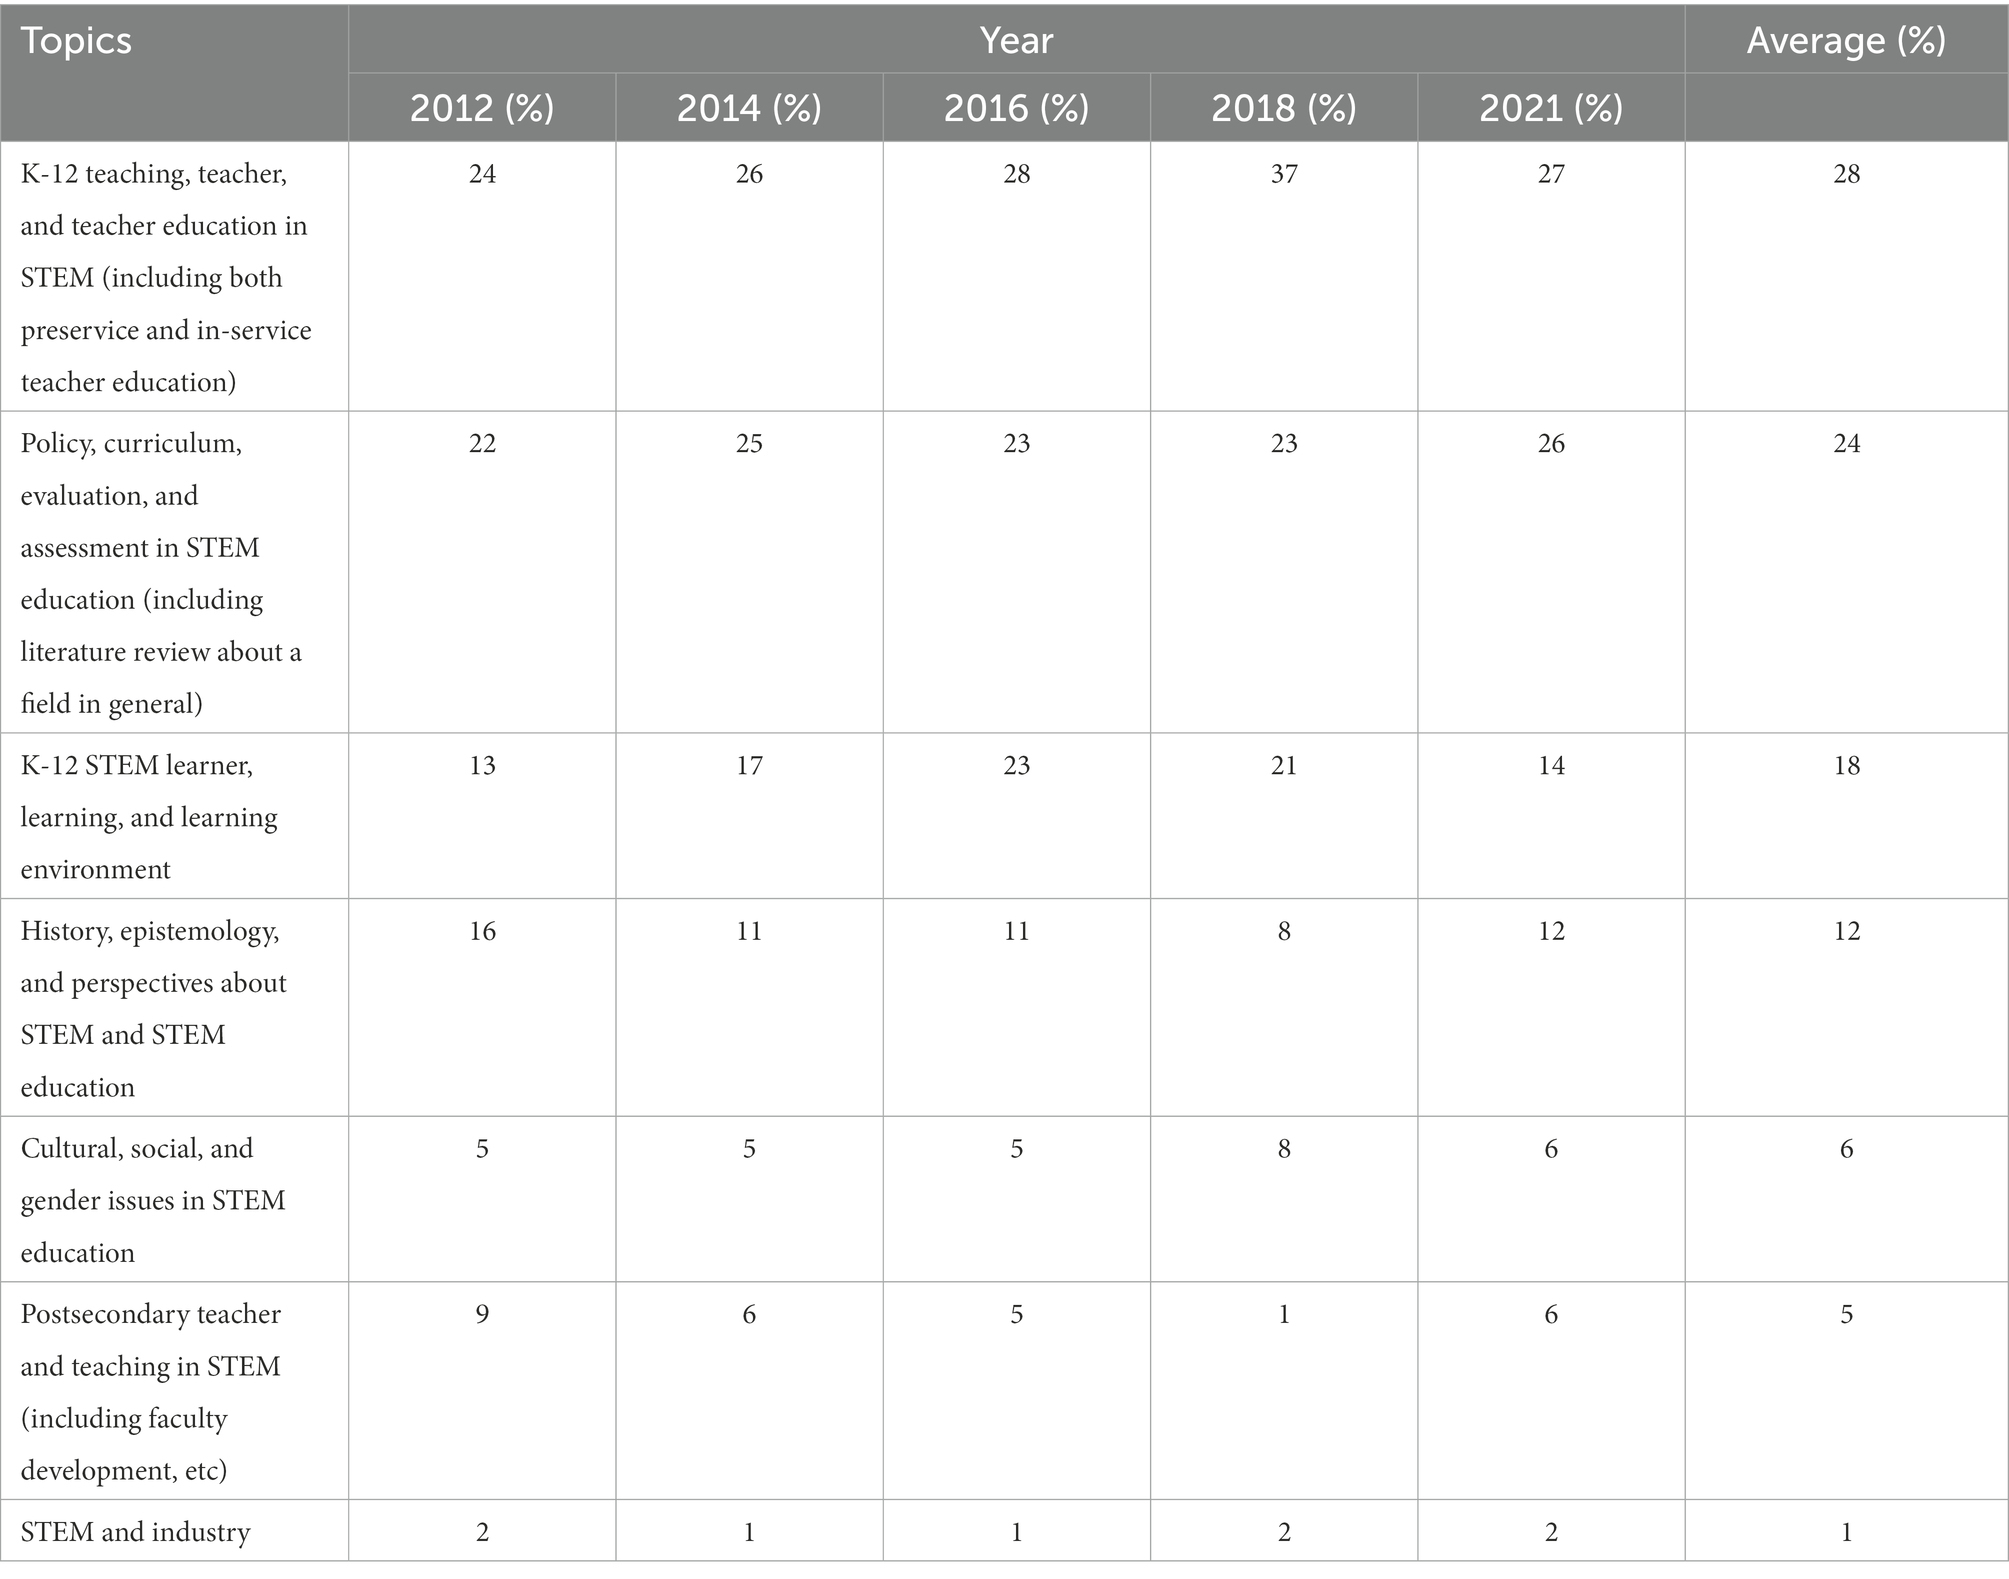
Table 2. Percentage of topics per year for all countries.
The results show the most popular topics in the STEM in Education Conferences are also the most popular in academic journals. Recent reviews of the field of STEM education also show that researchers have a broad interest in both teaching and learning in K-12 STEM education (Li et al., 2019, 2020). K-12 teaching, teacher, and teacher education in STEM consistently presented the highest percentage for all proceedings while the category K-12 STEM learner, learning, and learning environment presented the third highest average percentage overall. Policy, curriculum, evaluation, and assessment in STEM education is the most popular topic in STEM education journals (Li et al., 2020) and presented the second highest average rate and, despite having lower percentages than K-12 teaching, teacher, and teacher education in STEM, it presented a higher percentage of publications than the rest of the topics. Postsecondary teacher and teaching in STEM and Postsecondary learner and learner in STEM were less than 10% of the publications in all proceedings with an average of 5 and 6%, respectively. The results follow the trends observed in other literature reviews of the field of STEM education that show that while there is a focus on STEM teaching and learning in the field, this interest is mostly focused on K-12 education (Ben-David Kolikant et al., 2020). The low number of publications in STEM and industry was expected due to its business-oriented nature in a conference that is mostly academically oriented.
4.3. What were the prominent topics for the top four contributing countries?
Australia, Canada, China, and United State consistently ranked in the top four in number of publications across the five proceedings analyzed. In this section we report the percentages and number of publications for each of the topics among the top four contributing countries in each edition of the International STEM in Education Conference. Later on, we also discuss the trends in relation to policies that have influenced the development of STEM education in each one of these four countries.
Table 3 shows the percentage of each topic across the five conferences for the top four countries. The results show that the publications for the top four countries present similar numbers to the ones found for all countries. K-12 teaching, teacher, and teacher education in STEM and Policy, curriculum, evaluation, and assessment in STEM education presented more than 20% of all publications each in each conference, representing together 53% of the total number of publications for the top four countries (29 and 24%, respectively). Meanwhile, K-12 STEM learner, learning, and learning environment and History, epistemology, and perspectives about STEM and STEM education also showed a similar percentage (16 and 12%, respectively) to the ones found for these topics for all countries. Cultural, social, and gender issues in STEM education, Postsecondary STEM learner, learning, and learning environments, Postsecondary teacher and teaching in STEM and STEM and industry presented rates lower than 10% of the total number of publications across all years and in each edition (except for Postsecondary teacher and teaching in STEM in 2012 with 10% of total number of publications in that edition).
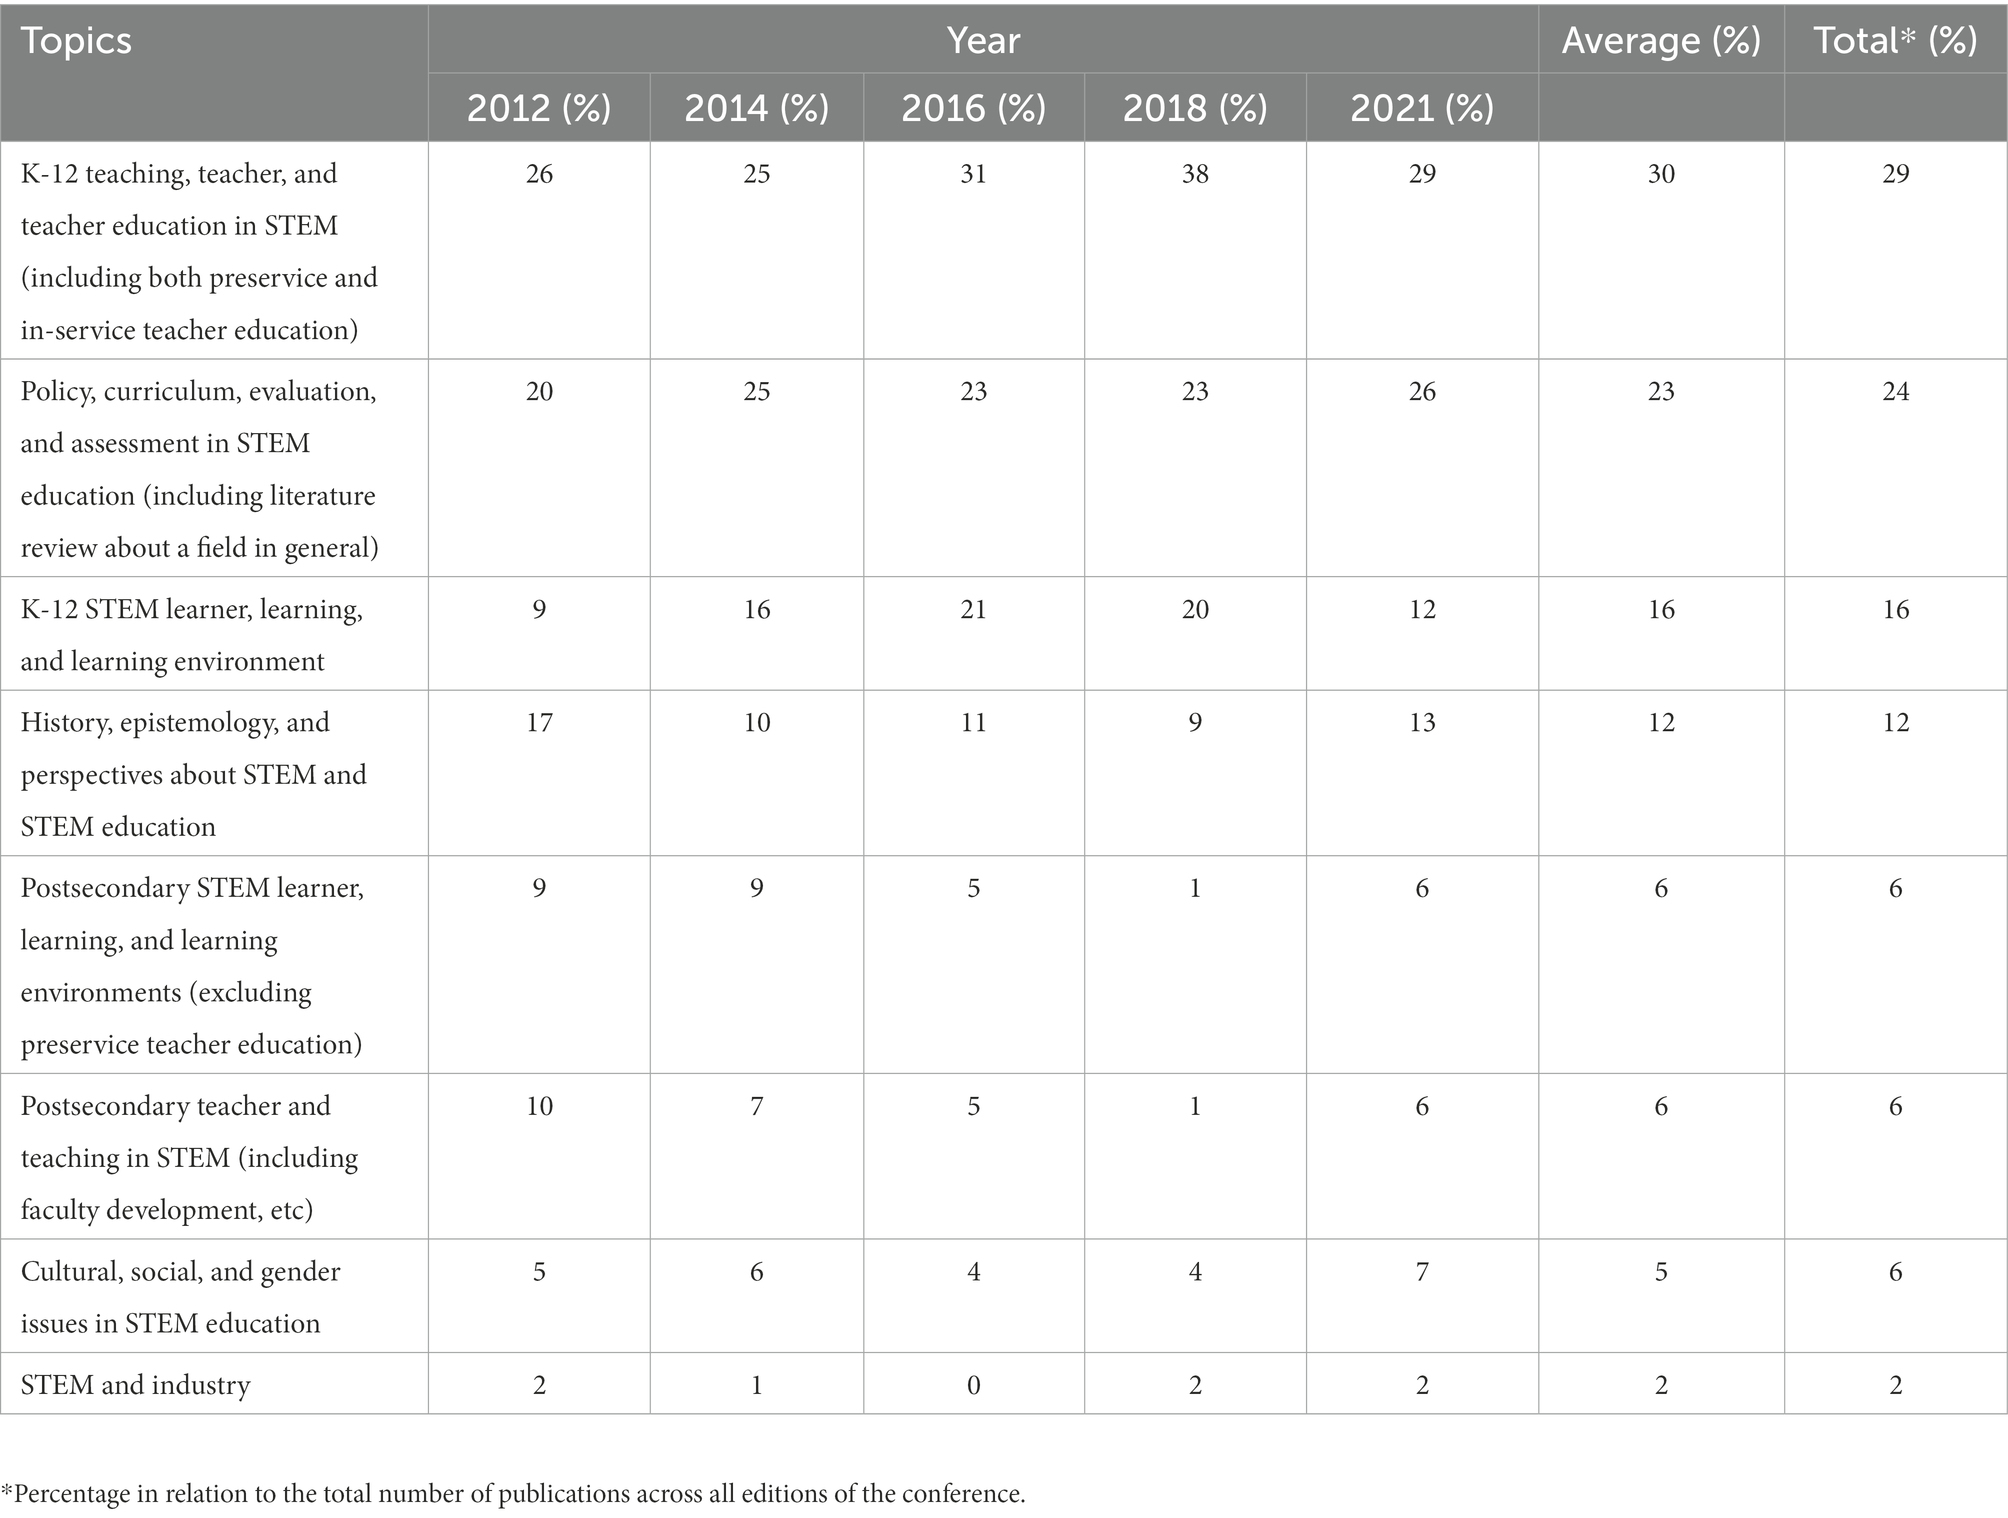
Table 3. Percentage of topics per year for Australia, Canada, China, and United States.
4.4. Contributions over the years for top contributing countries
Figure 3 shows the percentage of publications in K-12 teaching, teacher, and teacher education in STEM for each edition of the conference. In 2012, there was a total of 43 publications coded to this topic with Australia being the major contributor accounting for 47% of publications; China contributed with 35%, Canada 12%, while United States accounted for 6%. A total of 115 publications on this topic were identified in 2014, with Australia ranking first with 47% of the publications, Canada accounting for 27%, and China and United States for 13% each. In 2016, 52 publications were coded to this topic with China accounting for 37%, Australia 31%, Canada 25%, and United States 8%. One hundred and fourteen publications on this topic were identified in 2018, with Australia accounting for 63%, China 25%, United States 15%, and Canada with only 10%. Last, in 2021, 121 publications were coded to this topic, with Canada accounting for 48% of the total, while China and Australia contributed with 21% each, and United States contributed 18%. Overall, Australia is the country with the most publications coded to this topic (n = 173), followed by Canada (n = 118), China (n = 95), and United States (n = 59). The result shows Australia stood out as the major contributor to the topic, being the country that most contributed to the topic in three out of the five proceedings analyzed and being in the top two in four out of five proceedings. The results also indicate that the publications from China have been consistent across the five proceedings analyzed. China ranked in the top two in four out of five editions. In all the proceedings analyzed, K-12 teaching, teacher, and teacher education in STEM is the only topic with publications from all countries, suggesting the dominance of the topic within the field of STEM education and among the top four contributing countries. The results show that despite the sharp decrease in the number of publications from Australia, the number of submissions on the topic has grown from 2012 to 2021.
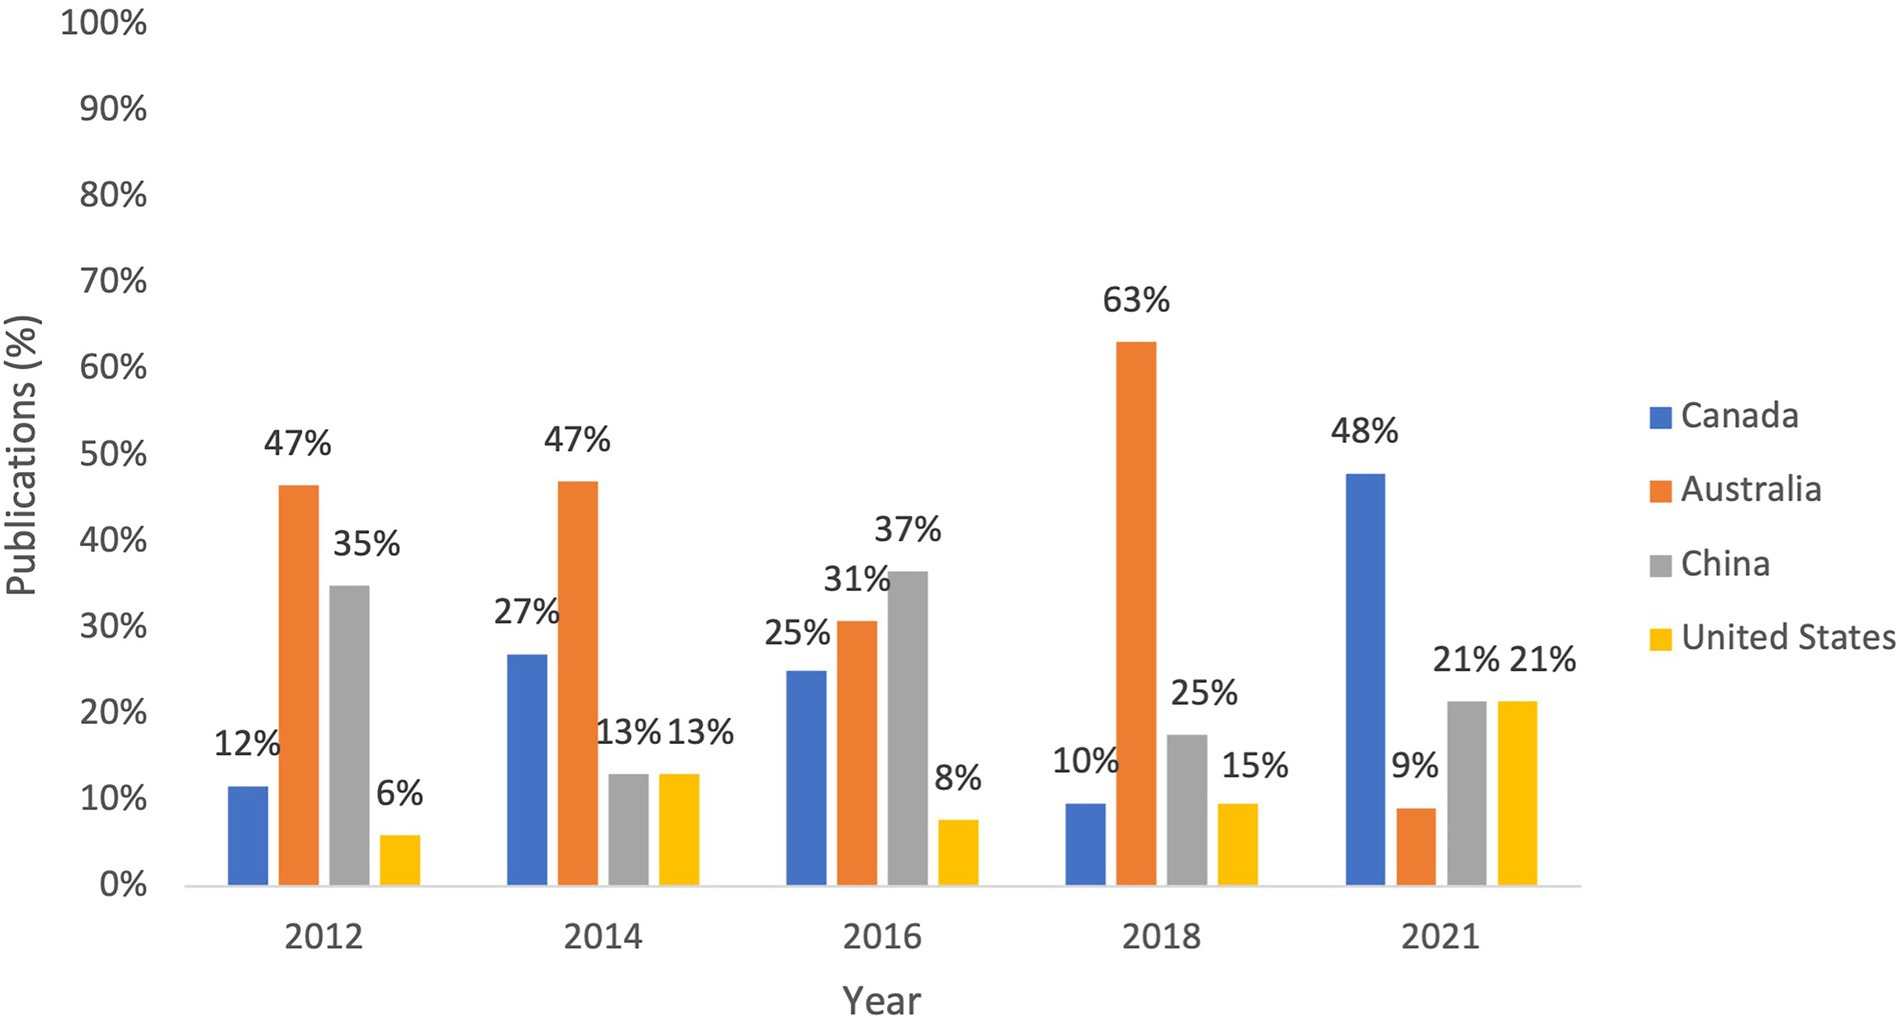
Figure 3. Percentage of submissions per year in category 1, K-12 teacher, teaching, and teacher education in STEM.
Figure 4 shows the percentage of publications in Policy, curriculum, evaluation, and assessment in STEM Education. In 2012, Canada had no publications coded to this topic, while Australia stood out with 75%, followed by China (17%) and United States (11%) in 33 publications. In total, 118 publications on this topic were identified in 2014, with Australia ranking first with 45%, Canada accounting for 30%, China for 15%, and United States for 11%. In 2016, 39 publications were coded to this topic, with China accounting for 58%, Australia for 18%, Canada for 15%, and United States for 10%. Sixty-nine publications on this topic were identified in 2018, with Australia accounting for 56%, United States for 16%, China for 16%, and Canada for 15%. In 2021, 107 publications were coded to this topic, with Canada accounting for 68%, while United States contributed with 13%, China with 12%, and Australia with 9%. Australia had the most publications on this topic in 2012 (72%), 2014 (45%), and 2018 (56%); was second in 2016 (18%); third in 2018 (15%), and last in 2021 (9%). Canada ranked first in 2021 (66%), second in 2014 (30%) and 2016 (18%), and last in 2018 (13%). Canada had no publications coded to this topic in 2012. China ranked first in 2016 (58%), second in 2012 (17%) and 2021 (12%), third in 2018 (12%), and last in 2014 (11%). The United States was the country with the third most number of publications in 2014 (15%) and the second most in 2018 (16%), and last in 2016 with 10%. In 2021, it had the fewest publications on the topic (9%), with no contributions coded to this topic in 2012. Overall, Australia is the country with the highest number of publications coded to this topic (n = 116), followed by Canada (n = 98), China (n = 94), and United States (n = 58).
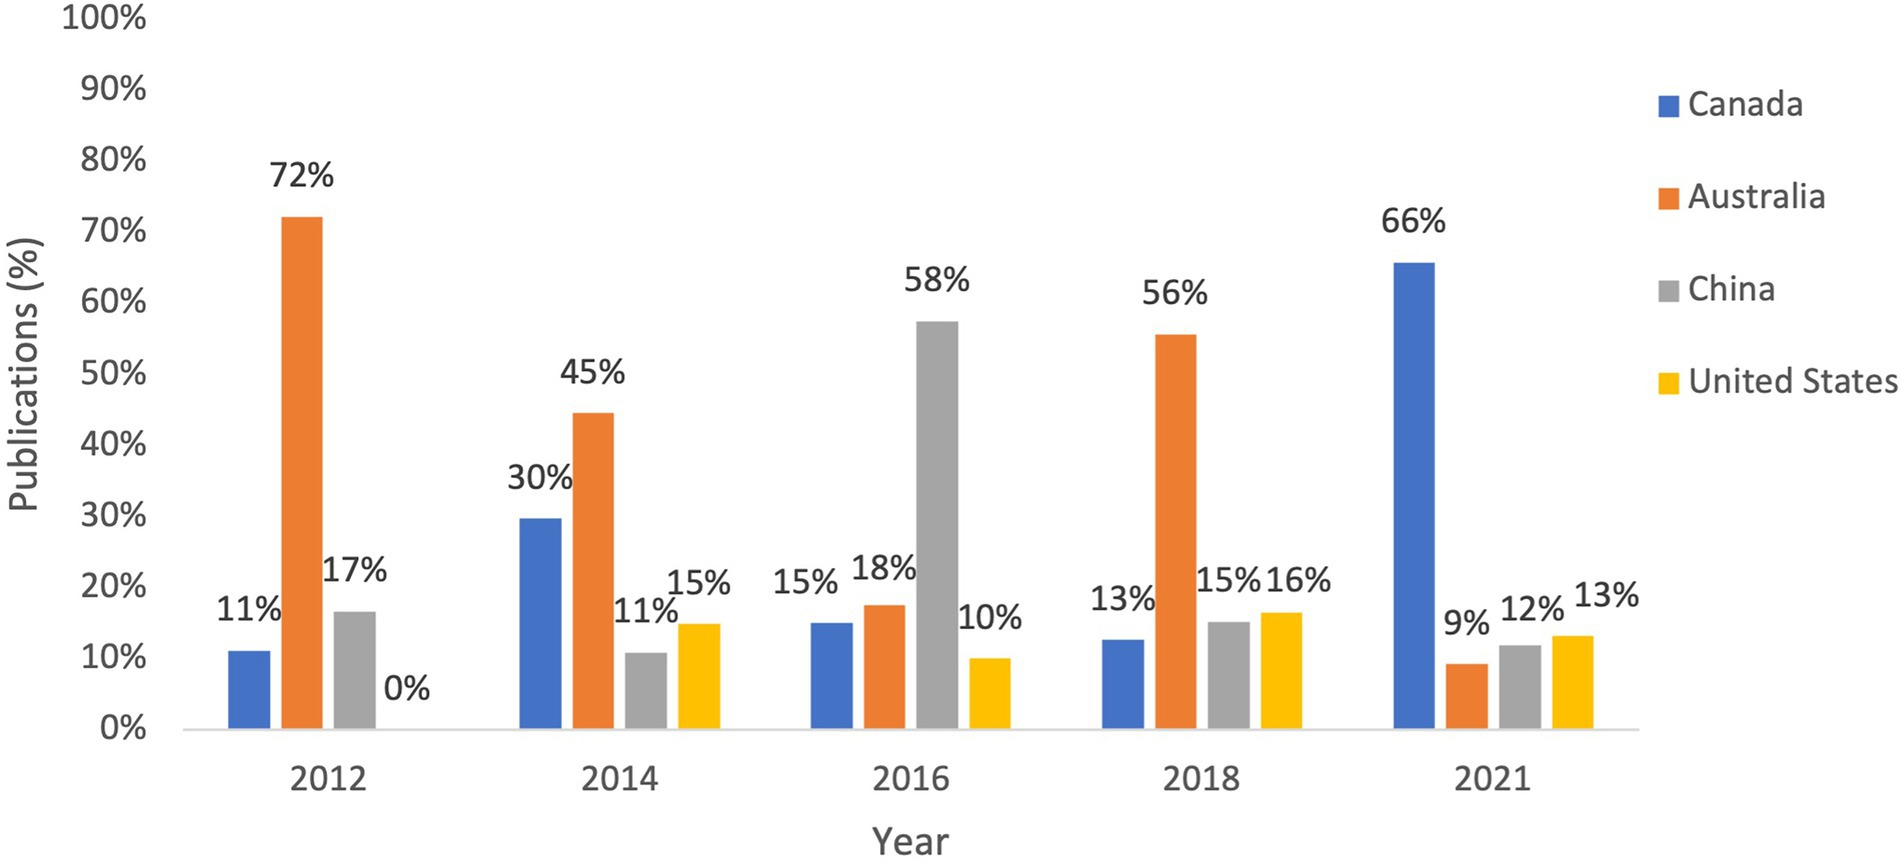
Figure 4. Percentage of submissions per year in category 5, policy, curriculum, evaluation and assessment in STEM education.
Figure 5 shows the percentage of publications in K-12 STEM learner, learning, and learning environment for each edition of the conference. In 2012, a total of 15 publications on the topic were identified, with Australia contributing with 80% of the total and China contributing with 20%. No publications from Canada and United States were identified for this year. A total of 76 publications on this topic were identified in 2014, with Australia ranking first with 46%, followed by Canada with 20%, United States with 15%, and China with 14%. In 2016, 36 publications were coded to this topic, with China accounting for 64%, Canada 19%, United States 11%, and Australia 6%. Sixty-one publications in this topic were identified in 2018 with Australia accounting for 51%, United States 21%, China 20%, and Canada 8%. Last, in 2021, 48 publications were coded to this topic, with Canada accounting for 56% of the total, while United States contributed with 21%, China 19%, and Australia 4%. Overall, Australia (n = 82) contributed the most to the topic, followed by China (n = 58), Canada (n = 54), and United States (n = 42).
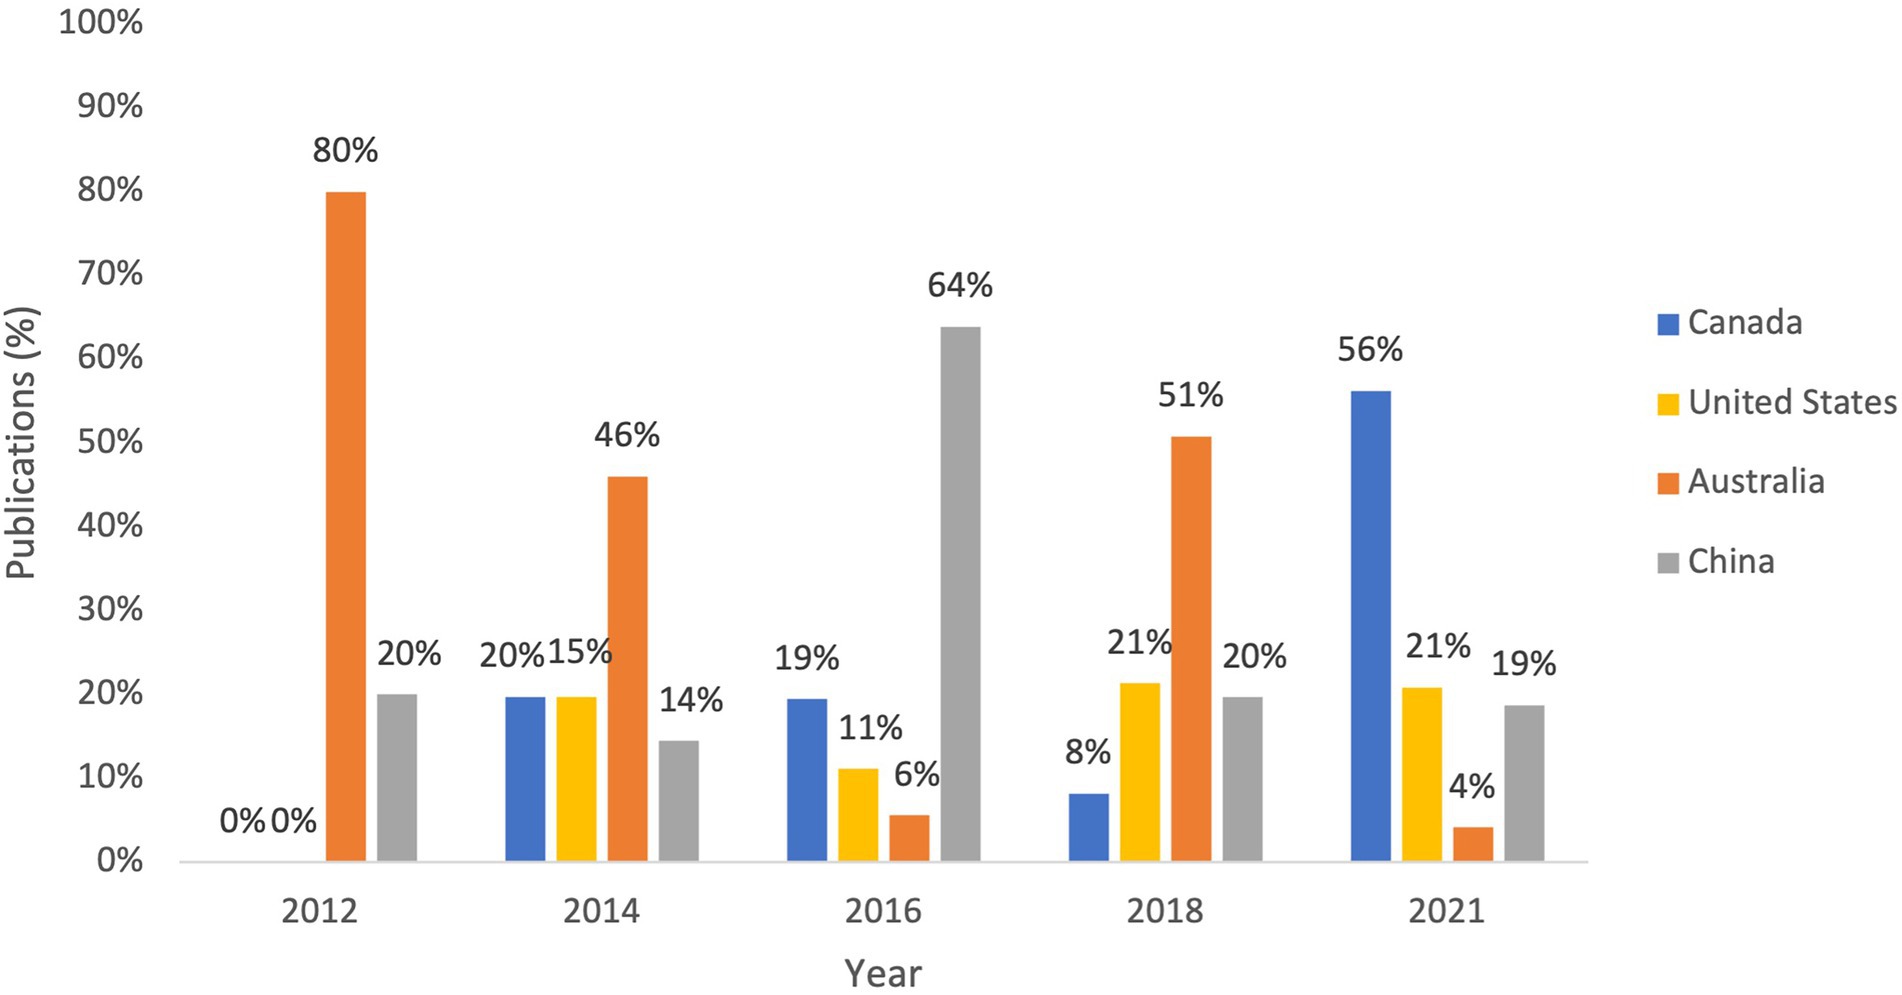
Figure 5. Percentage of submissions per year in category 3, K-12 STEM learner, learning, and learning environment.
Figure 6 shows the percentage of publications in History, epistemology, and perspectives. In 2012, there was a total of 28 publications on this topic. Australia was the major contributor this year accounting for 64% of publications, followed by China (18%), Canada (11%) and United States (7%). A total of 48 publications on this topic were identified in 2014, with Canada ranking first with 40%, Australia accounting for 31%, China 21% and United States 8%. In 2016, a total of 19 publications were coded to this topic, with China accounting for 32%, Australia 11%, and Canada and United States 8% each. In 2018, a total of 27 publications were coded to this topic with China ranking first with 48%, followed by Australia (30%), Canada (15%), and United States (7%). In 2021, 53 publications were coded to this topic, with Canada accounting for 67% of the total, while United States contributed with 30%, China 23%, and Australia 2%. Canada (2014 and 2021) and China (2016 and 2018) were major contributors to this topic in two conferences each. China had increasing trend on the topic until 2021. Despite being the second ranked country in number of publications on the topic in three conferences the results show Australia continuously declined in the number of publications in this topic ranking first in 2012 (64%); second in 2014 (31%), 2016 (11%), and 2018 (33%); and last in 2021 (2%). The United States also had few publications on this topic. Despite a considerable percentage in 2021 (30%), the number of US publications in this topic were below 10% in the other conferences. Overall, Canada is the country with most submissions (n = 65), followed by Australia (n = 44) and China (n = 44), and United States (n = 22).
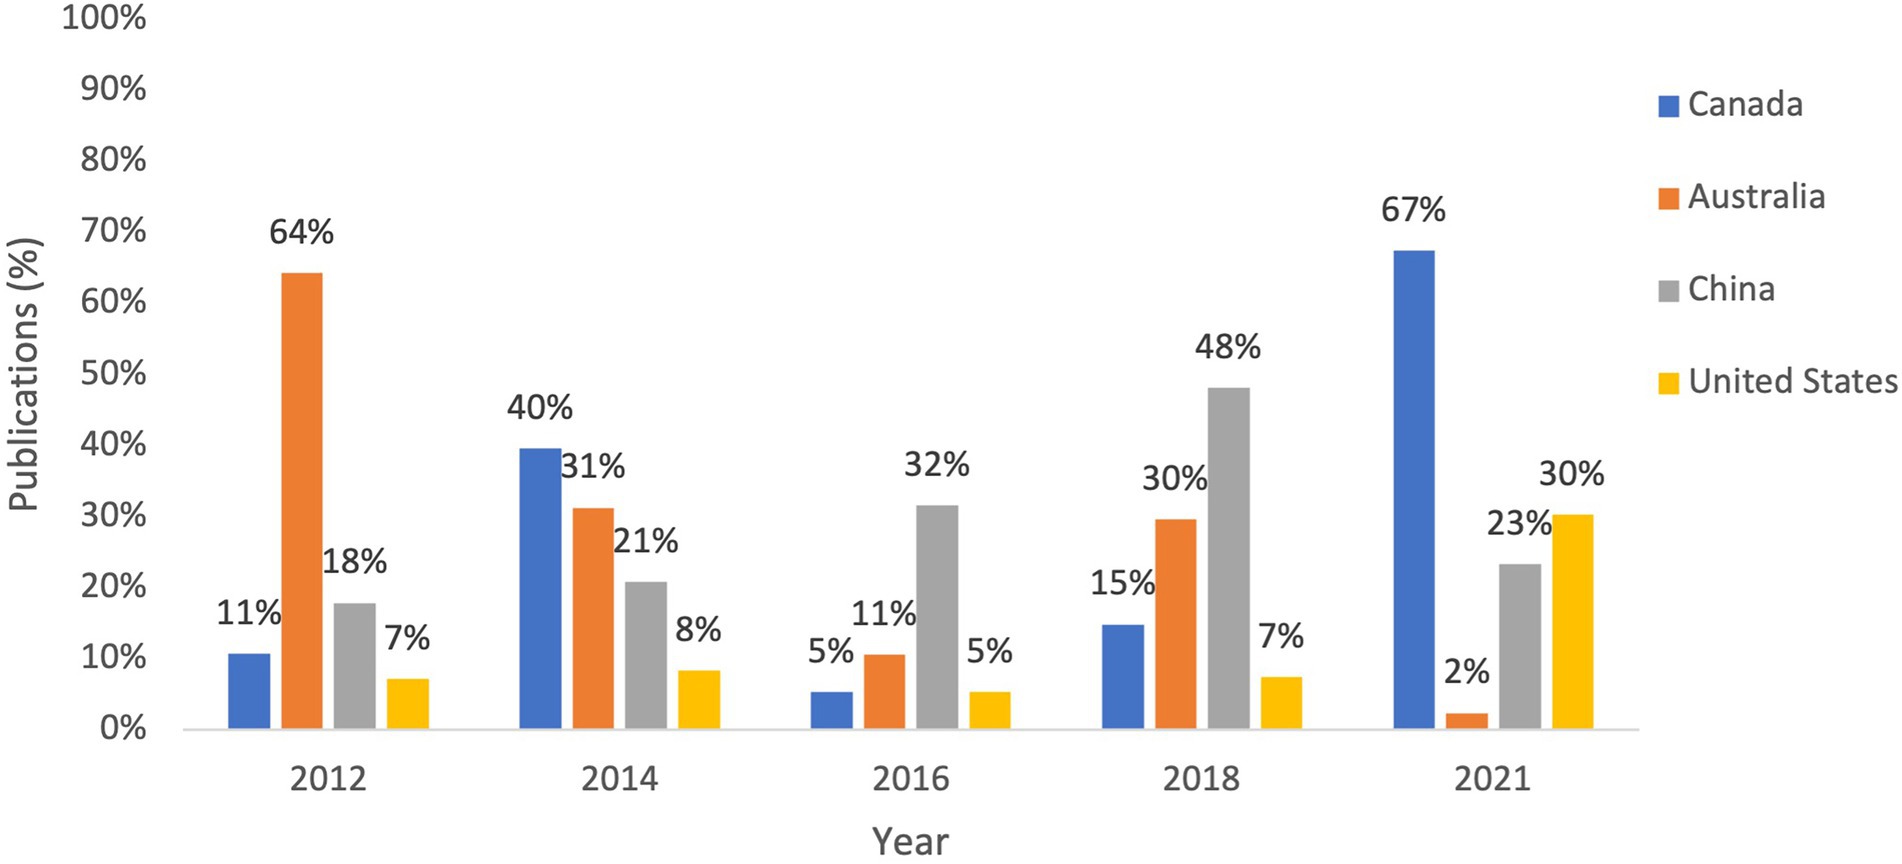
Figure 6. Percentage of submissions per year in category 7, History, epistemology and perspectives.
Figure 7 shows the percentage of publications in Postsecondary STEM learner, learning, and learning environments. In 2012, China (53%), Australia (33%), and United States (13%) contributed to this topic, accounting for the 15 publications in the conference. A total of 43 publications were identified in 2014, with Canada ranking first with 47%, Australia accounting for 33%, United States 14%, and China 7%. Eight publications were coded in this topic in 2016: Canada accounted for 50% of these publications, followed by China and Australia with 25% each. In 2016, only four publications were identified in this topic with Australia and Canada contributing 50% each. In 2021, the number of publications increased to 23, with Canada accounting for 70% of the total, followed by United States with 22%, and Australia with 9%.
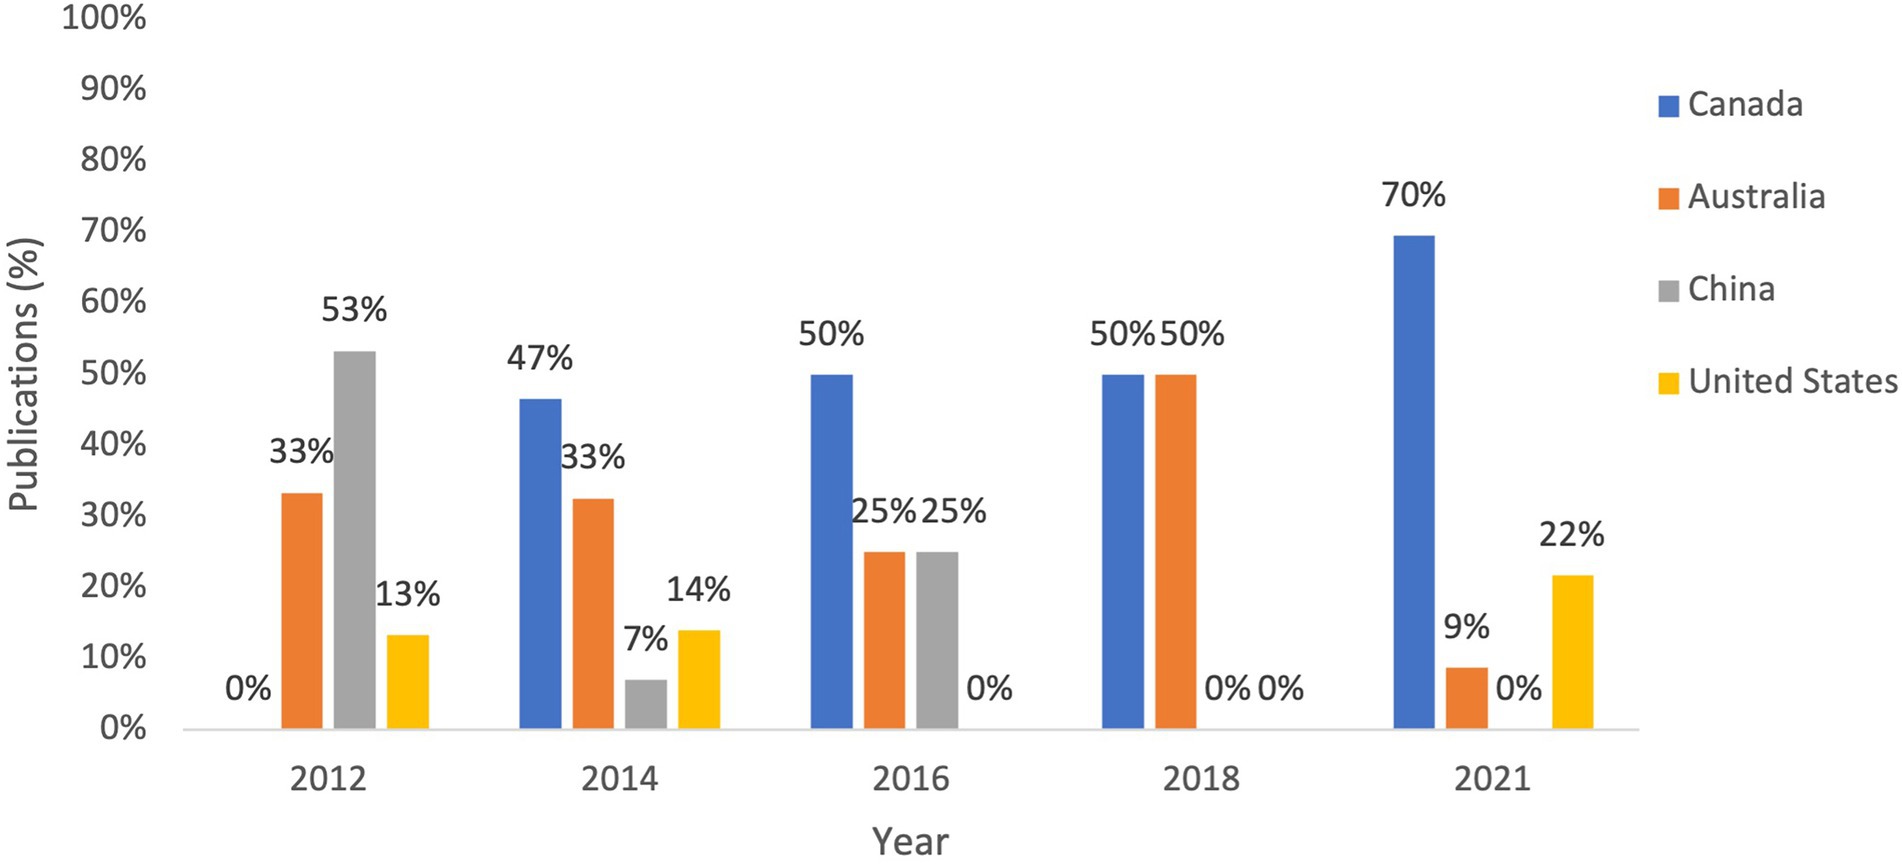
Figure 7. Percentage of submission per year in category 4, postsecondary STEM learner, learning, and learning environment.
Australia was the country with the second highest percentage of publications in 2012 (25%) and 2014 (23%), the third in 2021 (11%), and it was responsible for half the publications in 2018. Canada showed a consistent contribution percentage to the topic from 2014 (47%) to 2018 (50%), with an increase in 2021 (70%). China showed a decrease over the years, ranking first in 2012 (53%), fourth in 2014 (7%), third in 2016 (25%) and did not have publications on this topic since the 2018 conference. Similarly, United States only had publications coded in this topic in 2012 (13%), 2014 (14%), and 2021 (22%). Overall, Canada had the highest number of publications with 42 publications, followed by Australia with 25 publications, and China and United States with a total of 13 publications each.
Figure 8 shows the percentage of publications in Postsecondary STEM teacher and teaching in STEM. In 2012, Australia contributed with 56% of the publications, China 31%, and United States 13% of the 16 publications in the topic. A total of 33 publications in this topic were identified in 2014, with publications coming from Canada (67%) Australia (18%), and United States (15%). In 2016, nine publications were identified on the topic coming from Canada (44%), Australia (44%), and China (11%), while in 2018 only Australia (67%) and Canada (33%) accounted for the three publications in the topic. In 2021, Canada (58%), United States (31%), and Australia (12%) contributed to the 26 publications.
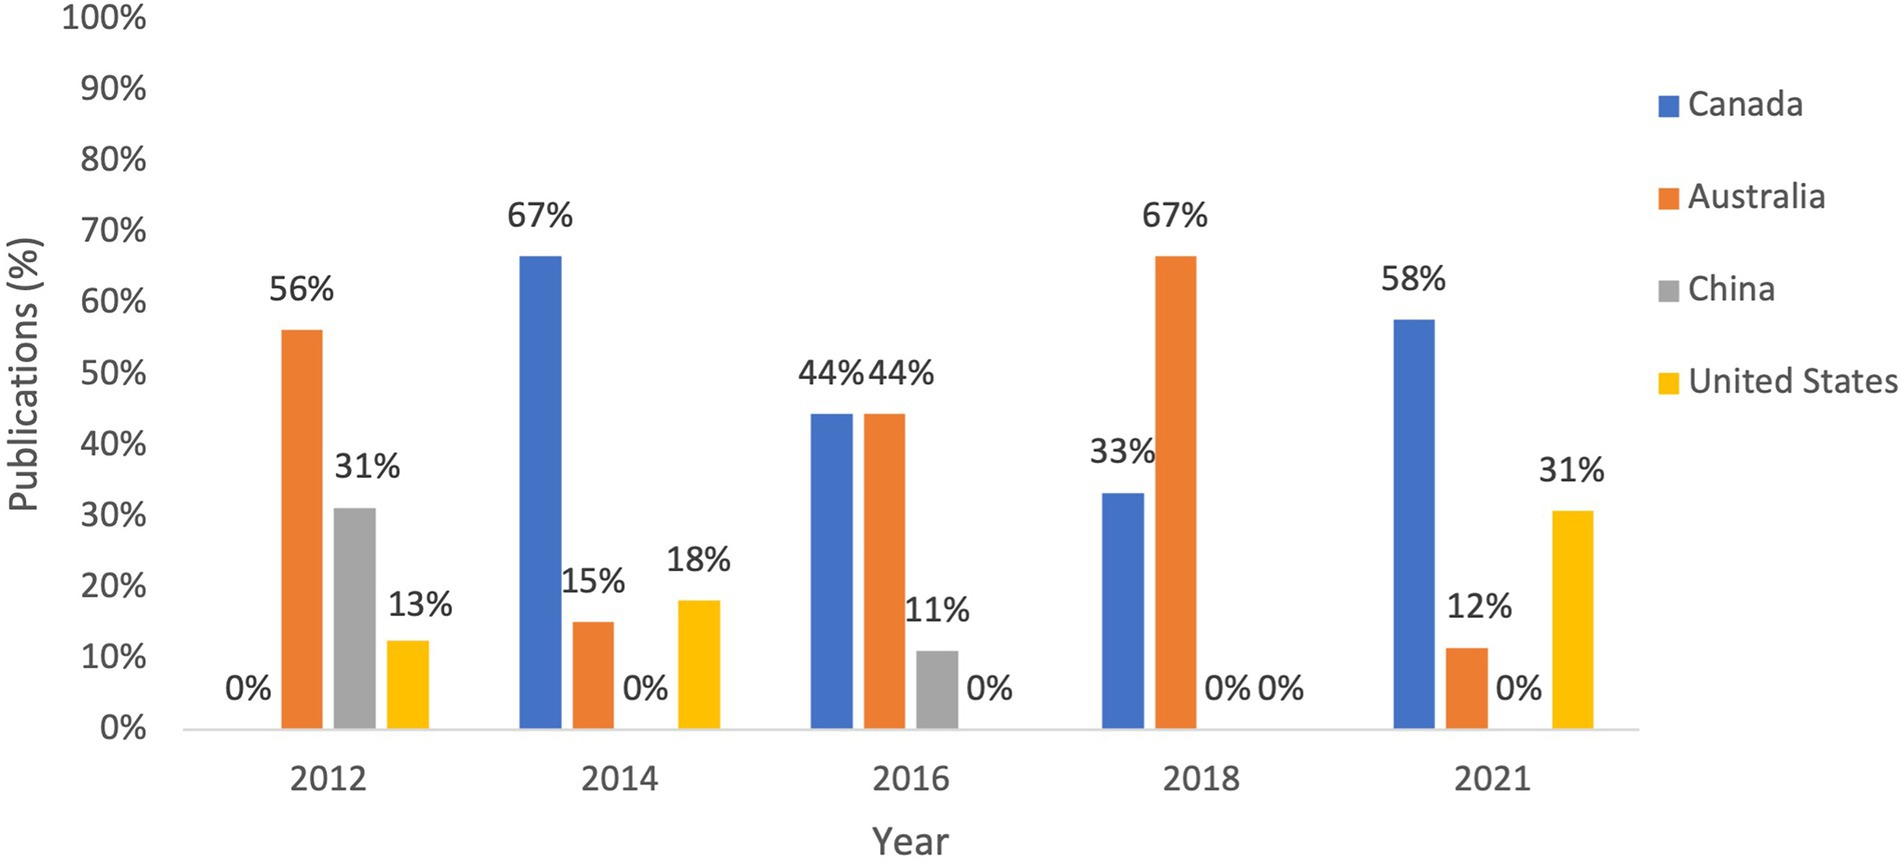
Figure 8. Percentage of submissions per year in category 2, postsecondary teachers and teaching in STEM.
Australia was the country with the most publications in 2012 (56%) and 2018 (67%). Canada had the highest number of publications in 2014 (67%) and 2021 (58%). Both countries ranked first in 2016 with 44% each. China only contributed in the topic in 2012 and 2016. Overall, Canada is the country with the highest number of publications (n = 42), followed by Australia (n = 23), United States (n = 16), and China (n = 6). The results for Postsecondary STEM learners, learning, and learning environments and Postsecondary STEM teacher and teaching in STEM for the top four countries is in accordance with the results addressed previously for all countries and indicate a lack of focus in postsecondary teaching and learning in STEM education research.
Figure 9 shows the percentage of publications in Cultural, social, and gender issues in STEM education. In 2012, there was a total of 9 publications coded to this topic. Australia was the major contributor accounting for 56% of publications, followed by China (33%) and United States (11%). There were no publications from Canada for this topic in the first conference. Canada (66%), United States (24%), and Australia (10%) accounted for the 29 publications coded to this topic in 2014. In 2016, there were only six publications coded coming from Australia (50%), United States (33%), and Canada (17%). Thirteen publications were identified in 2018 with Canada accounting for 46%, Australia 31%, China 15%, and United States 8%. Last, in 2021, 28 publications were coded in this topic, 93% of them coming from Canada and 7% from United States. Australia was the country with the most publications in 2012 (56%) and 2016 (50%), and ranked second in 2018 (31%). Canada did not have any publications in this topic in 2012, but it ranked first in 2014 (66%), 2018 (46%), and 2021 (93%). The United States ranked second in 2014 (24%) and 2016 (33%), and last in 2012 (11%), 2018 (8%), and 2021 (7%). Despite not contributing to the topic in 2012, Canada was by far the country with the most publications in this topic overall (n = 52), followed by Australia (n = 15), United States (n = 13), and China (n = 5).
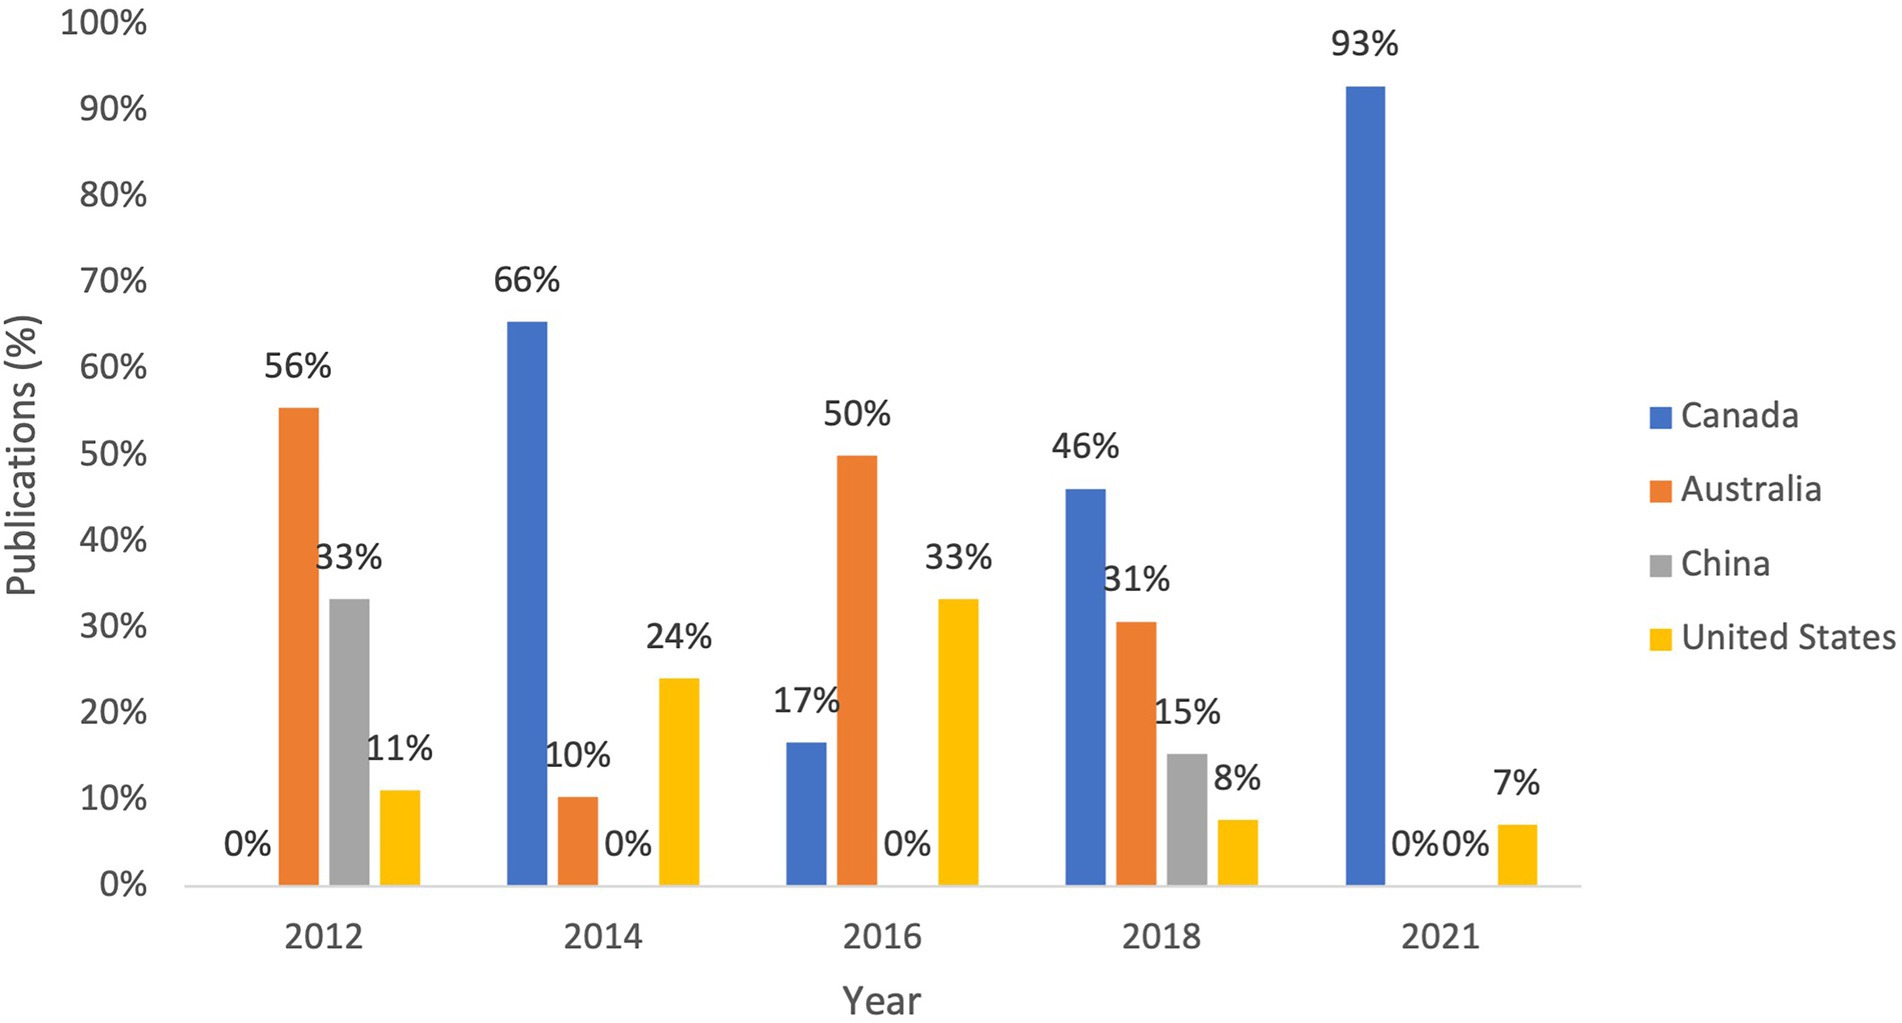
Figure 9. Percentage of submissions per year in category 6, cultural, social, and gender issues in STEM education.
Figure 10 shows the percentage of publications in STEM and industry. In 2012, only Australia with three publications (75%) and China with one (25%) contributed to this topic. In 2014, Australia was responsible for three publications in the topic, while Canada had two (33%) and United States (17%) had one publication coded in this topic. There were no publications coded in this topic in 2016. In 2018, Australia was the only country with publications coded in this topic (n = 7). Last, in 2021, United States contributed with four (56%) publications in the topic and Canada contributed with five (44%) publications.
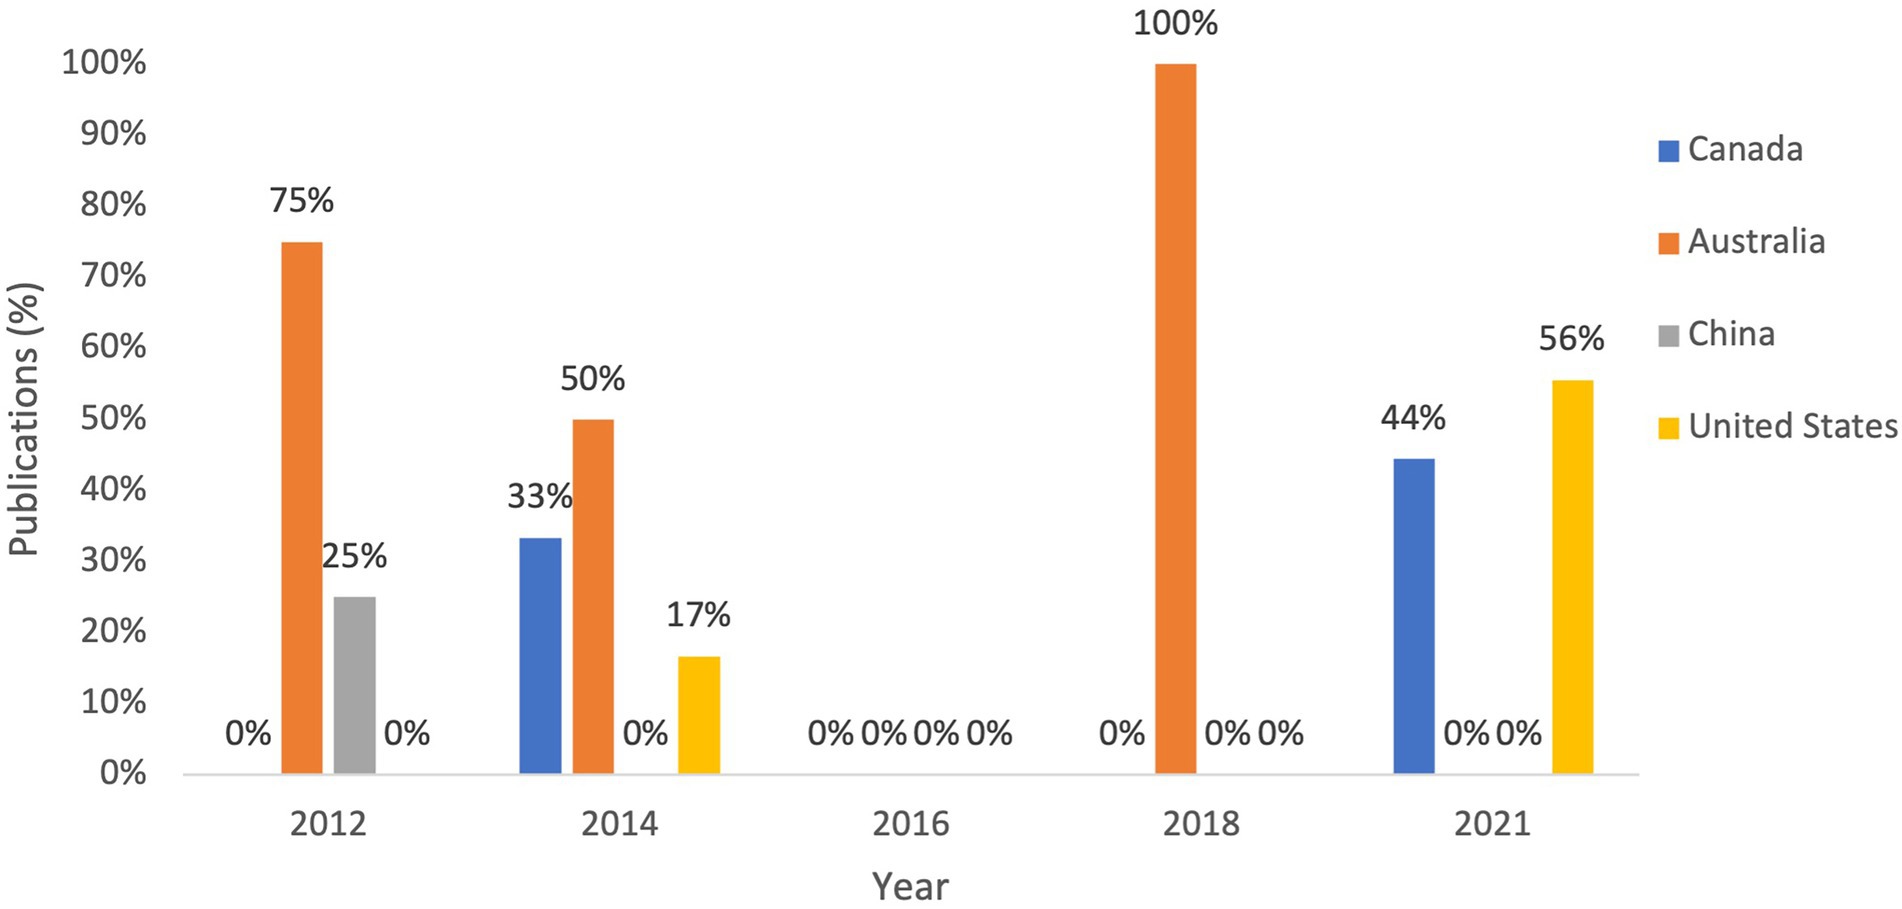
Figure 10. Percentage of submission per year in category 8, STEM and industry.
Australia is the country with the highest number of publications in 2012 (75%), 2014 (50%), and 2018 (100%). Canada and United States accounted together for 100% of the publications in 2021. Similarly, in 2012 China and Australia accounted for all the publications in the topic. Overall, Australia is the country with the most publications (n = 13), followed by Canada (n = 7), and United States (n = 5). China contributed with only one publication in this topic in 2012.
4.5. Analyzing each country’s contribution to the science, technology, engineering and mathematics in education conference
The analysis of how much the top four countries contributed to each one of the topics give us some insight about the diversity of interests in different jurisdictions (Table 4).
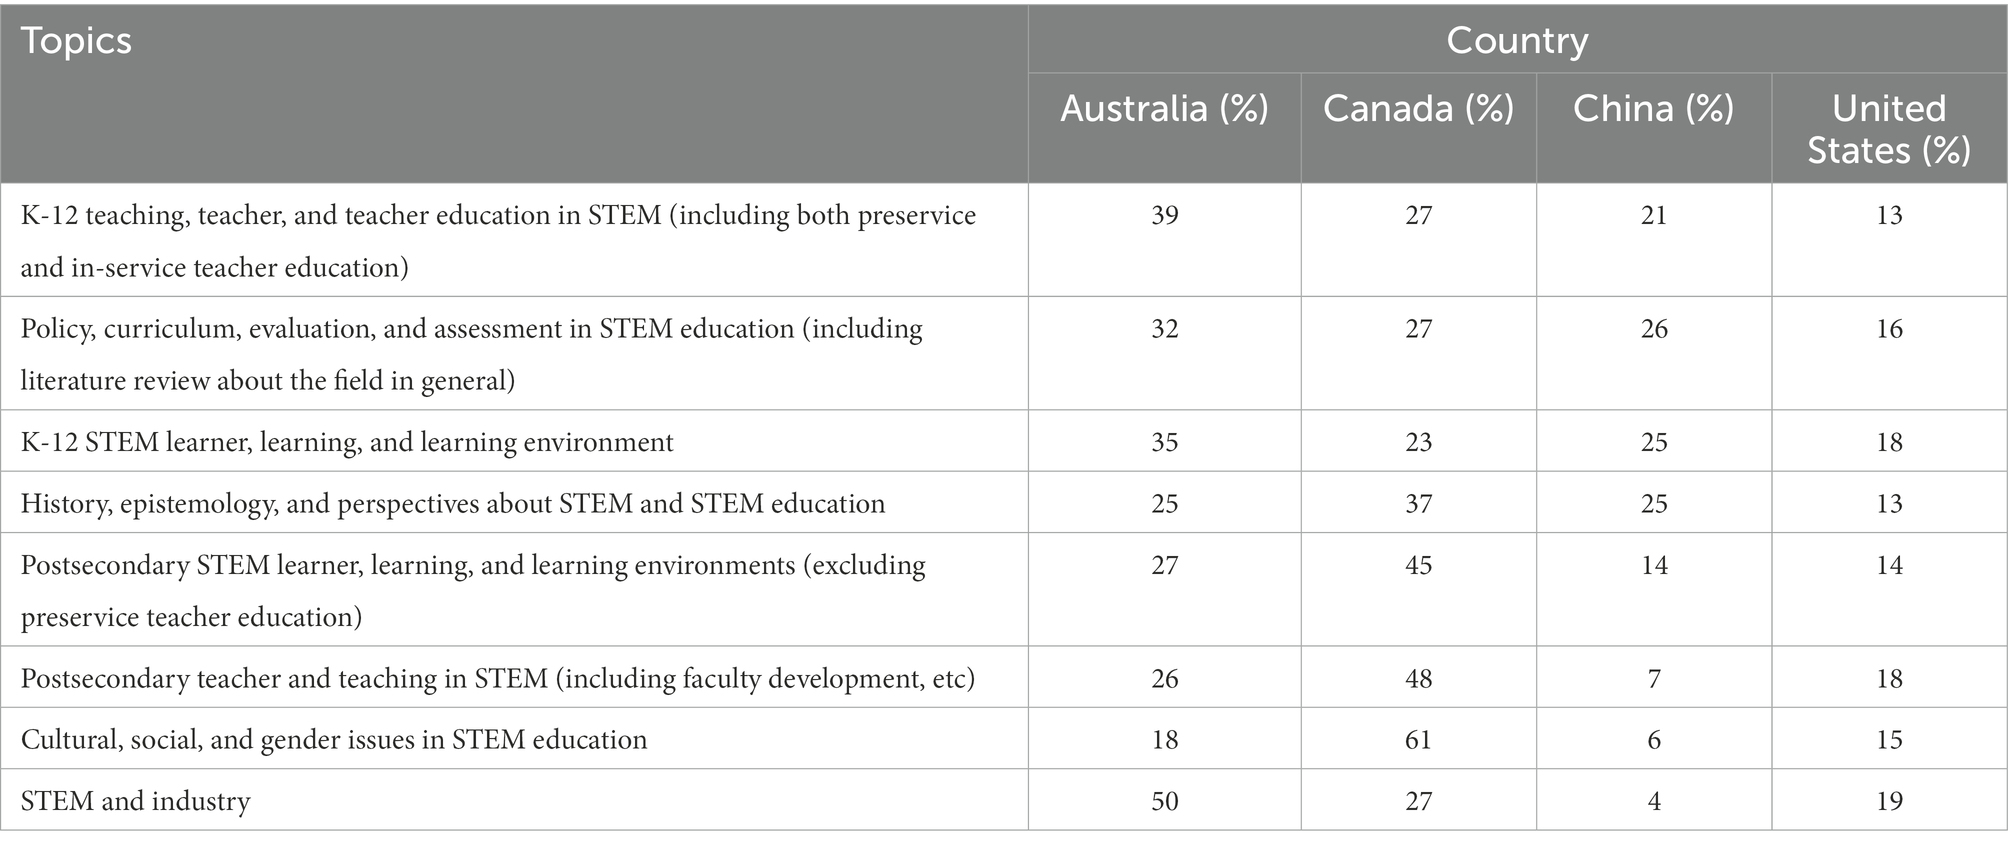
Table 4. Percentage of topics per country across all editions of the STEM in Education Conferences for Australia, Canada, China, and United States.
Canada stood out with 61% of all publications to Cultural, gender, and social issues. Canada also stood out as the country with the most publications on postsecondary STEM education, accounting for 46% of all publications in Postsecondary STEM learner, learning, and learning environments and 48% of all publications in Postsecondary teacher and teaching in STEM. History, epistemology, and perspectives about STEM and STEM education was the only other topic in which Canada accounted for more than 30% of all publications, with 37%. While STEM education in Canada has a strong focus on literacy and technology, the Canadian government and Canadian charitable organizations also have a strong emphasis on inclusion and the creation of opportunities for underrepresented populations. Increasing the number of women who participate in the science and technology sectors, including indigenous peoples, immigrants, and marginalized communities is at the base of the STEM rhetoric and movement in Canada (DeCoito, 2016; Koole and Squires, 2022).
According to Johnson et al., (2020) charities are the most effective STEM organizations in Canada. For instance, organizations such as Let us Talk Science2 and Mitacs3 stand out in their initiatives and impact on STEM education in Canada. Let us Talk Science is a national charitable organization that works with over 50 universities, colleges, and research institutes across Canada. Let us Talk Science is especially committed to providing evidence-based STEM programs and resources to educators for more than 25 years. Mitacs is a nonprofit organization that links the private sector and postsecondary institutions, creating international collaborations to develop Canada’s innovative capacity. The fact that Canada has an influential charitable organization focused on postsecondary education, such as Mitacs, can also explain why Canada had the highest number of submissions in Postsecondary teaching and learning in STEM education. When it comes to funding STEM initiatives, in 2018 the Canadian government committed $4 billion to research through 2023 of which as much as $700 million could be STEM-related (Johnson et al., 2020). In this budget multiple initiatives focus on diversity and inclusion in STEM. For instance, $1.4 billion in financing is designated for female-led small businesses; $210 million for the Canada Research Chairs Program to attract and retain scientists in Canada and to increase diversity among the chairs; $15 million to improve equality and diversity in academia; and $3.8 million to create a strategic plan to build better partnerships and methods of research with indigenous peoples (Johnson et al., 2020).
Australia presented higher percentages in publications regarding K-12 teaching and learning and policy and curriculum, accounting for 39% of all publications in K-12 teaching, teacher, and teacher education in STEM; 35% of all publications in K-12 STEM learner, learning, and learning environment; and 32% of all publications in Policy, curriculum, evaluation, and assessment in STEM education. Australia also dominated publications in STEM and industry with 50% of all publications in the topic. STEM education in Australia has been influenced by different reforms and actions from different stakeholders, national governments, and jurisdictions with a focus on K-12 STEM teaching, learning, and standards. For instance, in 2015 all Australian education ministers agreed on the National STEM School Strategy 2016–2026 (Education Services Australia, 2015). These policy guidelines established two goals that should be priorities in STEM education in Australia until 2026: (i) to ensure that students finish school with foundational knowledge in STEM; and (ii) that they are inspired to take on more challenging STEM subjects. The strategy emphasizes the importance of STEM-literate students for innovation, productivity, and Australian economic growth, and identifies five areas for national action: (i) increasing students’ STEM ability, engagement, participation, and aspiration; (ii) increasing teacher capacity and STEM teaching quality; (iii) supporting STEM education opportunities within school systems; (iv) facilitating effective partnerships with tertiary education providers, business, and industry; and (v) building a strong evidence base. The Murphy et al. (2019) analyses of these strategies concluded that these guidelines show a strong emphasis on developing STEM capabilities in students and building educator capacity, favoring actions aimed at improving educator knowledge and confidence, and supporting the adoption of STEM education practices, whereas other areas like early childhood education and equity receive less explicit treatment in the articulated actions.
While Australia is a federation where education is administered by individual states, the endorsement of governmental STEM initiatives through a national plan resulted in the alignment of resources, such as grants, to implement STEM initiatives at the national and state level (Ellis and Williams, 2020). STEM school education interventions: Synthesis report (Education Council, 2019) brings 69 STEM initiatives nominated by jurisdictions, including a description of the scale, target group/s, and program objective, and information on how well the initiative has achieved its goals, including external evaluation data if such data were available. The report shows an emphasis on initiatives focused on K-12 STEM teaching and learning as 87 and 69% of the STEM initiatives had teachers and students, respectively, as their target audience, while training and university and early childhood were age targets for only one STEM initiative each. Regarding the dominance of Australia in the submissions regarding STEM and industry, the fourth area for national action identified in the National STEM School Strategy emphasizes the need to facilitate “effective partnerships with tertiary education providers, business and industry” (Education Services Australia, 2015, p. 6). Different jurisdictions created sources of funding for this type of initiative. The STEM Industry School Partnerships Program (SISP) funded by the New South Wales Department of Education is an example of this effort where participating schools are matched with industry partners to collaborate in providing activities that are appropriate for each context and age (Ellis and Williams, 2020).
China’s highest percentages are in Policy, curriculum, evaluation, and assessment in STEM education (26%), K-12 STEM learner, learning, and learning environment (25%), History, epistemology, and perspectives about STEM and STEM education (25%), and K-12 teaching, teacher, and teacher education in STEM (21%). Chinese efforts to promote STEM education are also focused on the idea that STEM-literate citizens are essential to the nation’s economic development. Providing the same education for all students through standardization of STEM education and professional development opportunities to STEM educators are at the center of such efforts. Since 2017, the STEM Education Research Center officially has initiated collaborations in these regards and initiated China’s STEM Education White Paper and STEM Teachers Competency Level Standards (Ma, 2021). While the documents pointed out some progress in STEM education, especially in theoretical research and education policy, researchers identify challenges for the future of STEM in China such as the insufficient number of teachers, inadequate teachers’ STEM preparation, poor infrastructure conditions, and the limited macro-regulation and support at a national level for vulnerable groups (Quan, 2020; Zhong et al., 2022). In 2018, following the 2029 Action Plan for China’s STEM Education, a research force was organized to help train school teachers and build different special projects with a focus on STEM teacher training; STEM curriculum development; and local, national, and international cooperative promotions (Quan, 2020). The 2029 Action Plan for China’s STEM Education emphasizes K-12 education, best practices, and the cooperation between government, schools, manufacturers, and high-tech enterprises. The considerable number of submissions in History, epistemology, and perspectives about STEM and STEM education could reflect the discussion around the term STEM in the country. While the term STEM originated in United States initially to address issues regarding technology and the economy in that country, China’s education has been historically influenced by a different tradition and many Chinese educational researchers and practitioners are still pursuing their own educational concept regarding STEM education (Zhong et al., 2022).
Overall, United States was the country that showed less difference in percentages between topics, with the highest percentage being 19% for STEM and industry and the lowest being 13% for History, epistemology, and perspectives about STEM and STEM education. This small difference between categories can be related to the developmental stage of STEM in the country. For instance, while China is still working on developing its own STEM concept, the term STEM started being developed in United States in the 1990s by the National Science Foundation (Sanders, 2008). It is fair to say that STEM policy initiatives in this country developed earlier than in the other top four contributing countries, consequently targeting more areas.
STEM education in United States has been influenced by educational reforms that promote standards, assessment, and best practices, such as No Child Left Behind and Race to the Top and it is highly focused on accountability and producing measurable results (Johnson et al., 2020). Carmichael’s (2017) analysis of STEM policy in 50 states in United States shows that the economy has been the most important factor in implementing STEM programs in the country. Seventy-eight percent of states defined goals related to workforce, jobs, or economic development; 68% had as a goal the provision of STEM education for all students; and 56% had a focus on improving participation of minority groups. The Education Commission of States found that 38 states had policies targeted at STEM teacher recruitment and 23 states provided STEM professional development for high school teachers while only 12 states had policies targeting underrepresented groups in STEM and eight states had policies to support STEM mentoring and internships (Johnson et al., 2020). In 2018, the National Science and Technology Council issued a new US Federal STEM Strategic Plan, the Charting a Course for Success: America’s Strategy for STEM Education. The main goals of the new strategic plan are (Committee on STEM Education, 2018): (i) Build strong foundations for STEM literacy; (ii) increase diversity, equity, and inclusion in STEM; and (iii) prepare the STEM workforce for the future. The plan remarks that STEM-literate citizens are better equipped and prepared to participate in civil society and that United States will only fully benefit from the STEM reforms around the country once all American and especially those historically underserved and underrepresented in STEM fields and employment are included.
5. Conclusions
The descriptive analysis of the 675 abstracts included in the proceedings of the STEM in Education Conferences presented in this paper confirms the dominance of some topics over others in the field of STEM education as was already identified in previous reviews (Chomphuphra et al., 2019; Li, 2019; Li et al., 2020). Policy, curriculum, evaluation and assessment; K-12 teaching, teacher, and teacher education; and K-12 STEM learner, learning, and learning environment are dominant topics in the field while Postsecondary teaching, teacher, and teacher education and Postsecondary learner, learning, and learning environment are drastically less investigated by researchers in the field of STEM education. The presence of Australia, Canada, China, and the United States as the top contributing countries in the field of STEM education is also consistent with the literature, that shows these countries as major contributors to the field of science education and STEM education (Tsai and Lydia Wen, 2005; Chomphuphra et al., 2019). Also, Australia and China accounting for two of the top four contributing countries is consistent with Li et al. (2020), highlighting the growing activity of Asian countries in the field.
The results also indicate the dominance of some topics over others by the national origin of the researchers, shedding light on the different interests of STEM education research among the major contributors to the field. The top four contributing countries have shown a consistent interest in K-12 STEM learner, learning, and learning environments. The United States was the country that showed less variability in terms of percentage among the topics. Canada had by far a larger number of publications on Culture, gender, and social issues at the International STEM in Education Conference. Meanwhile, China had only 6% of all publications on the same topic. Australia stood out with more publications on the topics regarding policy, curriculum, and education reforms; K-12 teaching and learning; and industry. While the number of publications regarding postsecondary STEM education was low, as compared to other topics, Canada stood out for both postsecondary STEM learner, learning, and learning environments and postsecondary teacher and teaching in STEM. Despite the growing demand for STEM professionals in the labor market, overall, the analysis indicates low interest in investigating postsecondary STEM teaching and learning. Even though most publications originated from higher education institutions, the majority of them had K-12 STEM education as the focus of the study. This indicates the necessity of more STEM education research focused on teaching and learning in postsecondary environments.
While we believe the results presented in this paper might indicate some of the directions the field is taking, it is not the aim of this paper to generalize the results to all STEM conferences or even the field of STEM education research. This is a limitation of this study. Our analysis points to some trends among these countries, but more studies need to be conducted to investigate these and other STEM education trends. The field would benefit from additional studies investigating the types of research methods and theories used in the field as well as the most commonly used instructional methods in STEM education. Despite the limitations of analyzing conference proceedings in comparison to peer-reviewed academic journals, we suggest conference proceedings should be used as a source of data and its analysis as a tool to better understand emerging trends in the field of STEM education. It is a notable characteristic of the STEM education research that studies are published in a variety of journals across different domains. There is a necessity to identify scholarly work in STEM education and how the field has been changing and responding to the consolidation of STEM education research in academic journals as well as national policies. While recent reviews in the field have included a large selection of academic journals—usually limiting the scope of the review to papers that explicitly contain the STEM acronym—academic conferences in STEM education are specifically targeted to STEM education scholars, teachers, and students. Thus, they gather studies specifically focused on the field of STEM education. While the analysis of conference proceedings in STEM should not replace the analysis of trends in academic journals, it can add important insights when investigating hot topics and trends in STEM education and the growth and evolution of the field.
Data availability statement
The raw data supporting the conclusions of this article will be made available by the authors, without undue reservation.
Author contributions
RS: manuscript writing, reviews, editing, data analysis, and interpretation. DA and MM-B: reviews, analysis, and interpretation of data. All authors contributed to the article and approved the submitted version.
Conflict of interest
The authors declare that the research was conducted in the absence of any commercial or financial relationships that could be construed as a potential conflict of interest.
Publisher’s note
All claims expressed in this article are solely those of the authors and do not necessarily represent those of their affiliated organizations, or those of the publisher, the editors and the reviewers. Any product that may be evaluated in this article, or claim that may be made by its manufacturer, is not guaranteed or endorsed by the publisher.
Footnotes
References
Anderson, D., Milner-Bolotin, M., Santos, R., and Petrina, S. (eds). (2021). STEM 2021 proceedings: 6th international STEM in Education Conference. Vancouver, BC, Canada: University of British Columbia. doi: 10.14288/1.0402129
Ben-David Kolikant, Y., Martinovic, D., and Milner-Bolotin, M. (eds). (2020). STEM teachers and teaching in the digital era: Professional expectations and advancement in 21st century schools. Cham, Switzerland: Springer doi: 10.1007/978-3-030-29396-3.
Breiner, J., Harkness, M., Johnson, C. C., and Koehler, C. (2012). What is STEM? A discussion about conceptions of STEM in education and partnerships. Sch. Sci. Math. 112, 3–11. doi: 10.1111/j.1949-8594.2011.00109.x
Brown, J. (2012). The current status of STEM education research. J. STEM Educ. Innov. Res. 13, 7–11.
Carmichael, C. C. (2017). A state-by-state policy analysis of STEM education for K-12 public schools (Doctoral dissertation). Seton Hall University Dissertations and Theses (ETDs). Available at: https://scholarship.shu.edu/cgi/viewcontent.cgi?article=3342&context=dissertations
Chomphuphra, P., Chaipidech, P., and Yuenyong, C. (2019). Trends and research issues of STEM education: a review of academic publications from 2007 to 2017. J. Phys. Conf. Ser. 1340:12069. doi: 10.1088/1742-6596/1340/1/012069
Committee on STEM Education (2018). Charting a Course for Success: America’s Strategy for STEM Education. Executive Office of the President.
DeCoito, I. (2016). STEM education in Canada: a knowledge synthesis. Can. J. Sci. Math. Technol. Educ. 16, 114–128. doi: 10.1080/14926156.2016.1166297
Diekman, A. B., and Benson-Greenwald, T. M. (2018). Fixing STEM workforce and teacher shortages: how goal congruity can inform individuals and institutions. Policy Insights Behav. Brain Sci. 5, 11–18. doi: 10.1177/2372732217747889
Education Services Australia (2015). National STEM School Education Strategy, 2016–2026. Australia: Education Council.
Education Council (2019). STEM school education interventions: synthesis report. Available at: https://www.dese.gov.au/download/12535/stem-education-initiatives-synthesis-report/23627/stem-education-initiatives-synthesis-report/pdf (Acessed December 20, 2022).
Ellis, D., and Williams, P. J. (2020). “STEM policy in Australia” in Handbook of research on STEM education eds. C. C Johnson, M. J. Mohr-Schroeder, T. J. Moore, and L. D. English, Handbook of Research on STEM Education (1st ed). (New York: Routledge), 428–442. doi: 10.4324/9780429021381-40
Freeman, B., Marginson, S., and Tytler, R. (2019). “An international view of STEM education” in STEM education 2.0. eds. Sahin, A., & Mohr-Schroeder, M. J. (Eds.). (12 Aug. 2019). STEM Education 2.0. Leiden, The Netherlands: Brill. 350–363.
Herranen, J. K., Fooladi, E. C., and Milner-Bolotin, M. (2021). Editorial: special issue “promoting STEAM in education”. LUMAT 9, 1–8. doi: 10.31129/LUMAT.9.2.1559
Holmes, K. M., Atkinson-Hamilton, P., Dooley, A., Durham, T., Hardrict-Ewing, G., Heisler, D., et al. (2017). Analysis of a STEM education professional development conference for pre-service educators (Thesis: ProQuest Dissertations & Theses Global). University of Missouri - Saint Louis ProQuest Dissertations Publishing. Available at: https://www.proquest.com/dissertations-theses/analysis-stem-education-professional-development/docview/1964384552/se-2?accountid=14656
Johnson, C. C., Walton, J. B., and Breiner, J. M. (2020). STEM Policy in the United States and Canada. In Handbook of Research on STEM Education. Routledge 400–415.
Kayan-Fadlelmula, F., Sellami, A., and Abdelkader, N. (2022). A systematic review of STEM education research in the GCC countries: trends, gaps and barriers. IJ STEM 9:197 doi: 10.1186/s40594-021-00319-7
Koole, M., and Squires, V. (2022). “The education system of Canada: ICT and STEM balancing economics with social justice” in The education Systems of the Americas. eds. S. Jornitz, M. P. do Amaral (Cham: Springer International Publishing), 327–348.
Li, Y. (2019). STEM education research and development as a rapidly evolving and international field. J. Math. Educ. 28, 42–44. doi: 10.1007/s41979-019-00020-z
Li, Y., Froyd, J. E., and Wang, K. (2019). Learning about research and readership development in STEM education: a systematic analysis of the journal’s publications from 2014 to 2018. Int. J. STEM Educ. 6:19. doi: 10.1186/s40594-019-0176-1
Li, Y., Wang, K., Xiao, Y., and Froyd, J. E. (2020). Research and trends in STEM education: a systematic review of journal publications. Int. J. STEM Educ. 1, 1–16. doi: 10.1186/2196-7822-1-1
Ma, Y. (2021). Reconceptualizing STEM education in China as praxis: a curriculum turn. Sustainability, 13:4961. doi: 10.3390/su13094961
Madani, R. A., and Forawi, S. (2019). Teacher perceptions of the new mathematics and science curriculum: a step toward STEM implementation in Saudi Arabia. J. Educ. Learn. 8:202. doi: 10.5539/jel.v8n3p202
Marginson, S., Tytler, R., Freeman, B., and Roberts, K. (2013). STEM: Country comparisons. Australian Council of Learned Academies.
Martinovic, D., and Milner-Bolotin, M. (2022). “Problematizing STEM: what it is, what it is not, and why it matters” in 15 years of MACAS (mathematics and its connections to the arts and sciences). eds. C. Michelsen, A. Beckmann, V. Freiman, U. Thomas Jankvist, and A. Savard (Springer Nature) 135–162.
Mizell, S., and Brown, S. (2016). The current status of STEM education research 2013- 2015. J. STEM Educ. Innov. Res. 17, 52–56.
Murphy, S., MacDonald, A., Danaia, L., and Wang, C. (2019). An analysis of Australian STEM education strategies. Policy Fut. Educ. 17, 122–139. doi: 10.1177/1478210318774190
Nugroho, O. F., Permanasari, A., and Firman, H. (2019). The movement of stem education in Indonesia: science teachers’ perspectives. Jurnal Pendidikan IPA Indonesia 8, 417–425. doi: 10.15294/jpii.v8i3.19252
Quan, G. (2020). “Tracking STEM education development in China: National, regional, and local influences” in STEM in the technopolis: The power of STEM education in regional technology policy. eds. C. Zintgraff, S. Suh, B. Kellison, and P. Resta (Cham: Springer) doi: 10.1007/978-3-030-39851-4_14
Sharma, J., and Yarlagadda, P. K. (2018). Perspectives of ‘STEM education and policies’ for the development of a skilled workforce in Australia and India. Int. J. Sci. Educ. 40, 1999–2022. doi: 10.1080/09500693.2018.1517239
Subramanian, S. (2020). The importance of conferences and networking in PhD and postdoctoral training. Curr. Prot. Essen. Lab. Techn. 21:e44. doi: 10.1002/cpet.44
Tsai, C. C., and Lydia Wen, M. (2005). Research and trends in science education from 1998 to 2002: a content analysis of publication in selected journals. Int. J. Sci. Educ. 27, 3–14. doi: 10.1080/0950069042000243727
Xu, M., Williams, P. J., Gu, J., and Zhang, H. (2019). Hotspots and trends of technology education in the international journal of technology and design education: 2000-2018. Int. J. Technol. Des. Educ. 30, 207–224. doi: 10.1007/s10798-019-09508-6
Yamada, A. (2019). Japanese higher education reform trends in response to globalization and STEM demand. J. Comp. Int. High. Educ. 9, 14–22. Available at: https://ojed.org/index.php/jcihe/article/view/891
Keywords: STEM education, emerging STEM education trends, STEM teacher education, STEM international community, STEM education conferences
Citation: Santos R, Anderson D and Milner-Bolotin M (2023) Research trends in international science, technology, engineering, and mathematics education conference series: An analysis of a decade of proceedings. Front. Educ. 7:1099658. doi: 10.3389/feduc.2022.1099658
Edited by:
Xiang Hu, Renmin University of China, ChinaReviewed by:
Jingshun Zhang, Florida Gulf Coast University, United StatesJanika Leoste, Tallinn University, Estonia
Copyright © 2023 Santos, Anderson and Milner-Bolotin. This is an open-access article distributed under the terms of the Creative Commons Attribution License (CC BY). The use, distribution or reproduction in other forums is permitted, provided the original author(s) and the copyright owner(s) are credited and that the original publication in this journal is cited, in accordance with accepted academic practice. No use, distribution or reproduction is permitted which does not comply with these terms.
*Correspondence: Rodrigo Santos, ✉ cm9kcmlnby5zYW50b3NAdWJjLmNh