
94% of researchers rate our articles as excellent or good
Learn more about the work of our research integrity team to safeguard the quality of each article we publish.
Find out more
ORIGINAL RESEARCH article
Front. Educ., 09 December 2022
Sec. STEM Education
Volume 7 - 2022 | https://doi.org/10.3389/feduc.2022.1087064
This article is part of the Research TopicInnovations and Technologies in Science/STEM Education: Opportunities, Challenges and Sustainable PracticesView all 13 articles
 David P. Wick1,2*†
 Emmanuel Atindama3*†
 Prashant Athavale2,3*
 Sumona Mondal3
 Michael W. Ramsdell2,4
 Robert P. Jaspersohn4John C. Moosbrugger2,5
Introduction: Student success in Science, Technology, Engineering, and Mathematics (STEM) is a national concern. To increase engineering retention and graduation rates at a small private institution, a university council developed a binary classifier to identify high-risk students and proposed interventions that included decoupling first-year Physics and Calculus courses, support in introductory Calculus, and Spatial Visualization (SV) training. This paper aims to validate the binary classifier used to identify the under-prepared students entering their first year and assess the impact of the interventions. We provide a comparative analysis of student success metrics for high-risk engineering students across a decade of cohorts, including 5 years before (2006–2010) and 5 years after (2011–2015) implementation of intentional strategies.
Methods: We validated the binary classifier using an accuracy measure and Matthews Correlation Coefficient (MCC). We used the 2-population proportion test to compare STEM retention and 4- and 6-year graduation rates of High-Risk engineering students before and after interventions and compare student performance in early foundation STEM courses across the same time frame.
Results: The binary classification model identified High-Risk students with an accuracy of 63–70% and an MCC of +0.28 to +0.30. In addition, we found statistically significant improvement (p < 0.001) in the STEM retention rates, 6-year graduation rates, and first part of Physics, Calculus, and Chemistry sequences after the interventions.
Discussion: The methodology and strategies presented may provide effective guidance for institutions seeking to improve the overall performance of undergraduate students who otherwise might struggle in their first-year engineering curriculum.
Recognition of the importance of Science, Technology, Engineering, and Mathematics (STEM) as a national concern has been the subject of multiple reports over many years (Zumeta and Raveling, 2001; National Science Board, 2007; National Academy of Sciences, 2010; National Science Foundation, 2010a,b; Provasnik et al., 2012; National Research Council, 2013). At the highest level, the President's Council of Advisors on Science and Technology called for higher education institutions to produce more STEM graduates in order for the United States to remain competitive in the global economy (Olson and Riordan, 2012). Considering that approximately half of bachelor's degree-seeking students who enter STEM fields switch out of or fail to complete a STEM degree, increasing the retention of students who have already entered the STEM education pipeline is paramount to achieving this goal (Chen, 2013).
The reasons for students departing from STEM majors are varied, and intersecting factors make analyses as complex as the process of designing effective interventions. For example, STEM attrition rates are greater for women, historically underrepresented students of color, and first-generation students (Anderson and Kim, 2006; Griffith, 2010; Hill et al., 2010; Shaw and Barbuti, 2010). Non-cognitive factors such as motivation and self-efficacy also impact student success in STEM (Burtner, 2005; Al-Sheeb et al., 2019). Additionally, students who are less prepared academically for the challenge of a STEM curriculum have higher attrition rates (Astin and Astin, 1992; Shaw and Barbuti, 2010; Whalen and Shelley, 2010).
In this paper, we describe a methodology to identify and help under-prepared students entering undergraduate majors in STEM at a small technologically-oriented research university. In Section 2.1, we describe a binary classifier developed using student performance data over 5 years (2006 to 2010) to identify students who may be at a higher risk of failing in one or more early foundation STEM courses. We then used the classifier to advise interventions for engineering students categorized as “high risk” from 2011 to 2015. The primary intervention directed these students along an alternative curriculum pathway, intentionally decoupling the timing of first-year Calculus and Physics courses, traditionally taken simultaneously during the first semester. Additional interventions included mandatory enrollment of students in a Co-Calculus support course taken in tandem with Calculus and an optional training course offered to students identified with low spatial visualization skills. We investigate the following questions in this paper:
1. Is the binary classification methodology valid in identifying high-risk students?
2. Did the interventions have a positive impact on the graduation rates and STEM retention rates for high-risk engineering students?
3. Did the interventions have a positive impact on student success in the early foundation STEM courses?
The university uses a “Common-Core Curriculum” of first-year courses that provides engineering students with relatively flexible options for exploring and changing majors within the engineering disciplines. This work only considers first-year students without advanced placement credits for Calculus, Physics, or Chemistry. For such students, the traditional pathway through any discipline in engineering includes the following early foundation STEM courses taken during the first year: two sequential semesters each of Calculus (Calculus I and II), Calculus-based Physics (Physics I and II), and Chemistry (Chemistry I and II). Calculus is a co-requisite for Physics, meaning students need to take it with or prior to taking Physics. Physics and Chemistry have laboratory components and are, consequently, 4-credit courses. Calculus is a 3-credit course; however, Calculus I includes a complementary 2-credit Co-Calculus support course.
The rigid sequencing of required STEM courses in engineering can present challenges for students trying to navigate myriad pre and co-requisites successfully. The ‘common curriculum' provides exploratory opportunities across engineering disciplines for most students who complete the core courses successfully and sequentially. However, the standard sequence can present obstacles that inhibit on-time progression for a portion of students who struggle during the first semester. For example, students who fail Physics I in the first semester typically retake it in the second semester, and if successful during their second attempt, still find themselves one course behind in their program. Such students have to face an overloaded subsequent semester or take a summer make-up course to avoid extending their time to degree completion. Even more detrimental is the case for students who fail Calculus I in the first semester. Even if they pass their Calculus-based Physics I course, they must retake Calculus I in the second semester and are prohibited from progressing to Physics II, which requires Calculus II as a co-requisite. Such students find themselves even further behind after just starting their engineering major. Furthermore, students who pass but score below a C grade are strongly encouraged by the engineering departments to retake Calculus and Physics as these courses are prerequisites for future courses in engineering and set the foundation for success in those courses. For reference, from 2006 to 2010, the percentage of all STEM students failing to achieve a C grade or better in their first semester of Physics and Calculus was approximately 25 and 33%, respectively (Jaspersohn, 2017).
In 2010, the university formed a First-Year Council to implement and coordinate strategies to improve student performance and retention in STEM majors. The council initiated a plan to identify each incoming student's preparedness for the first-year STEM experience by formalizing the collection of the following pre-college or pre-entry survey data. We list these instruments with generic labels for consistency in this article, with their formal titles and references in parentheses.
1. Math Diagnostic Survey (Clarkson University Math Skills Assessment) (Turner, 2008)
2. Physics Diagnostic Survey (FCI-Force Concepts Inventory) (Hestenes et al., 1992), and
3. Spatial Visualization Survey (Rotations component of the Purdue Spatial Visualization assessment) (Guay and McDaniel, 1977).
The Physics Diagnostic Survey provides a measure of conceptual understanding of Newtonian Physics without mathematical calculations, while the Math Diagnostic Survey assesses basic Mathematics skills relevant to beginning STEM majors. Combined, they provide predictive evidence of student performance in the early foundation STEM courses. The council identified the most under-prepared or “high-risk” students by comparing incoming student data (beginning in 2011) with historical data collected previously (2006–2010, pre-intervention years) and leveraging existing analyses. It used this information to inform the development of strategies going forward. Pre-enrollment measures capable of identifying each student's risk level allowed for targeted placement recommendations based on individual needs (2011–present, intervention years). The council enacted the following strategies in an attempt to improve student achievement in introductory STEM courses and increase retention and graduation rates in STEM majors:
1. Alternative pathway: The council provided engineering students identified in the high-risk category from Fall 2011 onward with an alternate schedule (strategic placement recommendation). In this schedule, the council moved Physics I to the second semester (and this consequently moved Physics II to the third semester) and replaced it with a required engineering course titled Engineering and Society (Moosbrugger et al., 2012; Chapman et al., 2015). The rationale was that by decoupling Physics I and Calculus I from the same semester, the least prepared engineering students would have a better chance of improving their mathematics skills before taking Calculus-based Physics. Essentially, this change delayed Physics by design for the students in the high-risk category instead of necessity (through failure, as was the case historically for many of these students) without sacrificing time for degree completion. Note that this change required some engineering departments to consider additional or customized extensions of the alternative pathway for their second-year courses that require Physics II as a pre/co-requisite. However, with the encouragement of the First Year Council, departments saw value in accommodating students preemptively by design as a proactive measure that reinforced the university's commitment to student success.
2. Co-calculus for all: Before 2011, the university automatically scheduled only students who scored low on the pre-entry Math Diagnostic Survey for the Co-Calculus support course, a low-credit mathematics skills course that complements Calculus. Since only low-scoring students were enrolled, a negative stigma was associated with this approach. On the council's recommendations, beginning in 2011, the university placed all Calculus students in Co-Calculus, regardless of their pre-entry score. Students were given the choice of remaining throughout the semester (to receive credit) or testing out once they achieved a normalized score of 0.90 or higher on a subsequent competency test (given nearly weekly), essentially shifting the course perception from a “fail in” model to a more positive “pass out” model. From 2011 to 2015, approximately 19% of the 3961 students enrolled in the first semester of Co-Calculus opted to forego credit and exit the course after achieving successful scores, including 24% of the 827 engineering students categorized as high-risk.
3. Optional spatial visualization (sv) training: Students whose normalized score fell below a selected cut-off (typically between 0.60 and 0.70) on the Rotations component of the Purdue Spatial Visualization assessment prior to entry were automatically scheduled for a one-semester SV training course (meeting once per week) from Fall 2012 onward. On the first training day, the students were encouraged to participate but were not required to remain. Each year, the cut-off varied to accommodate the reality of scheduling constraints (section capacity). From 2012 to 2015, approximately 13.6% of 1,851 incoming engineering students participated in Spatial Visualization training, including 19% of the 650 engineering students categorized as high-risk.
Building upon historical data collected over multiple years (Turner, 2008), the First-Year Council initiated a comprehensive assessment of first-year performance in the introductory Calculus and Physics courses, supported by a 2009 grant from Procter & Gamble (P&G) (Schalk et al., 2009, 2011). The results of a Principal Component Analysis (PCA) of historical pre-entry or initial state data identified the Mathematics and Physics Diagnostic scores as relatively independent measures capable of explaining a significant amount of variance in the data (Schalk et al., 2009). To illustrate this, we created a sunflower plot (Figure 1) of historical initial state data (Fall 2006–2010 cohorts) of paired normalized Mathematics and Physics Diagnostic scores (N=1,982) for incoming students co-enrolled in both Calculus I and Physics I during their first semester. A solitary dot in the sunflower plot represents a single data point, whereas multiple petals represent multiple points at the same coordinate location. The blue and red colors, respectively, distinguish between students who were ultimately successful and those who were unsuccessful in their first semester Physics I course (as defined in Section 2.2).
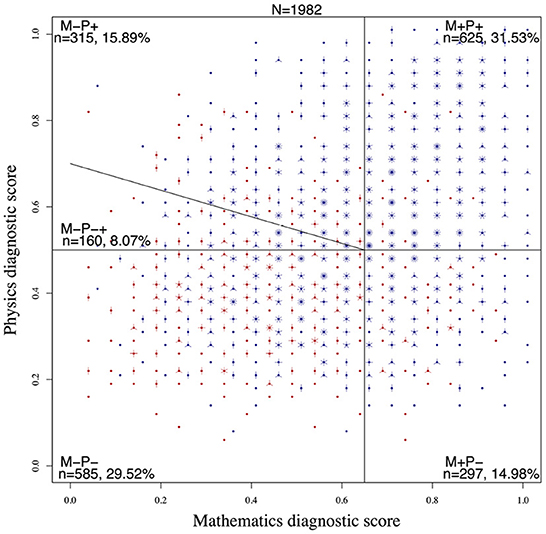
Figure 1. Sunflower plot of initial state data (Mathematics and Physics diagnostic scores) from 2006 to 2010 with group labels, counts, and percent of the total number of students. There were N = 1,982 total students considered during this period who took the Mathematics and Physics diagnostic tests. The number n (lowercase) in each subgroup (M+P+, M−P+, M−P−+, M−P−, and M+P−) indicates the number of students in that subgroup. We also indicate the percentage of these numbers out of the total number N. Whenever data points with “S” and “U” grades overlapped, we added a slight offset for clarity.
The scatter in the data highlights the diversity of incoming student preparation levels. The sunflower plot divides the data into four quadrants based on students' performance on the Mathematics and Physics Diagnostic Surveys. We defined “success” on the Physics Diagnostic Survey as scoring 50% or more and “success” on the Mathematics Diagnostic Survey as 65% or more. We detail the rationale for these cutoffs in Section 3.2. Thus, the sunflower plot provides four general groups or quadrants indicating relative preparedness levels in Mathematics and Physics.
Each group, labeled with an “MP” for Math/Physics and “+” or “−” designation denoting a relative strength or weakness, respectively, represents a preparedness level. Thus, we have four risk categories: M+P+, M+P−, M−P+, and M−P−. Students considered to be well-prepared in both Mathematics and Physics are categorized as Low-Risk (M+P+), while students who are ill-prepared for both are considered High-Risk (M−P−). We categorized the students who are well-prepared in one but ill-prepared in the other as Medium-Risk (M+P− and M−P+). As a logistical control mechanism for maximizing enrollment in the Engineering and Society course during the intervention years, a small number of M− students who were just above the Physics cutoff were included in the Alternative Pathway recommendation for the Fall 2012 cohort and beyond. This additional group represents the highest risk students in the M−P+ Medium-Risk category and is labeled as M−P−+, shown as a wedge in Figure 1. Students in this subgroup were relabeled as high-risk, thus expanding the total count of students in the High-Risk category. Since the classification aims to identify high-risk students, we combine the low and medium-risk students into a single category, leading to binary classification.
Before using the classification model described in Section 2.1 in practice, we needed to validate the model's predictive capability. To this effect, we considered the final grades in the first-year foundational STEM courses relative to the identified risk categories for Fall 2006–2010 cohorts. We used the Receiver Operating Characteristics (ROC) curve to display the paired False Positive and True Positive Rates for students in Physics I, obtained by varying each cutoff or threshold between 0 and 1 by increments of 0.01. We label students earning a course grade of “C” or better in their first attempt as successful (S), while students earning below a “C” (including withdrawals, late withdrawals, and incompletes) in their first attempt as unsuccessful (U). In Figure 1, successful students appear blue, while unsuccessful students appear red. Since we are interested in identifying the High-Risk students with the classifier, the “Positive” instance is associated with identifying an unsuccessful student. Consequently, classifying a student into Low or Medium-Risk is labeled as a “Negative” instance. In the context of this binary classification, we define the True Positives (TP), False Positives (FP), True Negatives (TN), and False Negatives (FN) as follows:
Consequently, we present the student counts as a set of 2 × 2 confusion matrices, where a “positive” instance is associated with identifying an unsuccessful student. Each confusion matrix includes the following model evaluation metrics (Swets, 1988; Fawcett, 2006) defined below:
Accuracy (ACC) measures how well the classifier correctly identifies the categories. Accuracy varies from 0 to 1, with 1 indicating exact classification. Since we typically have fewer students in the High-Risk category than in the Low and Medium-Risk categories combined, we also calculated the Matthews Correlation Coefficient (MCC) (Matthews, 1975). The MCC, on a scale of −1 to 1, provides a measure of the overall quality of a binary prediction classifier. Positive values of the MCC indicate better prediction quality.
Once the classification methodology was verified, as outlined in Section 2.2, the First-Year Council applied it to subsequent cohorts to make targeted placement recommendations. In Sections 2.4 and 2.5, we quantify the impact of the intervention on high-risk students from cohorts Fall 2011–2015 compared to the high-risk students from cohorts Fall 2006–2010. Since these cohorts are from different years, we needed to ensure they are indeed comparable. For a fair comparison, we needed the two groups to be similar with respect to their academic performance at the beginning of the first year at the university. We chose to use the SAT scores as a measure of the similarity between the two groups. We analyzed the descriptive statistics for math and verbal SAT scores of the two groups. Furthermore, we used the two-tailed t-test (Neter et al., 1996) on the SAT math and verbal scores of the two groups to compare them.
In this section, we narrow our analysis to just the High-Risk engineering-major students since the Alternative Pathway intervention was designed specifically for these students. We evaluated the long-term impact of the methodology and interventions implemented for engineering students identified as high-risk for Fall 2011–2015 cohorts.
For the analyses of the retention and graduation rates, we define the “control group” and “treatment group” as follows:
The control group is the group of engineering students identified as High-Risk students by the classifier described in Section 2.1, from Fall cohorts 2006 to 2010.
The treatment group is the group of engineering students identified as High-Risk students by the classifier described in Section 2.1 from Fall cohorts 2011 to 2015 who have received the treatment. To ensure that these students are only those who received the “treatment,” we considered only the students enrolled in Physics I in the second semester of their cohort year and registered for the Engineering and Society course in the first semester of their cohort year.
We define first-year STEM retention as the percentage of first-year STEM major students enrolled in STEM majors at the beginning of their second year. We define second-year STEM retention similarly, as the percentage of first-year STEM major students enrolled in STEM majors at the beginning of their third year. We compared the first and second-year retention rates and the 4- and 6-year graduation rates before and after the interventions. All engineering programs at the university are 4-year programs. We also note that the 4-year graduation rate indicates an important “on-time” graduation rate metric, while the 6-year rate accounts for graduation within 150% of a student's program length. We used the two-population proportion test (Neter et al., 1996) to find the statistical significance of the difference between the two groups.
We wanted to quantify the effect of the interventions on success rates in the early STEM foundation courses taken by engineering students. Recall that we defined “success” as achieving a “C” grade or better on the first attempt. We compared the early STEM course performance of the students from the control group to the course performance of the students in the treatment group. We used the two-population proportion test to determine the statistical significance of the difference between the two groups.
For the control group in Physics I, Calculus I, and Chemistry I, we considered High-Risk engineering students in the cohort years 2006–2010 who took the corresponding courses in the first semester of their cohort years. Whereas, for the subsequent courses, Physics II, Calculus II, and Chemistry II, the ‘control group' included High-Risk engineering students in the cohort years 2006–2010, who registered for these courses after passing the first part of the corresponding course. We only considered their Success or Failure in their “first” attempt at these courses for this study. The treatment group in Physics I, Calculus I, and Chemistry I consists of High-Risk engineering students in the cohort years 2011–2015 who registered for the Engineering and Society course in the first semester and Physics I course in the second semester of their cohort year. An additional requirement for students in treatment groups for Calculus I and Chemistry I is that the students in these groups need to have registered for these courses in the first semester of their cohort year. Whereas, for the subsequent courses, Physics II, Calculus II, and Chemistry II, the “treatment group” included High-Risk engineering students in the cohort years 2011–2015 who registered for these courses after passing the first part of the corresponding course.
We used Version 4.0.0 of R programming language for the coding with the following R libraries: readxl, dplyr, tidyr, ggplot2, and ggpubr.
In Figure 1 we depict the sunflower plot for all students from the Fall cohorts from 2006 to 2010. This figure is for the Mathematics Diagnostic survey cut-off of 0.65 and the Physics Diagnostic survey cut-off of 0.5. The binary classification system identified 745 students as high-risk students out of 1982. These 745 students include 585 students from the M−P− category and 160 students from the M−P−+ category as explained in Section 2.1.
We depict the ROC curve for Physics I in Figure 2. Each dot in this figure plots the False Positive Rate (FPR) and True Positive Rate (TPR), corresponding to a pair of potential cutoff values in the Mathematics and Physics diagnostic surveys. This methodology implies that cutoffs may need to be decided for every course and for every cohort group. However, the primary intervention for engineering students involved shifting the timing of the first physics course by one semester. Hence, for practical and logistical reasons, the final cutoffs of 0.65 for the Mathematics and 0.50 for the Physics Diagnostic surveys were based on the ROC curve associated with Physics I, the impact of the expanded high-risk category (M−P−+), and guided by recommendations from the Mathematics and Physics Departments. The red dot in Figure 2 shows the corresponding pair of FPR and TPR for these values and its proximity between the coordinate location (0,1), representing a perfect classifier, and the diagonal line representing a completely random classifier.
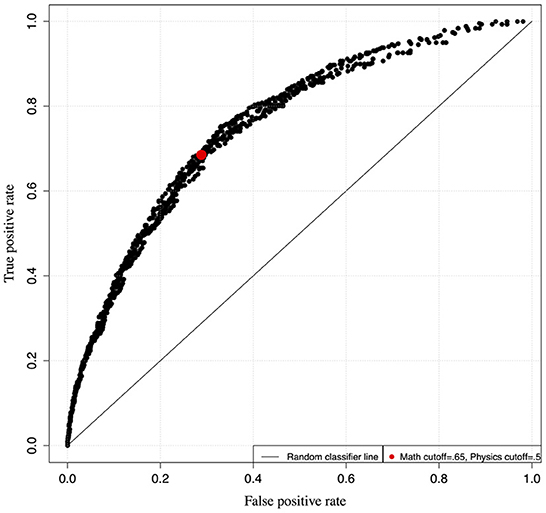
Figure 2. Receiver operating characteristics (ROC) curve for Satisfactory (S)/Unsatisfactory (U) grades in Physics I by predicted risk categories for Fall 2006–2010 cohorts.
Table 1 summarizes the confusion matrices for the courses Physics I, Calculus I, and Chemistry I based on the final cutoff values. The proportion of students receiving a U grade correctly categorized as High-Risk (True Positive Rates) ranges from 0.67 to 0.69 for all three early STEM foundation courses, with False Positive Rates ranging from 0.29 to 0.36. The proportion of students receiving an S grade correctly categorized as Medium or Low-Risk (True Negative Rates) ranges from 0.64 to 0.71, with False Negative Rates ranging from 0.31 to 0.33. The proportion of students categorized as High-Risk who received a U grade ranges from 0.36 to 0.43, while the proportion of students categorized as Medium or Low Risk who received an S grade ranges from 0.84 to 0.89. The proportion of total students correctly categorized (Accuracy) ranges from 0.63 to 0.70. Since fewer students are typically in the high-risk category than in the low-medium risk category, we computed the Matthews correlation coefficient (MCC). We found that the MCC was positive and ranged from +0.28 to +0.33.
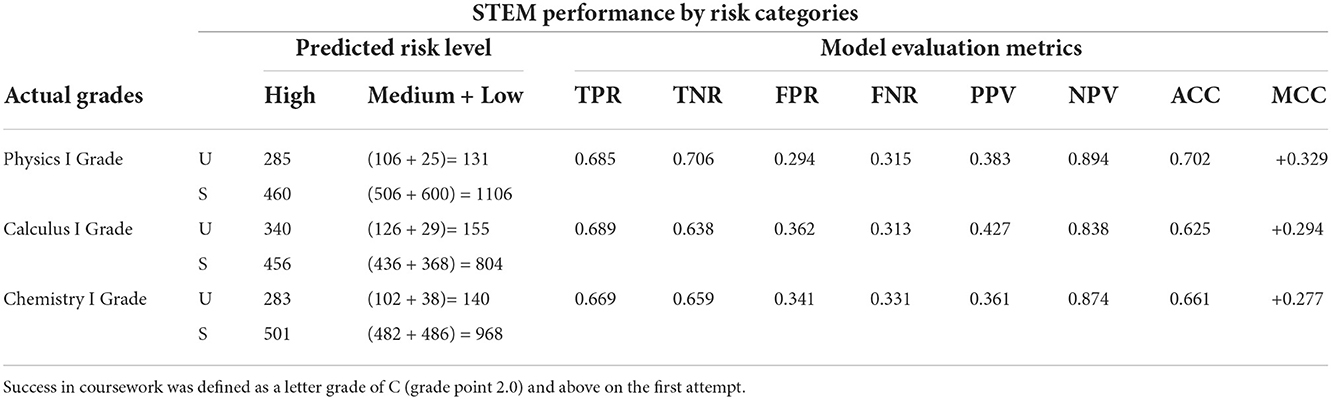
Table 1. Confusion matrices with student-counts demonstrating early STEM foundation course performance measured as Satisfactory (S)/Unsatisfactory (U) grade, by predicted risk categories for Fall 2006–2010 cohorts for the Math Diagnostic cut-off of 0.65 and Physics Diagnostic cut-off of 0.5.
We used SAT scores to verify the comparability of the high-risk students before and after the intervention. The mean SAT math scores of high-risk students from Fall 2006 to 2010 was 559, as opposed to 546 for the high-risk students from Fall 2011 to 2015. The first quartile, median, and third quartiles for SAT math scores were 550, 590, and 630, respectively, for the high-risk students from Fall 2006 to 2010, whereas these statistics were 540, 580, and 620, respectively, for the high-risk students from Fall 2011 to 2015. The t-test showed that the SAT math scores of the two groups were statistically similar (p = 0.126). The mean SAT verbal score of high-risk students from Fall 2006 to 2010 was 506, compared to 503 for the high-risk students from Fall to 2015. The first quartile, median, and third quartiles for SAT verbal scores were 480, 530, and 570, respectively, for the high-risk students from Fall 2006 to 2010, whereas these statistics were 480, 530, and 580, respectively, for the high-risk students from Fall 2011 to 2015. We summarize the descriptive statistics in Figure 3. Furthermore, the t-test revealed that the SAT verbal scores of the two groups were statistically similar (p = 0.706). Since, in both cases, the p >0.05, we could compare the performance of these two groups.
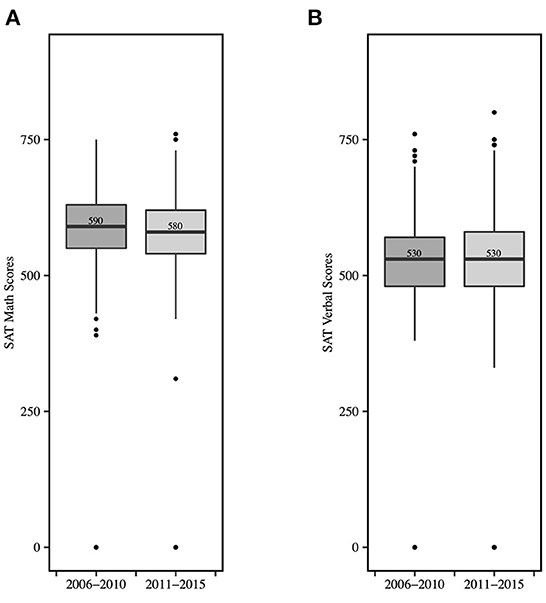
Figure 3. The comparison of the (A) SAT math scores, and (B) SAT verbal scores of the high-risk students from Fall 2006–2010 and the high-risk students from Fall 2010–2015. The t-tests yielded p-value > 0.05 in both cases, indicating no statistically significant difference between the two groups.
Figure 4 shows the first and second-year retention and the 4- and 6-year graduation rates for engineering students identified as High-Risk for each Fall entry cohort from 2006 to 2015. We can see that the High-Risk students' overall retention and graduation rates are better during the intervention years than before the interventions. The plots also show the p-values for the two-population proportion tests comparing the control and treatment groups. We see that the treatment group performed significantly better than the control group in the first and second-year retention rates with p < 0.001. The 4- and 6-year graduation rates in the treatment group were also significantly better than the control group with p < 0.05 and p < 0.001, respectively. Table 2 shows the details of these tests, including the overall percentage of students in each group.

Figure 4. The first row shows the High-Risk engineering students' first and second-year retention rates in the STEM major for the cohort years Fall 2006–2015. The second row depicts the 4- and 6-year graduation rates. The percentage values for each year are indicated at the top of each bar in the bar charts. The results from the pre-intervention years (Fall 2006–2010) are shown in blue, whereas those from post-intervention years (Fall 2011–2015) are shown in green. The significance levels (p-values) indicating the differences in the pre-intervention and post-intervention years are shown in the individual graphs. ***p < 0.001, **p < 0.01, and *p < 0.05.
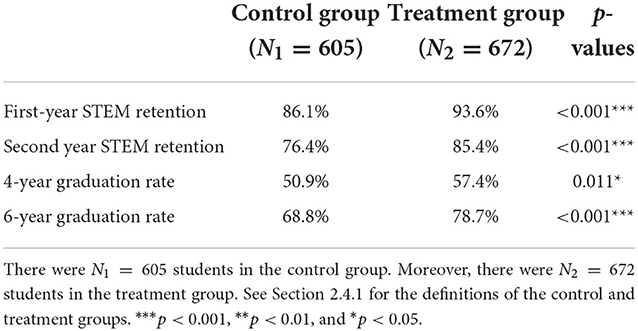
Table 2. Success rates for the control group and the treatment group along with the p-values for the two proportion tests.
Figure 5 depicts the success rates in early STEM courses for engineering students identified as High-Risk for each Fall cohort from 2006 to 2015. From the bar chart for Physics I, we can readily recognize that the treatment group performed better than the control group. In fact, the minimum success rate in the post-intervention years (71.8%) is significantly greater than the maximum success rate in the pre-intervention years (66.3%). However, we can not reach the same conclusion for other courses without further investigation. Thus, we performed the two-population proportion test to compare the two groups' performances for each early STEM foundation course. We display the p-values for the two-population proportion tests to compare the control and treatment groups in Figure 5. Table 3 shows the details of these tests, including the overall percentages and number of students in each group. Note that we used the number of students attempting the courses for the first time in these tests. The treatment group performed significantly better (p < 0.001) in Physics I, Calculus I, and Chemistry I than the control group. For Calculus II, we found a marginal improvement (p < 0.05) in the success rate of the treatment group over the control group. However, we found no statistically significant difference between the two groups' performance in Physics II and Chemistry II.
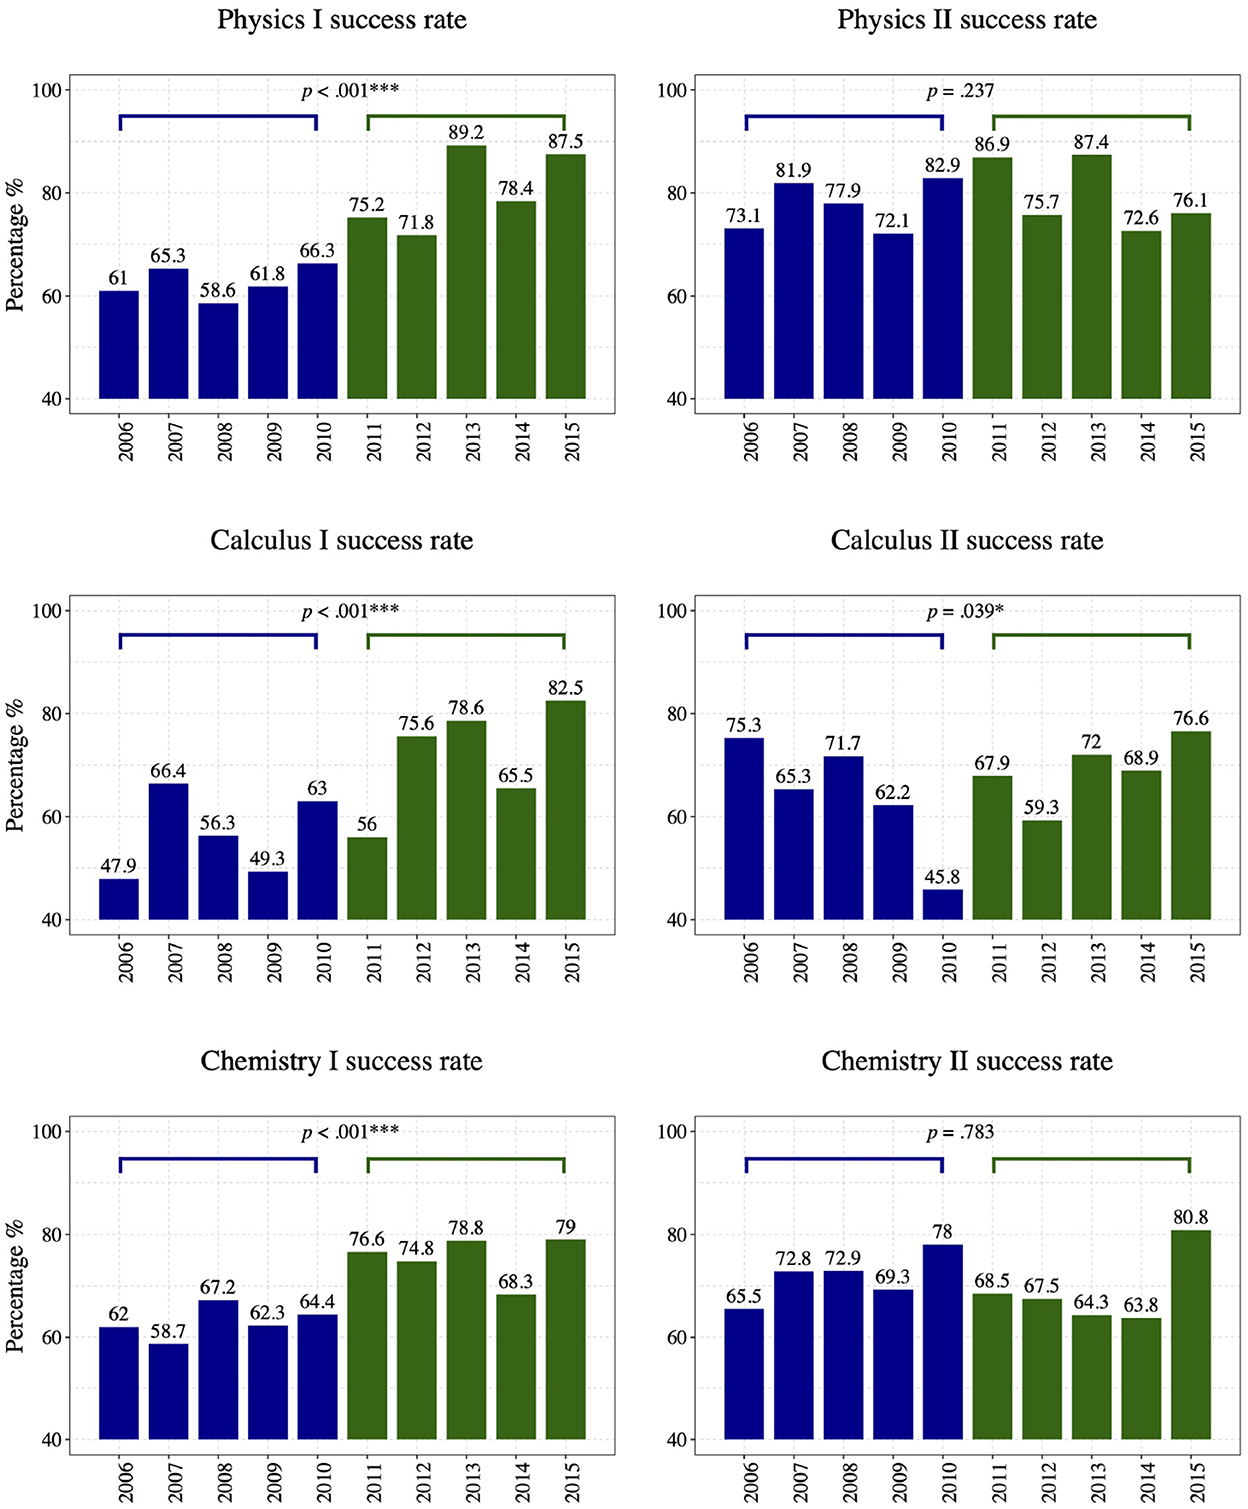
Figure 5. The success rates of High-Risk engineering students in the early STEM courses from the cohort years Fall 2006–2015. The success rates in the pre-intervention years (Fall 2006–2010) are shown in blue, whereas the post-intervention years (Fall 2011–2015) are in green. The significance levels and the p-values indicating the differences in the pre-intervention and intervention years are shown in the individual graphs. ***p < 0.001, **p < 0.01, and *p < 0.05.
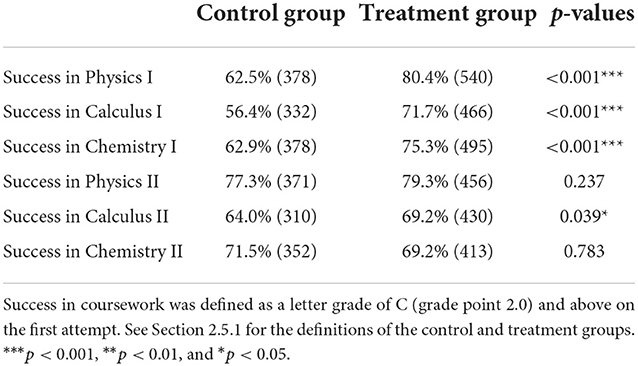
Table 3. Success rates for the control group and the treatment group (as a percentage and raw numbers) along with the p-values for the two proportion tests.
We used the historical data from the Fall cohorts from 2006 to 2010 to develop and refine a model classifier to identify students at high risk of underperforming in the early STEM courses. While the classification method has limitations and room for improvement (see Section 4.1), as a low-dimensional model based on only two relatively independent measures easily captured at the pre-entry point of enrollment, the results are promising. The relatively high accuracy for correct categorization seems in contrast to the somewhat low Matthews Correlation Coefficient for overall model quality. However, we find much value in using this approach for identifying the majority of genuinely high-risk students. The high Negative Predictive Values suggest that in using this methodology as a predictive tool, we should have high confidence that most students we categorize as Medium/Low-Risk will likely do well in the early foundation STEM courses. Furthermore, while the Positive Predictive Values are much lower due to the misclassification of a fair number of successful students as High-Risk, the model correctly classifies more than 2/3 of the unsuccessful students (in Physics I, Calculus I, and Chemistry I) as High-Risk. From an intervention design perspective, this aligns with a conservative approach in which we may offer more students additional assistance or recommendations to enhance their success than may be necessary.
After verification, we used the classifier to identify High-Risk engineering students in the Fall cohorts of 2011 onward. These students were then prescribed an alternative pathway, decoupling the concurrent timing of the Calculus I and Physics I courses. Additionally, all students were enrolled in a Co-Calculus support course, and some were provided with an optional SV training course. We found that these combined interventions had a statistically significant (p < 0.01) positive impact on the 4- and 6-year graduation rates and the first and second-year STEM retention rates of the High-Risk students. The interventions also improved the performance of the High-Risk students (p < 0.001) in the courses Physics I, Calculus I, and Chemistry I. The improvement in the Physics I success rate could be attributed to these students completing the Calculus I course before attempting Physics I. This finding contrasts with the pre-intervention years when all students took Calculus I and Physics I concurrently. We note that improvements in the success rate in Calculus II were marginally significant and not significant for Physics II and Chemistry II. However, this observation may reflect the impact of increased retention of more High-Risk students in the post-intervention years.
The approach presented is understandably limited in that it does not directly account for non-cognitive factors and demographic variables linked to overall student success. However, it uses relatively easy-to-capture diagnostic data at the pre-entry point of student enrollment. The resulting binary classifier is admittedly “static” in that the cut-offs for the Mathematics/Physics Diagnostic surveys are predetermined by the data from 2006 to 2010. In the short term, i.e., for the period 2011 to 2015 considered in the paper, this model worked reasonably accurately and as expected. However, in the future, we will need to reexamine the long-term validity of the model and make adjustments accordingly.
Moreover, students whose scores are near the intersection of the Mathematics and Physics Diagnostic cut-offs shown in the sunflower plot are similar in preparedness but could essentially belong in any of the four categories. A revised set of cut-offs with diagonal (negative slope) or curved diagonal bands that broaden the Medium-Risk categories into a single zone while simultaneously separating the High and Low-Risk zones might improve the predictive capability and enhance targeted recommendations for further improving retention and graduation rates. Additionally, a future study incorporating modeling techniques will examine the extent to which each intervention strategy contributed to student success.
In this paper, we designed a binary classifier to identify students at higher risk of underperforming in early foundation STEM courses. We used student performance data from 2006 to 2010 to design the classification model and validated it using a classifier accuracy measure and Matthews Correlation Coefficient. After the validation, we used this model to identify the most underprepared engineering students from subsequent incoming cohorts. Once identified, these students were prescribed interventions (alternative pathways, a Co-Calculus support course, and an optional SV training course) to help them succeed in their engineering programs. We observed that these collective interventions significantly and positively impacted the STEM retention rates of these students in the first 2 years of their academic careers and improved their 4- and 6-year graduation rates. Moreover, the performance of the High-Risk engineering students also improved in the early foundation STEM courses, translating to increased retention.
These findings provide an effective methodology for identifying and supporting engineering students likely to struggle in their undergraduate education. Institutional profiles and student preparedness levels can vary significantly from one university to another. Hence the methodology and suggested interventions may not translate directly with the same level of effectiveness for other institutions. However, the overall improvement in the graduation, retention, and success rates achieved in the early STEM courses suggests that customized analysis and targeted interventions can elevate student success. The strategies presented in this article may provide effective guidance for institutions seeking to improve the overall performance of undergraduate students who otherwise might struggle in their engineering curriculum.
The raw data supporting the conclusions of this article will be made available by the authors, without undue reservation.
The studies involving human participants were reviewed and approved by Institutional Review Board, Clarkson University. Written informed consent from the participants' legal guardian/next of kin was not required to participate in this study in accordance with the national legislation and the institutional requirements.
DW: writing, review, and supervision. EA: coding, data curation, investigation, analysis, and visualization. PA: writing, editing, data curation, and statistical analysis. SM: validation and review. MR: data curation and review. RJ: coding and data organization. JM: review. All authors contributed to the article and approved the submitted version.
We are grateful for the many years of support from Dr. Anthony G. Collins, the former President of Clarkson University. We acknowledge the significant contributions of Dr. Peter Turner, former Dean of the School of Arts & Sciences, Dr. Goodarz Ahmadi, interim Provost and former Dean of the Coulter School of Engineering, and other faculty who served on the First-Year Council at Clarkson University.
The authors declare that the research was conducted in the absence of any commercial or financial relationships that could be construed as a potential conflict of interest.
All claims expressed in this article are solely those of the authors and do not necessarily represent those of their affiliated organizations, or those of the publisher, the editors and the reviewers. Any product that may be evaluated in this article, or claim that may be made by its manufacturer, is not guaranteed or endorsed by the publisher.
Al-Sheeb, B. A., Hamouda, A., and Abdella, G. M. (2019). Modeling of student academic achievement in engineering education using cognitive and non-cognitive factors. J. Appl. Res. Higher Educ. 11, 178–198. doi: 10.1108/JARHE-10-2017-0120
Anderson, E., and Kim, D. (2006). Increasing the Success of Minority Students in Science and Technology. Washington, DC: American Council on Education.
Astin, A. W., and Astin, H. S. (1992). Undergraduate Science Education: The Impact of Different College Environments on the Educational Pipeline in the Sciences. Final Report. Higher Education Research Institute, University of California, Los Angeles, CA (ERIC Document Reproduction Service No. ED 362 404).
Burtner, J. (2005). The use of discriminant analysis to investigate the influence of non-cognitive factors on engineering school persistence. J. Eng. Educ. 94, 335–338. doi: 10.1002/j.2168-9830.2005.tb00858.x
Chapman, E. A., Wultsch, E. M., DeWaters, J., Moosbrugger, J. C., Turner, P. R., Ramsdell, M. W., et al. (2015). “Innovating engineering curriculum for first-year retention,” in 2015 ASEE Annual Conference and Exposition (Seattle, WA), 26–967.
Chen, X. (2013). STEM Attrition: College Students' Paths into and out of STEM Fields. Statistical Analysis Report. NCES 2014-001. National Center for Education Statistics.
Fawcett, T. (2006). An introduction to roc analysis. Pattern Recogn. Lett. 27, 861–874. doi: 10.1016/j.patrec.2005.10.010
Griffith, A. L. (2010). Persistence of women and minorities in stem field majors: is it the school that matters? Econ. Educ. Rev. 29, 911–922. doi: 10.1016/j.econedurev.2010.06.010
Guay, R. B., and McDaniel, E. D. (1977). The relationship between mathematics achievement and spatial abilities among elementary school children. J. Res. Math. Educ. 8, 211–215. doi: 10.5951/jresematheduc.8.3.0211
Hestenes, D., Wells, M., and Swackhamer, G. (1992). Force concept inventory. Phys. Teach. 30, 141–158. doi: 10.1119/1.2343497
Hill, C., Corbett, C., and St Rose, A. (2010). Why so Few? Women in Science, Technology, Engineering, and Mathematics. Washington, DC: AAUW.
Jaspersohn, R. P. (2017). Addressing Student Success and Retention in STEM Majors Through Strategic Curriculum Pathways and Early Research Experiences. Potsdam, NY: Clarkson University.
Matthews, B. W. (1975). Comparison of the predicted and observed secondary structure of t4 phage lysozyme. Biochim. Biophys. Acta 405, 442–451. doi: 10.1016/0005-2795(75)90109-9
Moosbrugger, J. C., DeWaters, J., Richards, M. C., and Chapman, E. A. (2012). “A course on engineering and society for first-year engineering students and non-majors,” in 2012 ASEE Annual Conference and Exposition, (San Antonio, TX). 25–34.
National Academy of Sciences (2010). Rising Above the Gathering Storm, Revisited: Rapidly Approaching Category 5. Washington, DC: The National Academies Press.
National Research Council (2013). Monitoring Progress Toward Successful K-12 STEM Education: A Nation Advancing? Washington, DC: National Academies Press.
National Science Board (2007). A National Action Plan for Addressing the Critical Needs of the US Science, Technology, Engineering, and Mathematics Education System. Alexandria, VA: National Science Foundation.
National Science Foundation (2010a). Science and Engineering Indicators 2010. NSB 10-01. Alexandria, VA: National Science Foundation.
National Science Foundation (2010b). Preparing the Next Generation of STEM Innovators: IDENTIFYING and Developing our Nation's Human Capital. Arlington, VA: National Science Foundation.
Neter, J., Kutner, M. H., Nachtsheim, C. J., and Wasserman, W. (1996). Applied Linear Statistical Models, 4th Edn. Chicago: Irwin.
Olson, S., and Riordan, D. G. (2012). Engage to Excel: Producing One Million Additional College Graduates With Degrees in Science, Technology, Engineering, and Mathematics. Report to the President. Washington, DC: Executive Office of the President.
Provasnik, S., Kastberg, D., Ferraro, D., Lemanski, N., Roey, S., and Jenkins, F. (2012). Highlights from TIMSS 2011: Mathematics and Science Achievement of US Fourth-and Eighth-Grade Students in an International Context. NCES 2013–009.
Schalk, P. D., Wick, D. P., Turner, P. R., and Ramsdell, M. W. (2009). “Impact: integrated mathematics and physics assessment for college transition,” in 2009 39th IEEE Frontiers in Education Conference (San Antonio, TX: IEEE), 1–6.
Schalk, P. D., Wick, D. P., Turner, P. R., and Ramsdell, M. W. (2011). “Predictive assessment of student performance for early strategic guidance,” in 2011 Frontiers in Education Conference (FIE), (Rapid City, SD), S2H-1-S2H-5.
Shaw, E. J., and Barbuti, S. M. (2010). Patterns of persistence in intended college major with a focus on stem majors. NACADA J. 30, 19–34. doi: 10.12930/0271-9517-30.2.19
Swets, J. A. (1988). Measuring the accuracy of diagnostic systems. Science 240, 1285–1293. doi: 10.1126/science.3287615
Turner, P. R. (2008). A predictor-corrector process with refinement for first-year calculus transition support. Primus 18, 370–393. doi: 10.1080/10511970601131639
Whalen, D. F., and Shelley, M. C. (2010). Academic success for stem and non-stem majors. J. STEM Educ. 11, 45–60. Available online at: https://www.jstem.org/jstem/index.php/JSTEM/article/download/1470/1292
Keywords: STEM, engineering curriculum, first year, persistence, retention, spatial visualization
Citation: Wick DP, Atindama E, Athavale P, Mondal S, Ramsdell MW, Jaspersohn RP and Moosbrugger JC (2022) Measuring the impact of student success retention initiatives for engineering students at a private research university. Front. Educ. 7:1087064. doi: 10.3389/feduc.2022.1087064
Received: 01 November 2022; Accepted: 25 November 2022;
Published: 09 December 2022.
Edited by:
Hon-Ming Lam, The Chinese University of Hong Kong, ChinaReviewed by:
Lau Victor, The Chinese University of Hong Kong, ChinaCopyright © 2022 Wick, Atindama, Athavale, Mondal, Ramsdell, Jaspersohn and Moosbrugger. This is an open-access article distributed under the terms of the Creative Commons Attribution License (CC BY). The use, distribution or reproduction in other forums is permitted, provided the original author(s) and the copyright owner(s) are credited and that the original publication in this journal is cited, in accordance with accepted academic practice. No use, distribution or reproduction is permitted which does not comply with these terms.
*Correspondence: David P. Wick, ZHB3bWNzQHJpdC5lZHU=; Emmanuel Atindama, YXRpbmRhZWFAY2xhcmtzb24uZWR1; Prashant Athavale, cHJhc2hhbnRAY2xhcmtzb24uZWR1
†These authors have contributed equally to this work
Disclaimer: All claims expressed in this article are solely those of the authors and do not necessarily represent those of their affiliated organizations, or those of the publisher, the editors and the reviewers. Any product that may be evaluated in this article or claim that may be made by its manufacturer is not guaranteed or endorsed by the publisher.
Research integrity at Frontiers
Learn more about the work of our research integrity team to safeguard the quality of each article we publish.