 Beibei Lu
 Dezhi Chen
 Congcong Yan
- Hangzhou Preschool Teachers College, Zhejiang Normal University, Hangzhou, Zhejiang, China
The applicability of the Educator Cognitive Sensitivity (ECS) scale is an important prerequisite for promoting teachers’cognitive sensitivity concepts and research. For this reason, we have expanded the study of the measurement properties of the ECS scale in the Chinese context of early childhood teachers and promote the development and research of cognitive sensitivity of teachers in the context of Chinese culture. The scale was used to evaluate 100 Early childhood teachers from a province in eastern China. The results showed that the internal consistency of the scale was good. The structural validity analysis results of the scale were similar to the existing research results; taking some items in the curriculum promotion of “The Path Towards Excellence—Chinese Kindergarten Education Quality Rating Standards” and children’s development scale as the target, the empirical validity analysis results showed that the empirical validity of the scale was not very ideal, which needs further practical exploration in the future.
Introduction
The Educator Cognitive Sensitivity (ECS; Pauker et al., 2018) refers to the ability of educators to create an environment of cognitive stimulation when interacting with a less experienced partner while adapting to the children’s inner state, including cognition and emotion. It includes three aspects: back-and-forth interaction, understanding children’s thoughts and feelings, and speaking to children using the language they can understand (Landry et al., 1996, 2000; Fox and Hane 2008; Laranjo et al., 2010; Prime et al., 2014, 2016; Pauker et al., 2018). Previous studies had shown that the cognitive sensitivity of kindergarten educators is of great significance to the development of children’s cognition, social interaction, sense of achievement and self-efficacy. For example, some studies believed that teachers with high cognitive sensitivity would provide a more positive atmosphere and high-quality teaching, and children would have more opportunities and support for language and mathematics learning, which was more conducive to their academic growth (Glaser 2000; Hoff 2006; Burchinal et al., 2008). Some studies had shown that the higher the teachers’ cognitive sensitivity, the better they were at understanding children’s thoughts and feelings, and the more correctly they can assess children’s emotional status and gave positive emotional support;this repeated correct emotional measurement can also help children become aware of their own and others’ psychological states, and even manage their own behavior, and promote children’s social interactions (Dunn 2002; Meins et al., 2002; Carpendale and Lewis 2004; Lundy 2013).Cognitively sensitive teachers could provide timely cognitive and emotional support and assistance to children, and establish positive mutual partnerships with children, promoting children’s cognitive and social communication skills while also effectively promoting the development of a sense of achievement and self-efficacy (Bandura 1997; Bernier et al., 2010).
In practice, to explore the cognitive sensitivity of early childhood educators, measurement is an important method and path. At present, the method of observation is mainly adopted in the evaluation of the cognitive sensitivity of educators. The ECS scale (Pauker et al., 2018) is one of the most widely used assessment tools. A previous study (Pauker et al., 2018) had been conducted by assessing 350 infant and toddler educators from early childhood care and educational institutions, and conducting reliability and validity analysis based on the assessment results, showing that the scale had good internal consistency (Cronbach’s ɑ coefficient value of 0.96) and Inter-rater reliability (0.85); at the same time, Pauker et al., (2018) also used Exploratory Factor Analysis (EFA) to explore the structural validity, and the results of the study concluded that the scale has a single-dimensional structure. In terms of concurrent validity, this scale was related to multiple dimensions of the Classroom Assessment Scoring System (CLASS, La Paro et al., 2012) except for negative atmosphere, correlation coefficients ranging from 0.41 to 0.55, and all are significant. And the correlation coefficients with the Infant/Toddler Environment Rating Scale-Revised (ITERS-R, Harms et al., 2003), were 0.21–0.40 and significantly moderately correlated (Pauker et al., 2018).
The existing studies were all based on the Canadian cultural background of Pauker et al., (2018). In China, awareness and research on teachers’ cognitive sensitivities have not yet begun, and the results of related research have hardly been reported. The cross-cultural applicability of the ECS scale is an important prerequisite for promoting teachers’ cognitive sensitivity concepts and research. Therefore, we expand the study of the measurement properties of the ECS scale in the Chinese context of kindergarten educators and promote the development and research of teachers’ cognitive sensitivity in the context of Chinese culture.
Materials and methods
Participants
First of all, 100 early childhood teachers from 50 classes were randomly sampled from two cities in an eastern province of China by stratified sampling (M = 27.5,SD = 5.2). The 50 classes included 12 pre-school classes (age 3–4), 19 pre-kindergarten (age 4–5) and 19 kindergarten classes (age 5–6) respectively. Secondly, six children (3 males and 3 females) were randomly selected from each sample class to participate in the development evaluation of children’s language and mathematics. As a result, a total of 300 young children participated in the child development assessment. After excluding missing and invalid samples, among the 300 young children, the number of valid samples participating in the language assessment was 262 (M = 4.6, SD = 0.9), and that in mathematics evaluation was 245 (M = 4.7, SD = 0.8).
Measurement instruments
The educator cognitive sensitivity scale
Co-developed by Pauker et al., (2018), the ECS scale aimed to evaluate the cognitive sensitivity of educators in early care and educational institutions who were in close contact with children, but also as a tool to promote educators’ professional development. The English edition scale and corresponding coding manual were first translated into Chinese by two early-childhood education professionals, and a first Chinese draft was formed after several rounds of discussion, revision and adjustment which were all carried out in accordance with the Chinese grammatical structure, wording and comprehensibility. After unified and rigorous scale evaluation training, 20 graduate students from early-childhood education majors applied the scale and coding manual to observe and evaluate 40 kindergarten educators. After the pilot use of the scale, the interview method was used to collect the suggestions of 20 evaluators on the revision of the scale and coding, and then the Chinese edition of the scale was further revised and refined.
The scale contains a total of 21 items, each of which employs the 5-point Likert scale, where 1 = not at all true,… 5 = very true, which aligns with the original English scale. An example of the item content, scoring method and corresponding operation instructions are shown in Table 1.
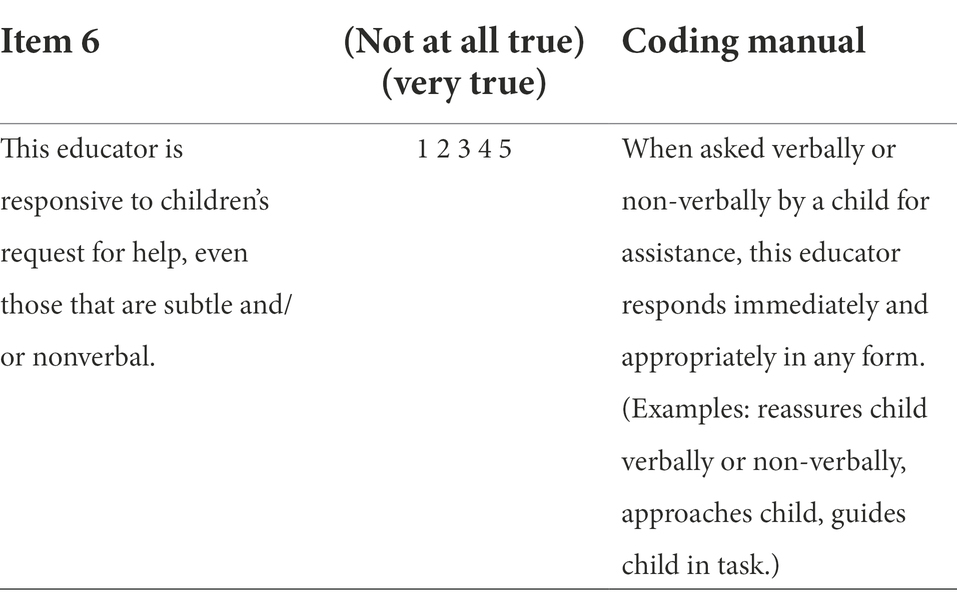
Table 1. Examples of project content, scoring methods and operation instructions.
The path towards excellence—Chinese kindergarten education quality rating standards
This study used subscale called “Three Field Curriculum Promotion (TFCP)” in the Path Towards Excellence—Chinese Kindergarten Education Quality Rating Standards (PTE-CKEQRS; Chen et al., 2021) with good reliability as the validity criteria to discuss the empirical validity of the ECS scale. Former studies have shown that the process quality of the classroom in which children are located, has a significant effect on children’s development (Campbell et al., 2001; Peisner-Feinberg et al., 2001; Nores et al., 2005; Burchinal et al., 2008, 2015; Burchinal et al., 2011; Li et al., 2016). The process quality mainly includes educator-child interaction and curriculum (activities), etc., and emphasizes the factors related to educators in activities (Mashburn et al., 2008; Vandell et al., 2010; Li and Hu 2012). The TFCP subscale in the PTE-CKEQRS was used to measure the process quality of the class, based on the five fields of child’s health, language, society, science and the arts. In this study, it was used as a benchmark to measure the effectiveness of the ECS scale. After calculation, the internal consistency coefficient of the five fields was 0.748.
The child development assessment tool
Child development assessment was mainly based on two aspects: language, mathematics. Children’s language adopts the Peabody Picture Vocabulary Test (Revised edition—A type, PPVT; Dunn & Dunn and Dunn 1981) with widely used and good measurement properties. The item uses 0–1 scoring method, and the correct answer was marked “1” and the wrong answer was “0.” The internal consistency coefficient of PPVT in this paper was 0.980. Children’s mathematical developments were mainly measured based on the Research-based Early Maths Assessment-Short Form (REMA-SF; Weiland et al., 2012), some studies had confirmed that the REMA-SF has good reliability and validity (Clements et al., 2008; Weiland et al., 2012; Sarama and Clements 2017). A score of “1” for correct answer and “0” for error or no answer in this scale, the internal consistency coefficient of this scale was 0.872.
Procedure
All raters were uniformly and rigorously trained in assessment, each sample class is assigned five raters, of which two were responsible for the ECS scale assessment, the other two were responsible for the evaluation of the TFCP subscale of PTE-CKEQRS, and the last one was responsible for the child development assessment.
For the evaluation of the ECS scale and the TFCP subscale of PTE-CKEQRS, non-participatory observation under natural scenarios was used, and the time was generally from 8 a.m. to 4 p.m. The two raters score individually and then discuss together, with the discussion score as the final result, and the scoring consistency was calculated to be 0.765 and 0.822, respectively.
For the child development assessment, each child was tested with PPVT and REMA-SF. The assessment guidelines and procedures were strictly in accordance with the instructions of each scale. All measurement was accomplished in approximately 20 to 35 min for one child. The child had a break when he or she was tired and inattentive during the assessment, and then the testing was continued under the child’s consent. In addition, the written consent of the children’s parents or guardians was obtained before the child development assessment, and the children’s research ethics were strictly observed. Participants had the option to quit the testing at any moment.
Data analysis
Data analysis was processed and analyzed by SPSS 26.0 and HLM 8.0 software.
Results
Descriptive statistics and internal consistency
The results of descriptive statistics and internal consistency were shown in Table 2. The minimum of the item score was 1, the maximum was 5 and the mean of the item score was between 3.290 and 4.200. The value of SD and SE were all below 1. The item-total correlation was all significant (p < 0.05) and the minimum item-total correlation was item 11 (r = 0.209) The internal consistency used the Cronbach’s coefficient, the results of the current study showed that the internal consistency of the scale was 0.884.
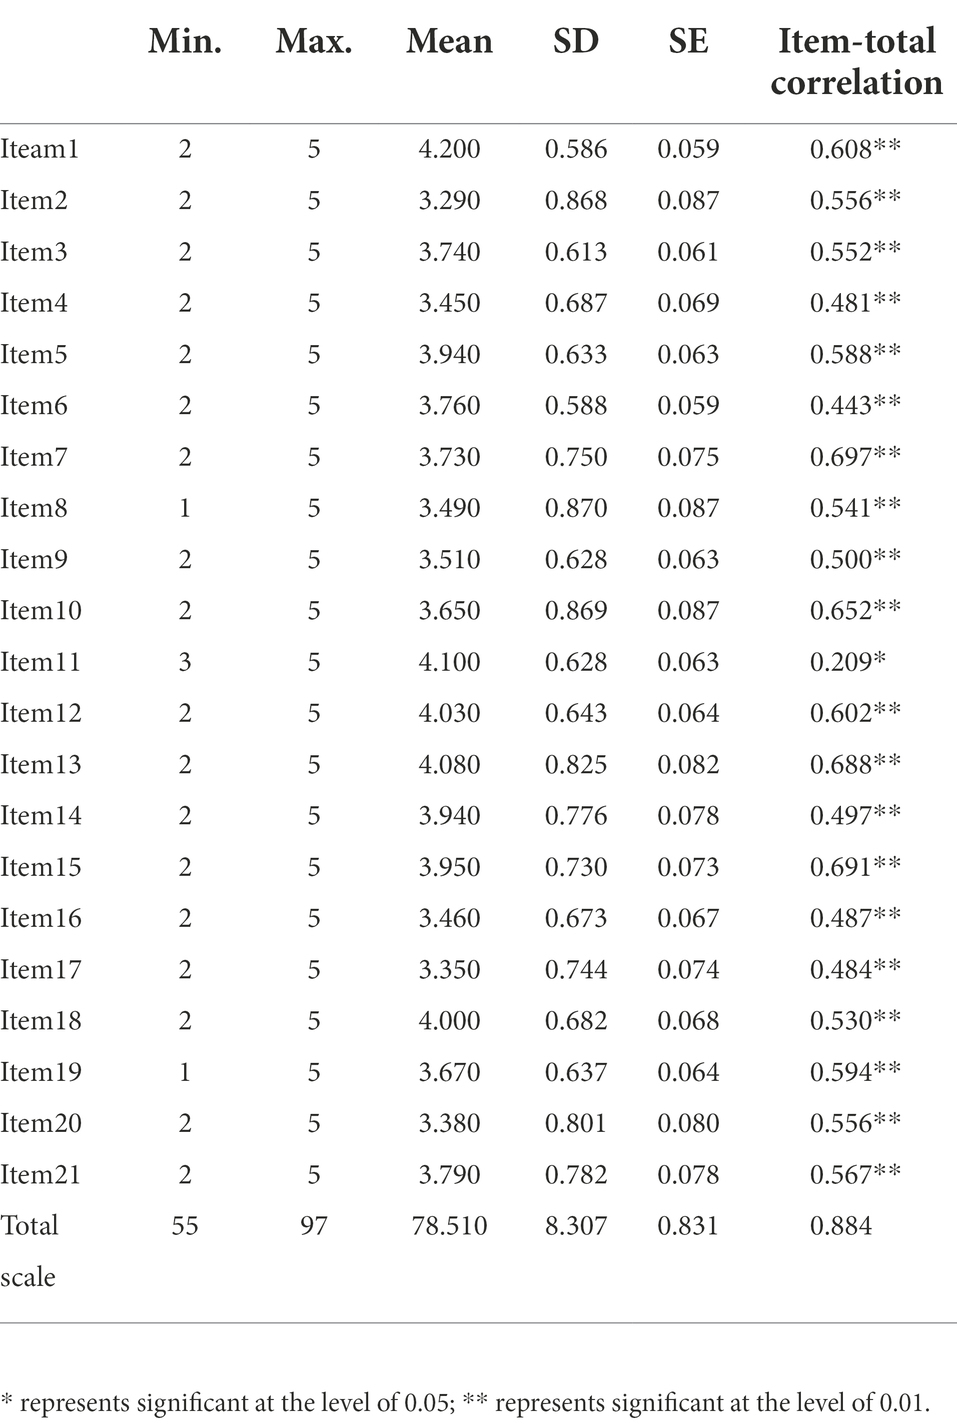
Table 2. Basic assessment conditions, internal consistency and Item-total correlation of the ECS scale.
Structure validity
First, the results of the applicable condition analysis of EFA showed that it was feasible to adopt this method (KMO = 0.769, Barlett’s = 765.351, df = 210, p < 0.01). Secondly, combined with the parallel analysis method (see Figure 1), the result was extracted from a common factor, and its variance contribution rate was 28.101%. The results of the optimal oblique rotation method show that all but the 6th and 11th items had the factor loadings coefficient of 0.4 or above (see Table 3). This result further verified the one-factor structure of ECS scale, but the variance contribution and the factor loading coefficient of individual items were both lower than the Pauker et al.’s (2018) research results.
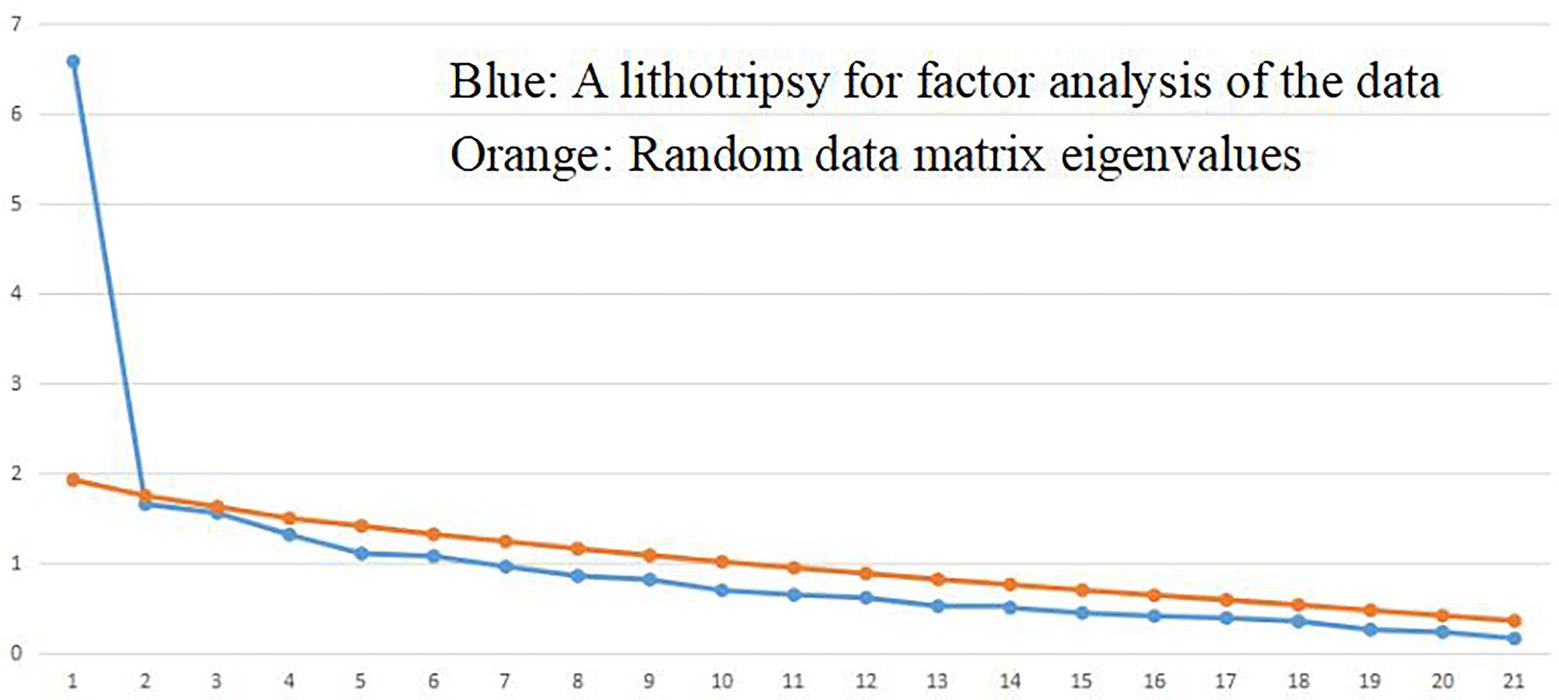
Figure 1. Exploratory factor analysis versus parallel analysis results.
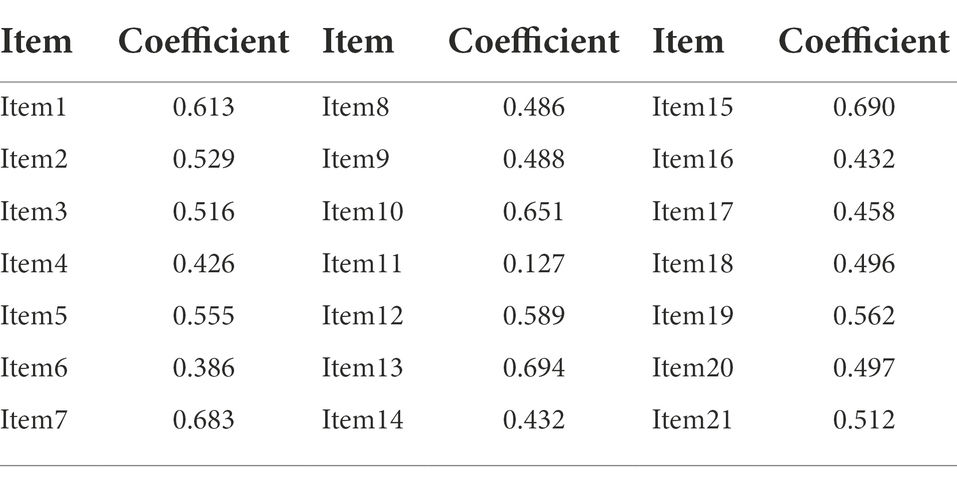
Table 3. The common factor loading coefficient.
Empirical validity
Take the evaluation results of TFCP as the effectiveness criterion
The basic situation of the assessment results of the five items in the TFCP section of PTE-CKEQRS and the correlation analysis with the cognitive sensitivity of early childhood teachers are shown in Table 4. At the same time, the sum of these five items was used as an effectiveness criterion to further explore the empirical validity of the ECS scale. The results showed that there was no significant correlation between the evaluation results of teachers’ cognitive sensitivity and the five items of class process quality, or with the sum of these five items. Among them, there was no significant correlation with the two items of society and science.
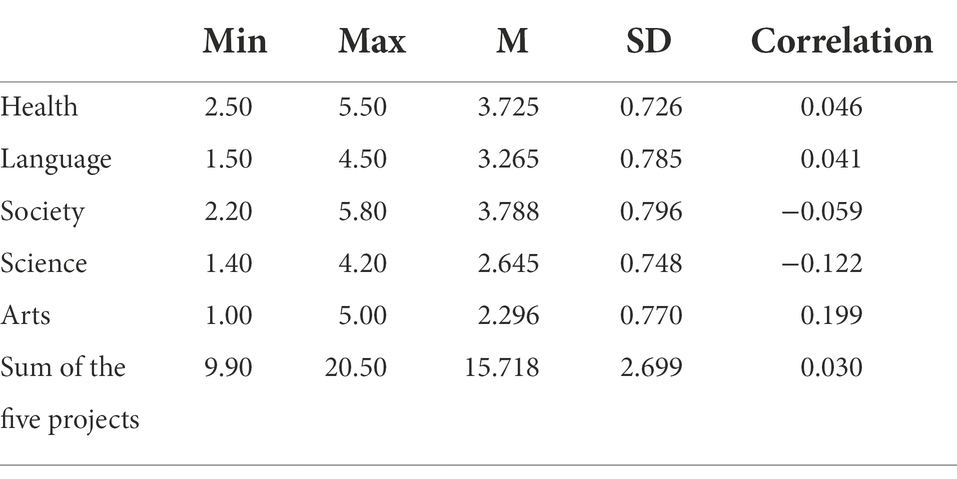
Table 4. The basic situation of the assessment of TFCP and the correlation with ECS.
Take the results of the child development as the effectiveness criterion
Analytical methods
A basic descriptive statistical overview of child development measurement was first provided in the current study. Secondly, Multilevel Linear Model (MLM) was used to analyze and verified whether the cognitive sensitivity of teachers promoted children’s development. Specifically, a two-level linear model was constructed: level 1 was the child individual, and the predictor variables were the gender and age; level 2 was the class level, and the predictor variables were mainly the cognitive sensitivity of the teachers. Outcome variable was the result of child development (PPVT and REMA-SF, respectively). The specific modeling process was as follows.
The Null Model: Acted as a baseline model and did not contain any predictors. Based on the Intra-class Correlation Coefficient (ICC), i.e., the ratio of the difference between the groups to the total variation, it was judged whether it could be analyzed by MLM.
Model I: On the basis of the null model, individual predictors, e.g., demographic variables such as gender and age, were included to discuss the impact of individual-level variables on child development. The expression was as the following E (2):
Model II: Based on Model I, class-level predictor, teachers’ cognitive sensitivity, was incorporated to discuss the impact of class-level predictor on child development. The expression was as the following E (3):
Model III: Based on Model II, the cross-layer interaction of two level predictors was discussed. The analysis results of Model I (see Table 5) showed that gender did not play a significant predictive role in child development, so Model III only discussed the cross-layer interaction between cognitive sensitivity of teachers and age. The expression was as the following E (4):
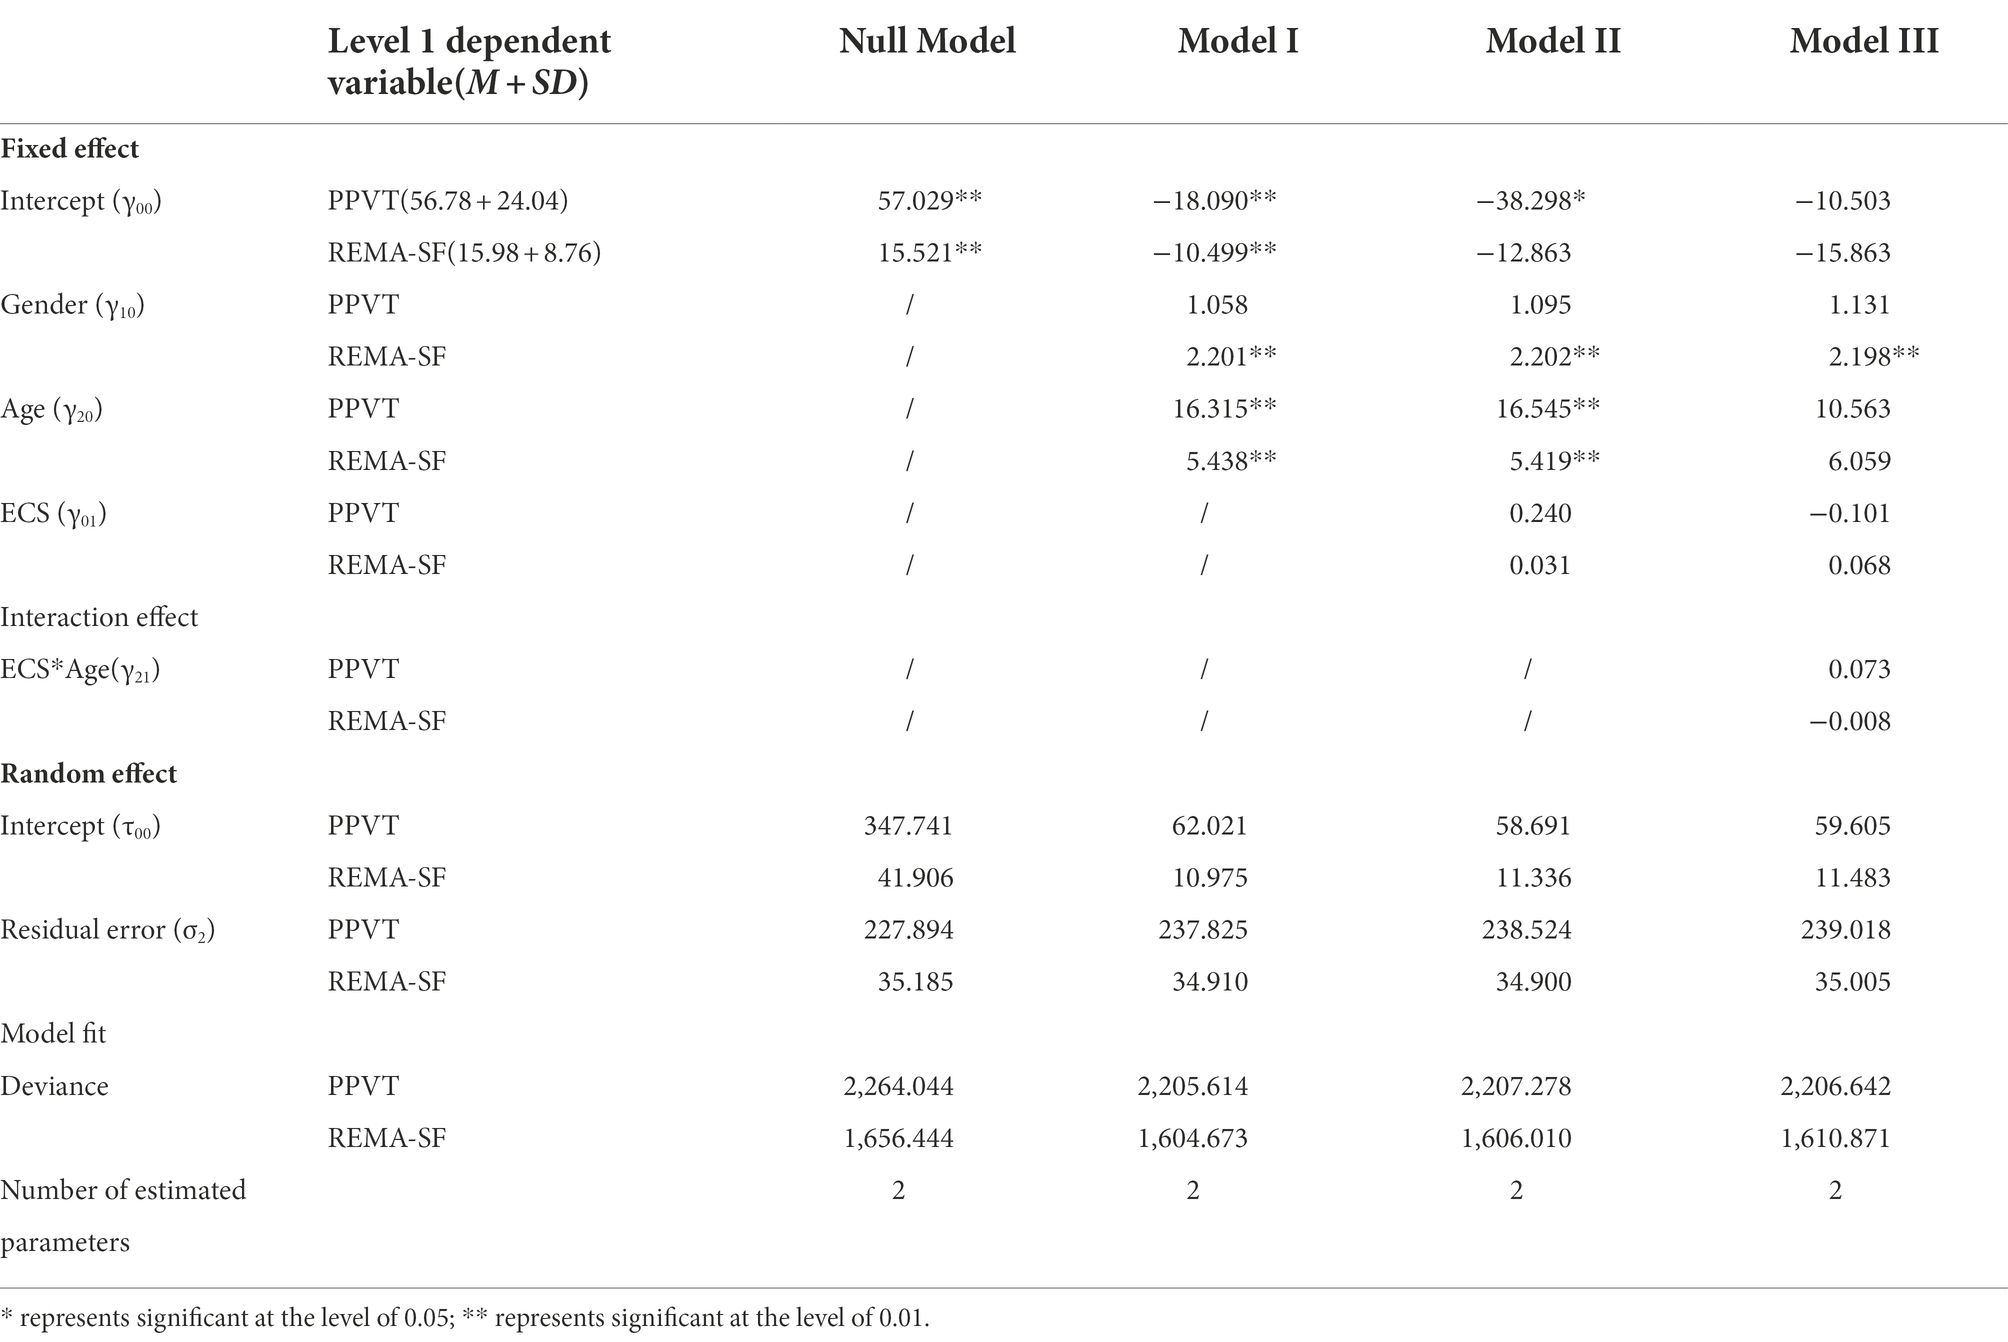
Table 5. Analysis results of two-level linear model.
Analytical results
(1) Results of the Null Model
According to the null model results (see Table 5), the ICC values of PPVT and REMA-SF were obtained as 0.604 and 0.545, respectively. Depending on the value of ICC was greater than 0.138, it was necessary to use MLM to analysis the data (Cohen et al., 1990).
(2) Results of Model I
The analytical results of Model I were shown in Table 5 (Model I column). It can be seen from the table that gender had a significant predictive effect on children’s REMA-SF, but not on PPVT; Age had a significant predictive effect on PPVT and REMA-SF development in children. According to the S&B (Snnijders & Bosker) method, the proportion of variance explained by individual-level predictors was calculated (Snijders and Bosker 1994, 2011). As shown in Table 5, individual-level predictors (gender and age) explained 47.9% of the variance variation of PPVT in children, 40.5% of the variance variation in children’s REMA-SF. The model fit indices showed a decrease in deviance.
(3) Results of Model II
The analytical results of Model II were shown in Table 5 (Model II column). It can be seen from the table that teachers’ cognitive sensitivity did not have a significant predictive effect on PPVT and REMA-SF development in children. The S&B method was also used to calculate the proportion of variance explained by adding class-level predictive variables (see Table 5). At this time, the variance variation explained by the cognitive sensitivity of teachers at the class level for children’s PPVT was 73.8%; the variance variation interpreted for children’s REMA-SF was 63.1%. Compared with the variation explained by Model I, there was an increase. The results of model fit indices appeared that the value of deviance barely changed from Model I to Model II.
(4) Results of Model III
The analysis results of model 3 were shown in Table 5 (Mode III column). It can be seen from the table that there was no significant cross-layer interaction between teachers’ cognitive sensitivity and children’s age. In addition, after the addition of interaction terms, the values of τ00 and σ2 in Model III were increased compared with those in Model II, but the increase was not very large. The Deviance value of the model fit index also had little change between Model II and Model III.
Discussion
Reliability discussion
The method of observation and evaluation is mainly adopted in the cognitive sensitivity measurement of early childhood teachers. Generally, two observers enter the one-day activity site of classes, and make dynamic on-site observation and corresponding evaluation of class teachers according to the scale. The reliability of the ECS scale for teachers mainly includes the raters’ and the scale’s. In this study, the consistency between the two raters was used for the reliability of the raters, and the results showed that the mean consistency between the raters was 0.765. In order to avoid the difference of evaluation results caused by the consistency between raters, although the discussion results of the two raters were adopted as the final score of ECS in the study. In the evaluation process, the two raters observed teachers according to the scale and gave subjective assessment, the rater’s error was an important factor that could not be ignored and affected the measurement results. Therefore, further exploration would be needed to verify the raters’ reliability of using observation method to evaluate ECS. In addition, the study used the method of internal consistency coefficient to measure the reliability of the scale. The results showed that the internal consistency coefficient of the scale was, α = 0.884 which meant that the internal consistency of the scale was good. Usually, the closer the internal consistency coefficient is to 1, the more desirable it will be (Shrout and Fleiss 1979; McGraw and Wong 1996; Weir 2005). The study of Pauker et al. (2018) showed that the internal consistency of the scale was, α = 0.96 and in comparison, the internal consistency of this scale in the context of Chinese culture needs to be improved. However, the value of α was mainly related to the length of the scale and the quality of the items (Cronbach 1951). In other words, the more items contained in the scale and the higher the quality of the items, the higher can be improved. Therefore, the reliability of cross-cultural adaptability of the scale needs to be further improved, and consideration could be given to increasing the number of items or revising the content of the items.
Validity discussion
The validity analysis of cross-cultural adaptability of the ECS scale was mainly carried out from the aspects of structural validity and empirical validity. The results of structural validity verified the research of Pauker et al. (2018), that was the scale contained a single common factor structure. But different from Pauker et al.’s (2018) results, the variance contribution rate of single factor explanation was not high (28.101%); Secondly, the factor loadings coefficient of some items (such as the 11th item) was not high. The main reasons for the differences in these research results may be that the existing samples were mainly from one province and two cities in East China, and the sample size was not large enough. On the other hand, these differences may be caused by the fact that the interpretation and evaluation of the scale items differ in different cultural contexts. In addition, EFA was employed to explore the structure of ECS in order to compare with the existing results. Due to the sample size limitations, Confirmatory Factor Analysis (CFA) was not used to confirm the structure. More participants will be sampled to validate the sturcture of the result in the future research.
Previous studies had used ITERS-R (Harms et al., 2003) and CLASS (La Paro et al., 2012) as the validity criteria to discuss the concurrent validity of the ECS scale, and the results showed that the scale had good concurrent validity. In the present study, The TFCP subscale of the PTE-CKEQRS with Chinese cultural background and the results of child development were used as the validity criteria to verify the empirical validity of the ECS scale. In conclusion, the results of the analysis showed that there was no significant correlation between the scale and the TFCP; the direct and interactive effects of teachers’ cognitive sensitivity on children’s development were not significant. On the one hand, these different results may be due to the different research tools and methods used, such as different criteria and measurement tools. Secondly, the cultural background and research object may be another reason. These results indicated that the appropriateness and promotion of the ECS scale in Chinese cultural background need to be further discussed, especially the measurement content, process and method of each item need to be continuously revised and practiced in the context of Chinese culture.
Conclusion
In summary, through the actual assessment and analysis of the cognitive sensitivity of 100 early childhood teachers from 50 classes in a certain province in eastern China, the results showed that: the internal consistency of the ECS scale was good; the results of the structural validity analysis of the scale were similar to those of existing studies. Based on the empirical validity analysis results where the ECS score had no associations with child development scales in the curriculum promotion field of PTE-CKEQRS, it was concluded that the empirical validity of the scale was not ideal, which needed to be further explored in practice for the future.
Data availability statement
The raw data supporting the conclusions of this article will be made available by the authors, without undue reservation.
Ethics statement
The studies involving human participants were reviewed and approved by the Ethics Committee of the Institute of Psychology, Zhejiang Normal University (ID.ZSRT2022055). Written informed consent to participate in this study was provided by the participants’ legal guardian/next of kin.
Author contributions
BL: first draft, data analysis, revised manuscript. DC: research design, data analysis, first draft, revised manuscript, translation. CY: translation. All authors contributed to the article and approved the submitted version.
Funding
This work was supported by Zhejiang Provincial Foundation of Philosophy and Social Sciences (No: 20NDJC07Z).
Conflict of interest
The authors declare that the research was conducted in the absence of any commercial or financial relationships that could be construed as a potential conflict of interest.
Publisher’s note
All claims expressed in this article are solely those of the authors and do not necessarily represent those of their affiliated organizations, or those of the publisher, the editors and the reviewers. Any product that may be evaluated in this article, or claim that may be made by its manufacturer, is not guaranteed or endorsed by the publisher.
References
Bernier, A., Carlson, S. M., and Whipple, N. (2010). From external regulation to self-regulation: Early parenting precursors of young Children’s executive functioning. Child Dev. 81, 326–339. doi: 10.1111/j.1467-8624.2009.01397.x
Burchinal, M., Howes, C., Pianta, R., Bryant, D., Early, D., Clifford, R., et al. (2008). Predicting child outcomes at the end of kindergarten from the quality of pre-kindergarten teacher-child interactions and instruction. Appl. Dev. Sci. 12, 140–153. doi: 10.1080/10888690802199418
Burchinal, M., Kainz, K., and Cai, Y. (2011). “How well do our measures of quality predict child outcomes? A meta-analysis and coordinated analysis of data from large-scale studies of early childhood settings” in Quality Measurement in Early Childhood Settings. eds. M. Zaslow, I. Martinez-Beck, K. Tout, and T. Halle (Baltimore, MD: Paul H. Brookes Publishing Co), 11–31.
Burchinal, M., Magnuson, K., Powell, D., and Hong, S. S. (2015). “Early childcare and education,” in Handbook of Child Psychology and Developmental Science: Ecological Settings and Processes. eds. M. H. Bornstein, T. Leventhal, and R. M. Lerner, vol. Vol. 4. 7th Edn. (Hoboken, NJ: John Wiley & Sons, Inc), 223–267.
Campbell, F. A., Pungello, E. P., Miller-Johnson, S., Burchinal, M., and Ramey, C. T. (2001). The development of cognitive and academic abilities: growth curves from an early childhood educational experiment. Dev. Psychol. 37, 231–242. doi: 10.1037/0012-1649.37.2.231
Carpendale, J. I. M., and Lewis, C. (2004). Constructing an understanding of mind: the development of children’s social understanding within social interaction. Behav. Brain Sci. 27, 79–151. doi: 10.1017/S0140525X04000032
Chen, D. Z., Li, K. J., and Zhou, J. (2021). Psychometric property analysis on “the path towards excellence Chinese kindergarten education quality rating standards (PTE-CKEQRS)” based on the data about 100 kindergartens and 1670 preschoolers in China. Stud. Early Childhood Educ. 01, 3–16. doi: 10.13861/j.cnki.sece.2021.01.001
Clements, D. H., Sarama, J. H., and Liu, X. H. (2008). Development of a measure of early mathematics achievement using the Rasch model: the research-based Early Maths assessment. Educ. Psychol. 28, 457–482. doi: 10.1080/01443410701777272
Cohen, P., Cohen, J., Teresi, J., Marchi, M. L., and Velez, C. N. (1990). Problems in the measurement of latent variables in structural equations causal models. Appl. Psychol. Meas. 14, 183–196. doi: 10.1177/014662169001400207
Cronbach, L. J. (1951). Coefficient alpha and the internal structure of tests. Psychometrika 16, 297–334. doi: 10.1007/BF02310555
Dunn, J. (2002). “Sibling relationships” in Blackwell Handbook of Childhood social Development. eds. P. K. Smith and C. H. Hart (New York, NY: Wiley), 223–237.
Dunn, M., and Dunn, L. M. (1981). Peabody Picture Vocabulary Test—Revised. Circle Pines, MN: American Guidance Service.
Fox, N. A., and Hane, A. A. (2008). “Studying the biology of human attachment” in Handbook of Attachment: Theory, Research, and Clinical Applications. eds. J. Cassidy and P. R. Shaver. 2nd Edn. (New York, NY: The Guilford Press), 217–240.
Glaser, D. (2000). Child abuse and neglect and the brain—a review. J. Child Psychol. Psychiatry 41, 97–116. doi: 10.1111/1469-7610.00551
Harms, T., Cryer, D., and Clifford, R. M. (2003). Infant/Toddler Environment Rating Scale Revised Edition (ITERS-R). New York, NY: Teachers College Press.
Hoff, E. (2006). How social contexts support and shape language development. Dev. Rev. 26, 55–88. doi: 10.1016/j.dr.2005.11.002
La Paro, K. M., Hamre, B. K., and Pianta, R. C. (2012). Classroom Assessment Scoring System (CLASS) Manual, Toddler. Baltimore, MD: Brookes.
Landry, S. H., Garner, P. W., Swank, P. R., and Baldwin, C. D. (1996). Effects of maternal scaffolding during joint toy play with preterm and full-term infants. Merrill-Palmer Q. 42, 177–199.
Landry, S. H., Smith, K. E., Landry, S. H., Smith, K. E., Swank, P. R., and Miller-Loncar, C. L. (2000). Early maternal and child influences on children’s later independent cognitive and social functioning. Child Dev. 71, 358–375. doi: 10.1111/1467-8624.00150
Laranjo, J., Bernier, A., Meins, E., and Carlson, S. M. (2010). Early manifestations of children’s theory of mind: the roles of maternal mind-mindedness and infant security of attachment. Infancy 15, 300–323. doi: 10.1111/j.1532-7078.2009.00014.x
Li, K., and Hu, B. (2012). On quality assessment of Early childhood programs in the international context and reconstructing the related conceptions in China. Int. Comp. Educ. 34, 15–20. doi: 10.20013/j.cnki.ICE.2012.07.04
Li, K., Pan, Y., Hu, B., Burchinal, M., De Marco, A., Fan, X., et al. (2016). Early childhood education quality and child outcomes in China: evidence from Zhejiang Province. Early Child. Res. Q. 36, 427–438. doi: 10.1016/j.ecresq.2016.01.009
Lundy, B. L. (2013). Paternal and maternal mind-mindedness and preschoolers’ theory of mind: the mediating role of interactional attunement. Soc. Dev. 22, 58–74. doi: 10.1111/sode.12009
Mashburn, A. J., Pianta, R. C., Hamre, B. K., Downer, J. T., Barbarin, O. A., Bryant, D., et al. (2008). Measures of classroom quality in prekindergarten and Children’s development of academic, language, and social skills. Child Dev. 79, 732–749. doi: 10.1111/j.1467-8624.2008.01154.x
McGraw, K. O., and Wong, S. P. (1996). “Forming inferences about some intraclass correlations coefficients”: correction. Psychol. Methods 1:390. doi: 10.1037/1082-989X.1.4.390
Meins, E., Fernyhough, C., Wainwright, R., Gupta, M. D., Fradley, E., and Tuckey, M. (2002). Maternal mind-mindedness and attachment security as predictors of theory of mind understanding. Child Dev. 73, 1715–1726. doi: 10.1111/1467-8624.00501
Nores, M., Belfield, C. R., Barnett, W. S., and Schweinhart, L. (2005). Updating the economic impacts of the high/scope Perry preschool program. Educ. Eval. Policy Anal. 27, 245–261. doi: 10.3102/01623737027003245
Pauker, S., Perlman, M., Prime, H., and Jenkins, J. (2018). Caregiver cognitive sensitivity: measure development and validation in Early childhood education and care (ECEC) settings. Early Child. Res. Q. 45, 45–57. doi: 10.1016/j.ecresq.2018.05.001
Peisner-Feinberg, E. S., Burchinal, M. R., Clifford, R. M., Culkin, M. L., Howes, C., Kagan, S. L., et al. (2001). The relation of preschool child-care quality to children’s cognitive and social developmental trajectories through second grade. Child Dev. 72, 1534–1553. doi: 10.1111/1467-8624.00364
Prime, H., Perlman, M., Tackett, J., and Jenkins, J. (2014). Cognitive sensitivity in sibling interactions: development of the construct and comparison of two coding methodologies. Early Educ. Dev. 25, 240–258. doi: 10.1080/10409289.2013.821313
Prime, H., Plamondon, A., Pauker, S., Perlman, M., and Jenkins, J. M. (2016). Sibling cognitive sensitivity as a moderator of the relationship between sibship size and children’s theory of mind: a longitudinal analysis. Cogn. Dev. 39, 93–102. doi: 10.1016/j.cogdev.2016.03.005
Sarama, J., and Clements, D. H. (2017). “Interventions in early mathematics: avoiding pollution and dilution,” in The Development of Early Childhood Mathematics Education. eds. J. Sarama, D. H. Clements, C. Germeroth, and C. Day-Hess, Vol. 53, (Cambridge, MA: Elsevier Academic Press), 95–126. doi: 10.1016/bs.acdb.2017.03.003
Shrout, P. E., and Fleiss, J. L. (1979). Intraclass correlations: uses in assessing rater reliability. Psychol. Bull. 86, 420–428. doi: 10.1037/0033-2909.86.2.420
Snijders, T. A. B., and Bosker, R. J. (1994). Modeled variance in two-level models. Sociol. Methods Res. 22, 342–363. doi: 10.1177/0049124194022003004
Snijders, T. A., and Bosker, R. J. (2011). Multilevel Analysis: An Introduction to Basic and Advanced Multilevel Modeling. Thousand Oaks, CA: SAGE Publications Ltd, Limited.
Vandell, D. L., Belsky, J., Burchinal, M., Steinberg, L., and Vandergrift, N. (2010). Do effects of early child care extend to age 15 years? Results from the NICHD study of early child care and youth development. Child Dev. 81, 737–756. doi: 10.1111/j.1467-8624.2010.01431.x
Weiland, C., Wolfe, C. B., Hurwitz, M. D., Clements, D. H., Sarama, J. H., and Yoshikawa, H. (2012). Early mathematics assessment: validation of the short form of a prekindergarten and kindergarten mathematics measure. Educ. Psychol. 32, 311–333. doi: 10.1080/01443410.2011.654190
Keywords: early childhood teachers, cognitive sensitivity, cross-cultural suitability analysis, measurement properties, scale
Citation: Lu B, Chen D and Yan C (2022) The cross-cultural suitability analysis of “the Educator Cognitive Sensitivity scale”: Empirical exploration from early childhood teachers. Front. Educ. 7:1055847. doi: 10.3389/feduc.2022.1055847
Edited by:
Gavin T. L. Brown, The University of Auckland, New ZealandReviewed by:
Pedro Gil-Madrona, University of Castilla-La Mancha, SpainLihong Song, Jiangxi Normal University, China
Copyright © 2022 Lu, Chen and Yan. This is an open-access article distributed under the terms of the Creative Commons Attribution License (CC BY). The use, distribution or reproduction in other forums is permitted, provided the original author(s) and the copyright owner(s) are credited and that the original publication in this journal is cited, in accordance with accepted academic practice. No use, distribution or reproduction is permitted which does not comply with these terms.
*Correspondence: Dezhi Chen, Y2RlemhpQHpqbnUuY24=