 Vaidas Morkevičius
 Rasa Erentaitė
 Saulė Raižienė†
- Faculty of Social Sciences, Arts, and Humanities, Kaunas University of Technology, Kaunas, Lithuania
This article investigates methodological problems of measuring family wealth among secondary school students with home possessions indicators. It employs multiple correspondence analysis (MCA) in order to explore (1) the dimensionality of home possessions items, (2) the nature of relationship between these items, and (3) the substantive meaning of the first and other relevant dimensions. It also employs regression analysis in order to study potential explanatory factors of the second dimension of the MCA solutions that may be related to measurement problems of the instrument. Two sources of data are used: (1) open access data from the National Survey of Student Achievement (NSSA) in Lithuania that provide a series of national educational studies conducted from 2002 to 2016, and (2) data from the Programme for International Student Assessment (PISA) study conducted in Lithuania in 2018 that is used to corroborate findings produced using the first data source. Results of the data analysis show that the first dimension of MCA solutions obtained from home possessions items in both NSSA and PISA data sets reflect high vs. low socio-economic status (SES) of the students. However, there is at least one more important dimension, and it reveals multi-dimensional nature of the measurement instrument. Analysis of potential explanatory factors of the second dimension of the MCA solutions revealed that reading abilities and school-related affect is related to this dimension. Thus, the second dimension of MCA solutions might also reflect methodological problems related to the measurement of home possessions in adolescent surveys.
Introduction
Socioeconomic status (SES) is one of the most important characteristics of individuals that may predetermine their health, subjective well-being, career development, as well as academic achievement, among many other things (Diemer et al., 2013). However, its conceptualization and measurement has never been an easy task (Grusky, 2014), especially, among school-aged children and adolescents (Hauser and Andrew, 2007; Svedberg et al., 2016). Following the best practice recommendations (Diemer et al., 2013), measurement of SES among children and adolescents often relies on traditional indicators of parental education, occupation, and income (or family wealth). Different combinations of these indicators have been used in research with school-aged children and adolescents (Van Ewijk and Sleegers, 2010), however, a number of problems of using the three traditional SES indicators were identified.
Firstly, it is observed that parental education, occupation, and income all assess a substantially different aspect of SES that cannot be used as proxies for one another (Pförtner et al., 2015; Svedberg et al., 2016; Marks and Pokropek, 2019). Moreover, the questions on parental education, occupation, and income often result in large proportions of missing data, even when these characteristics are reported by parents themselves (e.g., Marks and Pokropek, 2019), but especially when children and adolescents report on them (Wardle et al., 2002; Currie et al., 2008; Aarø et al., 2009; Doku et al., 2010). The share of missing data in adolescent reports on parental occupation has varied from 20 to 45% in previous studies, with greater non-response registered among adolescents from low SES backgrounds (Currie et al., 2008). Finally, school student responses on the traditional SES indicators may lack consistency. When asked about their parents’ education across three time-points over a period of around a year, 30% of middle school students provided responses that were inconsistent on at least two time-points (Aarø et al., 2009).
Multitude of measures have been employed in trying to solve the problems of measuring young adults’ SES. In this article we specifically focus on improved way of measuring parental income. In order to tackle the challenges associated with more direct measurement of parental income (or family wealth), researchers introduced additive multi-item scales of home possessions. In educational research, home possessions are considered a proxy indicator for family wealth (Filmer and Scott, 2008), which is an aspect of family SES. Items that indicate what kind of objects a family owns at home are used to measure home possessions. These multi-item additive scales (with numerous and diverse items) are used in large international educational surveys of school-aged children and adolescents, such as, PISA, TIMSS, or PIRLS. Although the conceptual definition of home possessions is assumed to be the same across international large-scale assessments (ILSAs), different sets of indicators for home possession are used in these studies. In order to reveal the diversity of home possessions items used in ILSAs we present indicators for home possession used in the most recent cycles of six ILSAs (PISA, TIMSS, PIRLS, TERCE, ICCS, and ICILS) in the Table 1.
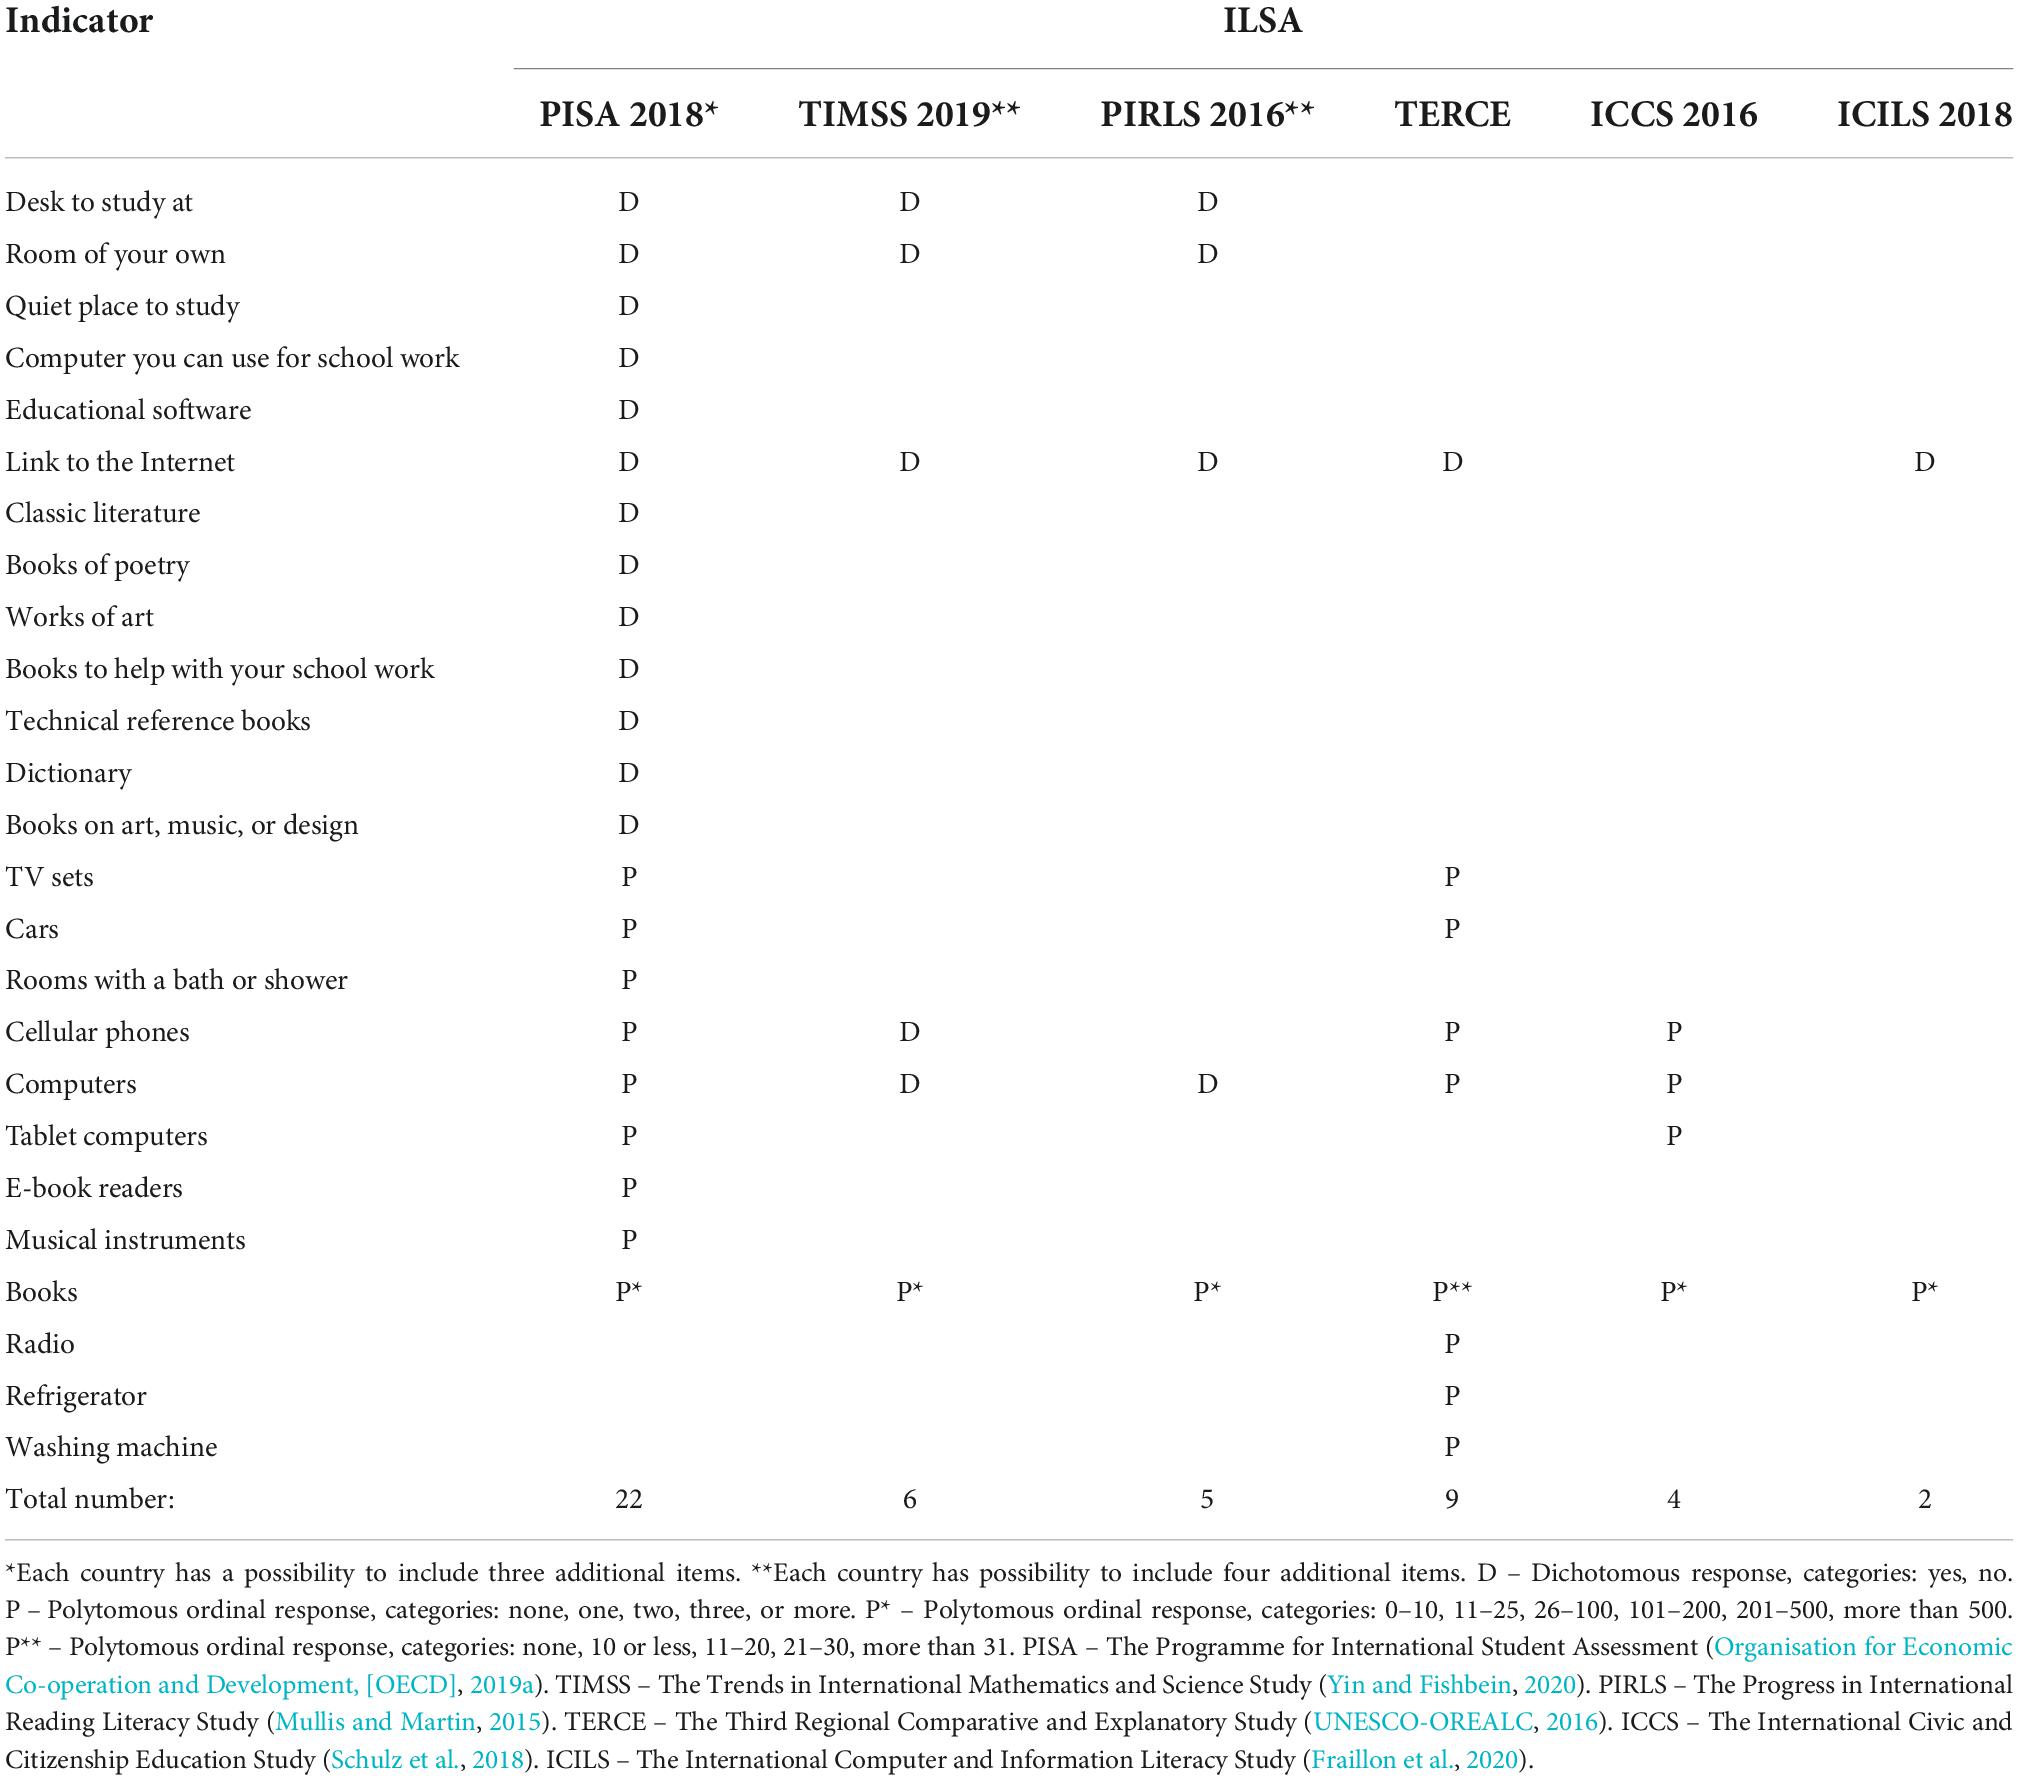
Table 1. Indicators for home possessions in the most recent cycles of ILSAs.
The highest number of indicators is used in PISA surveys, the lowest in ICILS. Only books, computers, and Internet access were common indicators across all the reviewed ILSAs. It can also be observed that even in the same ILSA, items for measurement of home possessions are constantly reviewed and updated to ensure the best reflection of the cultural environment and differentiate students according to family wealth (Lee and von Davier, 2020). Further, we see that when assessing home possessions, dichotomous (children are asked whether they have a certain household item or not) and polytomous ordinal response options (children are asked to indicate how many specific household items they own) are used.
Due to diversity of measurement, indicators of home possessions were investigated for validity and reliability, and in terms of reporting (lack of missing data) and reliability (incorrect or inconsistent reporting), they appeared to fare better than the simple question measuring parental income (Wardle et al., 2002; Traynor and Raykov, 2013; Torsheim et al., 2016). However, other measurement issues seem to plague these indicators. The most thoroughly investigated are these three questions: (1) which items of possessions should be included (in the essence a conceptual issue, see Eryilmaz et al., 2020), (2) whether the home possessions item data form a uni-dimensional scale, and (3) whether the measurement of family wealth with home possessions items is culturally invariant (the latter two being measurement or empirical issues). The answers to these questions are interconnected: to a great extent all depends on the number and nature of items. The more items are included and the more diverse they are, the less tenable is the assumption of uni-dimensionality (and invariance among countries). Items reflecting cultural capital (for example, possession of artworks, musical instruments, poetry) are separated into a different factor from those reflecting material wealth (for example, possession of computers, cars, dishwashers) and educational resources (for example, dictionaries, own textbooks, number of books) (see, for example, Traynor and Raykov, 2013). However, most of the studies conclude that it is possible to construct a uni-dimensional scale of home possessions that is culturally invariant, if items are carefully selected (Traynor and Raykov, 2013; Sandoval-Hernández et al., 2019; Eryilmaz et al., 2020).
Research motivation and expectations
This study once again looks into the two questions that Traynor and Raykov (2013) identified among the most important for studying quality of family wealth scales: whether most of the variation in item responses is due to true variability in wealth, and whether assets item data form a uni-dimensional scale. However, for this purpose we resort to a new method – multiple correspondence analysis – that has rarely been used in the context of assessment of measurement instruments of adolescent SES, but has been shown to be useful in revealing presence of methodological problems in the context of assessing other measurement instruments (see, for example, Blasius and Thiessen, 2006). This method allows to analyze non-linear relationships between the categorical variables (nominal, as well as ordinal). This feature is clearly suitable in the context of home possessions measurement, which involves nominal (binary) and ordinal items. Its particular strengths are related to relaxing all the assumptions about the nature of relationships between variables and being able to investigate relationships between the categories of variables (not just between the variables). However, it is limited to exploratory research and cannot be used as a confirmatory method for assessing quality of measurement instruments. However, graphical nature of its results (Le Roux and Rouanet, 2004) allows to explore relations between qualitative variables and their categories more closely and qualitatively.
In this article we aim to, first, assess the dimensionality of home possessions items measuring material, educational and cultural resources of families in educational achievement studies. In this respect, we expect to find at least two important dimensions, as rather diverse items are included into the analysis. Second, we aim to explore the nature of relationship between these items and expect to find that they are “linear-like” (just to explore visually, as it is not possible to evaluate the nature of relationship statistically). Third, since we expect the first dimension in the solution to be reflecting differences in home possessions, we intend to investigate the substantive meaning of other dimensions. We expect to find that these dimensions (or at least the second one) also reflect differences in home possessions. However, they may also be related to measurement problems of the instrument itself. In order to investigate this expectation we use regression analysis with different regressors reflecting possible methodological explanations, such as, reading ability of students and their school-related affect.
Specifically, we focus on three potential sources of measurement problems. The first is students’ reading ability, which reflects the potential of a student to understand the substantive meaning of the questions about their home possessions. Those with low reading ability may be more prone to provide inconsistent answers or straightline. The second source of measurement problems could be related to students’ overall engagement with the task (answering the questionnaire), which is shaped by a variety of psychological processes, including students’ affective reactions to school. It has been determined that students’ positive affect at school (such as whether they feel safe at school, whether they enjoy their school time, whether they feel good around their classmates) is related to higher engagement in tasks at school (Eccles et al., 2015). Thus, students with less positive school-related affect could be less engaged in the process of responding to questions on home possessions, which could lead to more careless responding, more straightlining, and higher proneness to social desirability. Finally, we controlled for gender, since some studies show that girls and boys experience different roads of upbringing and education (see, for example, Määttä and Uusiautti, 2020) and, consequently, their propensity for giving controversial or seemingly inconsistent answers might be different.
Data and methods
Data sources
For this study we used two sources of data. The main data source was open access data from the National Survey of Student Achievement (NSSA) in Lithuania. NSSAs are a series of national educational studies conducted from 2002 to 2016, designed to provide countrywide information about student achievement and educational context. The NSSAs include data from standardized student achievement tests in math, reading, and other subjects, and self-report questionnaires on student background, motivation, and learning environment at home and school. The NSSAs are based on nationally representative stratified two-stage nested samples. The students are sampled by randomly selecting schools and then randomly selecting a class (or several classes) from selected schools.1
The present study uses data from the NSSA rounds of 2012, 2014, 2015, and 2016. The study sample includes only students from schools with Lithuanian language of instruction. The study sample for 2012 is 4479 eighth grade students (from 160 comprehensive schools and 212 classes: 49.8% female). The sample for 2014 includes 3,763 eighth grade students (from 148 comprehensive schools and 178 classes: 50.4% female). The sample for 2015 includes 3,482 eighth grade students (from 147 comprehensive schools and 166 classes: 49.5% female). The sample for 2016 includes 2,710 sixth grade students (from 115 comprehensive schools and 131 classes: 49.9% female). The sample proportions by urbanization levels, gender, special educational needs, and school types correspond to national distributions. All the rounds of NSSAs were administered in schools at the end of a school year. Student testing (standardized tests and questionnaires) took about 150 min.
In order to corroborate our findings produced using the first data source we also analyzed data from the Programme for International Student Assessment (PISA) study conducted in Lithuania in 2018.2 The sample includes 6,885 15-years-old Lithuanian students (from 362 schools in 20 strata identified based on residential area and type of school: 48.9% female).
Measures
Home possessions
We define home possessions as family wealth characteristic which indicates what kind of material, educational and cultural resources the family owns at home. Aligned with this definition, 8 student self-reported items were used to measure home possessions in the NSSA data. These items were included into all the studied samples: number of books at home (measured on a 5-point ordinal scale) and possession of seven types of artifacts at home (measured on a binary scale yes/no): dictionary, encyclopedia, journals, musical instruments, works of art/albums, three or more computers, and dishwasher.3
To assess home possessions in the Lithuanian sample of the PISA, 2018 data we used student self-reported items most similar to the items in the NSSA data (unfortunately, most of the home possessions items in the two data sources differed): number of books at home (measured on a 6-point ordinal scale), number of cars, musical instruments, and computers at home (measured on a 4-point ordinal scale, converted to a 3-point ordinal scale merging categories “none” and “one”), and possession of 4 types of artifacts at home (measured on a binary scale yes/no): dictionary, technical reference books, works of art, and classic literature items.
Reading performance
In the NSSA studies students’ reading performance was measured by reading tests constructed to target reading skills in four content domains: retrieval of explicitly stated information, inference making, analysis, and interpretation and evaluation. Aggregate scores obtained from different reading domains showed good internal consistency as McDonald’s (hierarchical) omega reliabilities4 were 0.80 in 2012, 0.82 in 2014, 0.83 in 2015, and 0.79 in 2016. The aggregate scores for reading were standardized so that the mean of the score in each assessment is 500 and the standard deviation is 100.
To measure reading performance in 2018 PISA dataset, different groups of students were given reading performance tests designed to evaluate students’ capabilities to access and retrieve, integrate and interpret, reflect and evaluate the written texts (Organisation for Economic Co-operation and Development, [OECD], 2019a). PISA calculated ten plausible values for each student’s reading performance based on their test results and background information. Though prior PISA studies (see, for example, Agasisti and Zoido, 2018; Delprato and Antequera, 2021) used the first plausible value for the main analyses and other values for robustness checks, we employ the mean of the ten plausible values to represent students’ reading performance in our analyses.5 For more detailed information on the methodology of reading performance evaluation in PISA 2018, see the PISA assessment framework and technical report (Organisation for Economic Co-operation and Development, [OECD], 2019a,b).
School-related affect
For assessing school-related affect in the data from the NSSA studies, we employed four items reflecting students’ affective reactions such as safety, enjoyment and excitement toward school and classroom. Similar items to measure students’ emotional school appraisals were used in previous studies (see, for example, Wang and Eccles, 2011). Participants rated their agreement with the statements “You feel safe at school,” “You love being at school,” “You enjoy studying at your school” and “You feel good in class” on a 4-point scale (from 1 – strongly disagree to 4 – strongly agree). School-related affect scale showed rather good internal consistency as McDonald’s (hierarchical) omega reliabilities were 0.66 in 2012, 0.72 in 2014, 0.71 in 2015, and 0.71 in 2016. Structural and discriminant validity of the school-related affect scale was also evaluated. The unidimensional nature of the scale was supported by the findings from exploratory factor analysis (principal axis factoring) for the four items (Erentaitė et al., 2022). Across all four NSSA datasets, a single factor with eigenvalue > 1 was identified. The total variance explained by the single factor ranged from 39.74 to 47.49%. All item loadings were above the common cut-off point of 0.40 in all datasets. In addition, moderate positive correlations between school-related affect and other aspects of school-related motivational appraisals were observed (Erentaitė et al., 2022). Specifically, school-related affect was positively related to academic task value (r ranged between 0.24 and 0.42) and academic self-concept (r ranged between 0.26 and 0.34). School-related affect was also positively related to favorable teacher–student relationships (r ranged between 0.32 and 0.43) (Erentaitė et al., 2022). Composite score for school-related affect was created by computing the mean of items.
Gender
We included students’ gender as a control variable measured on a binary scale (male vs. female).
Data analysis methods
Multiple correspondence analysis (MCA) is a statistical method for dimensional analysis of categorical data consisting of more than two variables (Greenacre, 2017). It is a descriptive (exploratory) method allowing visual portrayal of interrelations of categories of multiple categorical variables. MCA has several implementations. One of them is based on the indicator matrix (this approach to MCA is the most commonly used) and others – on the Burt table: MCA without adjustment of inertias, MCA with adjustment of inertias, and joint correspondence analysis (see Greenacre, 2017).6 The indicator matrix approach is based on recoding of original categorical data into indicator matrix where each category has its own column and the values are 1 (if a case belongs to that category) and 0 (if a case does not belong to that category). And MCA is a statistical technique for visualizing data of this “two-way table” by calculating coordinates representing both its rows and columns.7 These coordinates are analogous to factor loadings in a principal components analysis, factor analysis or multidimensional scaling except that they partition the Chi-square value (usually, called inertia) instead of the total variance.
Although dimensions onto which coordinates are transferred invite for interpretation, their interpretation in MCA is different from that in factor analysis (Greenacre, 2017). This is mostly due to the fact that categories of categorical variables (columns) and cases (rows) are analysed separately, but then plotted together using a biplot, where positions of categories and cases might be quite arbitrary.8 Since the two spaces [separately constructed for categories of categorical variables (columns) and cases (rows)] are portrayed on the plot simultaneously,9 singular interpretation (or “naming”) of axes (dimensions) is difficult. Usually, in MCA one first proceeds by looking at the “solution of categories” and trying to identify, which categories are opposed one to the other on the first and the second dimensions10 for each variable separately and then trying to identify if there is any structure to the distribution of points. Importantly, distances between the points of categories represent Chi-square (and not Euclidean) differences, and, therefore, are quite abstract quantities.
Spatial locations of categories of variables provide visual picture of the pattern of relationship between the variables analysed. For categories of separate variables, angle between the origin and the two points (categories) is most important. If the angle is small (close to 0°), the two categories are positively related. If the angle is 90°, the two categories are not related at all. And if angle is 180° (they are opposite each other), the two categories are negatively related. Further, the more distant the points are from the origin, the more distinctive they are from the average profile. Finally, it is important to note that all the results of MCA are relative, that is, they have to be interpreted taking into consideration all the categories of variables not just a few selected ones.
Since there were some missing values for the home possession items included into the analysis (less than 5%), before calculating the MCA solutions we imputed these missing values using multiple imputation algorithm suggested by Josse and Husson (2016). First, we estimated the optimal number of dimensions of MCA solution for each group with the function estim_ncpMCA() included into the missMDA package (Josse and Husson, 2016) of the R statistical software for statistical computing and graphics (R Core Team, 2022). We employed Kfold (cross-validation) algorithm with pNA parameter (indicating the percentage of missing values inserted and predicted with MCA using ncp.min = 0 to ncp.max = 5 dimensions) = 0.05, and nbsim parameter (the number of times the process is repeated) = 100. The lowest value of the mean square error of prediction (MSEP) was used as the criterion for evaluating the optimal dimensionality of MCA solutions (Josse and Husson, 2016). The second step consisted of performing the (regularized11) iterative MCA algorithm with the number of dimensions selected in the previous step, using the function imputeMCA() from the R package missMDA, in order to impute missing values for subsequent MCA analysis.
Then we calculated MCA solutions (based on indicator matrix analysis) on the imputed datasets.12 In addition, individual principal coordinates of the first two dimensions of the MCA solutions were saved for further analysis. The principal coordinates of cases (individuals) are similar in interpretation to factor scores of the principal components or confirmatory factor analysis solutions. In the relevant cases, values of the first dimension were reversed in order to make them equivalent in interpretation, that is, so that higher scores indicate higher SEC.
For the explanatory analysis of the individual scores (principal coordinates) on the second dimension we employed linear regression analysis. However, several adjustments had to be made in order to reflect the sampling design of the collected data. In order to reflect the sampling design, for the NSSA data sets we calculated cluster (student class) robust standard errors (type “HC3,” see Long and Ervin, 2000) with the R package sandwich (Zeileis, 2006; Zeileis et al., 2020). In order to account for complex sampling design and representativity problems, for the 2018 PISA Lithuanian sample data we used senate weights when calculating regression coefficient estimates and reported model robust Horvitz-Thompson type standard errors (a generalization of the model robust “sandwich” estimators) adjusting for the stratification and clusterization of the data. The latter calculations were performed with the R package survey (Lumley, 2010).
Results and discussion
Multiple correspondence analysis solutions for the National Survey of Student Achievement data sets
First, we studied results obtained from the analysis of NSSA data sets. The graphical representations of the MCA solutions that were obtained from NSSA data sets in Figures 1–4 show that categories of separate variables are dispersed along the first dimension (horizontal) following the logic of higher vs. lower amounts of home possessions: on the positive side of the first dimension we find categories indicating lack of home possessions, and the “opposite” categories are clustered on the negative side of the first dimension. This dimension explains from 17.44% (2016, sixth grade) to 19.32% (2014, eighth grade) of variance (inertia). It is considered to be a substantial proportion of variance, as Greenacre (2017) observes that the average inertia per dimension is one divided by the number of variables, and the values above this threshold indicate which axes are worth interpreting in MCA (p. 140). In our case the threshold for inertia values is 0.125 (1/8 variables).13
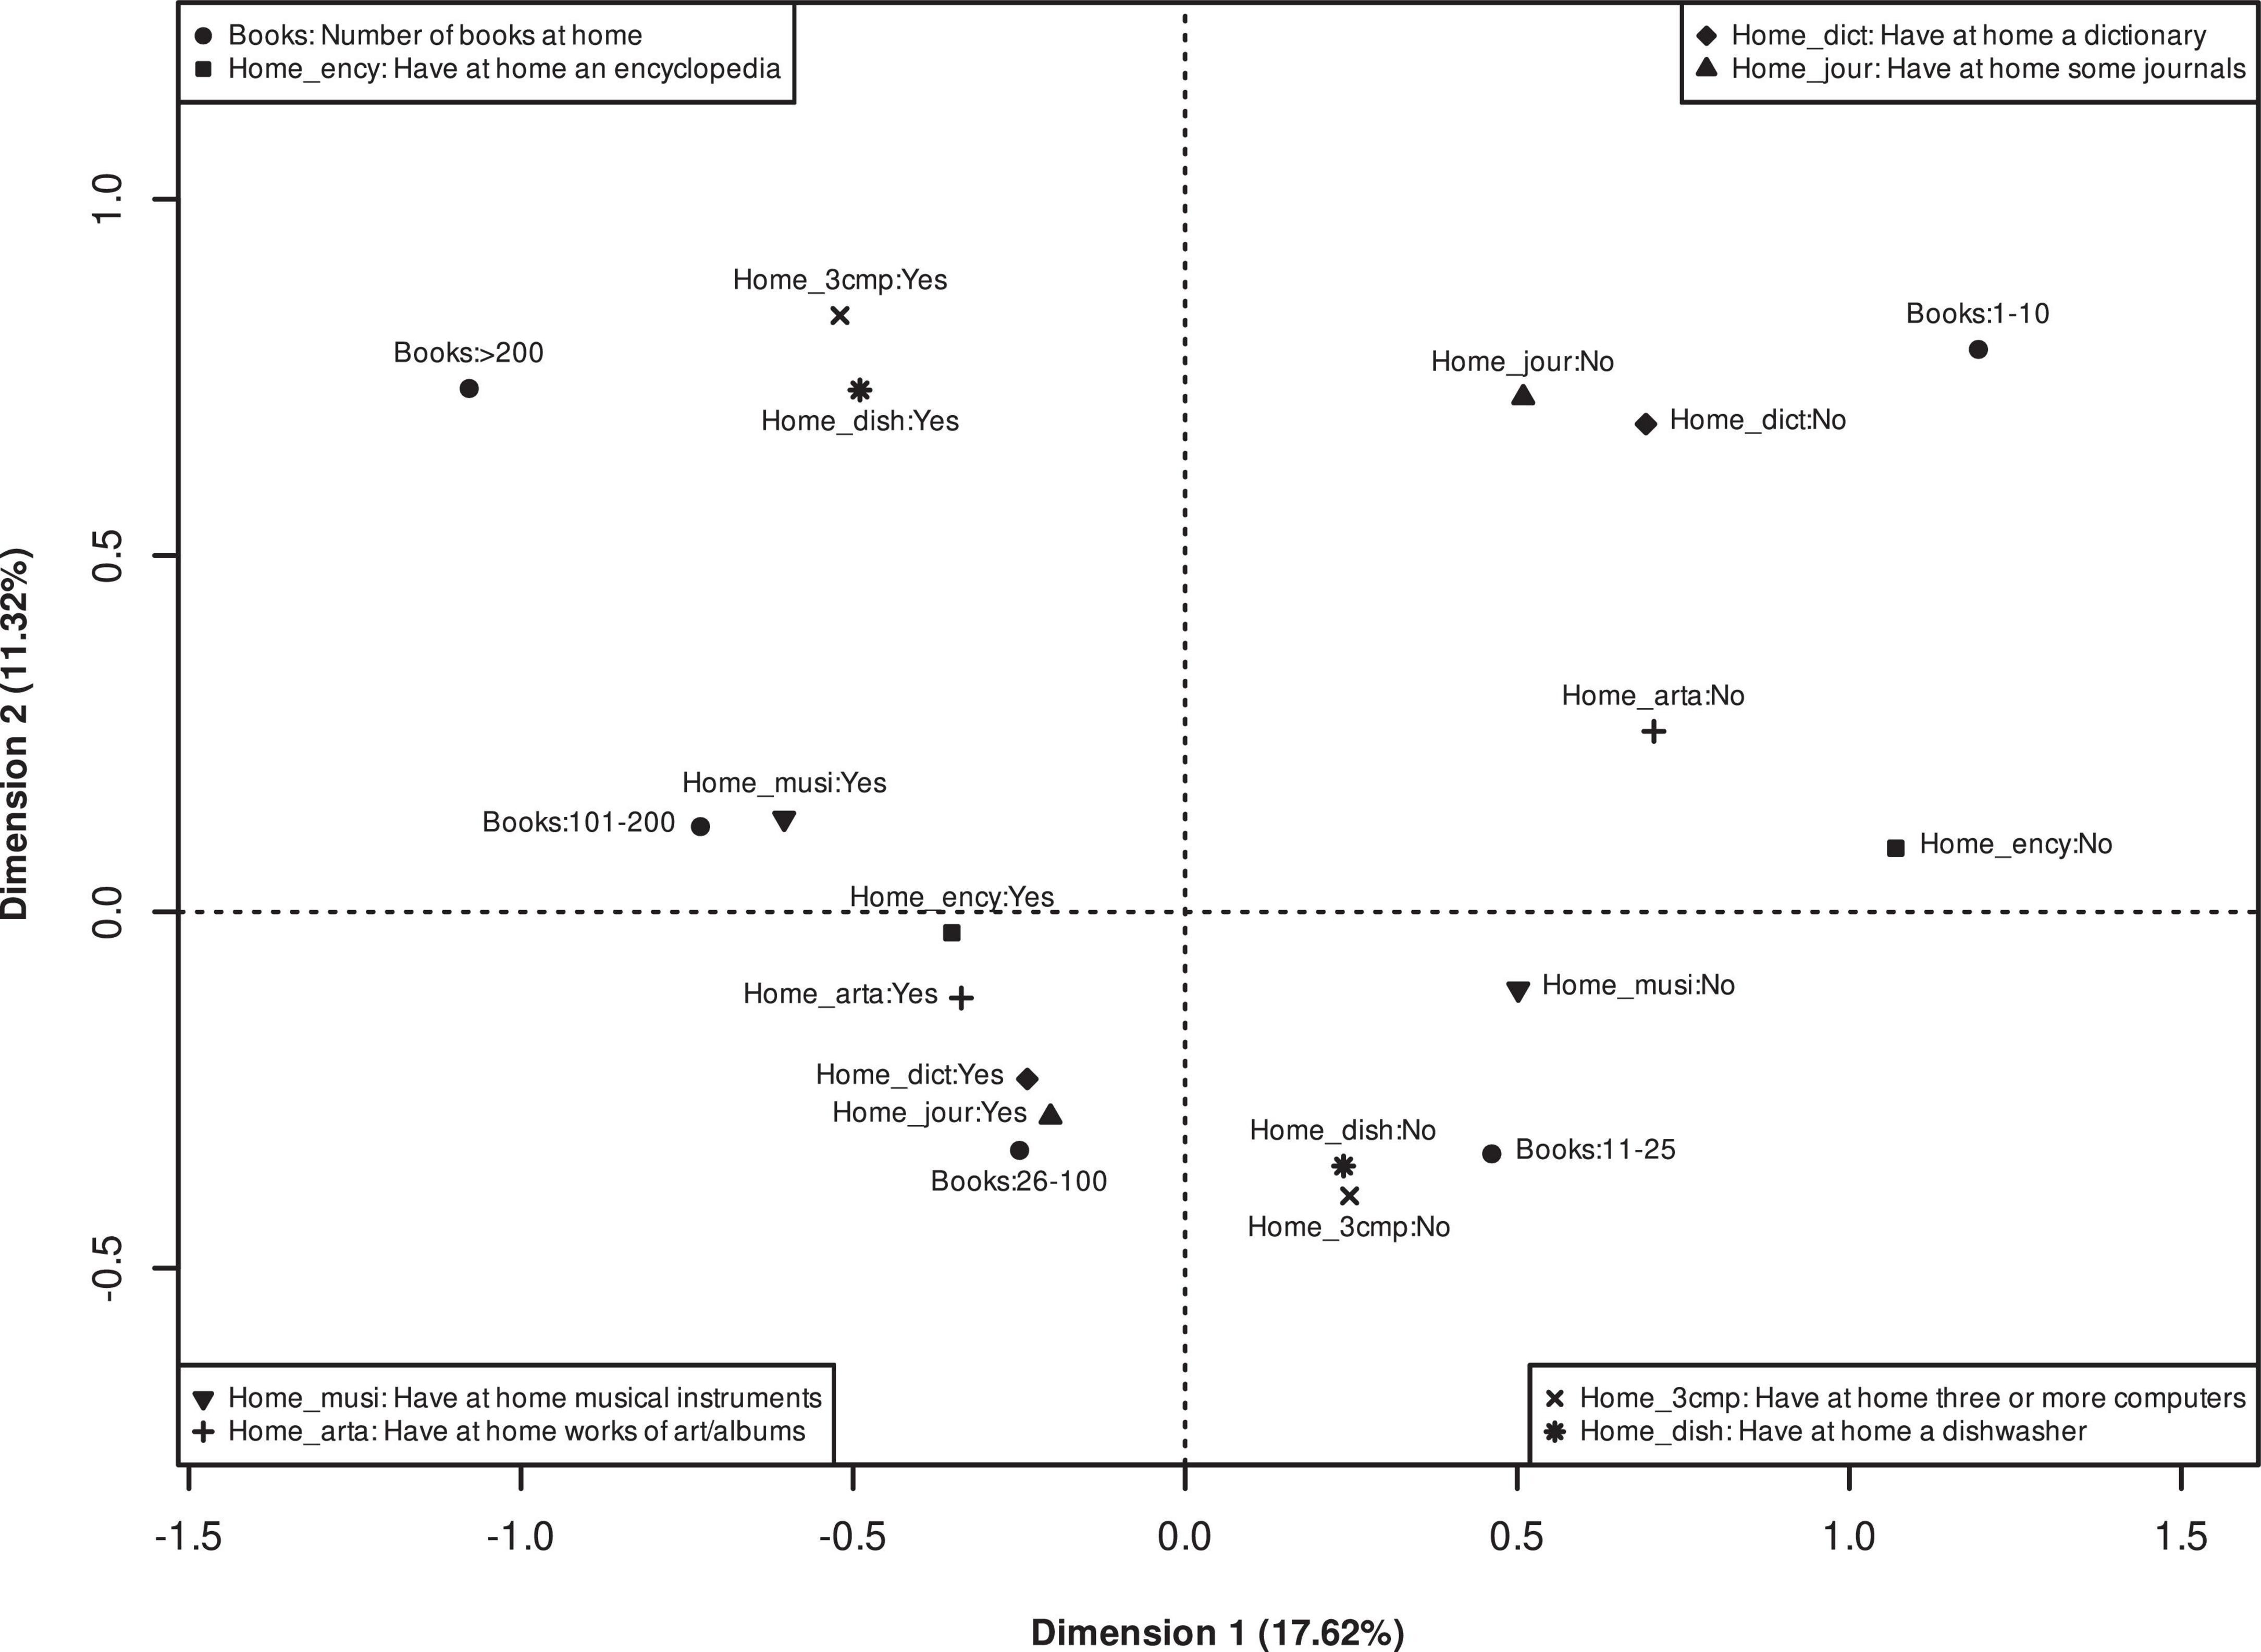
Figure 1. Multiple correspondence analysis solution (indicator matrix approach, principal coordinates) for items measuring home possessions: 2012 National Survey of Student Achievement (NSSA) data, eighth grade.
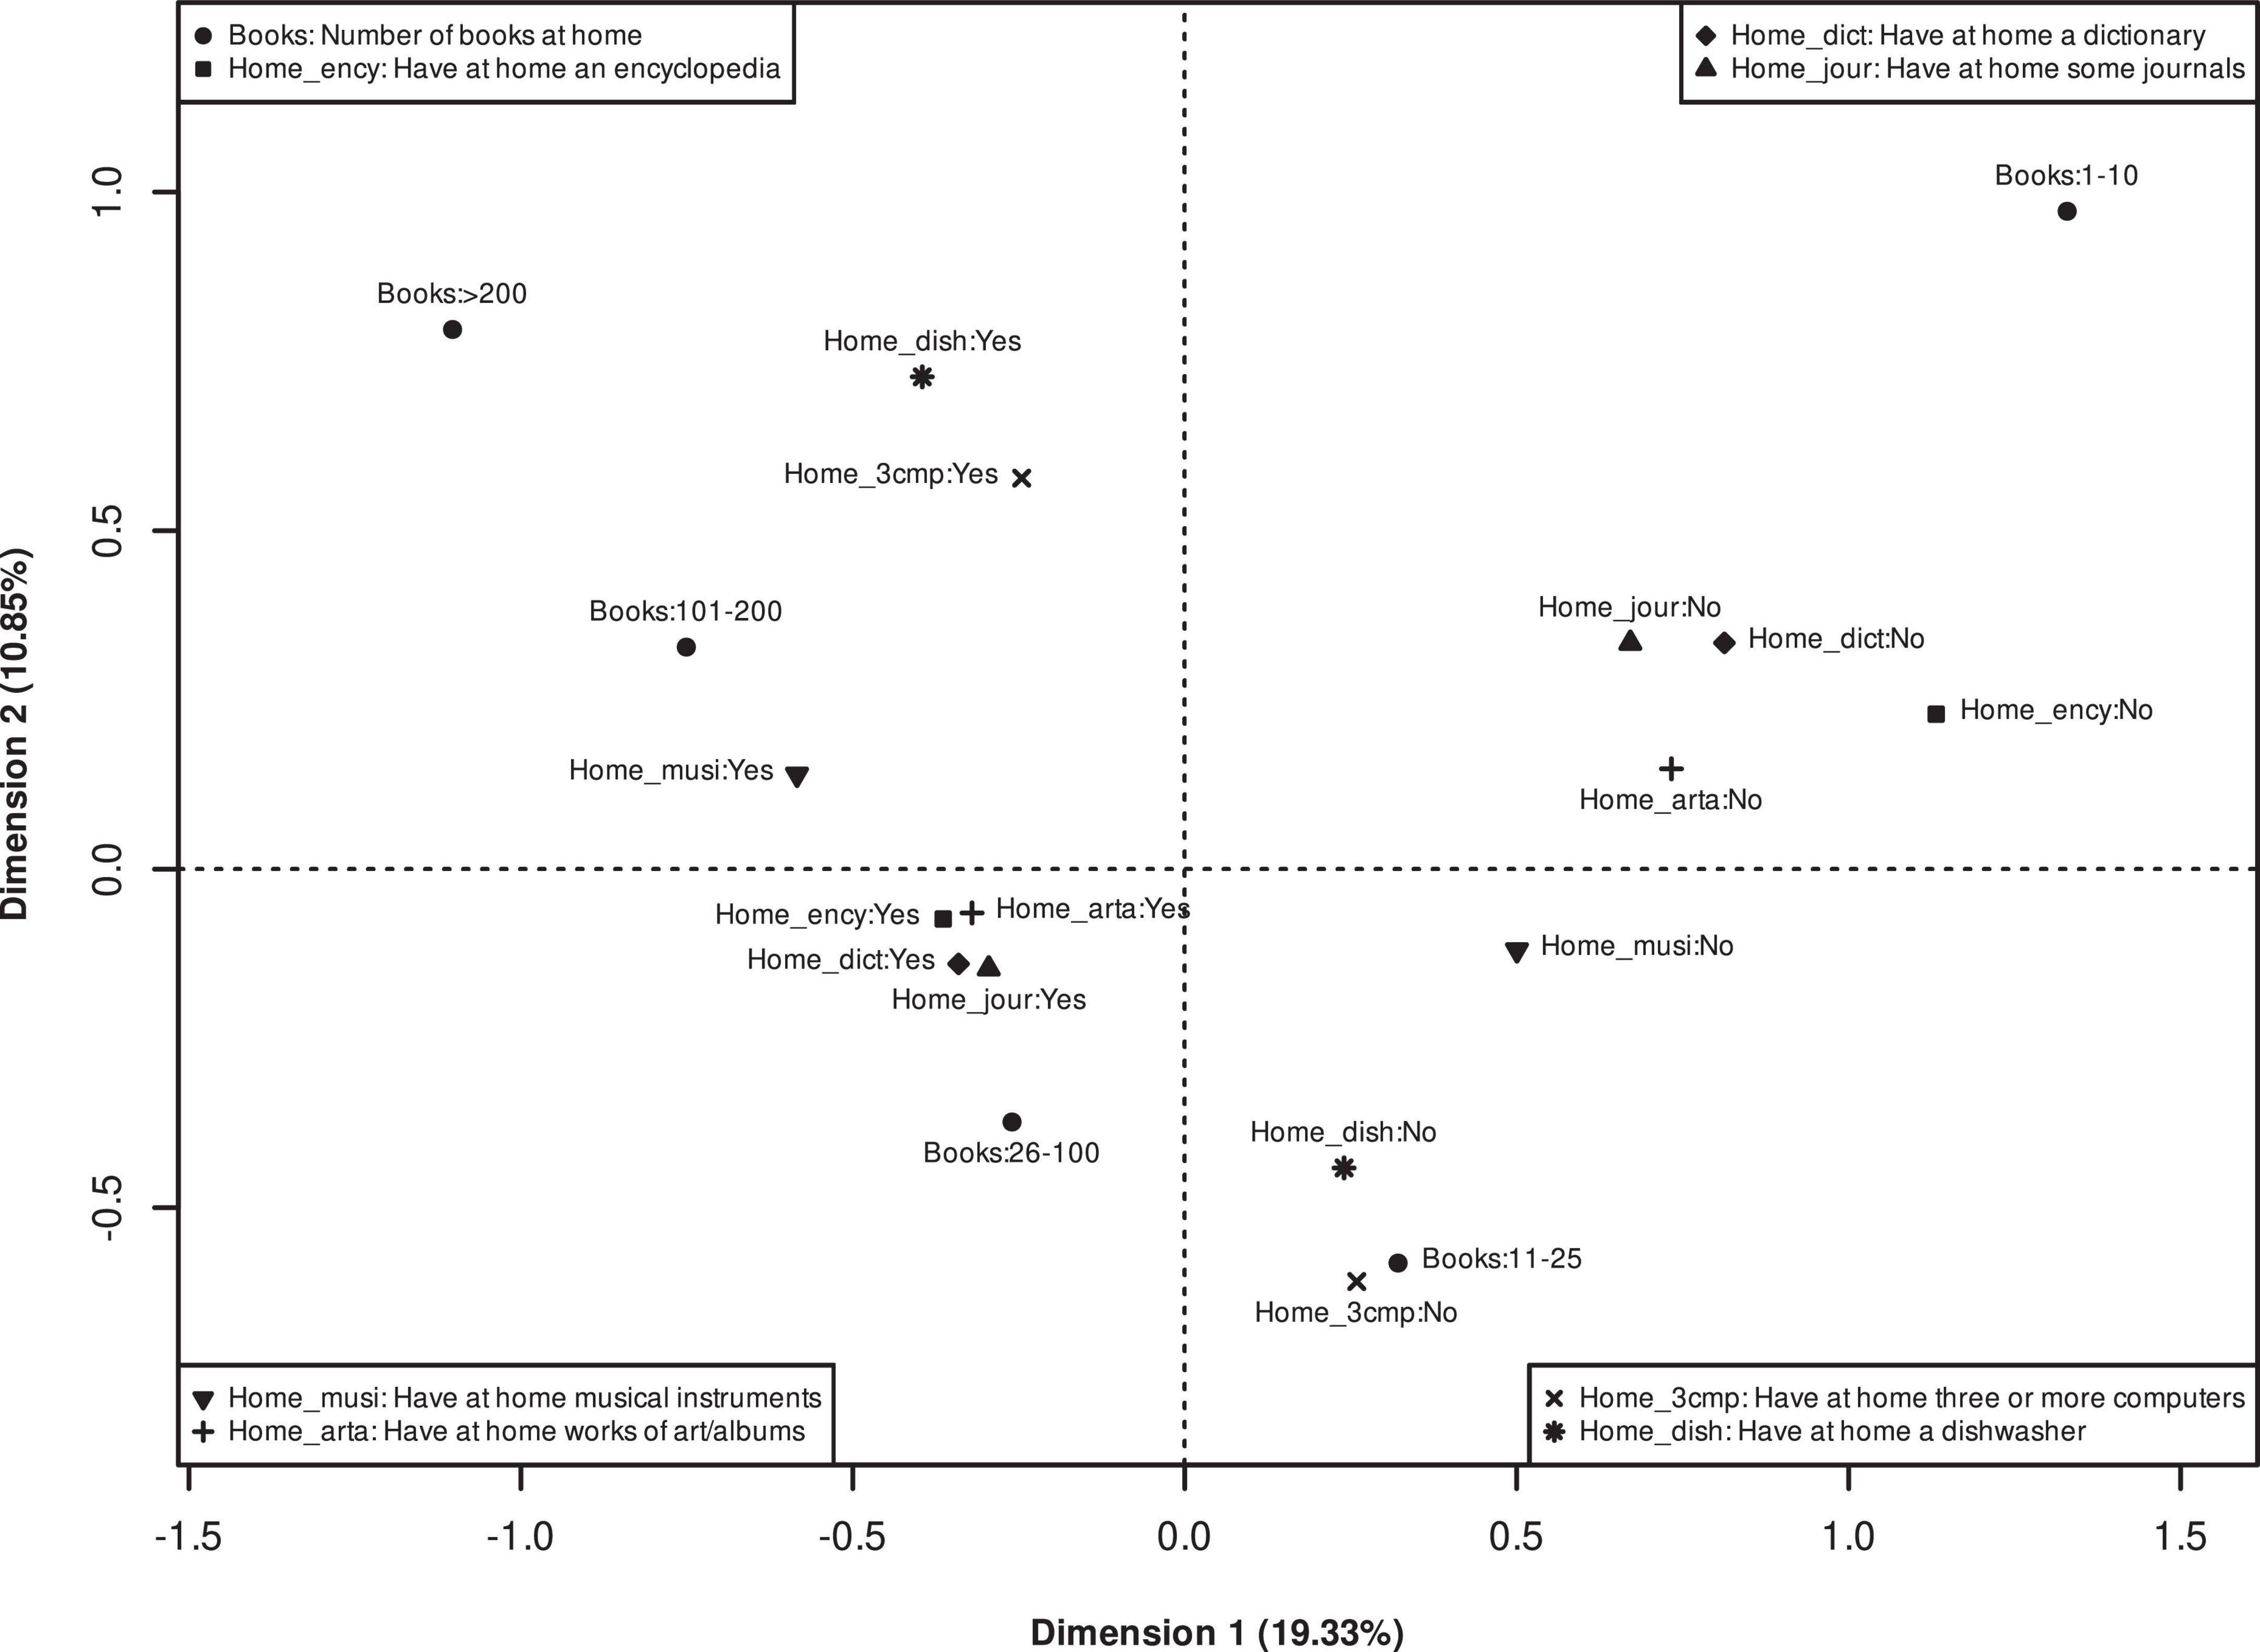
Figure 2. Multiple correspondence analysis solution (indicator matrix approach, principal coordinates) for items measuring home possessions: 2014 National Survey of Student Achievement (NSSA) data, eighth grade.
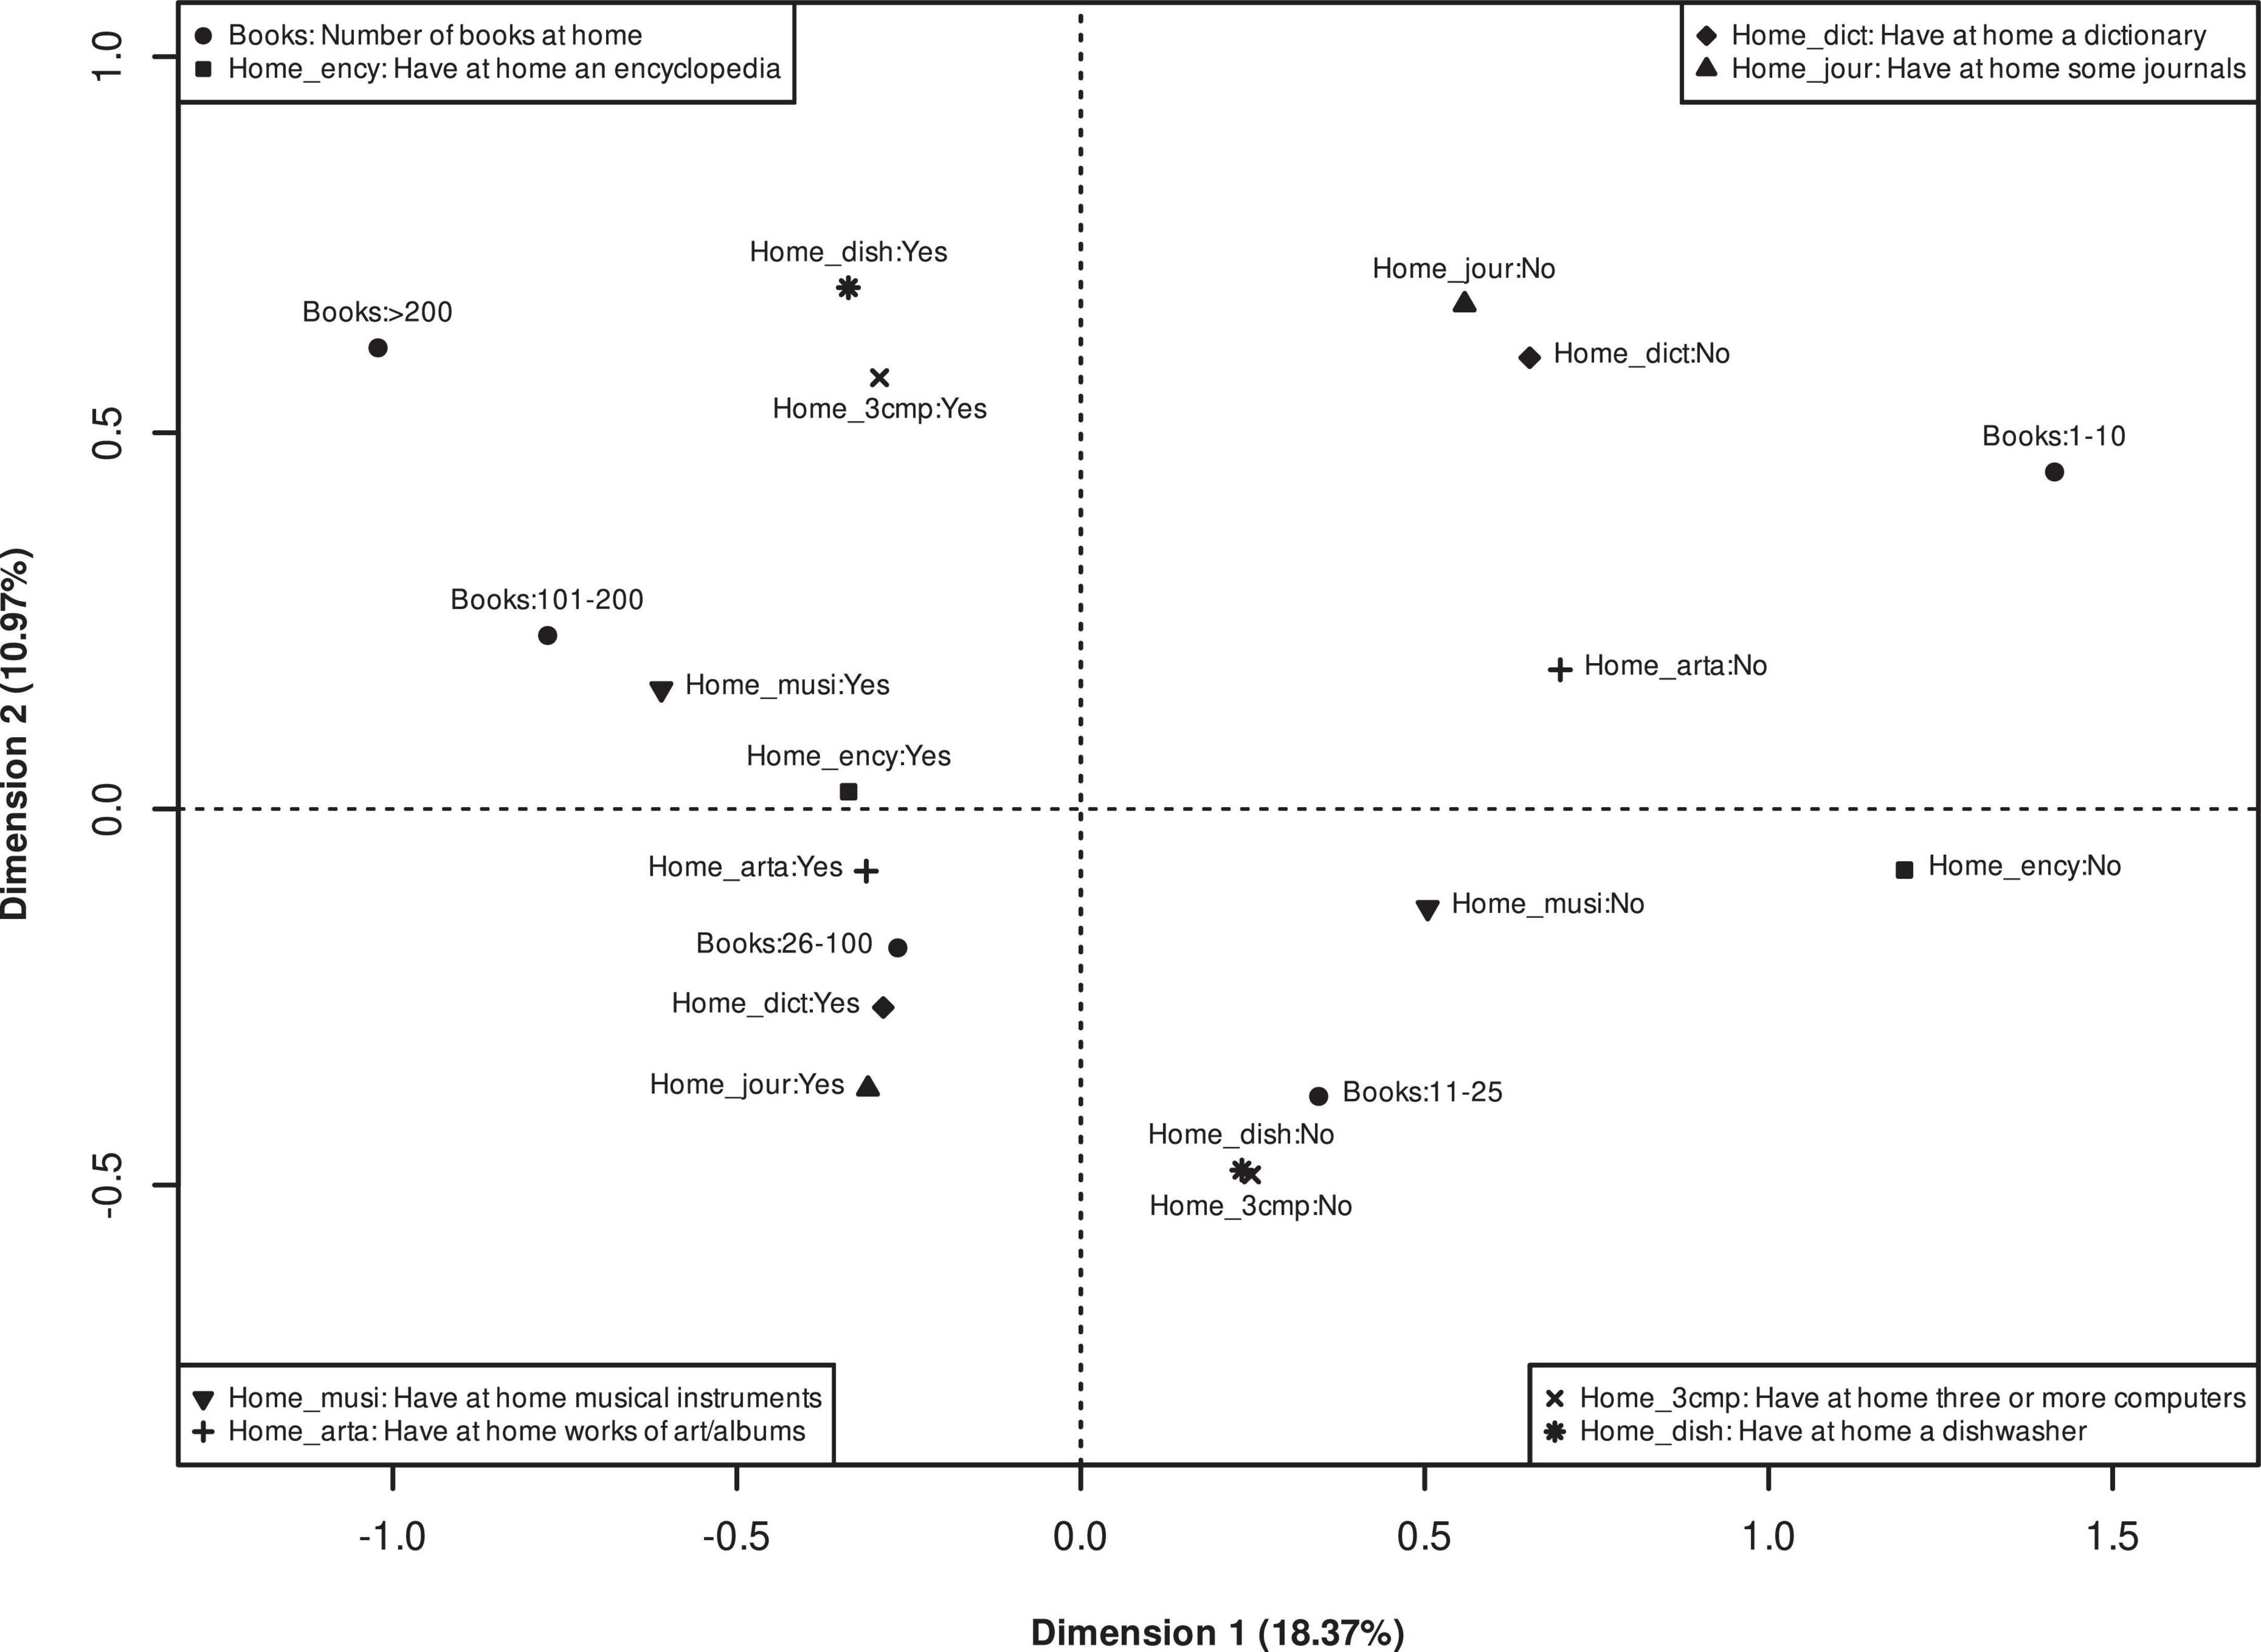
Figure 3. Multiple correspondence analysis solution (indicator matrix approach, principal coordinates) for items measuring home possessions: 2015 National Survey of Student Achievement (NSSA) data, eighth grade.
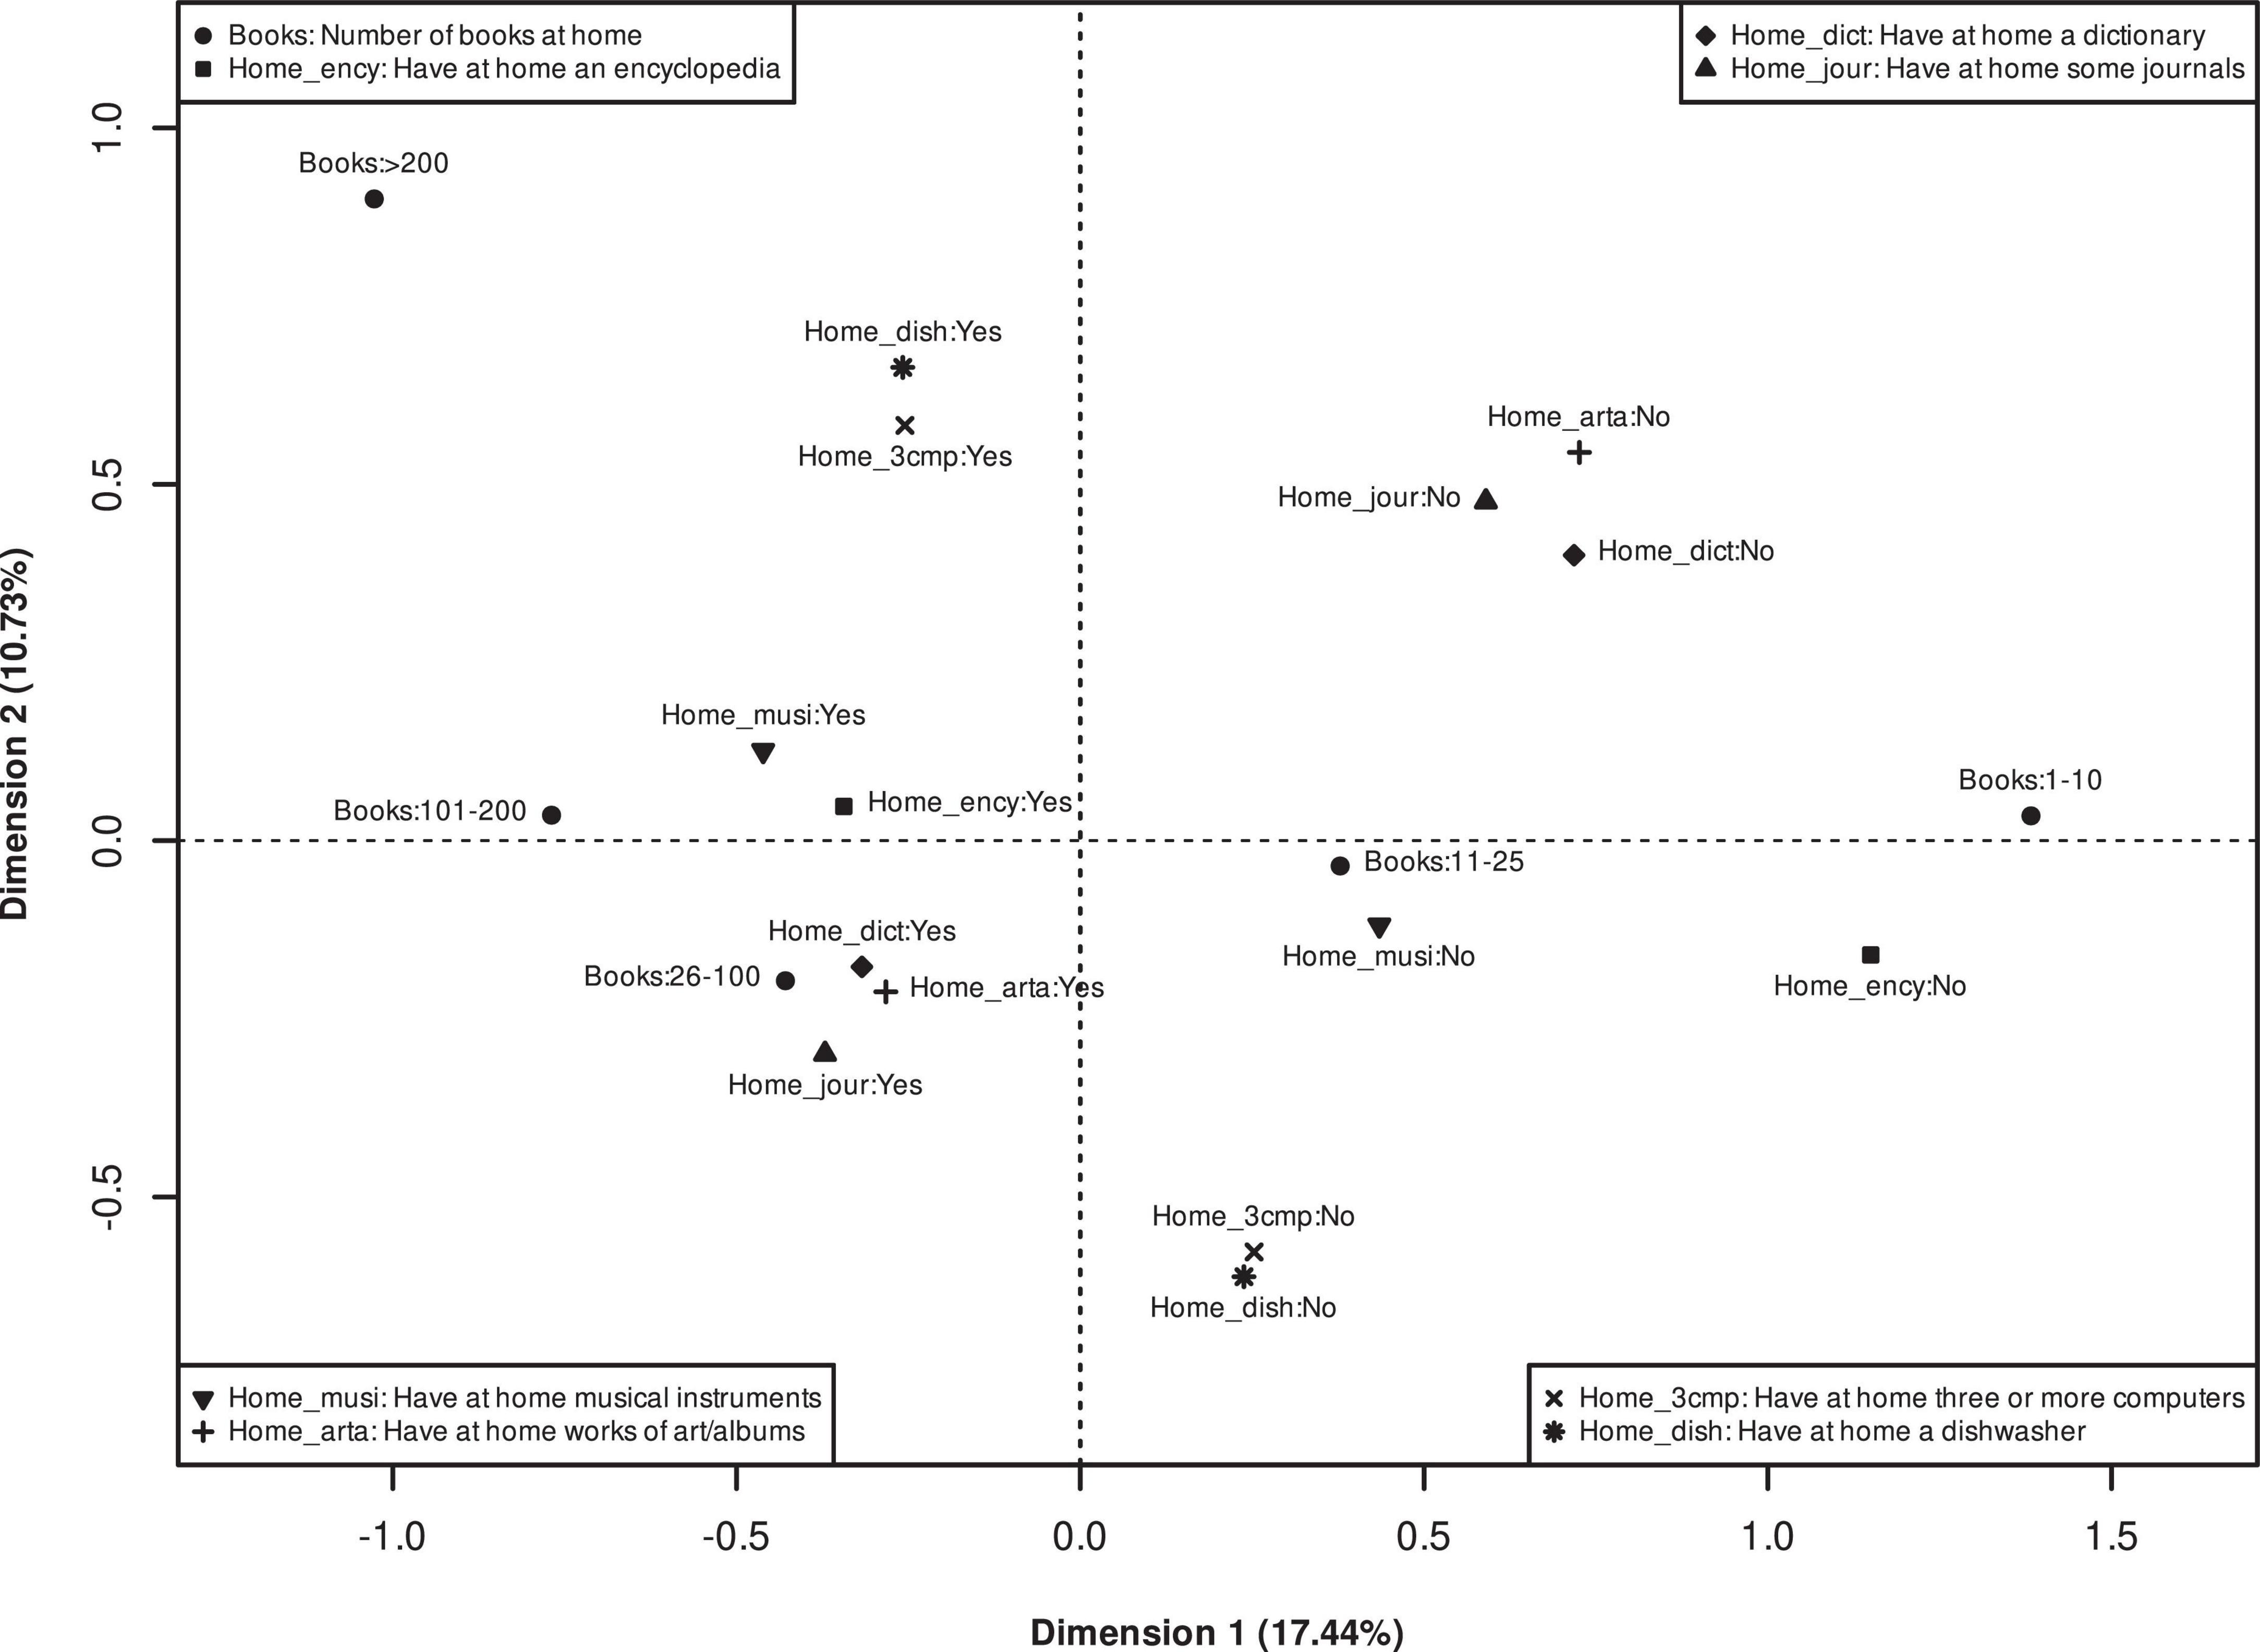
Figure 4. Multiple correspondence analysis solution (indicator matrix approach, principal coordinates) for items measuring home possessions: 2016 National Survey of Student Achievement (NSSA) data, sixth grade.
Further, we see that in all the MCA solutions for separate NSSA data sets the first two dimensions can be considered as the ones explaining the share of variance (inertia) considerably above the threshold, and the remaining ones – close or below the threshold. Therefore, it is quite clear that one-dimensional solution is not sufficient for describing the relationship between the items of home possessions in the data. Thus, it seems that the assumption of single-dimensionality of the home possession items as measures of family wealth in adolescent studies is untenable (see also Rutkowski and Rutkowski, 2010; Eryilmaz et al., 2020). However, we still have to look at the distribution of categories along the second (vertical) dimension in order to identify patterns and interpret their possible substantive meaning.
First, one can identify distribution of categories of the only ordinal variable “Number of books at home” as representing an arch or horseshoe effect (Greenacre, 1984, pp. 226–232; Greenacre, 2017, pp. 127–128). Different explanations can be given to this distribution, ranging from those reflecting on a methodologically induced variation due to geometric approach of MCA (Blasius and Thiessen, 2006; Greenacre, 2017), to those claiming that the effect shows non-linear relationship between the dimensions in the solution (Greenacre, 1984). However, it also may speak of certain features of the data quality, such as differing understanding of questions presented to the respondents in survey research (Blasius and Greenacre, 2006), or specific sets of answers among certain groups of respondents that had to be differentiated in constructing the final MCA solution (Greenacre, 2017). However, we analysed only one home possessions item that is ordinal, thus, the most common methodological explanations of the arch effect apply only partially. Two explanations may be most relevant in our case. Those related to complex (or non-linear) nature of relationships between analysed variables and particular sets of answers among certain groups of respondents. Most importantly, the nature of relationships revealed shows that they are more complex than just linear ones.
Further, if we look at the remaining seven items that are dichotomous in nature, we can see several patterns. First, some of these items can be positioned along the different sides of the second dimension (having a dishwasher, three or more computers, dictionary, and journals at home), and other items are very close to each other and near the origin (having an encyclopedia, musical instruments, and pieces of art at home; in the latter case, except in the sample of sixth graders in 2016). It seems that substantially the second dimension is differentiating between those respondents having economic resources and not having them. At the same time, it is not substantively relevant for discerning patterns of possessing other types of resources, especially, cultural resources. These findings resemble those obtained and discussed by Eryilmaz et al. (2020), where following the Bourdieu’s cultural reproduction and forms of capital theories the authors identify three types of capital relevant for measuring socio-economic background in adolescent studies – economic, cultural, and social. Home possession items are included into the first two of them alongside parental education and occupation.
From the MCA solutions biplots we also see that on the second dimension possession of educational resources form an opposite cluster to the economic resources. At least for certain groups of students, having a dishwasher and more than three computers at home goes with not having certain educational resources, such as journals and dictionaries. These findings may indicate not only differences in parents’ values or capital possession orientations (such as, economic vs. cultural capital), but also some methodological shortcomings of the measuring instrument itself (Blasius and Greenacre, 2006; Blasius and Thiessen, 2006).
Thus, some students may exhibit inaccurate or contradictory patterns of answers to home possessions questions/items due to various reasons, such as, their cognitive abilities (inability to understand the substantive meaning of the question), lack of interest in answering the questionnaire, straightlining the answers or social desirability.
Explaining the second dimension of multiple correspondence analysis solutions
In order to provide possible methodological explanations related to the aforementioned problems of measurement we conducted regression analyses of several factors on the second dimension of the MCA solutions. We hypothesized that the second dimension of the MCA solutions could be related to how well the students are able to understand the content of the items they are responding to. Specifically, the students’ reading abilities may facilitate or infringe the process of understanding certain questions/items and thus impact the process of responding. We expected that students with lower reading abilities might be less likely to recognize correctly all the questions/items of home possessions and thus would have higher scores on the second dimension of the MCA solutions (indicating possession of material wealth and lack of cultural/educational resources at home).
Further, we also took into consideration that the process of answering the questions/items on home possessions (as well as the entire assessments) took place at schools, during regular study days, in regular classrooms. Since the assessments also included academic achievement tests, the whole process of taking the assessments could be perceived by students as regular classwork. Student behaviors and engagement with classwork at school are shaped by a variety of psychological processes, including students’ affective reactions to school (Eccles et al., 2015). In line with previous findings on the effects of school-related affect, we expected that students with more negative school-related affect will be less likely to be engaged in the process of responding to questions during the assessment, including home possessions items, which, in turn, could lead to more careless responding, more straightlining, and higher proneness to social desirability. In terms of MCA results, this would mean higher scores on the second dimension of MCA solutions.
We also included gender as a control variable into the analysis, as some studies show that girls and boys experience different roads of upbringing and education (see, for example, Määttä and Uusiautti, 2020) and, consequently, their propensity for giving controversial or seemingly inconsistent answers might be different.
The results of the regression analyses (see Table 2) showed that cognitive (reading) abilities of the students was an important factor related to the second dimension of the MCA solution for the home possessions items in three of the NSSA data sets. The relationship was negative, meaning that lower reading abilities were associated with higher scores on the second dimension. The latter reflected contradictory answers of the students with respect to high economic and low educational resources at home. Thus, we got at least partial support for the hypothesis that the second dimension of the MCA solutions might be related to methodological shortcomings stemming from poor understanding of the items measuring home possessions.
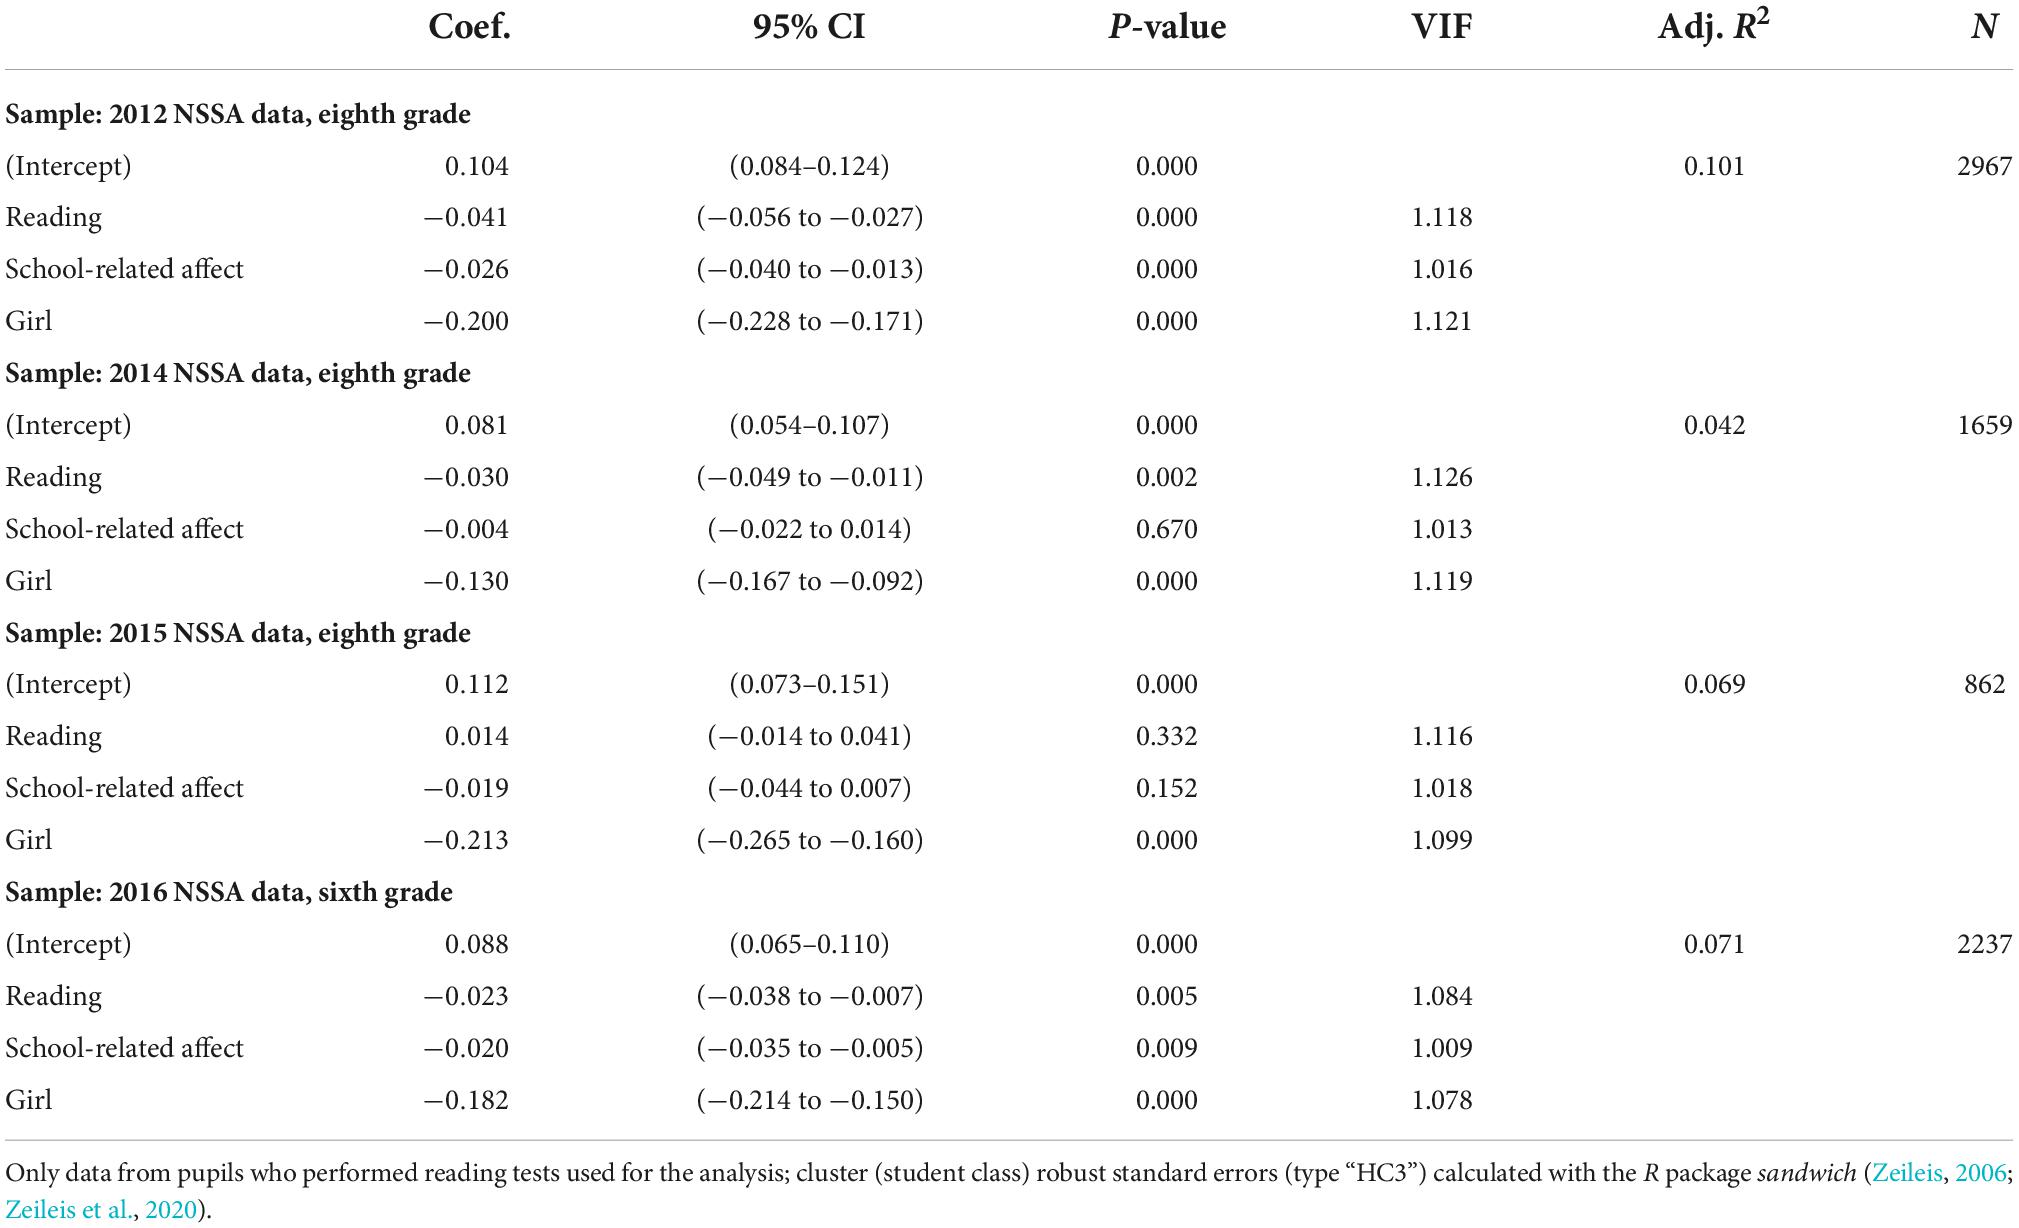
Table 2. Regression results of predictors of the second dimension of the multiple correspondence analysis solutions of the National Survey of Student Achievement (NSSA) data sets.
The results also indicated that student’s school-related affect (feeling safe and comfortable at school, positive feelings about being and studying at school) was negatively related to the second dimension of the MCA solution for the home possessions items in two of the NSSA data sets. Therefore, we also get partial confirmation of our second hypothesis, which relates emotional comfort of the students with higher engagement in tasks at school, and in our case, the task of completing the survey without inconsistent answers. It appeared that students with less positive affect toward their school tended to choose contradictory answers, reflecting high economic and low educational resources at home, suggesting that this relationship might be related to their lower engagement with the task rather than substantive differences in home possessions.
Finally, we found that gender was related to the second dimension of MCA solutions. At least some of the boys appear to be selecting contradictory answers reflecting high economic and low educational resources at home.
To sum up, we found that the first dimension of MCA solutions obtained from home possessions items in NSSA data sets can indeed be considered as reflecting high vs. low SEC. However, there is at least one more important dimension in the solutions, and it reveals multi-dimensional nature of the measurement instrument. It separates those possessing more items of economic (and educational) capital from those possessing more items of cultural capital at home. Also, MCA solutions biplots showed that opposites (having and not having) of economic and educational resources are on the same side of the second dimension. This finding may, of course, be related to the fact that parents have different value orientations and exhibit different patterns of capital possession (some prefer material wealth, others – cultural capital). However, analysis of potential explanatory factors that may be related to the second dimension of the MCA solutions revealed that reading abilities and school-related affect is indeed related to this dimension. Thus, the second dimension of MCA solutions might also be an indication of methodological problems related to the measurement of home possessions in adolescent surveys.
Corroborating results with Lithuanian 2018 PISA data
In order to corroborate our findings obtained from the NSSA data sets we additionally analyzed Lithuanian sample data for the 2018 PISA study. Looking at the results of the MCA (see Figure 5) we see similar patterns of associations between home possessions items categories (even having in mind that the items themselves are a bit different between the samples and their answer categories in some cases differ). First, we see that at least two dimensions are required to explain substantive amount of variance (inertia) among the home possessions items (see Supplementary Appendices Table A2). Further, we also found the same distribution (“arch or horseshoe like”) of the categories in the solution of the ordinal variable “Number of books at home” (Greenacre, 1984, pp. 226–232; Greenacre, 2017, pp. 127–128). In addition, other ordinal scale variables (“Number of cars/musical instruments/computers at home”) were also distributed along the arch shaped line. In this case the finding is more important as it reveals the form of relationship between the ordinal home possessions items. Again, we get confirmation of a complex (not simple linear) relationship between the home possessions items.
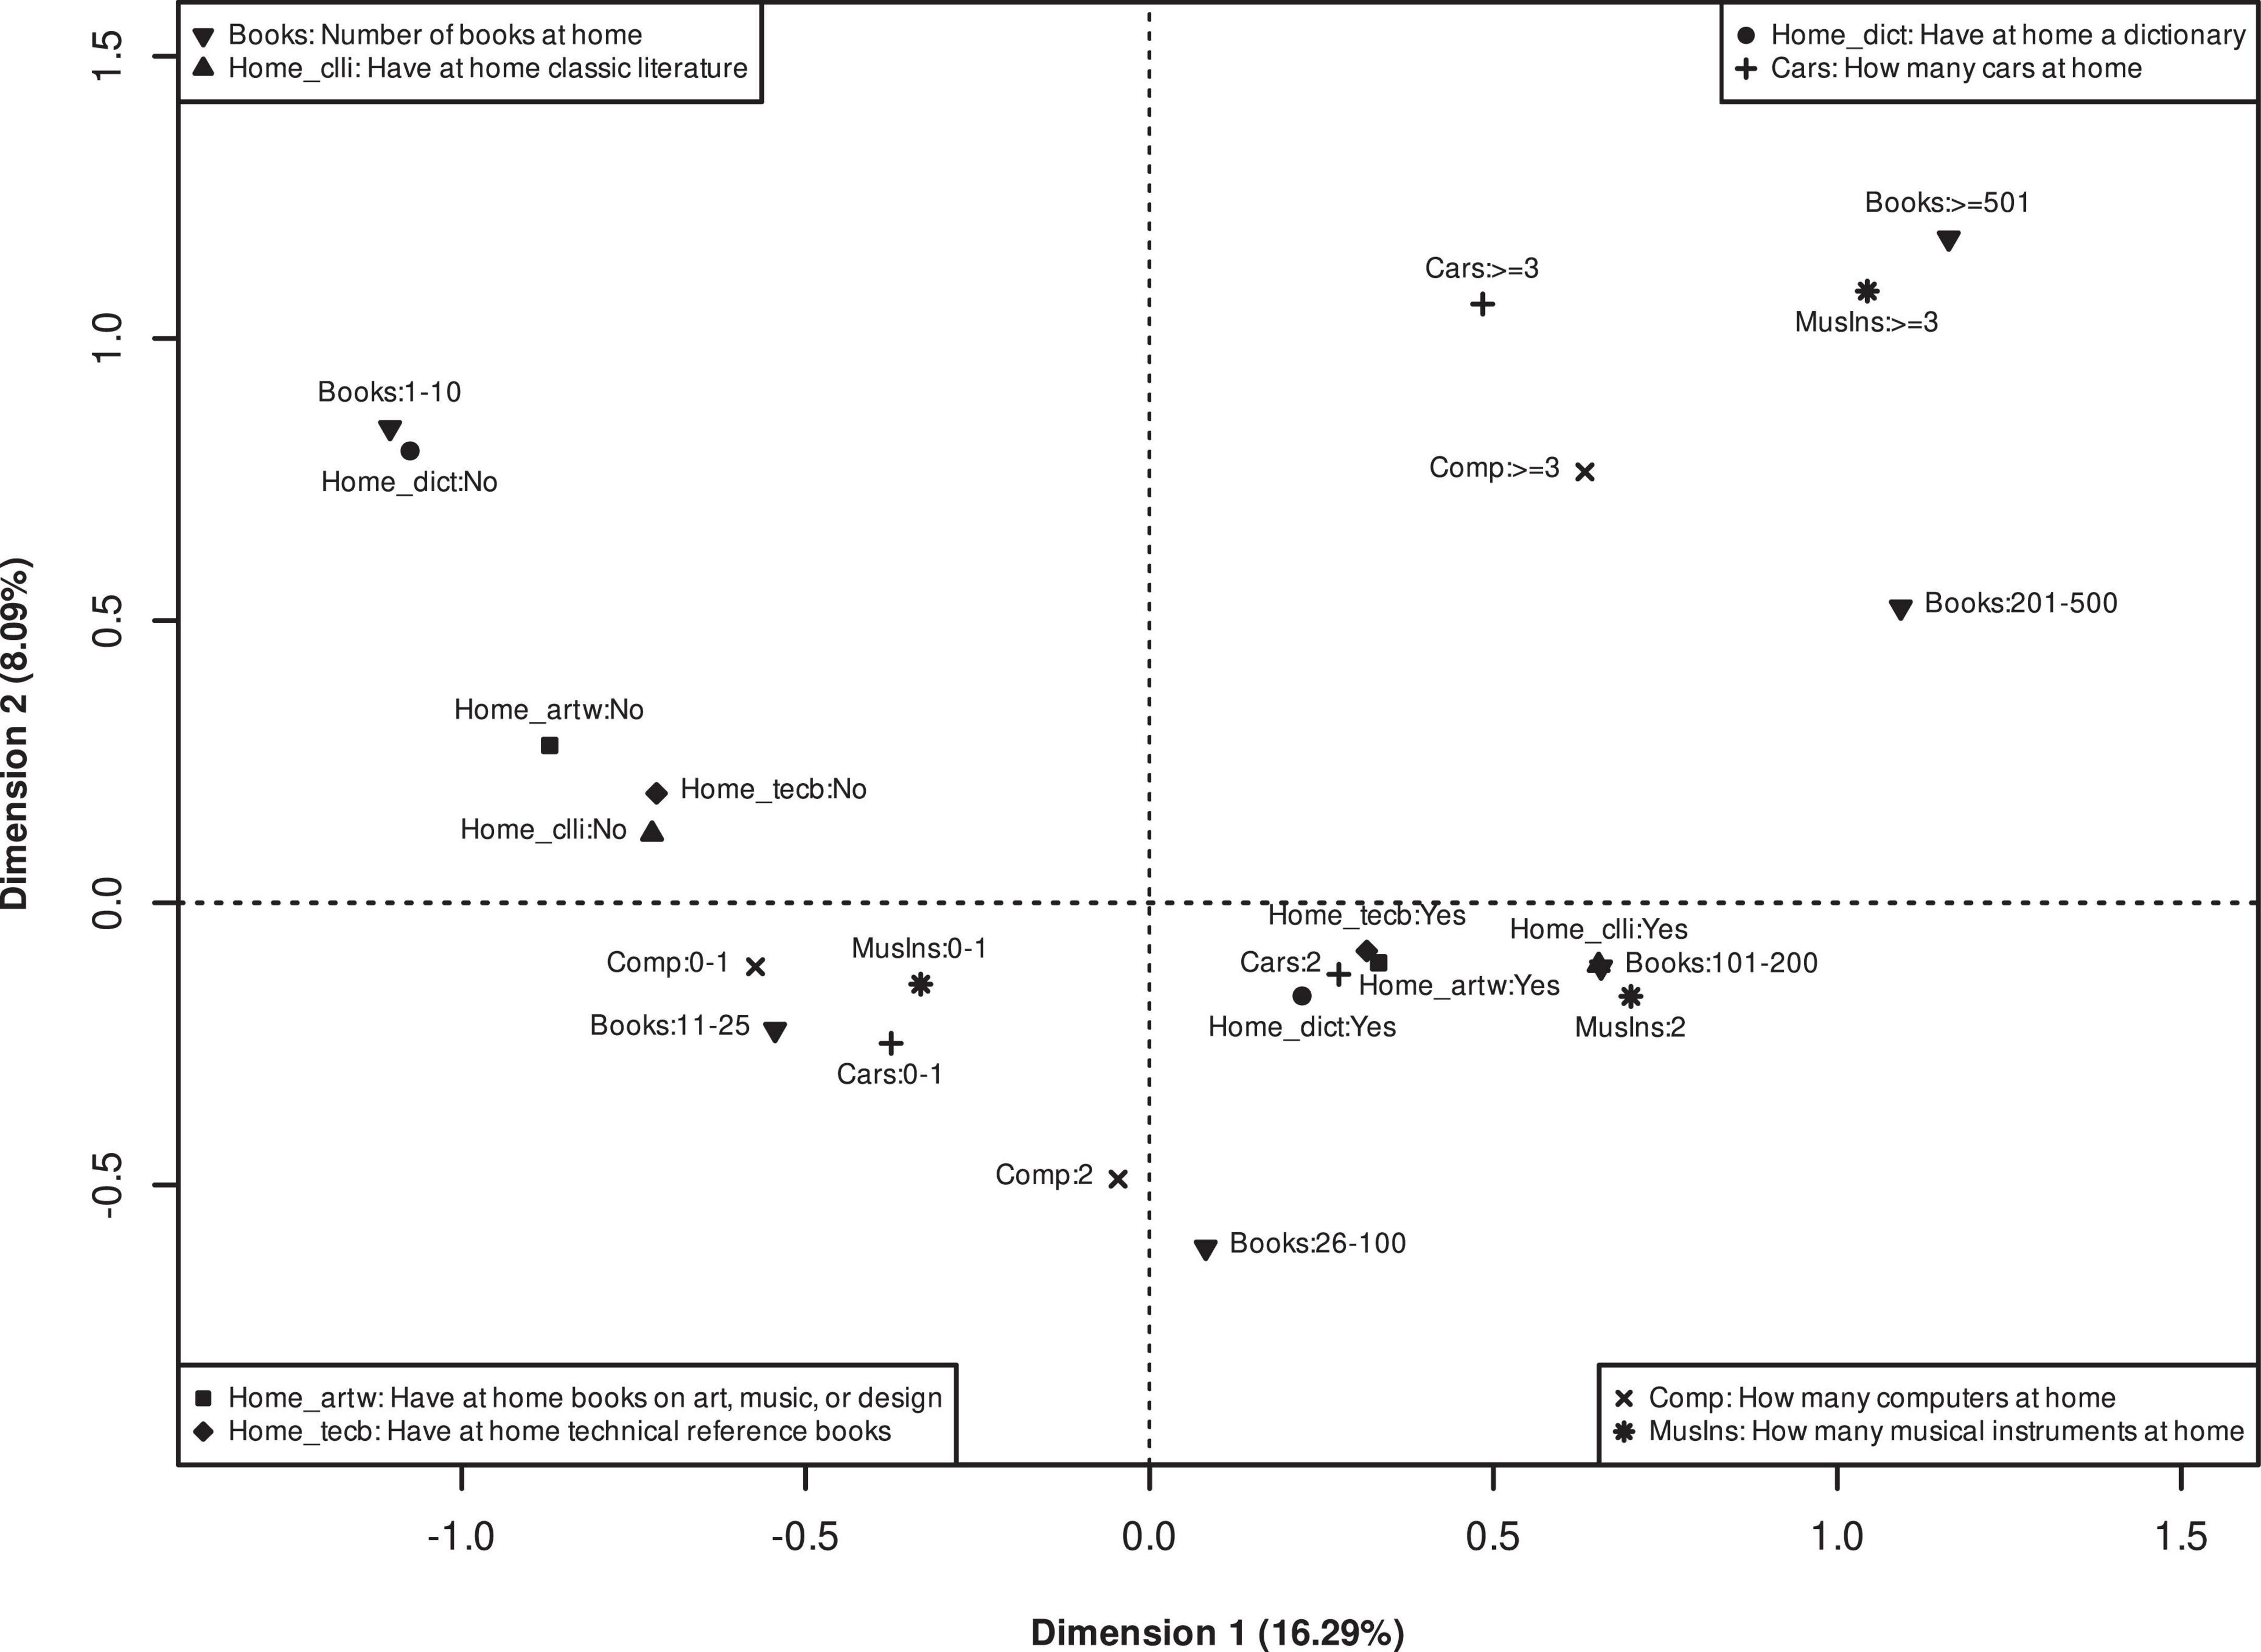
Figure 5. Multiple correspondence analysis solution (indicator matrix approach, principal coordinates) for items measuring home possessions: 2018 PISA data, Lithuania.
However, this solution is also in some ways different from the one obtained analyzing NSSA datasets. Here, binary items seem to be also clustered along the arch, as items of not having dictionaries, artworks, technical reference books and classical literature at home are positioned close to items of having only a few books, computers, cars, or musical instruments at home. The more simple structure of relationship among the home possessions items in the solution is also indicated by lower inertia and percentage of variance explained (8.09%) by the second dimension. Moreover, the distinction between possessions of the economic vs. cultural capital is hardly discernible for the Lithuanian 2018 PISA data.
However, regression analysis of similar set of predictors (unfortunately, variables measuring school related affect are not available in the PISA data) on the second dimension of MCA solutions produced virtually identical results to the ones with NSSA data (see Table 3). Reading abilities are negatively related to the second dimension of MCA solution, and boys load positively on the second dimension (meaning less consistent answer patterns). Therefore, even if the measurement scales of home possessions items and the items themselves are different, the results of MCA are quite similar. Especially, in terms of possible interpretation of the second dimension produced by MCA.
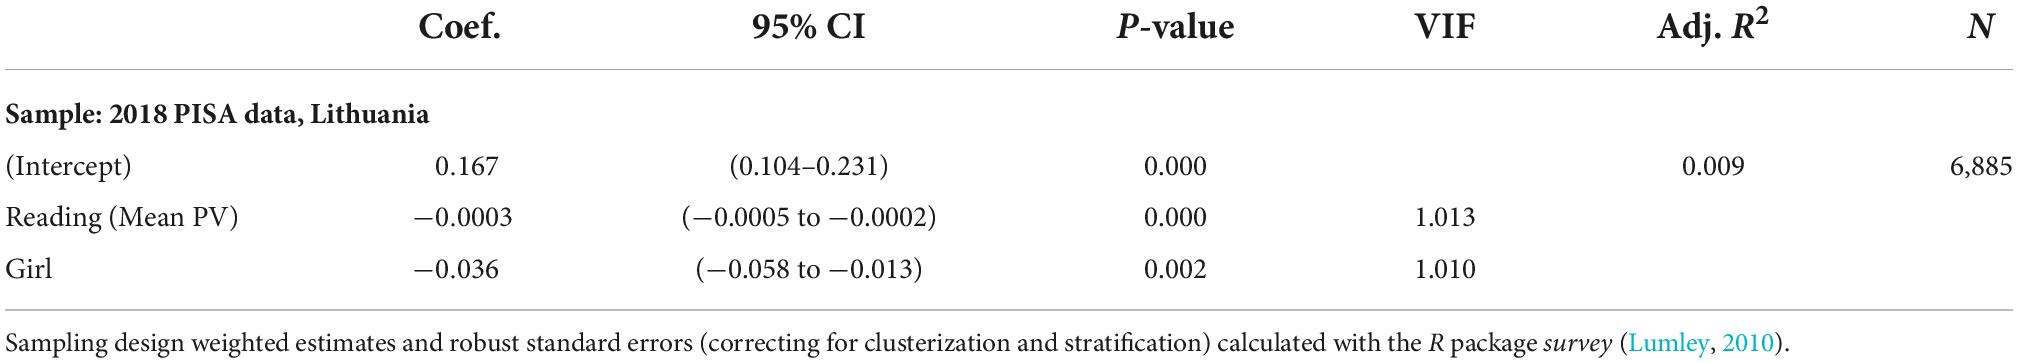
Table 3. Regression results of predictors of the second dimension of the multiple correspondence analysis solution of the Lithuanian 2018 PISA data set.
General discussion and conclusions
This study aimed to assess the dimensionality of home possessions items measuring material, educational and cultural resources of families in educational achievement studies. Employing four samples from the Lithuanian National Survey of Student Achievement and the latest data from the Lithuanian PISA survey (conducted in 2018) we found supporting evidence for the claim that this type of measurement is not uni-dimensional. As different types of resources (material, educational, cultural) are included among the measuring items, it is only natural that their dimensional analysis produces solutions that are at least two-dimensional. These findings corroborate results reported in Eryilmaz et al. (2020), where three types of capital relevant for measuring socio-economic background in adolescent studies – economic, cultural, and social – were identified. Therefore, assumption that home possessions items can be treated as additive expression of family resources (“linear-like” relationship among the items) – very much common in ILSAs (especially, PISA) – is not tenable. Therefore, construction of the scales for measuring students’ SES should take into the account the multi-dimensional nature of home possessions. Importantly, home possessions reflect not only the material ability to acquire certain artifacts, but may also be an expression of value orientations (propensity to not acquire, or acquire, certain items for various ideological, social class-related or cultural reasons). Specifically, while some families may have the resources to acquire any household items, they may have no interest in obtaining cultural or educational items, such as dictionary, journals, works of art/albums or encyclopedia. This may, respectively, contribute to lower academic motivation and performance of children and adolescents growing up in such families, since cultural and educational aspects of family capital are particularly important for the development of cognitive functioning and academic motivation (Goßmann, 2018).
Our analysis also found (at least some) support for the claim that multi-dimensionality of the home possessions items might be related to measurement issues. Previous studies indicated various problems of measuring family wealth (among other measures of adolescents’ SES) that were mostly related to large amounts of missing values and longitudinal inconsistency of answers (as reported in Aarø et al., 2009; Doku et al., 2010; Marks and Pokropek, 2019). In this study we explored cross-sectional inconsistencies of answers, that is, those cases when seemingly similar artifacts are both present and absent at home (for example, there are many books and no dictionary at home). Results of regression analysis of the second dimension of MCA solutions (which reflects these cross-sectionally inconsistent answers) on several explanatory factors revealed that, indeed, cognitive (reading) abilities of students’ and their school-related affect might have influence on how they provided answers in educational testing studies. At least part of them may not clearly understand or know what artifacts are present at home. Another part of them may be reluctant to answer at all and provide careless (random?) answers. These measurement problems should be investigated before constructing additive scales of home possessions items. If the problems are substantial, scale construction procedures might need to be improved. For example, PISA surveys instead of constructing an additive scale from home possessions items might consider performing dimensional analysis (for example, factor analysis for categorical data) and using the first dimension as indicator of family wealth, or, alternatively, apply index-based approaches to assess family wealth (Rutkowski and Rutkowski, 2013).
Finally, further studies of measurement problems in home possessions items used for measuring family wealth in educational achievement surveys should be performed. In our study we used only two indicators – reading abilities and school-related affect – as explanatory factors of inconsistent answers. Better or more relevant indicators, such as, students’ rule-breaking behaviors, school engagement (e.g., cognitive, behavioral) or perceived classroom management practices, might be employed. Straightlining and social desirability when answering home possessions items in adolescents’ studies should also be more carefully explored. Also, cognitive interviewing could be employed to investigate comprehension of the items measuring home possessions among adolescent populations. All in all, there are many little explored methodological problems of measuring home possessions (and family wealth, more generally) that need scholarly attention in order to improve assessment of students’ SES, which is still a very much relevant indicator of educational inequalities.
Limitations
It is important to note that our data comes from the Eastern part of Europe, specifically, the Lithuanian educational context. The results of national assessments and international surveys of educational achievement in Lithuania reveal a number of challenges in academic performance of middle school students. Specifically, recent rounds of PISA assessments point out that Lithuanian 15-year-olds (eighth to nineth grade students) perform below the average of Organisation for Economic Co-operation and Development (OECD) countries (Organisation for Economic Co-operation and Development, [OECD], 2014, 2018, 2019c). National Examination Center (NEC) assessments and surveys show that there is a substantial share of low achieving students and students with learning difficulties (Nacionalinis Egzaminu Centras [NEC], 2015, 2018). Moreover, wide student achievement gaps by gender, place of residence (urban vs. rural), student socio-economic background, and school have been documented (Nacionalinis Egzaminu Centras [NEC], 2018; Organisation for Economic Co-operation and Development, [OECD], 2019c. Thus, the results of data analysis could only be relevant for countries with similar challenging educational context.
Data availability statement
All the data used for analyses in the article are freely available from online platforms (see text footnotes 1, 2).
Author contributions
VM performed the MCA and regression analyses. All authors developed conceptual and theoretical framework of the article, described and interpreted results.
Funding
This study has received funding from European Regional Development Fund (project no. 01.2.2-LMT-K-718-03-0059) under grant agreement with the Research Council of Lithuania (LMTLT).
Conflict of interest
The authors declare that the research was conducted in the absence of any commercial or financial relationships that could be construed as a potential conflict of interest.
Publisher’s note
All claims expressed in this article are solely those of the authors and do not necessarily represent those of their affiliated organizations, or those of the publisher, the editors and the reviewers. Any product that may be evaluated in this article, or claim that may be made by its manufacturer, is not guaranteed or endorsed by the publisher.
Supplementary material
The Supplementary Material for this article can be found online at: https://www.frontiersin.org/articles/10.3389/feduc.2022.1050460/full#supplementary-material
Footnotes
- ^ The NSSA data were collected by the national authorities according to the national legal regulations of Lithuania (Regulations for conducting studies of student achievement, 2008), which include provisions on ethics and confidentiality of the study participants. The data are currently available from the National Agency for Education: www.nsa.smm.lt/stebesenos-ir-vertinimo-departamentas/tyrimai/nacionaliniai-tyrimai/nacionaliniai-mokiniu-pasiekimu-tyrimai-nmpt.
- ^ The data were downloaded from the official PISA website www.oecd.org/pisa/data/2018database in March, 2022.
- ^ Descriptive statistics of all the variables included into the analyses are presented in the Appendices (Supplementary Appendices Table A1).
- ^ Calculated with the function omegah() included into the psych package (Revelle, 2022) of the R statistical software for statistical computing and graphics (R Core Team, 2022).
- ^ Moreover, we used all the separate plausible values for robustness check and analyses with them produced substantially the same results.
- ^ It is important to note that the solutions resulting from all the different methods employed are mathematically identical.
- ^ For comprehensive introduction into MCA, see Le Roux and Rouanet (2004), Le Roux and Rouanet (2009), Greenacre (2017), and Husson et al. (2017).
- ^ Coordinate scores can be variously transformed in order to allow for different types of interpretation.
- ^ Simultaneous portrayal is only possible because the origins of the two spaces (for categories of categorical variables and cases) coincide and the variation (both total and for each separate dimension) is the same.
- ^ Or any other combination of dimensions, if more than two of them are retained in the final solution.
- ^ The regularized version is more appropriate in order to avoid overfitting issues (Josse and Husson, 2016).
- ^ We used senate weights for calculating MCA solution of the Lithuanian PISA (2018) dataset.
- ^ More detailed information on eigenvalues and proportion of variance (inertia) explained for all the MCA solutions is provided in the Appendices (Supplementary Appendices Table A2).
References
Aarø, L. E., Flisher, A. J., Kaaya, S., Onya, H., Namisi, F. S., and Wubs, A. (2009). Parental education as an indicator of socioeconomic status: Improving quality of data by requiring consistency across measurement occasions. Scand. J. Public Health 37, 16–27. doi: 10.1177/1403494808086917
Agasisti, T., and Zoido, P. (2018). Comparing the efficiency of schools through international benchmarking: Results from an empirical analysis of OECD PISA 2012 data. Educ. Res. 47, 352–362. doi: 10.3102/0013189X18777495
Blasius, J., and Greenacre, M. J. (2006). “Correspondence Analysis and Related Methods in Practice,” in Multiple Correspondence Analysis and Related Methods, eds M. Greenacre and J. Blasius (London: Chapman and Hall/CRC Press), 4–40. doi: 10.1201/9781420011319.ch1
Blasius, J., and Thiessen, V. (2006). Assessing Data Quality and Construct Comparability in Cross-National Surveys. Eur. Sociol. Rev. 22, 229–242. doi: 10.1093/esr/jci054
Currie, C., Molcho, M., Boyce, W., Holstein, B., Torsheim, T., and Richter, M. (2008). Researching health inequalities in adolescents: The development of the Health Behaviour in School-Aged Children (HBSC) Family Affluence Scale. Soc. Sci. Med. 66, 1429–1436. doi: 10.1016/j.socscimed.2007.11.024
Delprato, M., and Antequera, G. (2021). School efficiency in low and middle income countries: An analysis based on PISA for development learning survey. Int. J. Educ. Dev. 80:102296. doi: 10.1016/j.ijedudev.2020.102296
Diemer, M. A., Mistry, R. S., Wadsworth, M. E., López, I., and Reimers, F. (2013). Best practices in conceptualizing and measuring social class in psychological research. Anal. Soc. Issues Public Policy 13, 77–113. doi: 10.1111/asap.12001
Doku, D., Koivusilta, L., and Rimpelä, A. (2010). Indicators for Measuring Material Affluence of Adolescents in Health Inequality Research in Developing Countries. Child Indic. Res. 3, 243–260. doi: 10.1007/s12187-009-9045-7
Eccles, J. S., Fredricks, A., and Baay, P. (2015). “Expectancies, values, identities, and self-regulation,” in Self-Regulation in Adolescence, eds G. Oettingen and P. Glwitzer (New York, NY: Cambridge University Press), 31–56. doi: 10.1017/CBO9781139565790.003
Erentaitė, R., Vosylis, R., Sevalneva, D., Melnikė, E., Raižienė, S., and Daukantaitė, D. (2022). Profiles of Achievement Motivation and Performance in Middle School: Links to Student Background and Perceived Classroom Climate. Front. Psychol. 13:820247. doi: 10.3389/fpsyg.2022.820247
Eryilmaz, N., Rivera-Gutiérrez, M., and Sandoval-Hernández, A. (2020). Should different countries participating in PISA interpret socioeconomic background in the same way? A measurement invariance approach. Rev. Iberoam. Educ. 84, 109–133. doi: 10.35362/rie8413981
Filmer, D., and Scott, K. (2008). Assessing Asset Indices (Policy Research Working Paper No. 4605). Washington, DC: World Bank. doi: 10.1596/1813-9450-4605
Fraillon, J., Ainley, J., Schulz, W., Friedman, T., and Duckworth, D. (2020). IEA International Computer and Information Literacy Study 2018 Assessment Framework. Cham: Springer. doi: 10.1007/978-3-030-19389-8
Goßmann, F. (2018). Measuring Cultural Capital in the NEPS (NEPS Survey Paper No. 48). Germany: Natonal Educatonal Panel Study.
Greenacre, M. J. (1984). Theory and Applications of Correspondence Analysis. London: Academic Press.
Greenacre, M. J. (2017). Correspondence Analysis in Practice, 3rd Edn. Milton Park: Francis and Taylor. doi: 10.1201/9781315369983
Grusky, D. (ed.) (2014). Social Stratification: Class, Race, and Gender in Sociological Perspective. New York, NY: Routledge.
Hauser, R. M., and Andrew, M. (2007). Reliability of Student and Parent Reports of Socioeconomic Status in NELS-88. Report. Madison, US: University of Wisconsin-Madison.
Husson, F., Le, S., and Pagčs, P. (2017). Exploratory Multivariate Analysis by Example Using R, 2nd Edn. Boca Raton: CRC Press. doi: 10.1201/b21874
Josse, J., and Husson, F. (2016). missMDA: A Package for Handling Missing Values in Multivariate Data Analysis. J. Stat. Softw. 70, 1–31. doi: 10.18637/jss.v070.i01
Le Roux, B., and Rouanet, H. (2004). Geometric Data Analysis from Correspondence Analysis to Structured Data Analysis. New York, NY: Kluwer Academic Publisher. doi: 10.1007/1-4020-2236-0
Le Roux, B., and Rouanet, H. (2009). Multiple Correspondence Analysis. Thousand Oaks: Sage Publications. doi: 10.4135/9781412993906
Lee, S. S., and von Davier, M. (2020). Improving measurement properties of the PISA home possessions scale through partial invariance modeling. Psychol Test Assess. Model. 62, 55–83.
Long, J. S., and Ervin, L. H. (2000). Using Heteroscedasticity Consistent Standard Errors in the Linear Regression Model. Am. Stat. 54, 217–224. doi: 10.1080/00031305.2000.10474549
Lumley, T. (2010). Complex Surveys: A Guide to Analysis Using R. Hoboken: John Wiley and Sons. doi: 10.1002/9780470580066
Määttä, K., and Uusiautti, S. (2020). Nine Contradictory Observations About Girls’ and Boys’ Upbringing and Education – The Strength-Based Approach as the Way to Eliminate the Gender Gap. Front. Educ. 5, 1–9. doi: 10.3389/feduc.2020.00134
Marks, G. N., and Pokropek, A. (2019). Family income effects on mathematics achievement: Their relative magnitude and causal pathways. Oxf. Rev. Educ. 45, 769–785. doi: 10.1080/03054985.2019.1620717
Mullis, I. V. S., and Martin, M. O. (eds.) (2015). PIRLS 2016 Assessment Framework, 2nd Edn. Boston: TIMSS & PIRLS International Study Center
Nacionalinis Egzaminu Centras [NEC] (2015). 2015 Metų nacionalinio mokinių pasiekimų tyrimo ataskaita. Vilnius: Nacionalinis egzaminų centras.
Nacionalinis Egzaminu Centras [NEC] (2018). 2018 Metų nacionalinio mokinių pasiekimų patikrinimo ataskaita. Vilnius: Nacionalinis egzaminų centras.
Organisation for Economic Co-operation and Development, [OECD] (2014). PISA 2012 Results in Focus. Paris: PISA OECD Publishing.
Organisation for Economic Co-operation and Development, [OECD] (2018). PISA 2015 Results in Focus. Paris: PISA OECD Publishing.
Organisation for Economic Co-operation and Development, [OECD[ (2019a). PISA 2018 Assessment and Analytical Framework. Paris: PISA OECD Publishing.
Organisation for Economic Co-operation and Development, [OECD[ (2019b). PISA 2018 Technical Report. Paris: PISA OECD Publishing.
Organisation for Economic Co-operation and Development, [OECD[ (2019c). PISA 2018 Insights and Interpretations. Paris: PISA OECD Publishing.
Pförtner, T. K., Günther, S., Levin, K. A., Torsheim, T., and Richter, M. (2015). The use of parental occupation in adolescent health surveys. An application of ISCO-based measures of occupational status. J. Epidemiol. Community Health 69, 177–184. doi: 10.1136/jech-2014-204529
R Core Team (2022). R: A language and environment for statistical computing. R Foundation for Statistical Computing. Vienna: R Core Team.
Revelle, W. (2022). psych: Procedures for Personality and Psychological Research. Evanston: Northwestern University Press.
Rutkowski, D., and Rutkowski, L. (2013). Measuring Socioeconomic Background in PISA: One size might not fit all. Res. Comp. Int. Educ. 8, 259–278. doi: 10.2304/rcie.2013.8.3.259
Rutkowski, L., and Rutkowski, D. (2010). Getting It ‘Better’: The importance of improving background questionnaires in international assessment. J. Curric. Stud. 42, 411–430. doi: 10.1080/00220272.2010.487546
Sandoval-Hernández, A., David, R., Matta, T., and Miranda, D. (2019). Back to the drawing board: Can we compare socioeconomic background scales? Rev. Educ. 383, 37–61.
Schulz, W., Carstens, R., Losito, B., and Fraillon, J. (2018). ICCS 2016 Technical Report. Amsterdam: International Association for the Evaluation of Educational Achievement.
Svedberg, P., Nygren, J. M., Staland-Nyman, C., and Nyholm, M. (2016). The validity of socioeconomic status measures among adolescents based on self-reported information about parents occupations, FAS and perceived SES; implication for health related quality of life studies. BMC Med. Res. Methodol. 16:48. doi: 10.1186/s12874-016-0148-9
Torsheim, T., Cavallo, F., Levin, K. A., Schnohr, C., Mazur, J., Niclasen, B., et al. (2016). Psychometric Validation of the Revised Family Affluence Scale: A Latent Variable Approach. Child Indic. Res. 9, 771–784. doi: 10.1007/s12187-015-9339-x
Traynor, A., and Raykov, T. (2013). Household Possessions Indices as Wealth Measures: A Validity Evaluation. Comp. Educ. Rev. 57, 662–688. doi: 10.1086/671423
UNESCO-OREALC (2016). Reporte Técnico Tercer Estudio Regional Comparativo y Explicativo, Terce. Santiago: UNESCO-OREALC.
Van Ewijk, R., and Sleegers, P. (2010). The effect of peer socioeconomic status on student achievement: A meta-analysis. Educ. Res. Rev. 5, 134–150. doi: 10.1016/j.edurev.2010.02.001
Wang, M.-T., and Eccles, J. S. (2011). Adolescent behavioral, emotional, and cognitive engagement trajectories in school and their differential relations to educational success. J. Adolesc. Res. 22, 31–39. doi: 10.1111/j.1532-7795.2011.00753.x
Wardle, J., Robb, K., and Johnson, F. (2002). Assessing socioeconomic status in adolescents: The validity of a home affluence scale. J. Epidemiol. Community Health 56, 595–599. doi: 10.1136/jech.56.8.595
Yin, L., and Fishbein, B. (2020). “Creating and interpreting the TIMSS 2019 context questionnaire scales,” in Methods and Procedures: TIMSS 2019 Technical Report, eds M. O. Martin, M. von Davier, and I. V. S. Mullis (Boston: TIMSS & PIRLS International Study Center), 16.1–16.331.
Zeileis, A. (2006). Object-Oriented Computation of Sandwich Estimators. J. Stat. Softw. 16, 1–16. doi: 10.18637/jss.v016.i09
Keywords: socioeconomic status, home possessions, secondary school students, multiple correspondence analysis (MCA), dimensionality
Citation: Morkevičius V, Erentaitė R and Raižienė S (2022) Measuring family wealth among secondary school students with home possessions indicators: Investigation of dimensionality and measurement problems. Front. Educ. 7:1050460. doi: 10.3389/feduc.2022.1050460
Received: 21 September 2022; Accepted: 03 November 2022;
Published: 23 November 2022.
Edited by:
Aldo Bazán-Ramírez, National University Federico Villareal, PeruReviewed by:
Jorge Ignacio Maluenda-Albornoz, San Sebastián University, ChileEduardo Hernández-Padilla, Universidad Autónoma del Estado de Morelos, Mexico
Copyright © 2022 Morkevičius, Erentaitė and Raižienė. This is an open-access article distributed under the terms of the Creative Commons Attribution License (CC BY). The use, distribution or reproduction in other forums is permitted, provided the original author(s) and the copyright owner(s) are credited and that the original publication in this journal is cited, in accordance with accepted academic practice. No use, distribution or reproduction is permitted which does not comply with these terms.
*Correspondence: Vaidas Morkevičius, dmFpZGFzLm1vcmtldmljaXVzQGt0dS5sdA==
†ORCID: Vaidas Morkevičius, orcid.org/0000-0002-2174-0396; Rasa Erentaitė, orcid.org/0000-0001-7006-637X; Saulė Raižienė, orcid.org/0000-0002-8440-5341