 Burhanettin Ozdemir1*
 Hanan M. AlGhamdi2
- 1Department of Mathematics and Sciences, College of Humanities and Sciences, Prince Sultan University, Riyadh, Saudi Arabia
- 2National Center for Assessment, Education and Training Evaluation Commission (ETEC), Riyadh, Saudi Arabia
The purpose of this study is to examine the distractors of items that exhibit differential item functioning (DIF) across gender to explain the possible sources of DIF in the context of large-scale tests. To this end, two non-linear logistic regression (NLR) models-based DIF methods (three parameters, 3PL-NLR and four-parameter, 4PL-NLR) were first used to detect DIF items, and the Mantel-Haenszel Delta (MH-Delta) DIF method was used to calculate the DIF effect size for each DIF item. Then, the multinomial log-linear regression (MLR) model and 2-PL nested logit model (2PL-NLM) were applied to items exhibiting DIF with moderate and large DIF effect sizes. The ultimate goals are (a) to examine behaviors of distractors across gender and (b) to investigate if distractors have any impact on DIF effects. DIF results of the Art Section of the General Aptitude Test (GAT-ART) based on both 3PL-NLR and 4PL-NLR methods indicate that only 10 DIF items had moderate to large DIF effects sizes. According to MLR differential distractor functioning (DDF) results, all items exhibited DDF across gender except for one item. An interesting finding of this study is that DIF items related to the verbal analogy and context analysis were in favor of female students, while all DIF items related to the reading comprehension subdomain were in favor of male students, which may signal the existence of content specific DIF or true ability difference across gender. DDF results show that distractors have a significant effect on DIF results. Therefore, DDF analysis is suggested along with DIF analysis since it signals the possible causes of DIF.
Introduction
Many types of research have been carried out to determine the validity and reliability of large-scale assessments because the performance of examinees on these tests has a critical impact on their educational admissions and future careers. For that reason, validity is a core feature of any kind of assessment assumed to be accurate and fair (Bond et al., 2003; Jamalzadeh et al., 2021). Therefore, the goal of test developers and testing companies is to increase the validity and reliability of tests by decreasing any types of confounding factors and errors to ensure fairness across different subgroups.
As large-scale tests are used to make high-stakes decisions for test-takers, they require comprehensive and careful examination (Shohamy, 2001; Stobart, 2005; Weir, 2005; Fulcher and Davidson, 2007). Examining the factorial structure of tests, investigating the differential item functioning (DIF) across subgroups, investigating the behavior of distractors, and determining what causes these confounding factors serve the purpose of increasing the validity of and fairness of score inferences. Additionally, the comparison among subgroups, such as gender or nationality groups, on the underlying construct is necessary for fairness purposes.
The fundamental structure that underlies the scale across groups usually requires examination of DIF under the umbrella of confirmatory factor analysis (CFA) and item response theory (IRT) frameworks (Dimitrov, 2017). An item is flagged as exhibiting DIF if students from different subgroups with the same ability level have a different probability of answering an item correctly (Hambleton and Rogers, 1989; Camilli and Shepard, 1994; Fulcher and Davidson, 2013).
DIF analysis has been employed in various contexts concerning different aspects of the test conditions. They are mainly used to investigate the equity and test fairness across gender or race groups, the existence of unfair content concerning the examinees’ background, appropriateness of selection procedures, adequacy of criterion being used, atmosphere effect, and testing conditions (Takala and Kaftandjieva, 2000; Kim, 2001; Pae, 2004; Karami, 2011; Jalili et al., 2020; Walker and Göçer, 2020).
Many different methods are used to detect DIF items (Kim et al., 2007; Loken and Rulison, 2010; Magis and De Boeck, 2011; Kim and Oshima, 2013; Magis, 2013; Magis et al., 2014; Berger and Tutz, 2016; Drabinová and Martinková, 2016; Martinková et al., 2017). Moreover, these methods differ with respect to measurement models and criteria used to define DIF items (Borsboom, 2006; Hambleton, 2006; Millsap, 2006). However, in general, DIF methods are classified into two categories: parametric DIF methods based on IRT models and non-parametric methods based on non-IRT measurement models (Hambleton et al., 1991; Hunter, 2014). Although many different methods to detect DIF exist, it is important to consider the advantages and inadequacies of DIF methods before utilizing them.
DIF items are also grouped as uniform DIF and non-uniform DIF based on a probability distribution of the item characteristic curves (ICCs). An item is said to show uniform DIF if it favors the same group across the entire range of ability, while an item exhibits non-uniform DIF if it favors different groups at different ability levels (Hambleton et al., 1993). An item might be detected as a DIF item; however, one cannot claim that this item is a biased item without investigating the potential underlying cause of DIF. Detection of DIF is based on statistical tests, while bias is related to systematic error, requiring expert opinions and statistical tests (Camilli and Shepard, 1994; Clauser and Mazor, 1998; Wiberg, 2006).
DIF analysis mainly focuses on examining the behavior of the correct response across the subgroups, while DDF is a method of examining the DIF structure of distractors along with the correct responses. The DDF method was first proposed by Green et al. (1989). They compared selection rates of distractors across different groups. Although there are different methods to examine the behavior of distractors, DDF methods, in general, have been classified into two different approaches (Suh and Talley, 2015) that include divide-by-total (Thissen and Steinberg, 1986) and divide-by-distractors (Suh and Bolt, 2011). Wang (2000) developed a DDF method based on the factorial model that examines multiple grouping effects and interactions. Moreover, an odds ratio (OR) based method for DDF effects was proposed by Penfield (2008), and a multi-step logistic regression-based DDF method was proposed by Abedi et al. (2008). Kato et al. (2009) extended the multi-step multinomial logistic regression (MLR) based DDF method, proposed by Abedi et al. (2008), which allows the detection of both DIF and DDF effects. These previously mentioned methods are considered divide-by-total DDF methods. On the other hand, divide-by-distractors methods have been recently developed, such as the likelihood-ratio-based nested logit approach (Suh and Bolt, 2011) and an odds-ratio-based nested logit approach (Terzi and Suh, 2015). These two methods separate key answer parameters from distractor parameters, enabling the evaluation of the DDF effect independent of DIF. Thus, it indicates whether the DDF is a plausible reason or consequence of DIF.
DIF analyses, in general, are integrated with DDF analyses to explain the DIF effects. The relationship between DIF and DDF effects is casual rather than correlational (Deng, 2020; Jamalzadeh et al., 2021). Penfield (2010) found that the DDF effect may cause uniform DIF and partially explained by DDF, whereas non-uniform DIF may indicate the variation of signs within distractors. Moreover, Penfield (2010) suggests that DDF studies can shed light on the possible causes of DIF. Therefore, it is suggested to conduct DDF analysis along with DIF analysis to get more information about potential underlying causes of DIF.
Similar to DIF effects, DDF effects are classified into two groups: uniform and non-uniform DDF. A uniform DDF indicates a constant DDF effect across all distractors in the same direction, while a non-uniform DDF effect indicates an inconsistent DDF effect across different ability levels (Tsaousis et al., 2018). Moreover, a uniform DDF effect signals that DIF occurs due to the characteristics of correct responses, while a non-uniform DDF implies that DIF occurs either because of a non-functioning distractor or an unexpected interaction between distractors or the stem of the item (Penfield, 2008). In this study, the MLR based DDF method proposed by Kato et al. (2009) and multi-group nested logit model (NLM) proposed by Suh and Bolt (2011) were utilized to examine the DDF effects.
General Aptitude Test (GAT)
The general aptitude test (GAT) is a standardized test that has been administered in the Middle East since 2002. The GAT is mainly administered to evaluate the college readiness of high school graduates. The scores obtained from GAT are used to select college candidates during the admission process. The main goal of administering GAT is to measure skills, such as problem-solving, logical relations, and drawing conclusions. Two different versions of GAT, which are Science and Art, were developed based on the students’ majors. The GAT is mandatory for all high-school students who are seeking to pursue a further degree in colleges or universities. It is administered twice a year in a paper-based format and administered year-round in a computer-based format.
Various studies have been conducted to examine the factorial structure and psychometric properties of the GAT, including the validity and reliability of GAT (e.g., Alqataee and Alharbi, 2012; Dimitrov, 2014; Dimitrov and Shamrani, 2015; Sideridis et al., 2015). The test is assumed to be unidimensional, with one dominant factor that explains a large amount of the explained variance. According to a study conducted by Dimitrov and Shamrani (2015), a bifactor model consisting of one general factor along with three verbal factors (reading comprehension, sentence completion, and analogy) fits well to the data.
The Purpose of the Study
This study aims at investigating the behaviors of item distractors that exhibited DIF across gender in the 2017 Art Section of the General Aptitude Test (GAT-ART) administered by the National Center for Assessment (NCA). To this end, first, DIF methods based on two non-linear logistic regressions (three parameters, 3PL-NLR and four parameters, 4 P L-NLR) were used to detect DIF items. Additionally, the Mantel-Haenszel (MH) Delta DIF method was used to calculate the DIF effect size for each DIF item. Then, the multinomial log-linear regression (MLR) model and 2-PL nested logit model (2PL-NLM) were applied to the items exhibiting DIF that have moderate and large effect sizes to investigate both behaviors of distractors across gender and to examine how distractors affect DIF results. Therefore, in this study, the following main research questions were addressed:
1) Which CFA model (one-factor, two-factor, or bifactor models) fits best to the GAT-ART data?
2) Do GAT-ART items function differently across gender groups (female vs. male)?
3) Do GAT-ART items function differently across quantitative and verbal sections?
4) Do the distractors of GAT-ART items function differently across gender groups (female vs. male)?
5) How does the distribution of responses to distractors associated with DIF items affect DIF results?
Methods
Data
The GAT-ART 1521 test was administered to 27,075 high-school students that consist of 22,882 females (84.5%) and 4,191 males (15.5%), and two missing values. The test consists of two domains that are quantitative and verbal, respectively. Among the 96 items of GAT-ART, 24 items belong to the quantitative section and 72 items to the verbal section. The quantitative section consists of four subdomains: arithmetic, geometry, mathematical analysis, and comparison. On the other hand, the verbal section consists of four subdomains: verbal analogy, context analysis, sentence completion, and reading comprehension.
Data Screening
The distribution of missing data was examined before examining the factorial structure of the exam. The results of missing data analysis showed that only 303 out of 27,075 students had missing values larger than 5%. It is suggested to include participants with less than 5% of missing data in the analysis (Alice, 2015; Madley-Dowd et al., 2019). Therefore, examinees with more than 5% of the missing data were treated as outliers and excluded from the data. For the outlier analysis, the Mahalanobis distance method was used. First, Mahalanobis distance for each examinee and criterion for outliers (144.56) were calculated. Those examinees with Mahalanobis distance values greater than criterion value were detected as outliers. The results indicated that all examinees had Mahalanobis distance values smaller than 144.56; therefore, there appeared to be no outliers in this data set.
Statistical testing methods are highly affected by large sample sizes, in which even negligibly small differences turn out to be statistically significant. Therefore, a relatively small sample of GAT-ART data was randomly selected from the entire GAT-ART. Analyses were conducted on the small data set, corresponding to approximately 10% of the entire data set. The 2,500 sample consisted of 2071 (82.8%) females and 429 (17.6%) males.
Statistical Analysis
The factorial structure of the test was first examined with a one factorial confirmatory factor analysis (CFA) to test whether the test is unidimensional. Additionally, a two-factorial CFA model, where each subdomain was considered a factor, and a bifactor model, in which a general factor along with two sub-factors accounts for the variance, were also used to examine the factorial structure of the test. The chi-square statistics, comparative fit index (CFI), Tucker-Lewis index (TLI), and root mean square error of approximation (RMSEA) were used to determine to what extent the data adhered to the model. The Lavaan R-package developed by Rosseel (2012) was used to conduct CFA models. As for the fit criteria, Hu and Bentler (1999) suggested that goodness of fit statistics must satisfy the following criteria for an acceptable fit: RMSEA ≤ 0.06, CFA≥0.95, and TLI≥0. On the other hand, Marsh et al. (2004) suggested less stringent criteria for fit measures (RMSEA ≤ 0.08, CFA 0.90, and TLI≥0.90). Moreover, Muthen and Muthen (2012) suggested reporting weighted root mean square residuals (WRMR) index when the items are categorical. The goodness of fit statistics for each CFA model are provided in Table 1.
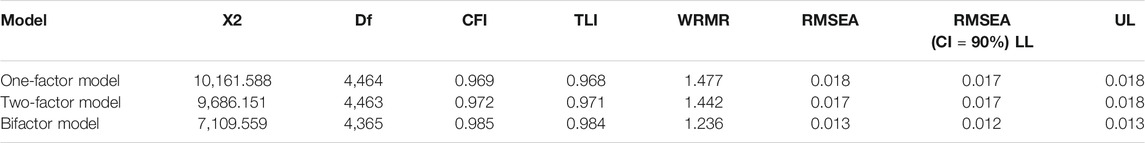
TABLE 1. CFA results related to one-factor, two-factor, and bifactor models of GAT-ART data.
Differential Item Functioning (DIF) and Differential Distractor Functioning (DDF) Methods
Along with IRT-based DIF methods, NLR based DIF methods are used to detect items functioning differently across different subgroups. In this study, DIF analyses were first conducted to detect the items with significant DIF effects with two NLR-based DIF methods (3PL-NLR and 4PL-NLR). Moreover, the Mantel-Hanszel Delta (MH Delta) DIF method was utilized to determine the DIF effect size for each DIF item. The difNLR R-package (Hladka and Martinkova, 2021) was used to conduct NLR-based DIF and DDF analysis, while the DifR R-package (Magis et al., 2010) was used to conduct the MH Delta DIF analyses. Additionally, the Benjamini-Hochberg correction method (Benjamini and Hochberg, 1995) was used as a p-adjustment method that controls the proportion of false detection to increase the accuracy of hypothesis testing results.
Moreover, the item-purification methods were employed along with DIF and DDF analyses to improve the accuracy of the results. Then, the multinomial log-linear regression (MLR) model and 2-PL nested logit model (2PL-NLM) were employed to detect DDF items. The MLR method takes all response categories, including the correct option and distractors, into account, while the NLM excludes the correct option when evaluating the DDF effect. Thus, employing the latter method allows for a determination of whether the significant DDF effect is a potential underlying cause or a consequence of DIF. Besides, the likelihood ratio test of sub-model methods was used to examine distractors’ behaviors across gender groups. The following sections provide more detailed information about DIF and DDF methods employed in this study.
Non-linear Logistic Regression Based DIF Methods
The NLR based DIF methods are considered as an extension of the two-parameter DIF methods proposed by Swaminathan and Rogers (1990). Compared to the traditional logistic regression model, the 3PL-NLR method accounts for guessing, while the 4PL-NLR method accounts for inattention with the guessing behavior of participants. These two methods seem to be more advantageous compared to the other DIF methods since they take these two parameters into account. Drabinová and Martinková (2016) conducted a simulation study which showed that these proposed NLR-based DIF methods yielded sufficient power, low convergence failure rate, and rejection rate compared to the item response theory-based (IRT-based) DIF methods. Therefore, these methods can be considered as a robust alternative to the IRT-based DIF methods.
In the IRT framework, participants from different groups (reference and focal groups) are matched with ability estimates (θ), while in the NLR framework, participants are matched with standardized total scores (z-scores). The formula for 3PL-NLR can be reparametrized in the IRT framework. Therefore, the formula for the 3PL-NLR DIF method is as follows:
where Zj denotes standardized total score, and Gj stands for group membership. The regression parameter bi corresponds to difficulty and ai to discrimination parameters of the ith item. On the other hand, aDIFi and bDIFi represent the difference in both parameters between the focal and reference groups. In this formula, ci stands for guessing parameter, which is equal to the probability of a person with a minimum ability score to answer an item correctly.
A 4PL-NLR is an extension of the three-parameter model that accounts for students’ inattention by adding di inattention parameter. It is simply equivalent to the upper asymptote of the item characteristic curve. The formula for the 4PL-NLR based DIF method is as follows:
where xj denotes the standardized total score of person j, and di and gj parameters denote the inattention parameter and group membership, respectively. Moreover, dDIFi represents the difference in inattention parameters between reference and focal groups. The other parameters are the same as in Formula 1. This study used the 3PL-NLR and 4PL-NLR methods to detect DIF items in the GAT.
Mantel-Haenszel DIF Method
The Mantel-Haenszel (MH) method is one of the most popular non-parametric DIF methods (Holland and Thayer, 1988). It mainly tests the relationship between group membership and response to a particular item given the total score. The MH statistics are calculated from a 2 × 2 contingency table and follow a chi-square distribution where degrees of freedom equal 1. Therefore, an item is flagged as DIF when the calculated MH-statistic is greater than the critical value calculated based on the alpha (α) significance level. An alternative statistic of the MH method is αMH, which is based on odds ratio statistics that provide DIF effect-size measure given by the following formula:
where Tj denotes the total score and Aj and Bj are the total number of the correct and incorrect responses for the reference group, respectively. On the other hand, Cj and Dj denote the total number of correct and incorrect responses for the focal group. Additionally, the logarithm of αMH (log (αMH)) is equal to ∆MH (delta MH), which is of asymptotical normal distribution (see, e.g., Agresti, 1990). This delta statistic is widely used to determine the effect sizes of DIF statistics. The most commonly used criteria for DIF effect size are those proposed by Holland and Thayer (1985) that classify DIF effect size |∆MH| < 1 as negligibly small, 1 < |∆MH|<1.5 as moderate, and |∆MH| > 1.5 as large. They are also known as the ETS-delta scaling (Holland and Thayer, 1988).
Differential Distractor Functioning (DDF)
DDF methods are used to examine the invariance of all responses, rather than just the invariance between correct and incorrect responses (Koon, 2010). In this study, the MLR based DDF method proposed by Kato et al. (2009) and the multi-group NLM based DDF method proposed by Suh and Bolt (2011) were utilized to examine the DDF effects. The MLR calculates the item response category characteristic curves (IRCCs) for each response category that represents the probability of selecting a category of an item given the ability score (z-scores). The calculation process for MLR is based on the comparison of two models. The first model restricts IRCCs of items to be the same across the groups, while the second model allows IRCCs to vary across the groups. The pseudo R2 values obtained from two models were compared to detect items exhibiting DDF. A significant difference in R2 indicates that the corresponding item shows significant DDF. The formula for the IRCCs of the MLR-based DDF method as a function of the standardized total score (z) is as follows:
where z denotes standardized total scores and ak and bk denote logistic regression coefficients that represent the intercept and the slope of IRCCs of a given item, respectively.
Suh and Bolt (2010) proposed a 2PL-NLM that estimates both item parameters for correct response categories and distractor categories. Additionally, they proposed a multi-group extension of the NLM, which allows item parameters to differ across groups. Therefore, the multi-group NLM can detect both DIF and DDF effects at the item level. The following formula calculates the probability of correct response to an item-i given participant-j ability parameter (θj) for multi-group 2PL nested model:
where G denotes group membership and βi and αi represent the intercept and slope parameters of item-i, respectively. Additionally, the formula for the conditional probability of selecting a distractor
Is as Follows
where Zigv (θj) is equal to ζigv + λigv (θj), and the total of distractors’ parameters are set equal to 0 for each group (
The discrepancy between item parameters across different groups is evaluated with the likelihood ratio test. To this end, the first model, in which the parameters of item distractors are constrained to be equal, is compared to the second augmented model in which item parameters of all options, including the correct response and distractors, are estimated. The significant difference in the likelihood ratio test statistics (G2) between the first and second augmented models implies the existence of DDF effect independent of the DIF effect.
Descriptive Statistics and Reliability of GAT-ART Scores
Table 2 provides the reliability coefficients and descriptive statistics related to the entire test and each domain. Additionally, it provides descriptive statistics and reliability coefficients of the GAT-ART for each gender group. The Cronbach’s α and latent variable modeling-based reliability coefficients (composite reliability) were calculated for the entire test and each subsection. The composite reliability coefficient is a reliability coefficient calculated with factor loadings when the test is unidimensional. The composite reliability coefficient yields higher values than Cronbach’s α reliability coefficient when the assumption of essentially tau-equivalence is not met.
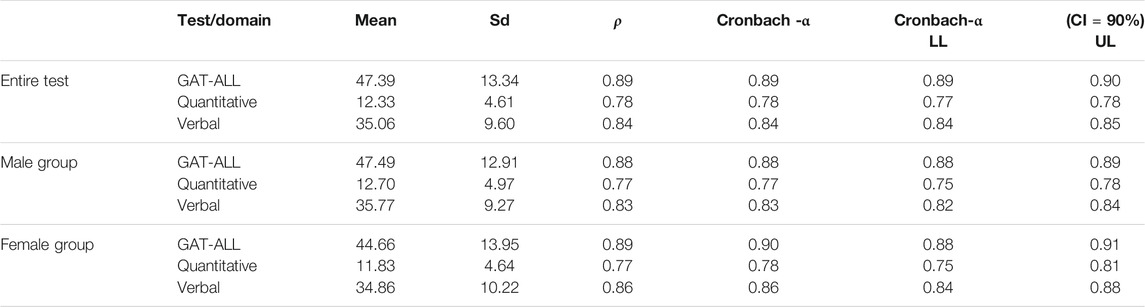
TABLE 2. Descriptive statistics and reliability of GAT-ART scores.
The results in Table 2 show that Cronbach–α coefficient for the entire test is substantially high and equal to 0.89, and it is equal to 0.84 for verbal and 0.78 for quantitative, respectively. Similar results were obtained for each gender group data. The main reason behind the relatively low reliability coefficient for the quantitative domain could be having only 24 items in this section. Additionally, the latent variable modeling-based reliability coefficients and Cronbach–α coefficients were almost identical. These identical reliability coefficients indicate that the essentially tau-equivalence assumption is met for the GAT-ART data. Moreover, the difference in average GAT-ART scores between males and females appears to be not significant at 0.05 significance level (F0.05, 2498 = 3.129, p = 0.077). These results indicate that both groups had similar proficiency levels.
Results
This study mainly consists of three stages. At the first stage, the factorial structure of the test was examined with the one-factorial confirmatory factor analysis (CFA) model, two-factorial CFA model, and bifactor model. DIF analyses were conducted at the second stage to detect items exhibiting DIF across gender groups. At the third stage, DDF analyses were conducted to examine how distractors of these detected DIF items functioned across gender.
Confirmatory Factor Analysis (CFA) Results
The factorial structure of the test was examined with the one-factorial CFA model, two-factorial CFA model, and bifactor model. Fit measures provided in Table 1 were used to determine to what extent data fit the model.
The results associated with different CFA models given in Table 1 show that both comparative fit index (CFI) and Tucker-Lewis index (TLI) fit statistics are higher than 0.95, and root mean square error (RMSEA) values are smaller than 0.06. These results indicate a perfect fit between the data and each CFA model based on Hu and Bentler (1999) criteria. Unlike the other fit indices, the chi-square statistics were statistically significant. This might be due to the large sample size, in which a very minor difference tends to be statistically significant. According to the study conducted by DiStefano et al., (2017), the weighted root mean square residuals (WRMR) index greater than 1 indicates misspecification, and smaller values indicate a better fit. However, less stringent criteria can be applied since items are dichotomously scored and have a relatively limited number of categories (only two categories, 0 and 1). Regardless of the good fit indices related to the bifactor model, many misfitting items were detected when factor loadings were examined. These results suggest that the test can be considered unidimensional, where there is only one factor that underlies participants’ scores. The test can also be considered multidimensional (see, two-factor and bifactor models), in which quantitative and verbal sections are treated as separate factors. Therefore, DIF analyses were conducted assuming that the test is unidimensional, and DIF methods were employed to the entire test regardless of subdomains.
Differential Item Functioning (DIF) Results
The DIF results for the entire test are given in Supplementary Appendix S1A. Items are named with abbreviations in a way that one can easily distinguish which item belongs to which domain. The first column in Supplementary Appendix S1A indicates the item numbers along with abbreviations that represent each domain and subdomain. For the quantitative section, MAR, MGE, MAN, and MCO abbreviations stand for arithmetic, geometry, mathematical analysis, and comparison, respectively. For the verbal section, VAN, VCA, VSC, and VRC abbreviations stand for verbal analogy, context analysis, sentence completion, and reading comprehension, respectively. The other columns present DIF-statistics and p-values obtained from DIF methods. The significance level for detecting DIF items was set at 0.01 with a detection threshold equal to 9.21 to eliminate the sample size effect on the chi-square-based test statistics, which might result in identifying non-DIF items as DIF items.
Table 3 presents items detected as showing DIF by NLR methods. Additionally, the MH-Delta method was utilized to determine the effect sizes of DIF statistics. According to the 3PL-NLR method, 22 out of 96 items were detected as DIF items. Among these DIF items, three items (MAR8, MAR9, MGE4) were quantitative, and the remaining 19 items were verbal. In addition, 4 items were detected as showing non-uniform DIF, and 18 items were detected as showing uniform DIF. Among the uniform DIF items, 10 items were in favor of males, whereas 8 items favored females. According to the MH-Delta method, 5 items were classified in Category A, which indicated a negligibly small DIF effect, while 12 items were classified in Category B with moderate DIF effect, and 5 items were classified in category C with large DIF effect.

TABLE 3. Items detected as DIF with using Mantel-Haensel Delta method.
When the 4PL-NLR method, which accounts for inattention (d-parameter upper asymptote), was used to detect DIF items, the number of items detected as exhibiting DIF decreased from 22 to 14. Among these DIF items, only 2 items (MAR8, MGE4) were quantitative items, and the remaining 12 items were verbal items. In addition, all DIF items exhibited uniform DIF. It is noticeable that all DIF items related to the verbal analogy, context analysis, and sentence completion within the verbal section were in favor of males, while DIF items related to reading comprehension were in favor of females. These results indicate either existence of DIF across gender or signal the content-specific DIF. According to the MH-Delta method, 4 out of these 14 DIF items were classified in Category A, indicating a negligibly small DIF effect, while 7 items were classified in Category B with a moderate DIF effect, and 3 items were classified in Category C with a large DIF effect.
ICCs in Figure 1 depict the probability of a correct response across the entire ability score range for males (reference group) and females (focal group) for the 10 detected DIF items. The circles in the ICC plots represent the counts of standardized total scores, in which a larger size indicates a larger number of test-takers with that given standardized total score. As can be observed from ICCs associated with DIF items, the discrepancy between males’ and females’ ICCs was consistently in favor of one group across the entire ability range, indicating the uniform DIF effects.
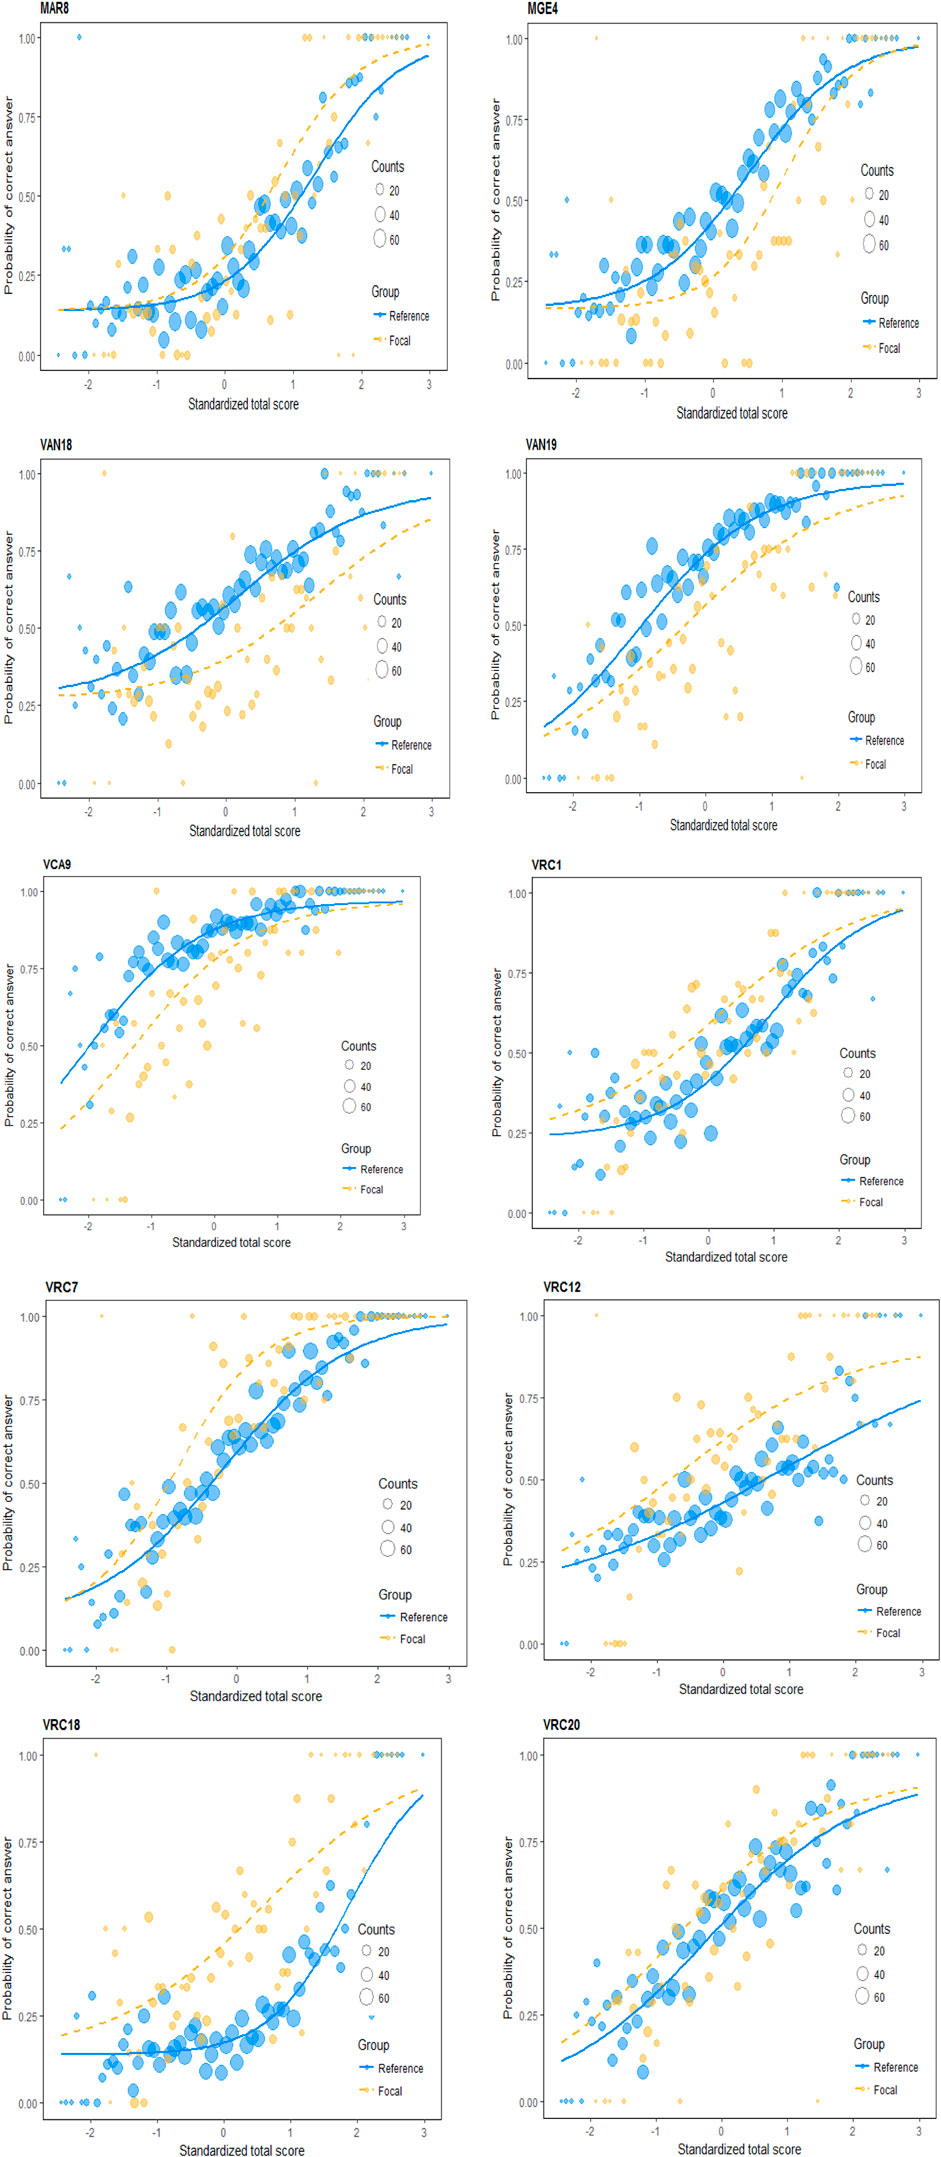
FIGURE 1. ICC associated with DIF items.
Differential Distractor Functioning (DDF) Results
The likelihood ratio statistics based on the MLR and NLM DDF methods were conducted on the 10 DIF items with moderate to large DIF effect sizes. These DIF items were detected by both 3PL-NLR and 4PL-NLR methods. Employing the latter method allows identifying whether DDF is an underlying potential cause or a consequence of DIF. In addition, the likelihood ratio test of sub-model methods was used to examine distractors’ behaviors across gender.
Since the GAT items contain 4 response categories, including the correct response, the corresponding critical values for the NLM method at 0.05 significance level (α = 0.05) and 0.01 significance level (α = 0.01) are 9.49 and 13.28, respectively. Moreover, IRCCs that provide ICCs of both the correct option and distractors were provided. The IRCCs enable observing the distribution of response to the distractor across the entire range of ability scores to inspect both DIF and DDF effects. Along with DIF results, DDF results of each 10 DIF items are provided in Table 4, while IRCCs of DIF items are given in Figure 2. Moreover, it provides the proportion of selecting each item option for both male and female students.
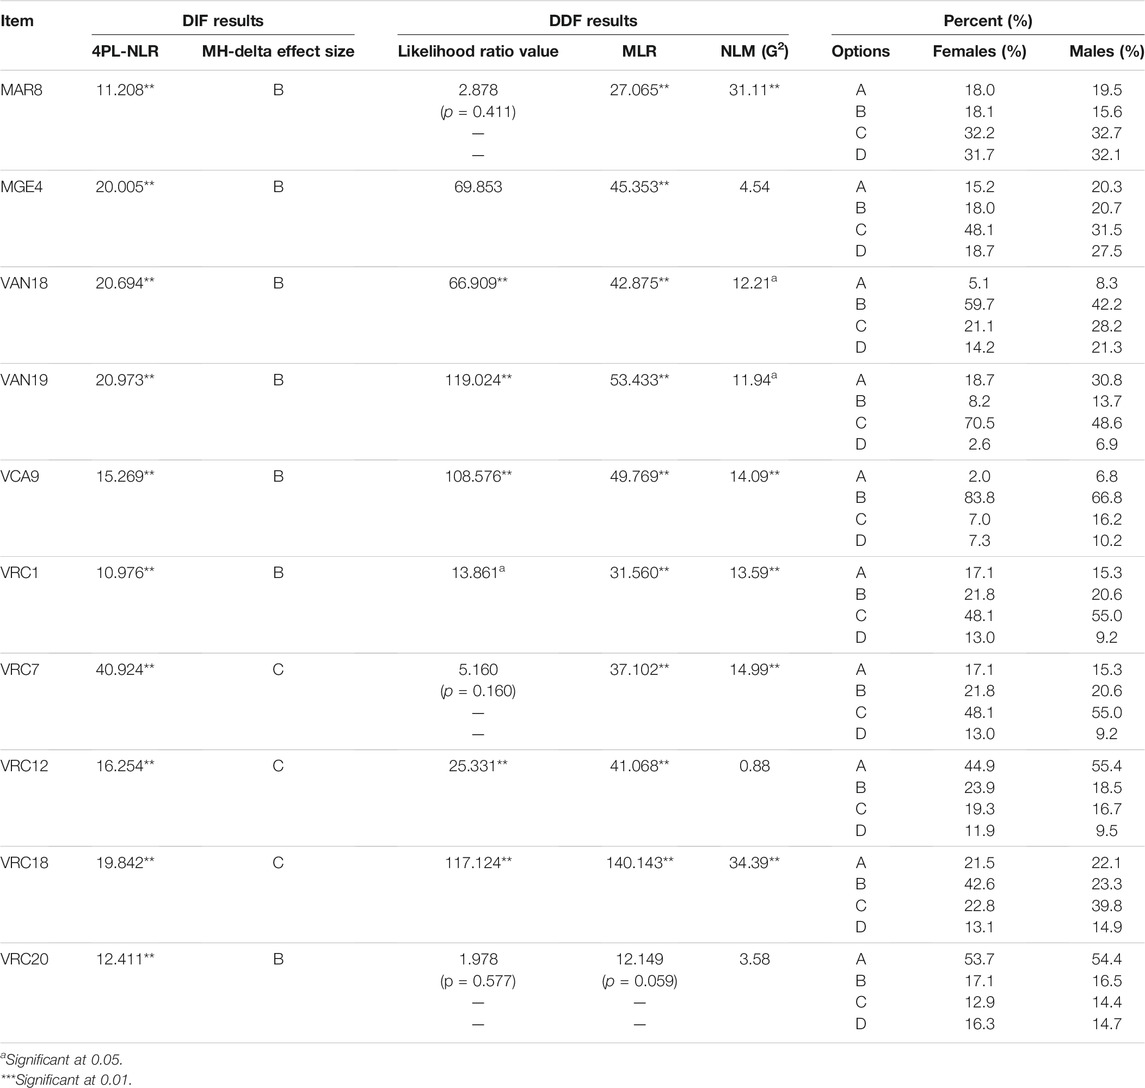
TABLE 4. DDF results of DIF items.
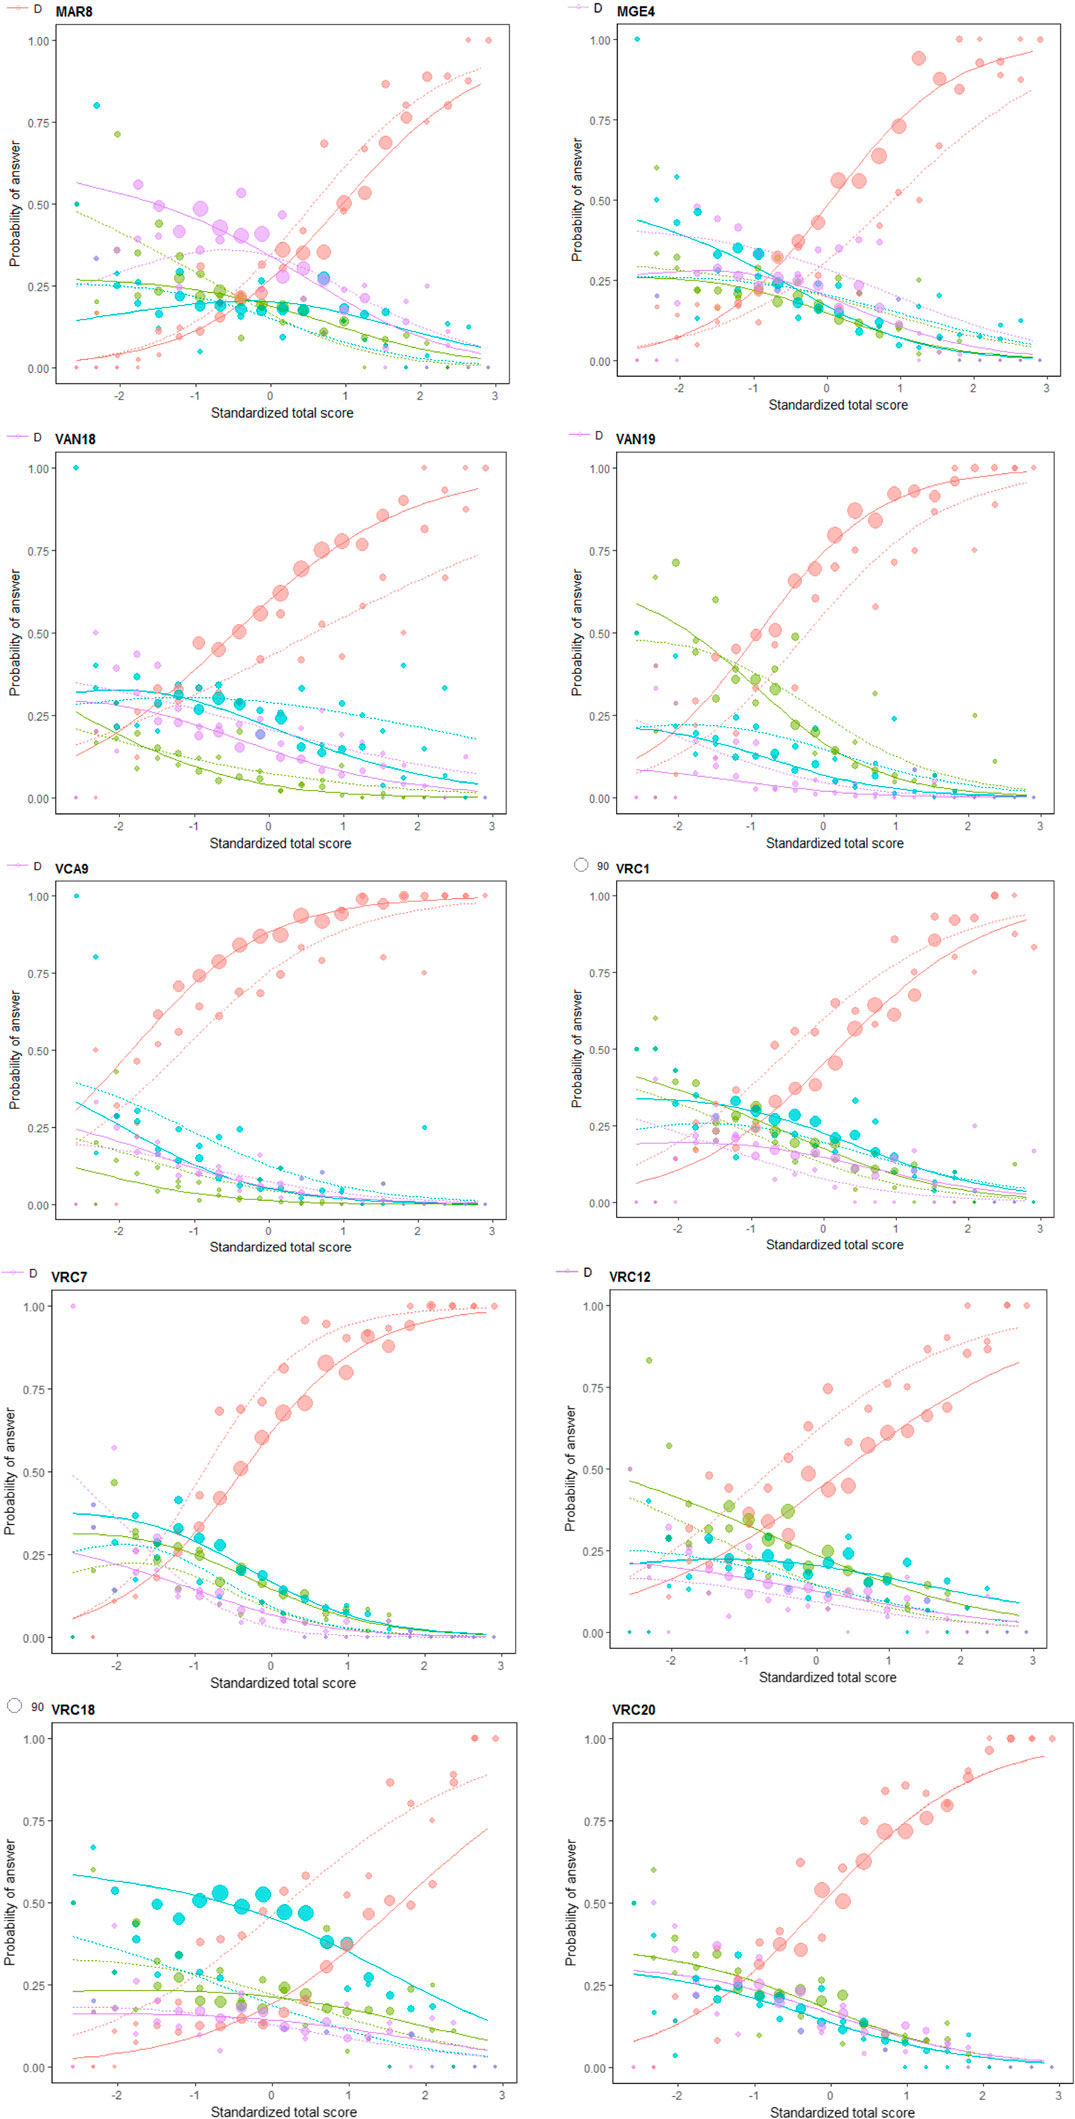
FIGURE 2. Item response characteristic curves (IRCCS) associated with DIF items.
The DDF results in Table 4 indicate that item MAR8, which is associated with the arithmetic subdomain of the quantitative section, exhibited uniform DIF in favor of male students (see Figure 1). Although the correct option of this item was option D, most male and female students selected distractor C. Moreover, both MLR and NLM statistics associated with this item were significant, which indicates the existence of a DDF effect. The significant DDF effect of item MAR8 obtained from the NLM method indicates that distractors function as the potential underlying cause of DIF. As can be observed from Figure 2, the discrepancies between ICCs of distractors also indicate the existence of a significant DDF effect. Moreover, distractor C functioned differently than expected. Therefore, the DDF effect of distractor C might have caused DIF rather than the stem of the items or the correct option (Penfield, 2010).
The results related to item MGE4 in the quantitative section indicate that it exhibited uniform DIF with a moderate effect size in favor of females. However, the selection proportion for each distractor was higher for males than females. Unlike the significant DDF effect obtained from the MLR method, the NLM DDF effect was not statistically significant, which indicates that distractors might not be contributing to the DIF effect. Thus, the non-significant DDF result implies that either stem or correct option is likely to be the potential underlying cause of DIF.
When it comes to the DIF and DDF results of the analogy subdomain of the verbal section, both item VAN18 and item VAN19 showed uniform DIF with a moderate effect size in favor of females (see Table 4). The selection proportion of each distractor for males was higher compared to females, which indicates the existence of the DDF effect for male students. Moreover, both MLR and NLM statistics were statistically significant, indicating the existence of the DDF effect for both items. The significant DDF effect of the NLM method indicates that distractors functioned as the potential underlying cause of DIF. However, these DDF effects were non-uniform, implying that distractors functioned differently across gender groups. Moreover, distractor A was less likely to be selected by both gender groups for item VAN18. Additionally, there was a substantial difference in the selection proportions of distractor A between males and females for item VAN19. Therefore, these results indicate that the DDF effect might have caused the DIF along with the correct option rather than the stem of the items.
There is only one item (VCA9) detected as exhibiting DIF in the context domain of the verbal section. The results indicate that item VCA9 exhibited uniform DIF with a moderate effect size in favor of females. On the other hand, the selection proportion of each distractor for males was higher compared to females. Moreover, both MLR and NLM statistics were significant, indicating the existence of a DDF effect. The significant DDF effect of VCA9 obtained from the NLM method indicates that the distractors functioned as a potential cause of DIF, and the associated DDF effect was uniform indicating the consistent DFF effect across the entire ability range. Additionally, distractor A was less likely to be selected by both gender groups compared to the other distractors. Therefore, the DDF effect of distractors might have caused DIF rather than the stem of the item.
Unlike the other domains, the reading comprehension domain had the highest total number of items detected as DIF (5 items). Results indicate that all DIF items in the reading comprehension section (VRC1, VRC7, VRC12, VRC18, and VRC20) exhibited uniform DIF in favor of females (see Figure 1). Moreover, both MLR and NLM statistics were significant for VRC1, VRC7, and VRC18, which indicate the existence of significant DDF effects. The significant DDF effects of these three items obtained from the NLM method indicate that the distractors might have caused DIF effects rather than the stem of the items or the correct option. Additionally, unlike the other DDF items, the log-likelihood ratio statistic was not significant for item VRC7, which indicates that column proportions of distractors remained the same across gender groups. On the other hand, for item VRC12, the MLR DDF statistic was significant, while the NLM statistic was not. Among all these 10 DIF items, only item VRC20 had a non-significant DDF effect. The non-significant DDF effect obtained from NLM indicates that distractors did not function differently when the responses to the correct option were excluded. Therefore, the correct option might have caused DIF rather than the stem of the items for item VR12 and item VR20.
Conclusion and Discussion
The objective of this study is to detect items that exhibit DIF across gender groups and to examine the DIF items with DDF methods in order to define possible sources of DIF effects. For this purpose, first, DIF analyses were conducted with two non-linear logistic regression-based DIF methods (3PL-NLR and 4PL-NLR) to detect the items that have significant DIF effects. Moreover, the MH-Delta DIF method was utilized to determine the effect size of the DIF statistics for each DIF item. Second, the MLR method, NLM, and likelihood ratio test of sub-model methods were used to detect DDF items and examine item distractors’ behaviors across gender groups. The MLR method is classified as a divide-by-total method, which evaluates both DIF and DDF effects simultaneously, while the NLM is classified as a divide-by-distractor method, which evaluates the DDF effect independent of DIF and, therefore, determines whether item distractors contributed or caused DIF.
DIF results of the GAT-ART show that 22 out of 96 items were flagged as exhibiting DIF by the 3PL-NLR method. However, the number of DIF items decreased from 22 to 14 when the 4PL-NLR DIF method, which accounts for the inattention of students, was applied. All these 14 DIF items detected by the 4PL-NLR DIF method exhibited uniform DIF. According to the effect-size results of the MH-Delta DIF method, 4 out of the 14 DIF items had negligibly small DIF effect, 7 items had moderate DIF effect, and 3 items had large DIF effect. When DIF results of 3PL-NLR, 4PL-NLR, and MH-Delta methods were compared, only 10 items were detected as DIF items with moderate to large DIF effect sizes. All these 10 items exhibited uniform DIF. The other 4 items with negligibly small DIF effect sizes were excluded from DDF analyses. In general, DDF methods are employed to determine the potential causes of DIF or to investigate if options function differently (Schmitt and Dorans, 1990; Banks, 2009; Penfield, 2010; Suh and Bolt, 2011; Suh and Talley, 2015; Park, 2017). Therefore, DDF analyses were conducted on these 10 items to provide insight into the behavior of item distractors and their effects on DIF results.
For the results of DDF analyses, MLR DDF results indicate that all DIF items exhibited DDF across gender except for item VRC20 (pddf = 0.059), which had a moderate DIF effect size and was in favor of females. According to the NLM method, 7 DIF items showed significant DDF, while the other 3 DIF items (MGE4, VRC12, and VRC20) did not exhibit DDF. The non-significant DDF results obtained from the NLM method indicate that the distractors did not contribute to the DIF effect and, thus, the stem or correct option might have caused DIF for these 3 items. The significant DDF effects of the other 7 items showed that distractors either contributed to the DIF effect or were the potential cause of the DIF.
When the DDF results obtained from the MLR and NLR methods were compared, there were only 2 items (MGE4 and VRC12) that had significant DDF effects according to the MLR, while the DDF effects of these items were not significant according to the NLM method. Therefore, for these 2 items, a significant DDF effect obtained from the divide-by-total method signals that the DDF effects of these items are a consequence of DIF rather than the cause (Suh and Bolt, 2011).
Regarding the DIF and DDF results related to each section, 2 items were related to the verbal analogy (VAN18, VAN19), 1 item was related to the context analysis (VCA9), and 5 items were related to reading comprehension (VRC1, VRC7, VRC12, VRC18, VRC20) subdomains for the verbal section. The results of DDF analyses related to the reading comprehension subdomain reveal that all DIF items associated with the reading comprehension domain exhibited uniform DIF in favor of females. Moreover, 2 items (VRC1 and VRC7) showed DDF in which the DDF effect of distractors might have caused DIF rather than the stem of the items. However, unlike the other items related to reading comprehension, two items (VRC12 and VRC20) showed no significant DDF effects but only significant DIF effects. Thus, for these two items, either the correct option or the stem of items are the potential cause of the DIF rather than distractors.
One of the interesting outcomes of this study is that all items showing DIF related to the verbal analogy, context analysis, and sentence completion subdomains of verbal sections were in favor of male students, while all DIF items related to reading comprehension were in favor of female students. These results may either reflect the DIF across gender or signal the content-specific DIF. As stated in a study conducted by Gómez-Benito and others (2018), DIF might occur due to the existence of items with specific characteristics in common, such as being related to the same content (American Educational Research Association, American Psychological Association and National Council on Measurement in Education, 2014). These findings require further investigations and need to be supported by the literature review. Along with conducting DDF analysis, an alternative approach to validate DIF results could be using a mixed-methods approach that integrates both qualitative and quantitative methods (Creswell, 2015). For instance, Benítez et al. (2016) investigated DIF items in PISA 2006 with subject matter experts to define the potential source of the DIF. Likewise, Maddox et al. (2015) compared DIF results with an ethnographic transcript to determine the way that students dealt with items in literacy tests (Gómez-Benito et al., 2018).
Overall, the significant DDF effects obtained from the divide-by-total method (MLR) indicate that the DDF effects of these items are a consequence of DIF rather than the cause (Suh and Bolt, 2011). Additionally, the significant NLR-based DDF effect implies that the DDF effects of distractors might have caused DIF rather than the stem of the items or the correct options (Penfield, 2010). For such cases, it is suggested to either revise the item distractors to eliminate the DIF effect or exclude the items from the test. On the other hand, the non-significant DDF results obtained from the NLM method indicate that item distractors did not contribute to the DIF effect and, thus, the stem or correct option might have caused DIF. The detailed investigation of the distractors of the items with significant DDF effects also reveals that some distractors were more likely to be selected, while some distractors were less likely to be selected (see MAR8 and VCA9, VRC18). The discrepancy between ICCs of these distractors also indicates the existence of the DDF effect since these distractors functioned differently than expected.
The Implication of This Study
Examining the role of the distractors in DIF and the effect of the distractor on test bias through DDF analysis have caught a lot of practitioners’ attention in the last few decades (Green et al., 1989; Jalili et al., 2020; Martinková et al., 2017; Middleton and Laitusis, 2007; Tsaousis et al., 2018, among others). However, there are very few studies that have employed divide-by-distractor and divide-by-total DDF approaches together to determine the effect of distractors on DIF results and to determine the potential source of DIF. Therefore, this study is believed to make a significant contribution to the existing literature in this regard.
The other aspect of this study that makes it unique compared to the other studies is that it utilizes a 4PL-NLR method-based DIF approach, which is assumed to eliminate the inattention effect on estimated item parameters. The main characteristic of the 4PL model is that it provides a non-zero chance of incorrect response to an item for high-performing students. Rulison and Loken (2009) showed that the effect of early mistakes made by students with high ability levels because of stress and carelessness could be reduced. Therefore, ability estimation bias could be decreased by the 4PL model (Magis, 2013).
Deng (2020) claims that there is no evidence of the existence of the DDF effect without DIF. Therefore, DDF analysis is conducted after DIF analysis to provide more insight into the potential sources of the significant DIF effects. Likewise, Kato et al. (2009) have stated that DDF analysis is used as a supplementary analysis that plays a secondary role in studying test fairness and provides important information about the potential underlying causes or the sources of the DIF effect.
DDF analyses can also be used to investigate the perception of items, understand stimuli-attracts, and determine the cognitive steps across different subgroups. Additionally, it can be employed to understand the differences in cognitive processes used to respond to an item across the subgroups for achievement tests (Park, 2017). In this study, DIF and DDF effects were examined in terms of group differences and attributes being measured. However, there might be some other factors that are not directly related to the content being measured, such as differences in teaching practices, teaching environment, and socioeconomic status, that contribute to the unexpected differences in responding behavior (Zumbo, 2007; Park, 2017). These factors are listed under the third generation of DIF studies by Zumbo (2007). Therefore, it is suggested to use both DIF and DDF methods within different contexts, including other factors, to provide more insight into the potential sources of the DIF and DDF effects.
Overall, it is suggested to examine DDF along with DIF (e.g., Penfield, 2008, 2010; Suh and Bolt, 2011; Suh and Talley, 2015; Terzi and Suh, 2015). Examining both phenomena provides more accurate information about correct response and behaviors of the item distractors during the test development process. Moreover, studying DIF and DDF also provides insight into whether DDF occurs due to DIF in the correct option, or DIF occurs due to the significant DDF effects.
Data Availability Statement
The datasets presented in this article are not readily available because the data owner is the National Center for Assessment (NCA, KSA). Therefore, the data can be shared with the approval of NCA. Requests to access the datasets should be directed to research@etec.gov.sa.
Author Contributions
BO conducted a research project and drafted the manuscript. HA provided critical revisions. Both authors approved the final version of the manuscript for submission.
Conflict of Interest
The authors declare that the research was conducted in the absence of any commercial or financial relationships that could be construed as a potential conflict of interest.
Publisher’s Note
All claims expressed in this article are solely those of the authors and do not necessarily represent those of their affiliated organizations, or those of the publisher, the editors and the reviewers. Any product that may be evaluated in this article, or claim that may be made by its manufacturer, is not guaranteed or endorsed by the publisher.
Acknowledgments
A part of the study has been submitted to National Center for Assessment (NCA) as a research project titled “Examining Differential Distractor Functioning of GAT-ART Items with Non-Linear Logistic Regression Models.” I would like to thank Abdullah Al-Qatee for his continued support throughout this project. I would also like to thank Khaleel Alharbi for providing research data.
Supplementary Material
The Supplementary Material for this article can be found online at: https://www.frontiersin.org/articles/10.3389/feduc.2021.748884/full#supplementary-material
References
Abedi, J., Leon, S., and Kao, J. C. (2008). Examining Differential Distractor Functioning in reading Assessments for Students with Disabilities (CRESST Tech. Rep. No. 743. Los Angeles, CAStandards, and Student Testing: National Center for Research on Evaluation.
Agresti, A. (1990). Categorical Data Analysis. New York: John Wiley and Sons. doi:10.1002/0471249688
Alice, M. (2015). Imputing Missing Data With R; MICE Package. Available at: https://www.r-bloggers.com/imputing-missing-data-with-r-mice-package/.
Alqataee, A. A., and Alharbi, K. A. (2012). The Ability of Admission Criteria to Predict the First-Year College Grade point Average in Some Saudi Universities (Technical Report No. TR009-2012). Riyadh, Saudi Arabia: The National Center for Assessment in Higher Education.
American Educational Research Association, American Psychological Association and National Council on Measurement in Education (2014). Standards for Educational and Psychological Testing. Washington, DC: American Educational Research Association.
Banks, K. (2009). Using DDF in a Post Hoc Analysis to Understand Sources of DIF. Educ. Assess. 14 (2), 103–118. doi:10.1080/10627190903035229
Benítez, I., Padilla, J.-L., Hidalgo Montesinos, M. D., and Sireci, S. G. (2016). Using Mixed Methods to Interpret Differential Item Functioning. Appl. Meas. Education. 29 (1), 1–16. doi:10.1080/08957347.2015.1102915
Benjamini, Y., and Hochberg, Y. (1995). Controlling the False Discovery Rate: A Practical and Powerful Approach to Multiple Testing. J. R. Stat. Soc. Ser. B (Methodological). 57 (1), 289–300. doi:10.2307/2346101
Berger, M., and Tutz, G. (2016). Detection of Uniform and Non-Uniform Differential Item Functioning by Item Focused Trees. J. Educ. Behav. Stat. 41 (6), 2016. doi:10.3102/1076998616659371
Bond, T., Fulcher, G., and Davidson, F. (2003). Validity and Assessment: A Rasch Measurement perspectiveLanguage Testing and Assessment. Metodoliga de Las Ciencias Del. Comportamentoroutledge. 5 (2), 179–194.
Borsboom, D. (2006). When Does Measurement Invariance Matter? Med. Care. 44 (11Suppl. 3), S176–S181. doi:10.1097/01.mlr.0000245143.08679.cc
Camilli, G., and Shepard, L. (1994). Methods for Identifying Biased Test Items. Thousand Oaks, CA: Sage publications.
Clauser, B., and Mazor, K. (1998). Using Statistical Procedures to Identify Differentially Functioning Test Items. Educ. Meas. Issues Pract. 17 (1), 31–44. doi:10.1111/j.1745-3992.1998.tb00619.x
Creswell, J. W. (2015). A Concise Introduction to Mixed Methods Research. Thousand Oaks, CA: Sage Publications.
Deng, J. (2020). The Relationship between Differential Distractor Functioning (DDF) and Differential Item Functioning (DIF): If DDF Occurs, Must DIF Occur? Lawrence, KS: Doctoral dissertation, University of Kansas.
Dimitrov, D. M. (2014). Testing for Unidimensionality of GAT Data. (Technical Report: TR029-2013). Riyadh, KSA: National Center for Assessment in Higher Education.
Dimitrov, D. M., and Shamrani, A. R. (2015). Psychometric Features of the General Aptitude Test–Verbal Part (GAT-V) Meas. Eval. Couns. Dev. 48 (2), 79–94. doi:10.1177/0748175614563317
Dimitrov, D. M. (2017). Examining Differential Item Functioning: IRT-Based Detection in the Framework of Confirmatory Factor Analysis Meas. Eval. Couns. Dev. 50 (3), 183–200. doi:10.1080/07481756.2017.1320946
DiStefano, C., Liu, J., Jiang, N., and Shi, D. (2017). Examination of the Weighted Root Mean Square Residual: Evidence for Trustworthiness? Struct. Equation Model. A Multidisciplinary J. 25 (3), 453–466. doi:10.1080/10705511.2017.1390394
Drabinová, A., and Martinková, P. (2016). Detection of Differential Item Functioning with Non-linear Regression: Non-IRT Approach Accounting for Guessing. (Technical report No. V1229). Institute of Computer Science the Czech Academy of Sciences.
Fulcher, G., and Davidson, F. (2013). The Routledge Handbook of Language Testing. Abingdon, UK: Routledge. doi:10.4324/9780203181287
Gómez-Benito, J., Sireci, S., Padilla, J. L., Hidalgo, M. D., and Benítez, I. (2018). Differential Item Functioning: Beyond Validity Evidence Based on Internal Structure. Psicothema. 30 (1), 104–109. doi:10.7334/psicothema2017.183
Green, B. F., Crone, C. R., and Folk, V. G. (1989). A Method for Studying Differential Distractor Functioning. J. Educ. Meas. 26 (2), 147–160. doi:10.1111/j.1745-3984.1989.tb00325.x
Hambleton, R. K. (2006). Good Practices for Identifying Differential Item Functioning. Med. Care. 44 (11), S182–S188. doi:10.1097/01.mlr.0000245443.86671.c4
Hambleton, R. K., Clauser, B. E., Mazor, K. M., and Jones, R. W. (1993). Advances in the Detection of Differentially Functioning Test Items. Eur. J. Psychol. Assess. 9, 1–18.
Hambleton, R. K., and Rogers, H. J. (1989). Detecting Potentially Biased Test Items: Comparison of IRT Area and Mantel-Haenszel Methods. Appl. Meas. Education. 2 (4), 313–334. doi:10.1207/s15324818ame0204_4
Hambleton, R. K., Swaminathan, H., and Rogers, H. J. (1991). Fundamentals of Item Response Theory. Newbury Park. Calif: Sage Publications.
Hladka, A., and Martinkova, P. (2021). difNLR: DIF and DDF Detection by Non-linear Regression Models. R package version 1.3.7, Available at: https://CRAN.R-project.org/package=difNLR.
Holland, P. W., and Thayer, D. T. (1985). An Alternate Definition of the ETS delta Scale of Item Difficulty (Research Report RR-85-43). Princeton, NJ: Educational Testing Service.
Holland, P. W., and Thayer, D. T. (1988). “Differential item performance and the Mantel-Haenszel procedure,” in Test. Validity. Editors H. Wainer, and H. I. Braun (Lawrence: Lawrence Erlbaum Associates), Inc., 129–145.
Hu, L. t., and Bentler, P. M. (1999). Cutoff Criteria for Fit Indexes in Covariance Structure Analysis: Conventional Criteria versus New Alternatives. Struct. Equation Model. A Multidisciplinary J. 6, 1–55. doi:10.1080/10705519909540118
Hunter, C. (2014). A Simulation Study Comparing Two Methods of Evaluating Differential Test Functioning (DTF): DFIT and the Mantel-Haenszel/Liu-Agresti Variance. Atlanta, GA: Unpublished Doctoral Dissertation, Georgia State University.
Jalili, T., Barati, H., and Moein Zadeh, A. (2020). Using Multiple-Variable Matching to Identify EFL Ecological Sources of Differential Item Functioning. J. Teach. Lang. Skills. 38 (4), 1–42. doi:10.22099/jtls.2020.36702.2794
Jamalzadeh, M., Lotfi, A. R., and Rostami, M. (2021). Assessing the Validity of an IAU General English Achievement Test Through Hybridizing Differential Item Functioning and Differential Distractor Functioning. Lang. Test. Asia. 11, 8. doi:10.1186/s40468-021-00124-7
Karami, H. (2011). Detecting Gender Bias in a Language Proficiency Test. Int. J. Lang. Stud. 5 (2), 27–38.
Kato, K., Moen, R. E., and Thurlow, M. L. (2009). Differentials of a State reading Assessment: Item Functioning, Distractor Functioning, and Omission Frequency for Disability Categories. Educ. Meas. Issues Pract. 28, 28–40. doi:10.1111/j.1745-3992.2009.00145.x
Kim, J., and Oshima, T. C. (2013). Effect of Multiple Testing Adjustment in Differential Item Functioning Detectionffect of Multiple Testing Adjustment in Differential Item Functioning Detection. Educ. Psychol. Meas. 73 (3), 458–470. doi:10.1177/0013164412467033
Kim, M. (2001). Detecting DIF Across the Different Language Groups in a Speaking Test. Lang. Test. 18 (1), 89–114. doi:10.1177/026553220101800104
Kim, S.-H., Cohen, A. S., Alagoz, C., and Kim, S. (2007). DIF Detection and Effect Size Measures for Polytomously Scored Itemsffect Size Measures for Polytomously Scored Items. J. Educ. Meas. 44 (2), 93–116. doi:10.1111/j.1745-3984.2007.00029.x
Koon, S. (2010). A Comparison of Methods for Detecting Differential Distractor Functioning. Tallahassee, FL: Unpublished Doctoral Dissertation, Florida State University.
Loken, E., and Rulison, K. L. (2010). Estimation of a Four-Parameter Item Response Theory Model. Br. J. Math. Stat. Psychol. 63 (3), 509–525. doi:10.1348/000711009X474502
Maddox, B., Zumbo, B. D., Tay-Lim, B., and Qu, D. (2015). An Anthropologist Among the Psychometricians: Assessment Events, Ethnography, and Differential Item Functioning in the Mongolian Gobi. Int. J. Test. 15 (4), 291–309. doi:10.1080/15305058.2015.1017103
Madley-Dowd, P., Hughes, R., Tilling, K., and Heron, J. (2019). The Proportion of Missing Data Should Not Be Used to Guide Decisions on Multiple Imputation. J. Clin. Epidemiol. 110, 63–73. doi:10.1016/j.jclinepi.2019.02.016
Magis, D., Béland, S., Tuerlinckx, F., and De Boeck, P. (2010). A General Framework and an R Package for the Detection of Dichotomous Differential Item Functioning. Behav. Res. Methods. 42, 847–862. doi:10.3758/BRM.42.3.847
Magis, D., and De Boeck, P. (2011). Identification of Differential Item Functioning in Multiple-Group Settings: A Multivariate Outlier Detection Approachfication of Differential Item Functioning in Multiple Group Settings: A Multivariate Outlier Detection Approach. Multivariate Behav. Res. 46 (5), 733–755. doi:10.1080/00273171.2011.606757
Magis, D. (2013). A Note on the Item Information Function of the Four-Parameter Logistic Model. Appl. Psychol. Meas. 37 (4), 304–315. doi:10.1177/0146621613475471
Magis, D., Tuerlinckx, F., and De Boeck, P. (2014). Detection of Differential Item Functioning Using the Lasso Approach. J. Educ. Behav. Stat. 40 (2), 111–135. doi:10.3102/1076998614559747
Marsh, H. W., Hau, K-T., and Wen, Z. (2004). In Search of Golden Rules: Comment on Hypothesis Testing Approaches to Setting Cutoff Values for Fit Indices and Dangers in Overgeneralising Hu and Bentler’s (1999) Findings. Struct. Equ. Modeling 11, 320–341. doi:10.1207/s15328007sem1103_2
Martinková, P., Drabinová, A., Liaw, Y. L., Sanders, E. A., McFarland, J. L., and Price, R. M. (2017). Checking Equity: Why Differential Item Functioning Analysis Should Be a Routine Part of Developing Conceptual Assessments. CBE—Life Sci. Education. 16 (2), rm2. doi:10.1187/cbe.16-10-0307
Middleton, K., and Laitusis, C. C. (2007). Examining Test Items for Differential Distractor Functioning Among Students With Learning Disabilities. ETS Res. Rep. Ser. 2007 (2), i–34. doi:10.1002/j.2333-8504.2007.tb02085.x
Millsap, R. E. (2006). Comments on Methods for the Investigation of Measurement Bias in the Mini-Mental State Examination. Med. Care. 44 (11), S171–S175. doi:10.1097/01.mlr.0000245441.76388.ff
Muthen, L. K., and Muthen, B. O. (2012). Mpus User’s Guide. 7th ed. Los Angeles, CA: Muthen, and Muthen, Author.
Pae, T.-I. (2004). DIF for Examinees With Different Academic Backgrounds. Lang. Test. 21 (1), 53–73. doi:10.1191/0265532204lt274oa
Park, M. (2017). Investigating Differential Options Functioning Based on Multinomial Logistic Regression with Widely Used Statistical Software Master Thesis. Vancouver, Canada: University of British Columbia.
Penfield, R. D. (2008). An Odds Ratio Approach for Assessing Differential Distractor Functioning Effects Under the Nominal Response Model. J. Educ. Meas. 45, 247–269. doi:10.1111/j.1745-3984.2008.00063.x
Penfield, R. D. (2010). Modeling DIF Effects Using Distractor-Level Invariance Effects: Implications for Understanding the Causes of DIF. Applied Psychological Measurement. doi:10.1177/0146621609359284
Rosseel, Y. (2012). Lavaan: An R Package for Structural Equation Modeling. J. Stat. Softw. 48 (2), 1–36. doi:10.18637/jss.v048.i02
Rulison, K. L., and Loken, E. (2009). I’ve Fallen and I can’t get up: Can High Ability Students Recover from Early Mistakes in Computer Adaptive Testing?. Appl. Psychol. Meas. 33, 83–101. doi:10.1177/0146621608324023
Schmitt, A. P., and Dorans, N. J. (1990). Differential Item Functioning for Minority Examinees on the SAT. J. Educ. Meas. 27, 67–81. http://www.jstor.org/stable/1434768
Shohamy, E. (2001). Democratic Assessment as an Alternative. Lang. Test. 18 (4), 373–391. doi:10.1177/026553220101800404
Sideridis, G. D., Tsaousis, I., and Al-harbi, K. A. (2015). Multi-Population Invariance With Dichotomous Measures. J. Psychoeducational Assess. 33 (6), 568–584. doi:10.1177/0734282914567871
Stobart, G. (2005). Fairness in Multicultural Assessment Systems. Assess. Educ. Principles, Pol. Pract. 12 (3), 275–287. doi:10.1080/09695940500337249
Suh, Y., and Bolt, D. M. (2010). Nested Logit Models for Multiple-Choice Item Response Data. Psychometrika. 75, 454–473. doi:10.1007/S11336-010-9163-7
Suh, Y., and Bolt, D. M. (2011). A Nested Logit Approach for Investigating Distractors as Causes of Differential Item Functioning. J. Educ. Meas. 48, 188–205. doi:10.1111/j.1745-3984.2011.00139.x
Suh, Y., and Talley, A. E. (2015). An Empirical Comparison of DDF Detection Methods for Understanding the Causes of DIF in Multiple-Choice Items. Appl. Meas. Education. 28, 48–67. doi:10.1080/08957347.2014.973560
Swaminathan, H., and Rogers, H. J. (1990). Detecting Differential Item Functioning Using Logistic Regression Proceduresfferential Item Functioning Using Logistic Regression Procedures. J. Educ. Meas. 27 (4), 361–370. doi:10.1111/j.1745-3984.1990.tb00754.x
Takala, S., and Kaftandjieva, F. (2000). Test Fairness: A DIF Analysis of an L2 Vocabulary Test. Lang. Test. 17 (3), 323–340. doi:10.1177/026553220001700303
Terzi, R., and Suh, Y. (2015). An Odds Ratio Approach for Detecting DDF Under the Nested Logit Modeling Framework. J. Educ. Meas. 52 (4), 376–398. doi:10.1111/jedm.12091
Thissen, D., and Steinberg, L. (1986). A Taxonomy of Item Response Models. Psychometrika. 51, 567–577. doi:10.1007/bf02295596
Tsaousis, I., Sideridis, G., and Al-Saawi, F. (2018). Differential Distractor Functioning as a Method for Explaining DIF: The Case of a National Admissions Test in Saudi Arabia. Int. J. Test. 18 (1), 1–26. doi:10.1080/15305058.2017.1345914
Walker, C. M., and Göçer, S. (2020). Using Differential Item Functioning to Test for Interrater Reliability in Constructed Response Items. Educ. Psychol. Meas. 80 (4), 808–820. doi:10.1177/0013164419899731
Wang, W. C. (2000). Factorial Modeling of Differential Distractor Functioning in Multiple-Choice Items. J. Appl. Meas. 1, 238–256.
Wiberg, M. (2006). Gender Differences in the Swedish Driving-License Test. J. Saf. Res. 37, 285–291. doi:10.1016/j.jsr.2006.02.005
Keywords: large-scale tests, item bias, DIF, differential distractor functioning, distractor analysis
Citation: Ozdemir B and AlGhamdi HM (2022) Investigating the Distractors to Explain DIF Effects Across Gender in Large-Scale Tests With Non-Linear Logistic Regression Models. Front. Educ. 6:748884. doi: 10.3389/feduc.2021.748884
Received: 28 July 2021; Accepted: 29 November 2021;
Published: 18 January 2022.
Edited by:
Sedat Sen, Harran University, TurkeyReviewed by:
Shawna Goodrich, Department of National Defence, CanadaMurat Dogan Sahin, Anadolu University, Turkey
Copyright © 2022 Ozdemir and AlGhamdi. This is an open-access article distributed under the terms of the Creative Commons Attribution License (CC BY). The use, distribution or reproduction in other forums is permitted, provided the original author(s) and the copyright owner(s) are credited and that the original publication in this journal is cited, in accordance with accepted academic practice. No use, distribution or reproduction is permitted which does not comply with these terms.
*Correspondence: Burhanettin Ozdemir, Ym96ZGVtaXJAcHN1LmVkdS5zYQ==