 Stephen Humphry
 Paul Montuoro
- Graduate School of Education (M428), The University of Western Australia, Crawley, WA, Australia
This article demonstrates that the Rasch model cannot reveal systematic differential item functioning (DIF) in single tests. The person total score is the sufficient statistic for the person parameter estimate, eliminating the possibility for residuals at the test level. An alternative approach is to use subset DIF analysis to search for DIF in item subsets that form the components of the broader latent trait. In this methodology, person parameter estimates are initially calculated using all test items. Then, in separate analyses, these person estimates are compared to the observed means in each subset, and the residuals assessed. As such, this methodology tests the assumption that the person locations in each factor group are invariant across subsets. The first objective is to demonstrate that in single tests differences in factor groups will appear as differences in the mean person estimates and the distributions of these estimates. The second objective is to demonstrate how subset DIF analysis reveals differences between person estimates and the observed means in subsets. Implications for practitioners are discussed.
1 Introduction
In the Rasch model the total score is the sufficient statistic for calculating person ability and item difficulty parameter estimates (Rasch 1960). These estimates must function invariantly for valid quantitative measurement to occur. Rasch (1961) described the invariance requirement as follows:
The comparison between two stimuli should be independent of which particular individuals were instrumental for the comparison; it should also be independent of which other stimuli within the considered class were or might also have been compared. Symmetrically, a comparison between two individuals should be independent of which particular stimuli within the class considered were instrumental for comparison; and it should also be independent of which other individuals were also compared on the same or some other occasion (Rasch 1961, p. 322).
The meaningful comparison of persons therefore requires the stimuli in a measurement instrument to function invariantly. This is not only the case along the variable of assessment, but between the factor groups being compared, where differential item functioning (DIF) causes items to function differently between groups who otherwise share the same ability estimate on the latent trait (Hagquist & Andrich, 2017). In this article, we demonstrate that the Rasch model cannot reveal systematic DIF in single tests. Therefore, we propose an alternative approach named subset DIF analysis. Person parameter estimates are initially calculated in a Rasch model analysis that includes all test items. Then, in separate analyses, these person estimates are compared to the observed means in the subsets that form the components of the broader latent trait, and the residuals assessed. As such, this methodology tests the assumption that the person locations in each factor group are invariant across subsets, instead of the systematic DIF analysis assumption that the person estimates in each factor group are invariant across tests. Subset DIF analysis can also be performed by testing persons on additional construct-relevant items. Here the addition items function as a frame of reference in the calculation of the person estimates, against which the observed means in the original subset are compared.
The common expression of the Rasch model for dichotomous responses is,
where Xni = xni, xni
As stated earlier, DIF is a form of misfit that occurs when items do not function in the same way for different factor groups who otherwise share the same ability estimate on the latent trait (Hagquist & Andrich, 2017). Therefore, DIF occurs when the probability of answering an item correctly is not the same for persons who share the same ability level but belong to different factor groups. Here items are said to have different relative difficulties for different groups, thus violating invariance and distorting person comparisons (Andrich & Hagquist, 2004; Andrich & Hagquist, 2012; Hagquist & Andrich, 2017; Andrich & Marais, 2019).
In practice, DIF is used to examine whether there is bias in an item. Uniform DIF favoring one factor group, such as girls, means that for any given ability, girls obtain higher scores on average than boys. Non-uniform DIF occurs when one factor group obtains higher scores on average, but not across all ability levels. For example, girls may obtain higher scores on average at the lower end of the ability range, whereas boys obtain higher scores on average, at the higher end of the range. One question that arises in practice is whether a test as a whole is biased in favor of one factor group. This paper focuses on how to approach this, and related, questions in applied contexts.
Systematic DIF in a set of questions can produce misleading data regarding the performance of factor groups. This is particularly an issue if the DIF affects validity. For example, if a significant number of items in a mathematics test demand a high level of vocabulary, that demand may introduce construct-irrelevant variance. As such, systematic DIF can have a bearing on the validity of an assessment and inferences drawn in comparing factor group results.
The methodology for identifying DIF used in this study was described by Andrich and Hagquist (2004). In this approach, a single set of item parameters is estimated and the residuals of each factor group are analysed. DIF can be checked graphically by inspecting the residuals around the expected score curve. The observed means are displayed separately for each factor group. However, in this approach DIF can also be checked statistically via an analysis of the residuals. The standardized residual of each person, n, to each item, i, is given:
where E [xni] is the expected value given person n’s and item i’s parameter estimates, and v [xni] is the variance. For the purpose of more detailed analysis, each person is further identified by their group membership, g, and by the class interval, c. This gives:
The residuals are then analysed using a factorial ANOVA. This test determines if there is a statistically significant difference among the mean residuals for the factor groups. The common discussion in the literature on DIF focuses on two groups. Some of this literature focuses on a minority group compared to a majority group. Other literature investigates groups of equal status, such as the genders. In this article we focus on boys and girls in secondary school. DIF also appears graphically as a difference between the item characteristic curves (ICCs) plotted for two factor groups. Examples are shown later in this article. If, for example, DIF uniformly favors boys, the ICC for boys is higher than the ICC for girls, which is plotted separately. In this case the average standardized residual has a higher positive value for boys than girls.
Systematic DIF refers to the aggregation of DIF in favor of a factor group across a test. It refers to a generalized lack of invariance between factor groups. Decisions are normally based on test scores, so systematic DIF is of practical importance. In the Rasch model, as will be shown, systematic DIF cannot appear in a single test because the total score is the sufficient statistic for person estimates. In words, grouping persons by their parameter estimates is equivalent to grouping persons by their total scores. Hence, there can be no residuals and therefore no systematic DIF at the test level.
In estimating the person parameter for each person, the sum of probabilities across items must equal the total score, i.e.,
In the Rasch model, if one factor group has a higher ability than another factor group, the persons in the former group will receive higher total scores and ability estimates. However, this does not represent systematic DIF. Even though persons in the former group demonstrated higher abilities on the latent trait, this is not the same as the test functioning differently for persons between groups who otherwise share the same ability (for a discussion, see Drasgow, 1987).
Few studies have investigated systematic DIF. Drasgow (1987) analysed the ACT Assessment English and Mathematics Usage tests using the three-parameter logistic (3P L) model. Drasgow did not find systematic DIF in either test and concluded that the tests provided equivalent measurement for all factor groups. But it may have been impossible for Drasgow to identify underlying systematic DIF using the 3P L model, for the very same reason that the Rasch model cannot reveal systematic DIF in single tests1. It is therefore interesting to note Drasgow’s comment about the apparent lack of systematic DIF in his studies:
Several readers of an earlier draft of this article … suggest[ed] that some methodological artifact in the IRT analysis would always force observed test-characteristic curves of female and minority groups to match the white male curve even when there really were differences (p. 27, emphases in original).
Others have searched for systematic DIF using the one-parameter logistic (1P L) model (Takala and Kaftandjieva, 2000) and the 3P L model (Pae, 2004). Neither study found systematic DIF. Others such as Chalmers, Counsell, and Flora (2016) searched for systematic DIF using the differential functioning of items and tests (DFIT) methodology originally proposed by Raju, van der Linden, and Fleer (1995). This approach calculates item difficulty estimates using the raw scores from each factor group in separate analyses. For example, in the case of gender groups, item estimates are calculated using boys’ raw scores, and then recalculated using girls’ raw scores. The two sets of item estimates are placed on a common scale. From here two sets of person estimates for each group are calculated. For example, the boys’ person estimates are calculated using the anchored item estimates derived from the boys’ raw scores, and then recalculated using the anchored item estimates derived from the girls’ raw scores. According to the methodology, if the two sets of person estimates for each factor group are not equal it is an indication of systematic DIF.
However, it also appears that the DFIT methodology cannot reveal systematic DIF. When multiple sets of item estimates are calculated using the raw scores from different factor groups, and then placed on a common scale, the resulting sets of person estimates for any one factor group must be equal or near equal, on average. This is because after equating, each set of item estimates share the same mean and standard deviation. It does not matter which set of anchored item estimates is used to calculate person estimates, there will never be an appreciable difference in the person estimates, on average.
The current study is based on a general reasoning test designed for Australian senior secondary school students. The test comprises 72 dichotomous items evenly divided into nonverbal and verbal reasoning item subsets. First, we hypothesize that when subsets are treated as single tests, differences in the factor groups will appear as differences in the mean person estimates and the distributions of these estimates. However, we hypothesize that systematic DIF will not appear when subsets are treated as single tests, from which it can be inferred that systematic DIF will not appear if the general reasoning test is treated as a single test. Second, we hypothesize that subset DIF analyses will reveal subset DIF in the nonverbal and verbal item subsets, respectively. As such, this alternative methodology does not assess systematic DIF, but instead tests the assumption that the person locations in each factor group are invariant across subsets.
2 Method
2.1 Data and Instrument
The Year 10 general reasoning test used in this study was developed by Academic Assessment Services (AAS). It is a pencil-and-paper test comprising 72 dichotomous items. The test is similar to the Otis-Lennon School Ability Test (OLSAT 8) (Otis, 2009), in that it includes 36 nonverbal reasoning items (pictorial reasoning, figural reasoning, and quantitative reasoning), and 36 verbal reasoning items (verbal comprehension, sentence completion and arrangements, and logical, arithmetic, and verbal reasoning). The items in the test are arranged in ascending order of difficulty.
In 2019, the general reasoning test was administered to 12,476 students in over 100 secondary schools. This included schools from a range of socioeconomic locations in every Australian state and territory, except the Northern Territory. The schools included state schools and independent schools from a range of denominations. The data for this study were derived from a random sample of 1,604 students in 12 schools from the 2019 data set (MAge = 15.066, SDAge = 0.462). The sample comprised 806 boys (MAge = 15.067, SDAge = 0.475) and 798 girls (MAge = 15.063, SDAge = 0.449).
2.2 Procedure
The general reasoning test used in this study is administered to students as part of the AAS Year 10 standardized testing program. The general reasoning test is one of five tests in the program, which also includes numeracy, reading, writing, and spelling tests. The half-day program is normally conducted in a large communal area such as a gym. The program begins between 8:30 am and 9:00 am and includes two sessions which both run for 112 min.
The general reasoning test is the first test administered to students. Each student receives a general reasoning test booklet which they are not permitted to mark, an optical mark recognition (OMR) answer booklet, and scrap paper for workings. Calculators are not permitted in this test. The supervisor briefly introduces the test and demonstrates how to answer items by referring to the five sample items at the beginning of the test booklet. There is no reading time and students have a maximum of 45 min to complete the test. Supervisors are not permitted to answer questions that could assist students.
2.3 Naming Conventions
For clarity, in the general reasoning test analyses the item set comprising nonverbal reasoning items is named the nonverbal reasoning subset (i.e., as opposed to the nonverbal reasoning test). Likewise, in the general reasoning test analyses the item set comprising verbal reasoning items is named the verbal reasoning subset. However, when these subsets are analysed as single tests, they are simply named the nonverbal reasoning test and verbal reasoning test (see Figure 1).
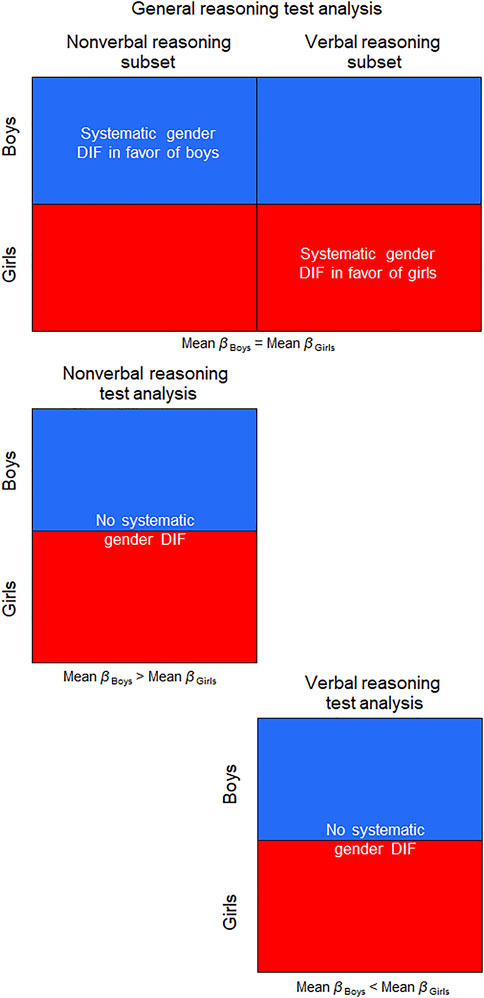
FIGURE 1. Data formats for tests and subsets.
2.4 Identifying Misfitting Items
The Rasch model analyses in this study were all performed in the software package RUMM2030 Professional (Andrich, Sheridan, and Luo, 2018). Initially, a random sample of 300 persons was derived from the complete data set of 12,476 persons. The general reasoning test was then analysed and misfitting items were identified. As can be seen in Table 1, the summary statistics revealed that the standard deviation of the item locations was close to 1. The mean fit residual was close to zero, but the standard deviation was higher than 1. The item-trait interaction was significant, χ2 (648, 300) = 796.368, p < 0.0001. The correlation between item locations and standardized residuals was low. The mean person location was slightly higher than zero and its standard deviation was close to 1, while the person separation index was high.

TABLE 1. Summary statistics of general reasoning test.
Subsequent analyses of the fit residuals, chi-square statistics, and expected score curves revealed two low discriminating items in the nonverbal reasoning subset, and six low discriminating items in the verbal reasoning subset. These items were removed and the modified data set was reanalyzed. As can be seen in Table 1, the item location standard deviation fell slightly. The mean fit residual fell, and the standard deviation moved closer to 1. The item-trait interaction was no longer significant, χ2 (575, 300) = 589.215, p = 0.332. The correlation between the item locations and standardized residuals increased slightly, but still remained low. Finally, the mean and standard deviation of the person locations both increased slightly, but there was almost no change in the person separation index.
2.5 Data Structure
After removing low discriminating items, analyses were performed on the general reasoning, nonverbal reasoning, and verbal reasoning data sets, respectively. The purpose was to calculate the item estimates. Missing data were treated as missing.
Person estimates were calculated in new analyses. In each analysis, individual item anchoring was used to anchor the item estimates from the previous respective analyses. This time missing data were treated as incorrect. The assumption here was that for the purpose of calculating person estimates, missing data were missing not at random (MNAR) (i.e., missingness of data was related to person ability) and would bias person estimates.
In these latter analyses the most difficult items had very low discrimination. This is because in the most difficult items (i.e., items with the highest proportion of missing data), the proportion of correct responses in each class interval was far lower than the expected scores derived from the anchored item estimates. This indicated that the missing data in the initial analyses were probably MNAR, negatively biasing the item estimates for the most difficult items (for a discussion, see Waterbury, 2019). These analyses were therefore disregarded, and missing data were treated as incorrect in subsequent analyses.
3 Results
3.1 Person Location Estimates for Factor Groups
This study began with a comparison of person parameter estimates derived from the general, nonverbal, and verbal reasoning test analyses. The person estimates from the nonverbal and verbal reasoning tests were placed on the same scale as the person estimates from the general reasoning test using a two-step mean equating process performed in a spreadsheet. The item parameter estimates from the nonverbal and verbal reasoning tests were mean equated to the item estimates from the general reasoning test. New analyses were then performed on the nonverbal and verbal tests, in which the mean equated item estimates were anchored using individual item anchoring.
As can be seen in Table 2 and Figure 2, in the nonverbal reasoning test the mean person estimate for boys was higher than it was for girls. The opposite was true in the verbal reasoning test, although the magnitude of the difference was smaller. This imbalance in superior performances for boys and girls in the tests resulted in a slightly higher mean person estimate for boys in the general reasoning test.
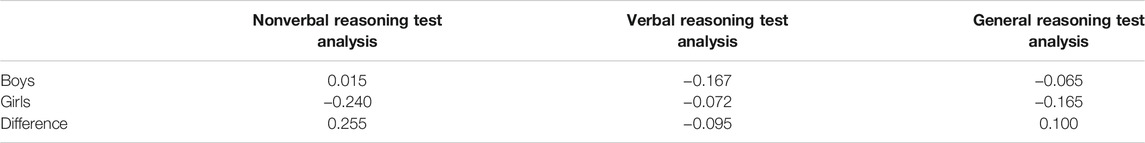
TABLE 2. Mean person estimates for factor groups.
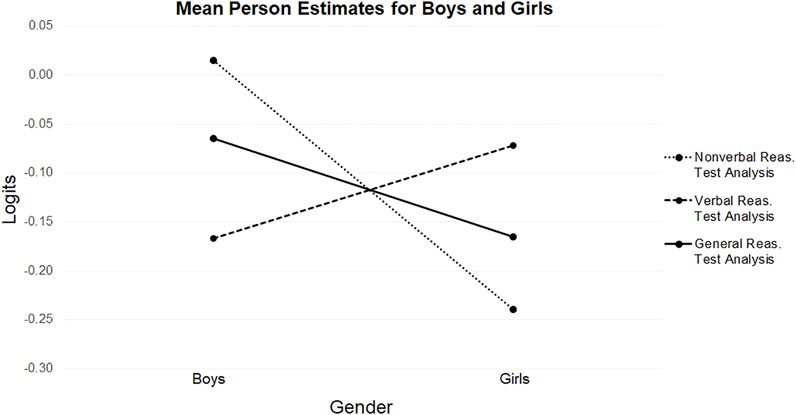
FIGURE 2. Mean person estimates for boys and girls.
The frequency distributions of the person estimates for the two factor groups were also different in the nonverbal and verbal reasoning tests. In the nonverbal reasoning test, the frequency distribution for boys was positioned to the right of the frequency distribution for girls (see Figure 3). A Mann Whitney U Test was then performed, which revealed that the difference in the estimates for boys (Mdn = 0.066) and girls (Mdn = -0.241) was statistically significant, U(Nboys = 806, Ngirls = 798), z = 5.543, p < 0.0001, r = 0.14.
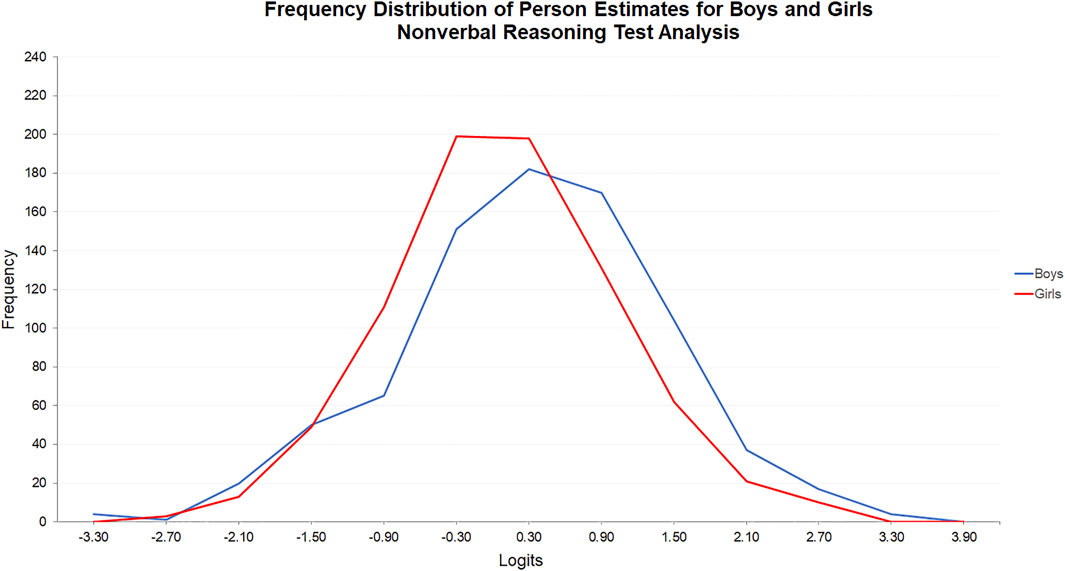
FIGURE 3. Frequency distribution of person estimates for boys and girls: Nonverbal reasoning test analysis.
The opposite was true in the verbal reasoning test (see Figure 4). The frequency distributions of the person estimates for boys and girls were more closely positioned because of the imbalance in superior performances between boys and girls on the nonverbal and verbal tests. Nevertheless, a Mann Whitney U Test indicated that the difference in the person estimates for girls (Mdn = -0.097) and boys (Mdn = -0.293) was statistically significant, U(Ngirls = 798, Nboys = 806), z = -2.058, p = 0.04, r = 0.05.
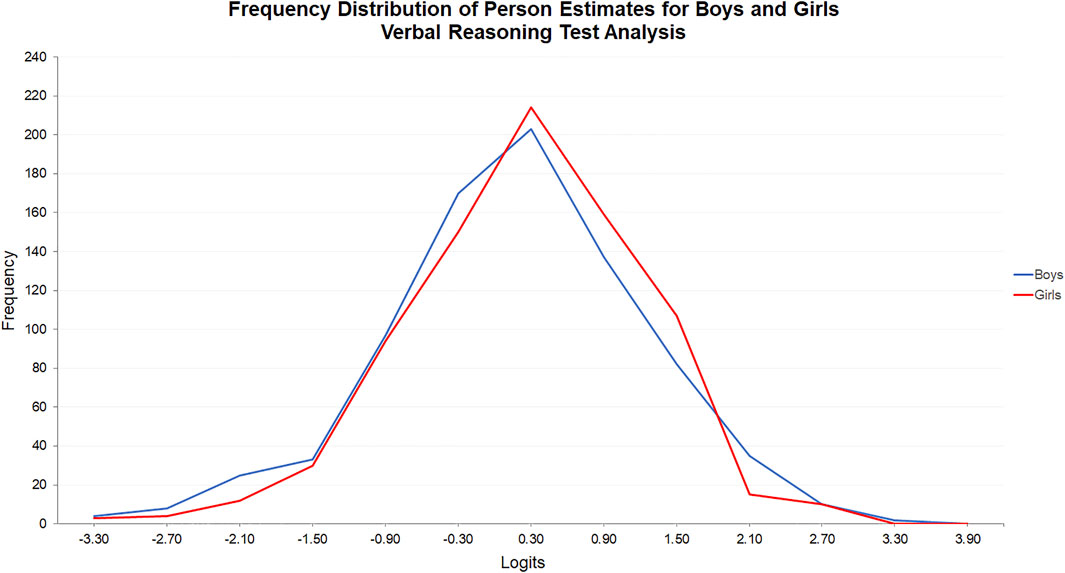
FIGURE 4. Frequency distribution of person estimates for boys and girls: Verbal reasoning test analysis.
In the general reasoning test analysis, the frequency distributions of the person parameter estimates were more closely matched because the estimates were derived from an overall measure of general reasoning. Combining tests limited the effect of factor group superior performances in the nonverbal and verbal tests (see Figure 5). However, the frequency distribution for boys was positioned to the right of the frequency distribution for girls because of the relative imbalance in superior performances. A Mann Whitney U Test indicated that the difference in estimates for boys (Mdn = -0.093) and girls (Mdn = -0.223) was statistically significant, U(Nboys = 806, Ngirls = 798), z = 2.492, p = 0.01, r = 0.06.
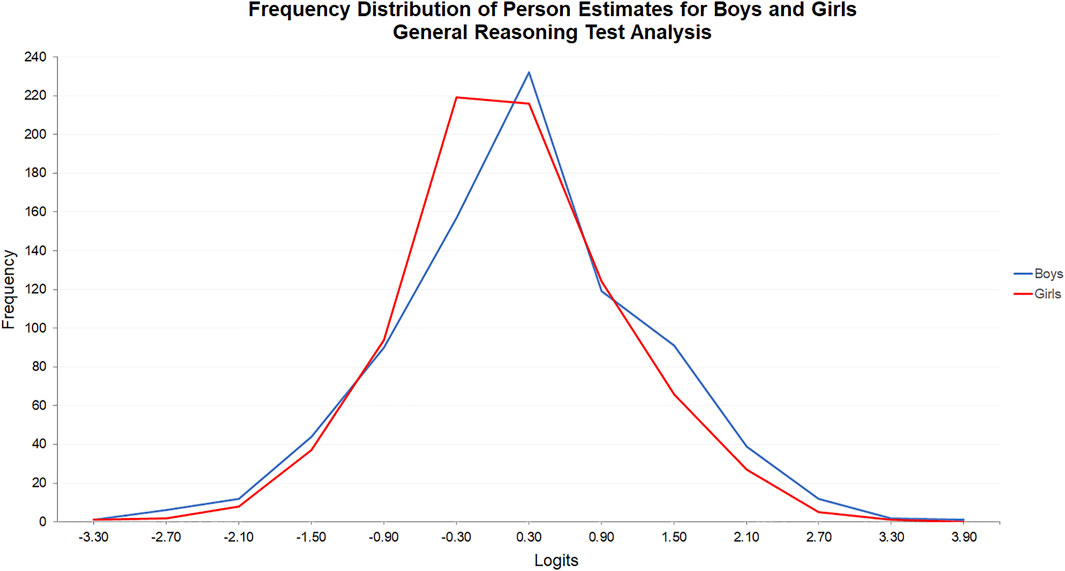
FIGURE 5. Frequency distribution of person estimates for boys and girls: General reasoning test analysis.
3.2 Systematic DIF in Single Tests and Subset DIF in Subsets
In the following analyses, we extracted the person estimates, expected total scores, and observed means from RUMM2030 Professional, and plotted test characteristic curves (TCCs) in a spreadsheet. When the nonverbal reasoning test was treated as a single test, the observed means for boys and girls directly conformed to the TCC (see Figure 6), indicating no systematic DIF. The same was true when the verbal reasoning test was treated as a single test (see Figure 7).
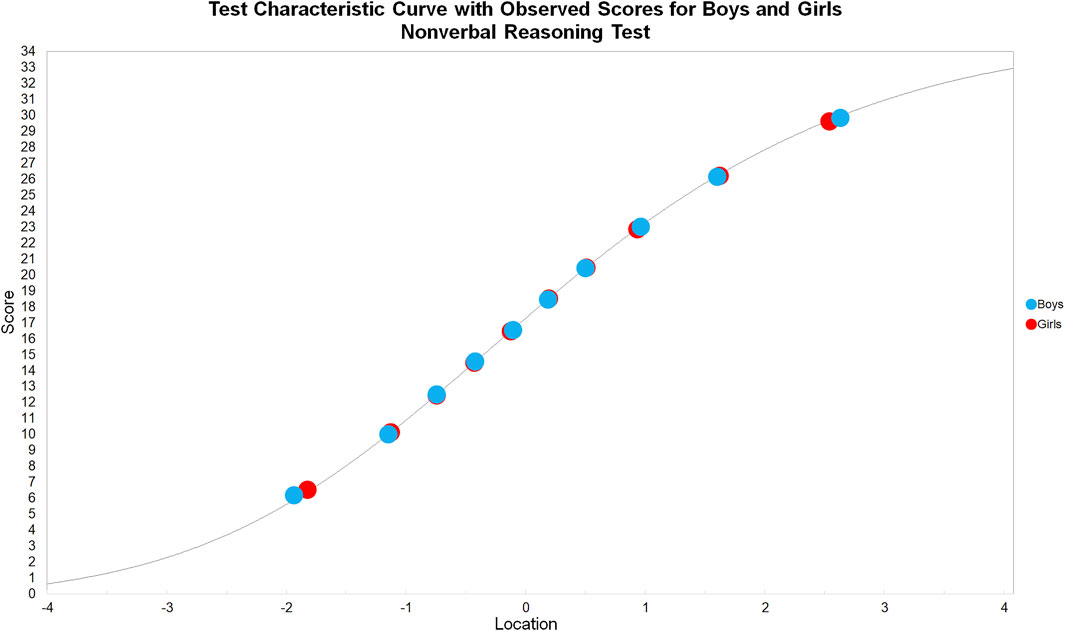
FIGURE 6. Test characteristic curve with observed scores for boys and girls: Nonverbal reasoning test.
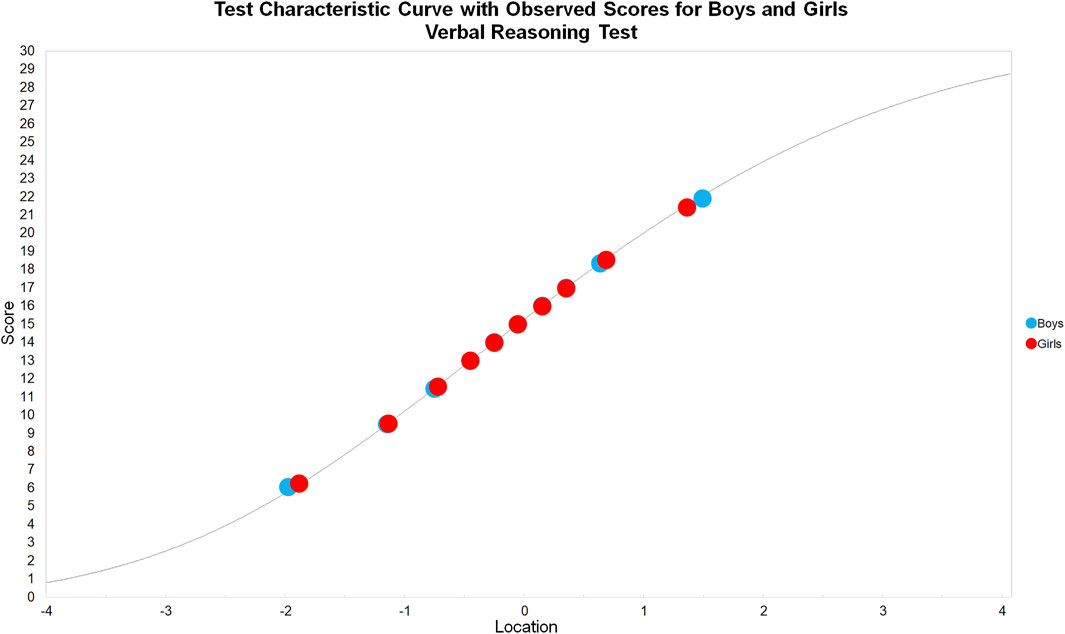
FIGURE 7. Test characteristic curve with observed scores for boys and girls: Verbal reasoning test.
Subset DIF analyses were then performed. The nonverbal and verbal reasoning tests were combined, with each subset effectively acting as a frame of reference for person estimates in the other subset. The TCCs for the nonverbal and verbal subsets were constructed by performing two subtest analyses in the general reasoning test analysis (see Figure 8,9). For example, the nonverbal reasoning subset analysis initially started in RUMM2030 Professional, where the nonverbal items were aggregated into a higher order polytomous item, after which the general reasoning test was reanalyzed. The resulting person estimates, expected total scores, and the observed means for the subtest were extracted from RUMM2030 Professional, and the nonverbal reasoning subset TCC was plotted in a spreadsheet. The same process was followed for the verbal reasoning subset TCC.
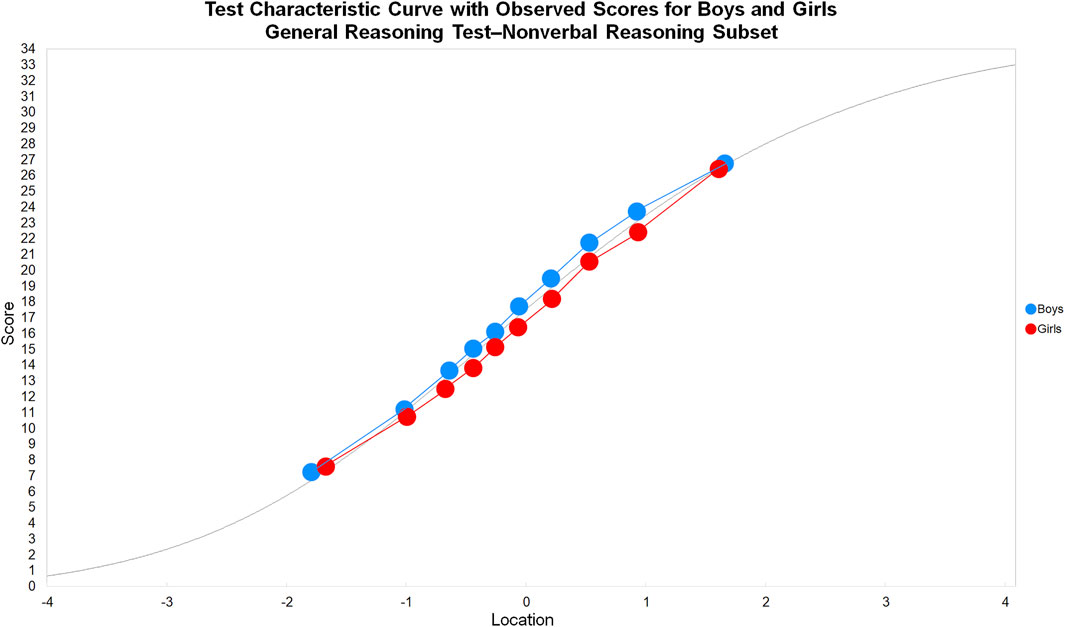
FIGURE 8. Test characteristic curve with observed scores for boys and girls: General reasoning test’nonverbal reasoning subset.

FIGURE 9. Test characteristic curve with observed scores for boys and girls: General reasoning test’verbal reasoning subset.
The nonverbal reasoning subset TCC revealed the observed means for boys were uniformly higher than both the expected score curve and the observed means for girls, thus indicating subset DIF in favor of boys (see Figure 8). The verbal reasoning subset TCC revealed the observed means for girls were uniformly higher than both the expected score curve and the observed means for boys, thus indicating subset DIF in favor of girls (see Figure 9).
3.3 DIF Magnitude
The number of items in favor of boys and girls was initially measured using the mean residual of the observed means for boys and girls from expected scores across 10 class intervals. When the nonverbal and verbal reasoning tests were treated as single tests, the total number of items in favor of boys and girls was almost equal in both tests (see Table 3 and Figure 10).
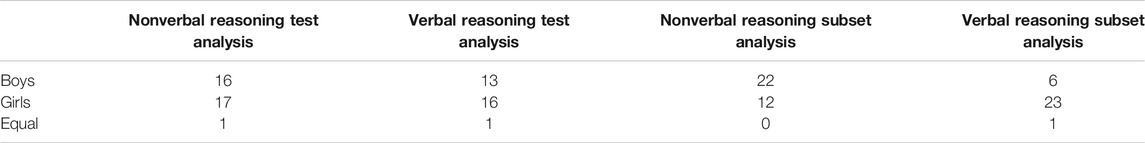
TABLE 3. Items in favor of factor groups: Mean DIF residuals across 10 class intervals.
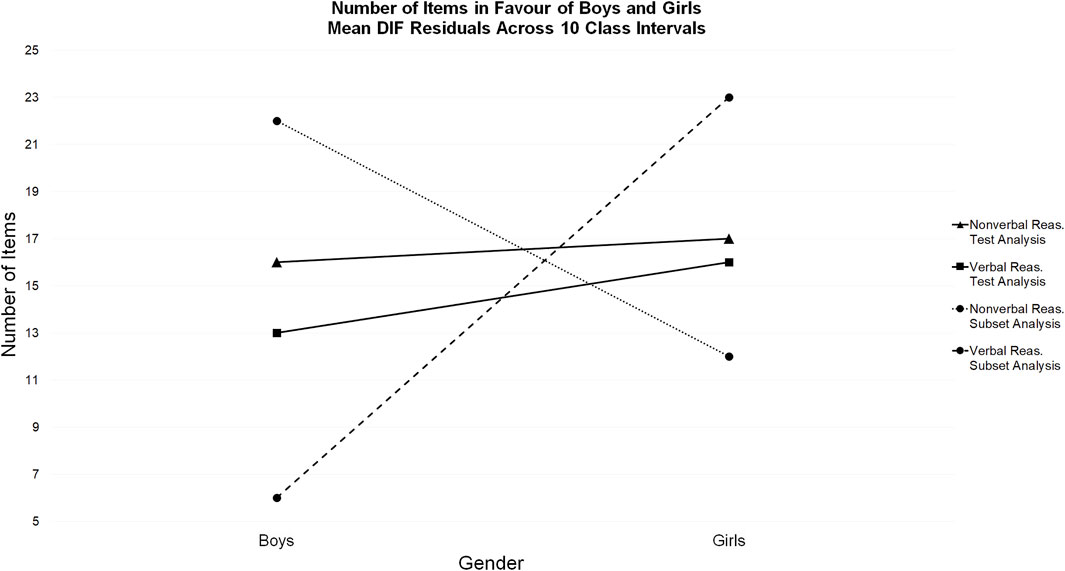
FIGURE 10. Number of items in favor of boys and girls: Mean DIF residuals across 10 class intervals.
This was not the case in the subset DIF analyses. When the mean residuals from the nonverbal subset were extracted from the general reasoning test analysis, 22 items favored boys and 12 items favored girls. When the mean residuals from the verbal subset were extracted from the general reasoning test analysis, 23 items favored girls and 6 items favored boys.
The factorial ANOVA for the nonverbal subset residuals revealed a statistically significant main effect for gender, F (91,594), 70.42, p < 0.001, indicating a difference between boys (M = 0.520, SD = 0.184) and girls (M = 0.475, SD = 0.166). The interaction effect between class interval and gender was also significant, F (91,594), 2.98, p < 0.01, indicating that although the gradients of the observed means for boys and girls did not cross, these gradients were different and the subset DIF was non-uniform (see Figure 8).
The factorial ANOVA for the verbal subset residuals showed a statistically significant main effect for gender, F (91,594), 82.5, p < 0.001, once again indicating a significant difference between boys (M = 0.479, SD = 0.166) and girls (M = 0.495, SD = 0.153). However, the interaction effect between class interval and gender was not significant, F (91,594), 1.57, p = 0.12, indicating that the gradients of the observed means for boys and girls were the same and that the subset DIF was uniform (see Figure 9).
4 Discussion and Implications
The first aim was to demonstrate that the Rasch model cannot reveal systematic DIF in single tests. As hypothesized, when the nonverbal and verbal reasoning tests in this study were analyzed as single tests, differences in the performances of boys and girls appeared in the mean person parameter estimates and in the distributions of these estimates. Nevertheless, these differences do not represent systematic DIF, which happens when a test does not function in the same way for different factor groups who otherwise share the same ability estimate on the latent trait.
In the Rasch model, the person total score is the sufficient statistic for the person estimate, eliminating the possibility for residuals at the test level. Therefore, as hypothesized, systematic DIF did not appear in either the nonverbal nor verbal reasoning single test analyses. This was demonstrated in the direct conformity of the observed means to the expected score curves for both factor groups in both TCCs. For the same reason, there were only minor differences in the total number of items in favor of either factor group, which is indicative of no systematic DIF.
The second aim was to introduce subset DIF analysis as an alternative methodology to systematic DIF analysis. In subset DIF analysis, single tests are divided into item subsets that form the components of the broader latent trait, such as the nonverbal and verbal subsets in the general reasoning test reported here. Person parameter estimates are initially calculated in a Rasch model that includes all test items. Then, in separate analyses, these person estimates are compared to the observed means for each factor group in each subset, and the residuals assessed. Therefore, this methodology tests the assumption that the person locations in each factor group are invariant across subsets. Subset DIF analysis is therefore not a direct alternative to a systematic DIF analysis, but instead offers insights to largescale DIF across clusters of items.
In applied contexts, practitioners can determine item subsets for DIF analysis by identifying questions that are hypothesized to favor a particular factor group. In doing so, practitioners can draw on previous experience and research, if any is available. For example, it might be hypothesized that a subset of questions in a mathematics test, which demand a higher level of vocabulary, favor girls. In that case, a practitioner can place these questions into a subset, and other questions into a separate subset. It is then possible to apply the approach introduced in this article to examine subset DIF.
In this study we revealed subset DIF in the nonverbal and verbal subsets. In both subsets we showed that the observed means of the factor groups were uniformly different to each other and to the expected score curves. These results were confirmed with factorial ANOVAs of the residuals, and the mismatch between the number of items favoring factor groups in each subset. Therefore, we revealed subset DIF by rejecting the assumption that the person estimates in each factor group were the same in each subset. As such, this study demonstrates that subset DIF is concealed when the Rasch model is used to analyse systematic DIF in single tests. Stated differently, if persons in one class interval received higher scores than expected across all items in a subset, their observed means in that subset would deviate from their expected scores. But this is not possible in a single test because the MLE solution equation constrains person expected scores to their observed means.
Thus, using the Rasch model it is inherently impossible to detect systematic DIF across a single test. In practice, there are two main options available when using subset DIF. One is to identify item subsets within a single test that may have group-specific DIF and to use the approach outlined in this article to see whether there is subset DIF for a factor group in such subsets. The other is to broaden the frame of reference by testing persons on additional construct-relevant items and to examine subset DIF in the context of this broadened frame of reference. In both options, underlying subset DIF can only appear if the factor group observed means within a subset are inconsistent with their person estimates, which are partially based on the items in the frame of reference.
The article focuses on DIF as a source of misfit. Inevitably, other forms of model misfit are present in real data and may confound the interpretation of results. As such, further studies are recommended to investigate whether other sources of misfit impact inferences regarding subset DIF. Related to this, a second consideration in applying the methodology proposed here concerns the selection of the frame of reference subset. Broadening the measurement in this way changes the substantive definition of the latent trait and it therefore changes the measurement. This kind of change may introduce effects such as differences in item difficulty that influence targeting, differences in item discrimination between subsets, and increased misfit across the whole test. Practitioners need to be aware of these possible effects when considering the methodology.
Data Availability Statement
The raw data supporting the conclusion of this article will be made available by the authors, without undue reservation.
Ethics Statement
Ethical review and approval was not required for the study on human participants in accordance with the local legislation and institutional requirements. Written informed consent to participate in this study was provided by the participants’ legal guardian/next of kin.
Author Contributions
All authors contributed to the article and approved the submitted version.
Conflict of Interest
The authors declare that the research was conducted in the absence of any commercial or financial relationships that could be construed as a potential conflict of interest.
Publisher’s Note
All claims expressed in this article are solely those of the authors and do not necessarily represent those of their affiliated organizations, or those of the publisher, the editors and the reviewers. Any product that may be evaluated in this article, or claim that may be made by its manufacturer, is not guaranteed or endorsed by the publisher.
References
Andrich, D., and Hagquist, C. (2012). Real and Artificial Differential Item Functioning. J. Educ. Behav. Stat. 37 (7), 387–416. doi:10.3102/1076998611411913
Andrich, D., and Hagquist, C. (2004). Real and Artificial Differential Item Functioning Using Analysis of Variance. Paper presented at the Second. Procedding of the International Conference on Measurement in Health, Education, Psychology, and Marketing: Developments with Rasch Models, Perth, Australia, January 20-22, 2004. Murdoch University.
Andrich, D., and Marais, I. (2019). A Course in Rasch Measurement: Measuring in the Educational, Social, and Health Sciences. Singapore: Springer.
Andrich, D., Sheridan, B. E., and Luo, G. (2018). RUMM2030 Professional: Rasch Unidimensional Models for Measurement [Computer Software]. Perth, Western Australia: RUMM Laboratory.
Chalmers, R. P., Counsell, A., and Flora, D. B. (2016). It Might Not Make a Big DIF: Improved Differential Test Functioning Statistics that Account for Sampling Variability. Educ. Psychol. Meas. 76 (1), 114–140. doi:10.1177/0013164415584576
Drasgow, F. (1987). Study of the Measurement Bias of Two Standardized Psychological Tests. J. Appl. Psychol. 72 (1), 19–29. doi:10.1037/0021-9010.72.1.19
Hagquist, C., and Andrich, D. (2017). Recent Advances in Analysis of Differential Item Functioning in Health Research Using the Rasch Model. Health Qual. Life Outcomes 15 (1), 181. doi:10.1186/s12955-017-0755-0
Pae, T.-I. (2004). DIF for Examinees with Different Academic Backgrounds. Lang. Test. 21 (1), 53–73. doi:10.1191/0265532204lt274oa
Raju, N. S., van der Linden, W. J., and Fleer, P. F. (1995). IRT-based Internal Measures of Differential Item Functioning of Items and Tests. Appl. Psychol. Meas. 19 (4), 353–368. doi:10.1177/014662169501900405
Rasch, G. (1961). “On General Laws and the Meaning of Measurement in Psychology,” in Proceedings of the Fourth Berkeley Symposium on Mathematical Statistics and Probability IV. Editor J. Neyman (Berkeley: University of California Press), 321–334.
Rasch, G. (1980). Probabilistic Models for Some Intelligence and Attainment Tests. Copenhagen: Danish Institute for Educational Research. Expanded edition (1980) with foreword and afterword by B. D. Wright (1980). Chicago, IL: University of Chicago Press.
Takala, S., and Kaftandjieva, F. (2000). Test Fairness: A DIF Analysis of an L2 Vocabulary Test. Lang. Test. 17 (3), 323–340. doi:10.1177/026553220001700303
Keywords: psychometrics, Rasch model, invariance, differential item functioning (DIF), systematic DIF, subset DIF
Citation: Humphry S and Montuoro P (2021) The Rasch Model Cannot Reveal Systematic Differential Item Functioning in Single Tests: Subset DIF Analysis as an Alternative Methodology. Front. Educ. 6:742560. doi: 10.3389/feduc.2021.742560
Received: 16 July 2021; Accepted: 01 November 2021;
Published: 23 November 2021.
Edited by:
Zi Yan, The Education University of Hong Kong, Hong Kong SAR, ChinaReviewed by:
Jason Fan, The University of Melbourne, AustraliaLokman Akbay, Istanbul University-Cerrahpasa, Turkey
Copyright © 2021 Humphry and Montuoro. This is an open-access article distributed under the terms of the Creative Commons Attribution License (CC BY). The use, distribution or reproduction in other forums is permitted, provided the original author(s) and the copyright owner(s) are credited and that the original publication in this journal is cited, in accordance with accepted academic practice. No use, distribution or reproduction is permitted which does not comply with these terms.
*Correspondence: Stephen Humphry, c3RlcGhlbi5odW1waHJ5QHV3YS5lZHUuYXU=