 Morgan S. Polikoff
 Daniel Silver
- Rossier School of Education, University of Southern California, Los Angeles, CA, United States
Research has shown that officially-adopted textbooks comprise only a small part of teachers’ enacted curriculum. Teachers often supplement their core textbooks with unofficial materials, but empirical study of teacher curriculum supplementation is relatively new and underdeveloped. Grounding our work in the Teacher Curriculum Supplementation Framework, we use data from two state-representative teacher surveys to describe different supplement use patterns and explore their correlates. (We use RAND’s American Teacher Panel survey of K-12 ELA teachers, representative of Louisiana, Massachusetts, and Rhode Island, and Harvard’s National Evaluation of Curriculum Effectiveness survey of fourth and fifth grade math teachers, representative of California, Louisiana, Maryland, New Jersey, New Mexico, and Washington.) We find evidence of four distinct supplement use patterns. We then predict each pattern, producing sparse models using the lasso estimator. We find that teacher-, school-, and textbook-level characteristics are predictive of teachers’ supplement use, suggesting that it may be affected by structures and policies beyond the individual teacher. We recommend researchers use consistent measures to explore the causes and consequences of supplementation.
Introduction
Curriculum materials are centrally important to the work of a teacher. Textbook contents are hotly debated in the political sphere (e.g., Stewart, 2014), and notions of expert teaching often go hand-in-hand with imaginative, adept use of curriculum materials (Ball and Cohen, 1996). Academic inquiry has shown that curriculum materials can impact how teachers teach (Remillard, 2005) and what students learn (Agodini and Harris, 2010; Bhatt and Koedel, 2012; Jackson and Makarin, 2018), while being less expensive than some other policy reform levers (Chingos and Whitehurst, 2012).
While curriculum materials are widely used across the U.S. and can impact student learning, research has shown that teachers’ “enacted curriculum”—what actually gets taught to students—frequently diverges from the “written curriculum,” the contents of their textbooks (Tarr et al., 2006). Even when schools and districts leave teachers little official autonomy around what curriculum materials they use, they typically expect teachers to differentiate their curriculum to match their students’ perceived needs, in accordance with widely-accepted best teaching practices (e.g., Danielson, 2007; Marzano, 2010). Perhaps in light of this expectation, officially-adopted textbooks today comprise just a small part of teachers’ enacted curriculum. Recent research on teachers’ curriculum use concludes that “the curricula provided to teachers likely have a loose relationship with which curricula teachers use for the majority of their instruction” (Kaufman et al., 2020, p. 36). Education survey data show that teachers frequently supplement their core textbooks with unofficial curriculum materials, typically either self-created or downloaded from the Internet (Opfer et al., 2016; Blazar et al., 2019). Broadly, these studies indicate that over two-thirds of U.S. teachers supplement regularly, and there is evidence that certain widely-used online supplements may be of suspect academic quality (Polikoff and Dean, 2019). Given the prevalence of supplementation and its role in the enacted curriculum in most U.S. classrooms, there is a great need for both conceptual and empirical work on teachers’ curriculum supplementation.
Although researchers have identified and measured supplementation along a number of dimensions, a relatively small number of studies have attempted to describe the factors associated with teachers’ curriculum supplementation behaviors. Wang and colleagues (2021) used linear probability models to predict teachers’ reasons for supplementation, finding that a nationally-representative sample of teachers’ perceptions of their officially-adopted curriculum materials as engaging, challenging, and usable negatively predicted a number of common reasons for supplementation. Kaufman and colleagues (2020) predicted teachers’ curriculum use patterns (terming them: “by-the-book,” “DIY,” “modifier,” or “cobbler”) as a function of a number of school-level contextual factors using multinomial logistic models. They found that school-level focus on curriculum use positively predicted “by-the-book” use patterns and negatively predicted “DIY” use patterns. While that study used mainly school-level factors to predict teachers’ use patterns, (Torphy et al., 2020) found that both school-level and individual-level factors predicted teachers’ broad supplementation behaviors on Pinterest. (For a more comprehensive review of literature relevant to teachers’ curriculum supplementation, see Silver, in press.)
Existing empirical studies have investigated school-level factors associated with teachers’ supplement use patterns and have provided evidence that factors at other levels may affect how teachers supplement. The current study contributes to this literature by introducing a set of use patterns specific to supplemental materials and predicting those use patterns using teacher-level, school-level, and textbook-level factors. This is the first study to simultaneously explore the relationships between supplementation and factors at these three levels. We use two recent large-scale, state-representative surveys to investigate U.S. teachers’ curriculum supplementation: the 2019 Curriculum Use Supplement to the American Teacher Panel survey (ATP) from RAND and the 2017 National Evaluation of Curriculum Effectiveness survey (NECE) from the Harvard Center for Education Policy Research. Specifically, we draw on the Teacher Curriculum Supplementation Framework (TCSF; Silver, in press) in asking:
1) What are teachers’ common supplement use patterns?
2) To what extent are these use patterns meaningfully distinct?
3) What teacher-level, school-level, and textbook-level factors predict each use pattern?
Broadly, we find evidence of multiple meaningfully distinct supplement use patterns across the two surveys. The existence of distinct, supplement-specific use patterns suggests that future research on supplements’ effectiveness should take teachers’ use patterns into account, as suggested by the TCSF.
We find that supplement use patterns are predicted not only by teacher-level factors, but also by school-level and textbook-level factors, indicating that these patterns are not simply functions of teachers’ idiosyncratic decision making. If supplementation were a purely idiosyncratic process, this study would be of little use to educational leaders looking to improve instruction in their own schools and districts. That school-level characteristics (like student demographic makeup, for instance) also predict how teachers use their supplemental materials carries important policy implications, which we discuss.
Theoretical Framework
Supplementation has often been shoehorned into larger theories of curriculum use or related constructs like curriculum adaptation (Riling and Dietiker, 2018) or curation (Gallagher et al., 2019). However, these theories often fail to capture important aspects of teachers’ curriculum supplementation.
The current study is an application of the Teacher Curriculum Supplementation Framework (TCSF), which conceives of supplementation as: any premeditated, additive change a teacher makes to their official curriculum materials. Under this framework, teachers are assumed to act rationally (i.e., they have reasons for their decisions) but not necessarily to act in the best interests of their students’ learning, a point of departure from some other frameworks of teacher curriculum use (e.g., Caniglia and Meadows, 2018; Gallagher et al., 2019; Sawyer and Dredger et al., 2020a). Teachers often supplement their official curriculum materials to help their students learn, but may also supplement for many other reasons, including to save time or to inject new kinds of activities into their instruction. Following from this conception of teachers, the TCSF maintains that curriculum supplementation as a whole is neither “good” nor “bad” for students, but that certain instances of supplementation may tend to have positive or negative effects on students and teachers. Specific instances of teacher curriculum supplementation are identified along four dimensions, identified following an extensive review of the recent supplementation-relevant literature: reasons for supplementation, supplement sources, supplement features, and supplement use patterns. Only by considering these four dimensions together and in context can we confidently determine the effects of a supplement on students and teachers. Figure 1 provides a graphic summary of the TCSF. For a full review of the literature and introduction to the framework, see Silver (in press).
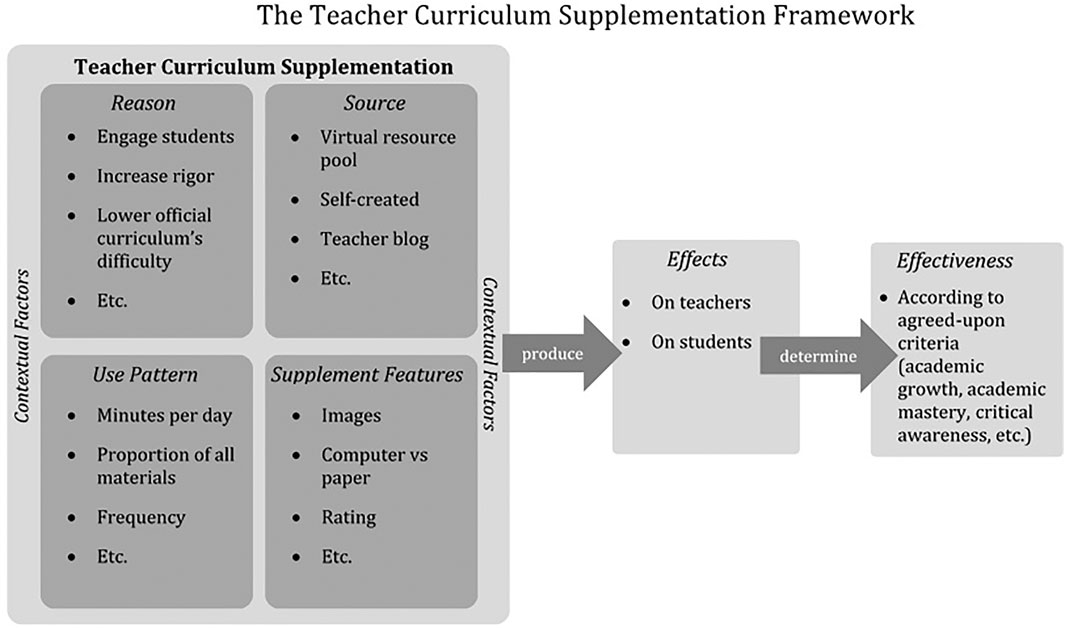
FIGURE 1. The Teacher Curriculum Supplementation Framework (Silver, in press).
While all four dimensions of supplementation (reasons, sources, features, and use patterns) are worthy of study, this project focuses on one particularly understudied dimension of the framework: supplements’ use patterns. We identify common use patterns as well as a set of teacher, school, and textbook characteristics that predict them. However, we acknowledge at the outset that ours is not an exhaustive list of characteristics that may predict teachers’ supplementation patterns. For instance, individual student characteristics and neighborhood contextual characteristics may also predict these patterns. Within the TCSF, it is essential to understand and measure teachers’ common supplement use patterns now, so future inquiry can establish which use patterns commonly co-occur alongside other dimensions of supplementation (reasons, sources, and supplement features) and can eventually determine which use patterns tend to produce the best outcomes for students, overall.
Materials and Methods
Data
Here, we will briefly outline our two survey data sources, providing descriptions of the surveys themselves and of any variables we constructed for this analysis. The datasets we analyzed are proprietary and were accessed via exclusive data use agreements. See Data Availability Statement for contacts to obtain data use agreements.
Our first data source is a supplemental section of the March 2019 American Teacher Panel (ATP) survey administered by RAND to state-representative samples of English Language Arts teachers in Louisiana, Massachusetts, and Rhode Island. (For more information about the general ATP survey, see Kaufman et al., 2018.) There are 774 Kindergarten through high school teachers across 643 schools in the ATP sample we use. The ATP survey supplement asks questions about teachers’ curriculum use and their context, background and beliefs, but does not ask teachers directly about supplementation. Because middle school and high school teachers may teach multiple sections of English Language Arts courses, the ATP survey instructs respondents to answer all questions “about a typical English language arts (ELA) class you currently teach (i.e., a class that best represents the majority of students you teach).”
Our second data source is the 2017 National Evaluation of Curriculum Effectiveness (NECE), a representative six-state survey of fourth and fifth grade math teachers conducted by Harvard University’s Center for Education Policy Research. It surveys one thousand teachers (N = 1,208) across 349 schools in California, Louisiana, Maryland, New Jersey, New Mexico, and Washington about their curriculum use and teaching background. Because elementary teachers are rarely departmentalized (i.e., they typically teach all subjects to their class), the NECE does not instruct teachers to focus on any particular math section (For more information on the NECE, see Blazar et al., 2019.). We believe the fact that the NECE focuses on math instruction and the ATP focuses on ELA instruction improves the generalizability of this work, although the different foci do limit our ability to compare findings from the NECE to findings from the ATP, as we note in the Discussion section.
Both surveys include questions relevant to curriculum supplementation as well as characteristics of teachers, schools, and the official curriculum materials themselves. All survey responses are also linked to a school ID, so we are able to connect teachers’ responses to further data about their school contexts using the National Center for Education Statistics Common Core of Data. Survey responses also include each teacher’s school-provided textbook, so we also connect each response to a measure of curriculum quality from EdReports, an organization that reviews and rates K-12 textbooks. We use these survey data to understand who supplements and how. All outcome variables (i.e., potential supplement use patterns) are summarized in Table 1, and all predictors are summarized in Supplementary Table 1.
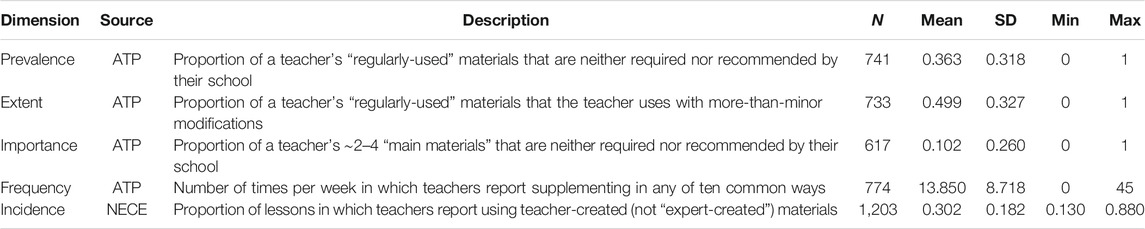
TABLE 1. Supplement use pattern descriptions and summary statistics.
American Teacher Panel Outcome Variables
Survey questions from the ATP suggest four potential supplement use patterns along which teachers might plausibly vary, which we name “prevalence,” “extent,” “importance,” and “frequency.” This section describes the survey items that inform each and gives brief examples of how each use pattern might appear in teachers’ practices. Each measure of supplement use is summarized in Table 1.
One reasonable starting point for measuring supplement use is to determine how many of a teacher’s curriculum materials are in fact supplements. ATP survey respondents were asked which of about 60 (elementary teachers were presented with 73, middle school teachers with 66, high school teachers with 49) common paper and digital materials they “use regularly (once a week or more)” for instruction. Teachers were also given the option to write in additional regularly-used materials if theirs were not on the list. The next survey question asked teachers whether each of their regularly-used instructional materials was “required,” “recommended but not required,” or “not recommended or required” by their school or district. Since teachers’ perceptions of how mandatory a school’s recommendation is may vary, we flagged any material that was recommended or required as “official” and any material that was neither as a supplement. We then calculated the proportion of materials a teacher claimed to use “regularly” that were supplements by this definition as a measure of the prevalence of supplementation in a teacher’s practice. (For example, a teacher who indicates using 10 items regularly, three of which are neither recommended nor required, has a prevalence of supplementation score of 0.3.)
However, there may be teachers who use their school-provided textbook almost exclusively to guide instruction, but make major modifications to the lessons they deliver, perhaps by creating their own supplemental resources or borrowing from a colleague. Such teachers would receive low scores on our prevalence measure, but labeling them as low supplementers does not acknowledge the modifications they make. Another ATP survey question asked teachers, “Of the ELA instructional materials you indicated using regularly, please indicate the extent to which you modify them for a typical class you teach.” For each material teachers had earlier indicated using regularly, they could respond that they use the materials with “no or few modifications,” “some modifications (changes to less than half of activities),” “major modifications (changes to more than half of activities),” or “only as a reference to get ideas for my own lesson plans.” We classified any regularly-used material a teacher reported using with “no or few modifications” as “unmodified” and all other materials as “modified.” We calculated the proportion of “modified” materials a teacher reports using regularly as the extent of supplementation that teacher engages in.
But it is also possible that a teacher uses many materials that are neither recommended nor required by their school or district (high prevalence of supplementation) or makes major changes to some of their school-provided materials (high extent of supplementation), but that the majority of instructional minutes are spent delivering content from an official textbook, unmodified. While the two measures detailed above would flag this teacher as a high supplementer, their students’ in-class learning experience would not involve much supplementation at all. While we do not have data on instructional minutes to capture this dimension of supplementation fully, ATP survey respondents were asked, “Of the ELA curricula and digital materials you indicated using regularly, please choose the main material you use the most.” (Teachers were actually allowed to choose more than one “main material” and no one who responded to the question chose fewer than three.) We calculated the proportion of main materials that were supplements (as defined in discussion of the prevalence of supplementation measure) as a measure of the importance of supplementation to that teacher’s practice.
The above measures of prevalence, extent, and importance of supplementation are three ways to measure a teacher’s level of supplementation, but they do not address how often a teacher supplements. A teacher might have a relatively high proportion of materials that are supplements (high prevalence) and might consider those supplements very important to their practice (high importance) or might make large modifications to certain materials before using them (high extent), yet that teacher might only use these supplements or modified materials quite rarely. For this reason, it may also be important to measure how often teachers supplement. The ATP survey asked teachers, “How frequently do you make the following types of modifications to your main ELA instructional materials?” and provides nine common reasons a teacher might supplement, listed in Supplementary Table 2, as well as an ‘other' option. Teachers indicate how often they make each type of modification, on a five-point scale from “Do not make this type of modification” to “For nearly every lesson.” Assuming five school days per week, we coded “Do not make this type of modification” as zero times per week, “Less than once a week” as half a time per week, “Once a week” as one time per week, “two to three times per week” as 2.5 times per week, and “For nearly every lesson” as 4.5 times per week. We then totaled the total number of times per week that a teacher reported any of these to create a measure of a teacher’s frequency of supplementation, the number of times per week that a teacher engages in any of the ten supplementing behaviors. Importantly, this measure does not account for the number of different supplementation strategies a teacher uses, only the frequency with which they are used. For example, a teacher who reports “add[ing] enrichment activities” with a frequency of “one time per week” (and reports no other supplementation) would have a frequency of supplementation of 1. A teacher who reports “add[ing] enrichment activities” with a frequency of “less than once a week” and “add[ing] remediation activities” with a frequency of “less than once a week” would also have a frequency of supplementation score of 1, since each “less than once a week” is coded as 0.5. It may be useful, then, to think about frequency of supplementation as the teacher’s frequency of engaging in supplementation, not necessarily their students’ frequency of experiencing it. Note that unlike the other measures, frequency of supplementation is a count, not a proportion.
National Evaluation of Curriculum Effectiveness Outcome Variable
Our main outcome of interest from the NECE is a measure of the proportion of lessons in which teachers used materials created by themselves or a fellow teacher. Teachers were asked, “Over the 2016–2017 school year, in what percentage of your lessons did you use each of the following instructional materials to plan or teach mathematics in [name of their main textbook]?” Teachers rated how often they used each of nine material types (e.g., “state, district, or charter-produced materials,” “materials you created yourself or with colleagues at your school,” etc.) on a five-point scale from “Never: 0% of lessons” to “Nearly every lesson: ≥75% of lessons.” From these nine items, we averaged four to create our supplementation measure: the frequency with which teachers use online lesson repositories (i.e., virtual resource pools or private teacher blogs), materials they created themselves, materials created by colleagues at their school, or materials in their personal library but not provided by their school. These four items were the most conceptually similar to existing definitions of supplementation, and they also emerged in an exploratory factor analysis as being closely related to the main factor (i.e., all with factor loadings >0.75). This outcome measures the incidence (we call it incidence of supplementation) with which teachers use teacher-chosen or teacher-created materials, whether downloaded from the Internet or borrowed from down the hall. Incidence of supplementation is summarized in Table 1.
Supplementation Predictors
Both the NECE and ATP surveys collect data about the backgrounds of survey respondents. Because our analysis is exploratory in nature, we decided to include in our initial analyses any predictor that might relate to supplementation. We then built models with fewer predictors as part of our analysis, detailed below. All predictors fall into one of three categories: teacher characteristics, school characteristics, and textbook characteristics. Both surveys also include a unique School ID for each respondent, so we were able to link survey responses to a number of school-level predictors available from the National Center for Education Statistics Common Core of Data. Both surveys also indicate which textbook each teacher’s school has officially adopted. We are able to include indicators for specific textbooks in our models, but more importantly, we include in our models ratings of standards-alignment from EdReports. EdReports is an independent organization that reviews and rates textbooks’ alignment to the Common Core Standards. These alignment ratings are often used to proxy for textbook quality (e.g., see Opfer et al. (2018)), which allows us to speculate as to which dimensions and predictors of supplementation may be associated with helpful versus harmful supplementation. Supplementary Table 1 lists all predictors we use in our analyses and indicates the source of each predictor. Note that the two surveys often collect analogous data, but some relevant predictors are only available for respondents to one of the two surveys.
Methods
Research Question 1: In What Ways Can We Measure Supplement Use Patterns?
With some thought, a person could come up with tens of different ways to measure teachers’ supplement use. We do not claim to have an exhaustive taxonomy or even a representative list of the ways researchers might conceive of and measure these use patterns. Rather, we seek to establish that there are a number of ways to measure these patterns, so researchers and practitioners who study and engage with supplementation can account for this complexity in future work and communicate about it more clearly. The survey items in the ATP and NECE limited our analysis to just five main supplement use patterns, briefly described in Table 1.
To answer Research Question 1, we calculate a score for each respondent in the relevant dataset for each of the potential supplement use patterns. We report summary statistics and describe the degree of variation in the datasets for each. Where the data allow it, we calculate intraclass correlation coefficients to partition the variance in each use pattern within and between schools.
Research Question 2: Are These Use Patterns Meaningfully Distinct?
We next turn to the question of whether the different potential supplement use patterns are in fact distinct or whether they all measure essentially the same thing. To accomplish this, we analyze the discriminant validity of the use patterns under study. We calculate bivariate correlations between each pair of use patterns, then examine the pattern of correlations to assess the extent to which the correlations accord with the conceptual meanings of these patterns (e.g., Holton et al., 2007). If two (or more) use patterns measure the same thing, as indicated by a large and significant bivariate correlation, then we need not treat them as separate supplement use patterns. If the bivariate correlations are small in magnitude or nonsignificant, we will take this as evidence that the measures represent distinct supplement use patterns, in practice.
Research Question 3: What Factors Predict Each Use Pattern?
A typical approach to address this question would be a set of multilevel models (teachers nested within schools) including all relevant predictors with the supplement use patterns as the outcomes. Theory and past research would guide inclusion or exclusion of predictors in each model. However, existing theory on supplementation is broad and empirically underdeveloped; reasonable arguments could be made for the inclusion of any of the predictors in Supplementary Table 1, and the research that attempts to predict curriculum use from teacher, school, or textbook characteristics is scant. This type of problem, with many potential predictors and little empirical base, is fairly rare in education research. However, it is a fairly common issue in many machine learning applications where datasets (and the number of predictors therein) can be massive and topics under study can be quite new and therefore understudied. Thus, we borrow from machine learning methods in applying the lasso (“least absolute shrinkage and selection operator,” see Tibshirani, 1996), a regularized regression estimator with variable selection properties that we harness to address this research question. Specifically, we will fit a lasso and a relaxed lasso model for each supplement use pattern, compare each model to its traditional counterpart, and discuss the relaxed coefficients substantively. In the next sections, we provide a brief introduction to the lasso and a more detailed description of how we built our models.
The Lasso
Regularized regression methods were developed to address the tendency of OLS (and closely-related models) to give results that overfit to sample data and generalize poorly to new samples.1 However, certain regularized models also have “sparse” properties—the model itself performs some variable selection.
Perhaps the most common regularized regression model, and the one we use in this analysis, is the lasso, which uses the sum of the absolute values of the OLS coefficients as a regularization term, as shown in Eq. 1.
Equation 1. Lasso Estimator.
The first term in Eq. 1 is simply the OLS solution – the sum of squared residuals. The second term is the sum of the absolute values of the OLS coefficients multiplied by a constant (called a “tuning parameter”). When the tuning parameter is 0, the lasso solution simplifies to the OLS solution. The higher the tuning parameter, the greater impact the regularization term has on the lasso coefficients. We select the optimal tuning parameter via cross-validation, discussed later. Key to the lasso is the fact that the regularization term uses absolute values of the OLS coefficients (as opposed to, say, squared values, as in ridge regression), which results in some coefficients being set to exactly zero, equivalent to dropping those variables from the model. The lasso, then, is an ideal analytic tool for us in this instance because solving the lasso results in variable selection, giving an indication for which predictors “belong” in the model and which do not. Of course, we do not claim that the lasso’s variable selection is a substitute for theory-driven model building. Rather, in a context like ours, where existing empirical work is sparse, the lasso’s variable selection provides a useful starting point from which we hope to build a more robust understanding of supplementation’s specific predictors. For a more complete introduction to the lasso and its properties, see Hastie et al. (2015).
The lasso has to date been mainly used in machine learning applications in fields ranging from bioinformatics and ecology to finance, and has been used to model DNA variation related to coeliac disease (Wu et al., 2009), the effects of climate change on complex ecosystems (Aderhold et al., 2012), and the role of business news on stock prices (Hisano et al., 2013). The lasso’s use in the field of education is more limited, though it has been used to automatically classify how engaging the speakers in educational videos are (Mariooryad et al., 2014). Some have called for more widespread use of the lasso outside the natural sciences, noting that the method is well-suited to address many problems in the behavioral sciences (McNeish, 2015).
Our Lasso Models
We estimate two lasso models for each dimension of supplementation.2 The first is a true lasso model, and the second is what the lasso’s creators refer to as a “relaxed lasso” (Hastie et al., 2015). As noted above, getting the value of the tuning parameter in a lasso model correct (denoted by λ in Eq. 1) is essential because the magnitude of that parameter determines how many variables are dropped from the model. Choosing a λ-value of zero is equivalent to running an unregularized OLS model, where choosing a high enough λ-value will result in all predictors’ coefficients being excluded from the model, leaving just the intercept. Neither is a desirable outcome.
We do not simply guess-and-check to arrive at an optimal λ-value. Rather, we select a λ-value that minimizes our model’s out-of-sample prediction error. Because we do not have two sets of respondents to either survey, we simulate having two samples using cross-validation, a method common in machine learning applications. Essentially, before fitting any model, we partition our sample into two parts: about 80% of the full sample becomes the “training sample” to which the lasso model is fit. The other 20% becomes the “validation sample,” which is set aside during model fitting. The predictor values from this validation sample are then fed into the model, and the disparity between the model’s estimated outcome values and the actual outcome values for the validation sample (specifically, the mean square prediction error) is used to measure the “goodness” of the model. The value of λ that yields the lowest mean square prediction error is considered the optimal λ for that training sample/validation sample split.
Our algorithm performs this whole process (splitting the sample into training and validation groups, calculating mean square prediction error across many tuning parameter values, then selecting the optimal tuning parameter to minimize mean square prediction error) ten times, and we average the ten λ-values that yield the lowest mean square prediction errors to arrive at the λ term for our model. This process is called 10-fold cross-validation.3
It is important to note that because the regularization term includes the magnitudes of the regression coefficients, it (and crucially, the optimal λ-value) are sensitive to scales on which different variables are measured such that variables measured on smaller absolute scales (e.g., years of teaching experience) are penalized more than variables measured on larger absolute scales (e.g., minutes of teaching experience). To address this problem, we standardize each predictor and outcome to have zero mean and unit variance, placing them all on the same scale so variables are not dropped from the model simply due to their units of measure.
We believe the lasso is the correct model to use for our application, since our problem consists of a large number of plausible predictors in an under-theorized area. However, one major drawback of using the lasso is tied to its infrequent use, especially in fields like education. Because the lasso is little-used, lasso coefficients, which are based on standardized variables and whose magnitude is affected by the regularization term, are not readily interpretable to most education researchers. To address this problem, the lasso’s creators suggest building a “relaxed lasso model” (Hastie et al., 2015), which is simply an OLS model (or OLS-derived model) using only the predictors retained in a previously-fit lasso model. This “relaxed lasso” retains the lasso’s variable selection properties but produces easily interpretable coefficients, since they are neither standardized nor subject to the regularization term. In fact, the “relaxed lasso” provides less-biased estimates of in-sample effects than the traditional lasso precisely because its coefficients are not subject to the regularization term (Belloni and Chernozhukov, 2013). Our results tables include both a traditional and relaxed lasso model for each supplement use pattern, but we confine our discussion of coefficients to those from the more-interpretable relaxed models.
In using these models to address Research Question 3, we begin with an assessment of the lasso models relative to traditional models, touching on the degree of sparsity achieved and the degree of explanatory power retained versus traditional models after fitting the lasso (Table 2). We then present theoretically interesting substantive results retained in each lasso model (Tables 3–6), whether or not their coefficients meet standard thresholds of statistical significance. We depart somewhat from standard practice with this decision because this study has different goals than a typical, hypothesis-testing study. Generally, treatments of statistical significance come from a hypothesis-testing paradigm, where minimizing Type I error is more important than minimizing Type II error. That is, it is usually more important to ensure that the only conclusions drawn about nonzero relationships are correct ones than to ensure that all potential nonzero relationships are identified. Fundamental to this project, though, is a lack of empirical base. We hope to provide exploratory evidence about predictors of teachers’ supplement use patterns, which can be taken as a starting point by future studies informed by the Teacher Curriculum Supplementation Framework (Silver, in press). Because we aim to build, not test, hypotheses with these models, it is more important for us to minimize Type II error than Type I. More concretely, at this early stage, failing to consider a potentially important predictor of supplement use is a larger concern for us than considering an unimportant predictor. After discussing substantive results from each model in isolation, we attempt to draw conclusions across models and point out potentially-fruitful areas for future inquiry.
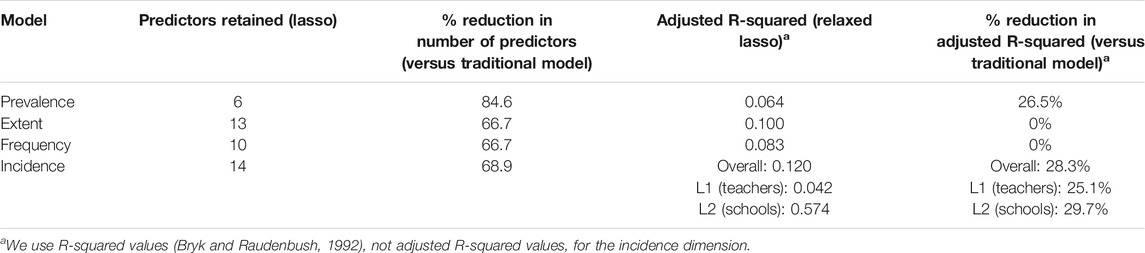
TABLE 2. Comparison of lasso models to traditional models.
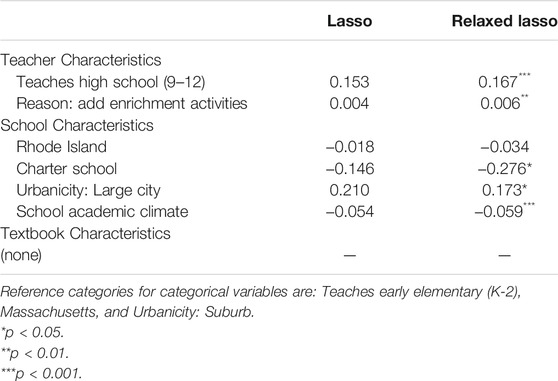
TABLE 3. Prevalence of supplementation. Proportion of a teacher’s “regularly used” materials that are neither required nor recommended by their school.
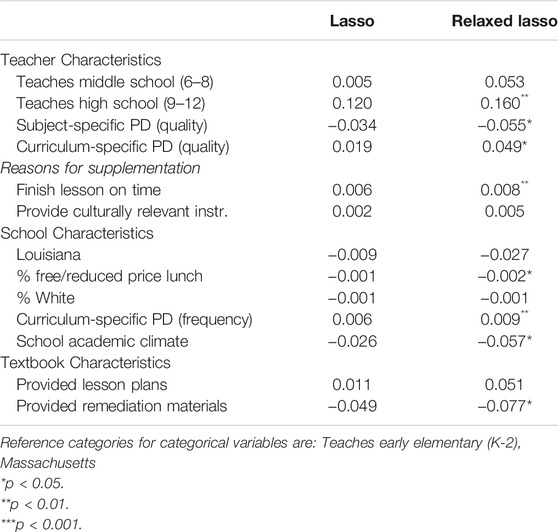
TABLE 4. Extent of supplementation. Proportion of a teacher’s “regularly used” materials that are used with more-than-minor modifications.
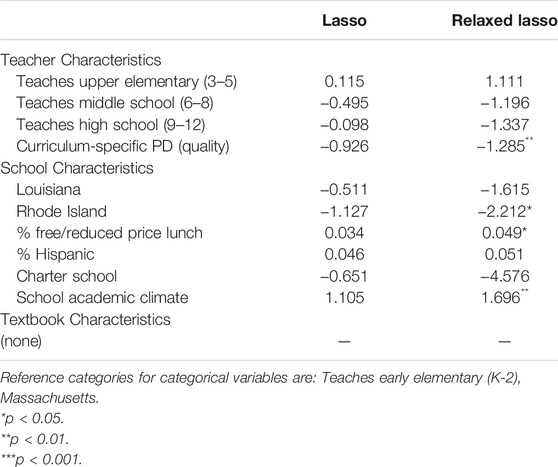
TABLE 5. Frequency of supplementation. Number of lessons per week in which teachers report any of ten common supplementation behaviors.
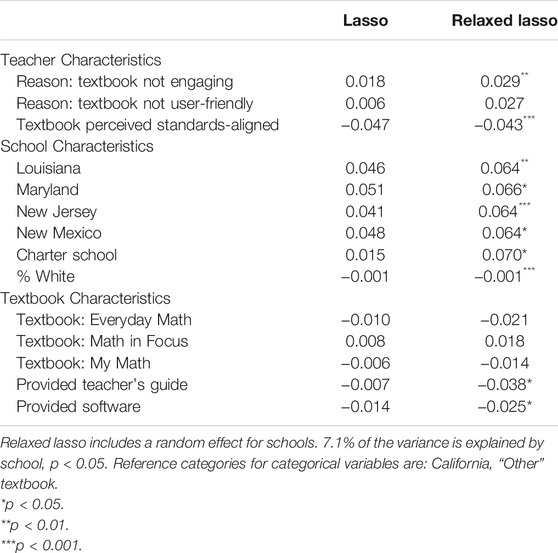
TABLE 6. Incidence of supplementation. Proportion of lessons in which teachers report using teacher-created (not “expert-created”) materials.
Results
Research Question 1: Supplement Use Patterns
Given the hierarchical structure of our data (teachers within schools), we began by fitting an unconditional multilevel model to our data for each use pattern. Schools did not explain a significant proportion of the variance in any dimension of supplementation from the ATP data (likely due to the low average number of respondents per school), but did explain a significant proportion (14.64%) of the variance in the incidence of supplementation measure, drawn from the NECE survey. Therefore, after fitting lasso models for each outcome, we use classic OLS models as our “relaxed lasso” models of prevalence, extent, and frequency of supplementation, but we use a multilevel model (teachers nested within schools) for our “relaxed lasso” model of the incidence of supplementation.
Table 1 shows univariate summary statistics for each supplement use pattern in our data. Approximately 36% of teachers’ regularly-used materials in the ATP sample were supplements, though there were teachers who reported that anywhere from none to all of their regularly-used materials were supplements. About half of teachers’ regularly-used materials are used with modification and half without. About 10% of teachers’ most important materials were supplements, though again there were teachers in the ATP sample who reported that anywhere from none to all of their most important materials were supplements. Teachers in the ATP sample report engaging in any of ten common supplementation behaviors just under 14 times per week, with some never making these types of modifications and others making them up to 45 times per week. Finally, teachers in the NECE sample report supplementation in just over 30% of lessons, with some teachers reporting supplementation as few as 13% of lessons, and others in as many as 88%.
The histograms in Figure 2 show the full univariate distribution for each use pattern. Several patterns are apparent from the histograms. First, there is considerable variation along each use pattern except importance. For importance, over 80% of the ATP sample reports that none of their most important few materials are supplements. Given this lack of variation, we exclude this use pattern from the next two research questions. Second, the modal response is zero for prevalence and incidence, while for extent, there are three rough modes—0, 0.5, and 1.0. These modes likely stem from how the extent question was phrased in the survey, with teachers reporting along a three-point scale corresponding to no modifications, some modifications, or major modifications of lessons as opposed to reporting along a continuous scale. Third, frequency is by far the most normal distribution, with relatively few teachers reporting zero supplementation and median, mean, and mode all near each other. From these results, we conclude that there is considerable variation along all of our proposed supplement use patterns except importance.
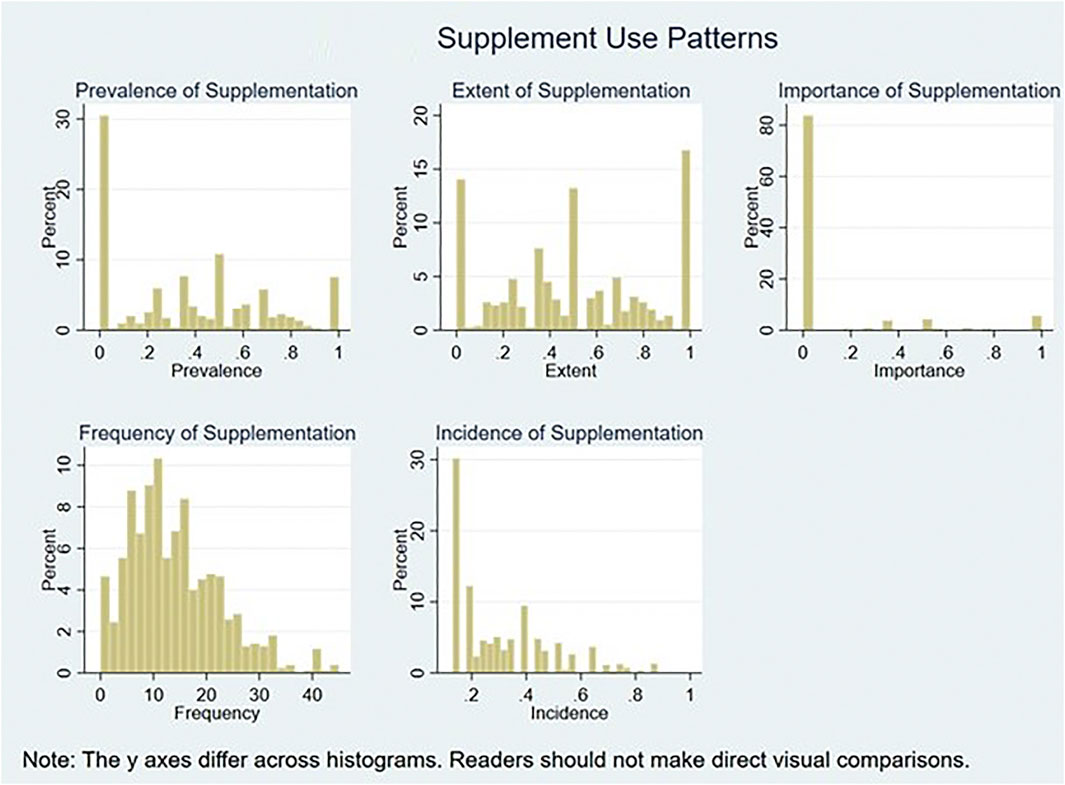
FIGURE 2. Histograms of teacher supplement use patterns.
Research Question 2: Distinction Between the Supplement Use Patterns
Four of five supplement use patterns we identify from the surveys show considerable variation in the sample, but we cannot be certain they measure different use patterns based only on univariate analyses. We assess the dimensions’ discriminant validity using bivariate correlations, with the results shown in Table 7 (we exclude the incidence pattern because it is from a different survey). Of these three correlations, two are statistically nonsignificant, and the correlation between the extent and frequency patterns has a small Pearson’s r (about 0.17). Because we find that different classes of characteristics seem to reliably predict each supplement use pattern (detailed in the next section), it is unlikely that this lack of correlation is attributable solely to measurement error. Therefore, we take the lack of correlation as evidence of three distinct use patterns, where teachers who score highly on one do not tend to score highly on any other.
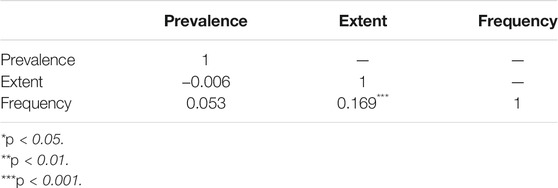
TABLE 7. Bivariate correlations among supplement use patterns from ATP.
Research Question 3: Predictors of Supplement Use Patterns
Based on the above analyses, we find the prevalence, extent, and frequency use patterns to be meaningful and distinct. The incidence pattern from the NECE survey is also meaningful (Research Question 1), but we have no way of assessing its divergent validity relative to the patterns from the ATP survey (Research Question 2). To address Research Question 3, we fit a model to predict incidence as though it were distinct, though we acknowledge that because it comes from a different survey than the other patterns, there is a possibility that it in fact measures the same thing as one of them. This is a limitation that future work should clarify.
Comparison of Lasso to Traditional Models
As described above, we fit a lasso model, then a relaxed lasso model (either OLS or a multilevel model, using only the predictors retained in the lasso) for each dimension. Because the lasso is not commonly used in education research, we begin our discussion with a comparison of each relaxed lasso model to the corresponding to traditional model: OLS for the prevalence, extent, and frequency use patterns and a multilevel model (teachers within schools) for the incidence use pattern. These traditional models are presented in Supplementary Tables 3a, 3b for reference. Here, we discuss both the variable selection and any accompanying reduction in predictive power for the lasso models relative to traditional models.
Table 3 presents the results of this comparison of the lasso to more traditional models for this analysis. The lasso models display a 67–85% reduction (mean = 72%) in the number of predictors retained in the model. To achieve this sparsity, we accept a reduction to in-sample predictive power of about 25% for the prevalence and incidence4 dimensions, but the adjusted R-squared values for both the extent and frequency use patterns are actually higher than the analogous statistics for traditional OLS models that include all predictors, even after reducing the number of predictors by two-thirds. This implies that these lasso models have more in-sample explanatory power than the traditional models, probably due to the inclusion of many spurious predictors in the traditional models.
Satisfied with the sparsity achieved in the lasso models relative to traditional ones, we will move on to discuss the models themselves. Because we are more concerned with minimizing Type II error than Type I error for this project, we will discuss interesting results whether or not they reach conventional thresholds for statistical significance, as noted above.
For parsimony, the results tables we discuss here only include predictors that were retained in the lasso models. To view a detailed list of all predictors entered into the models, see Supplementary Table 1. For easier visualization of which predictors were retained in the lasso models and which were not, see Supplementary Tables 4a (ATP use patterns) and 4b (NECE use patterns).
Prevalence of Supplementation
In Table 4, high school teachers report that 16.7 percentage points more of their regularly-used materials are supplements than early elementary teachers. This is unsurprising, given that a typical high school ELA class may not even use an official textbook, relying on a primary work of literature as their main text. Teachers who report supplementing to add enrichment activities to the textbook report higher prevalence of supplementation as well, while those who supplement to add remediation activities report lower prevalence of supplementation.
At the school level, teachers in urban settings report 17.3 percentage points higher prevalence of supplementation relative to teachers in suburban ones. Charter school teachers report 27.6 percentage points lower prevalence of supplementation relative to non-charter teachers, indicating that charter schools may centralize control over curriculum at the school level more than district schools. An additional point on the four-point school academic climate scale is associated with 5.9 percentage points lower prevalence of supplementation, suggesting that teachers who believe academics at their school are strong seek out fewer supplementary materials as a proportion of their total materials.
No textbook-level characteristics were retained in the prevalence model, indicating that publisher-provided resources may not have much of an impact on the proportion of a teachers’ regularly-used materials that are supplements.
Extent of Supplementation
Middle and high school teachers report making modifications to 5.3 and 16 percentage points more of their regularly-used materials than early elementary teachers, respectively (Table 5), a pattern that also emerged in the prevalence dimension. Each additional point of quality for teachers’ ELA-specific professional development (on a four-point scale) is associated with about 5.5 percentage points lower extent of supplementation, indicating that strong materials and expertise may relate to making fewer modifications to materials. Perhaps surprisingly, then, teachers who have an additional instance of textbook-specific professional development per year report small effects in the opposite direction. One interpretation of this finding could be that more PD may make teachers comfortable enough with their textbooks that they feel empowered to make changes, where better PD helps teachers build expertise with the curriculum to the point that they do not feel the need to modify it.
Teachers in Louisiana report 2.7 percentage points lower extent of supplementation relative to Massachusetts, perhaps related to that state’s powerful standards-based policies compared to the relatively traditional local control education system in Massachusetts (e.g., Kaufman et al., 2016). Teachers at schools with a one-point higher academic climate (on a four-point scale) have 5.7 percentage points lower extent of supplementation, indicating that this use pattern may be more prevalent in lower-functioning schools.
Finally, teachers whose official curriculum includes remediation materials report 7.7 percentage points lower extent of supplementation, a finding consistent with the idea that teachers use publisher-provided materials in lieu of supplements, especially for remediation. Put differently, perhaps teachers modify official curriculum materials when those materials’ publishers provide inadequate resources for a teacher’s purposes.
Frequency of Supplementation
Upper elementary teachers in Table 5 report any of ten common supplementation behaviors 1.11 more times per week than early elementary teachers, although teachers of older students report engaging in those behaviors less frequently. An additional point on a four-point quality scale of curriculum-specific PD is associated with 1.29 fewer supplementation behaviors per week, indicating that teachers who perceive their professional development to be strong supplement their curriculum less frequently.
Charter school teachers report 4.58 fewer supplementation behaviors per week, a finding that mirrors the charter school difference on the extent use pattern. Each additional point on the four-point school academic climate scale is associated with 1.70 more supplementation behaviors per week, a finding in the opposite direction to the same one for the other dimensions. This may indicate that teachers who perceive their schools to be academically healthy engage in supplementation behaviors frequently, but do not count the supplements among their “regularly-used” materials. Teaching greater proportions of students who are Hispanic or who qualify for free or reduced lunch is associated with slightly greater frequency of supplementation. It may be that these groups tend to have more diverse needs, so their teachers may need to supplement more frequently to serve their learning needs (e.g., Kaufman et al., 2020).
No textbook-level characteristics were retained in the relaxed lasso model for frequency of supplementation.
Incidence of Supplementation
Unsurprisingly, the belief that one’s official textbook is more-aligned to educational standards is associated with using supplemental materials in fewer lessons, while beliefs that one’s textbook is either not engaging or not user-friendly are associated with higher incidence of supplementation (2.9 and 2.7 percentage points, respectively; see Table 6).
At the school level, state is a predictor of incidence of supplementation, with teachers in Louisiana, Maryland, New Jersey, and New Mexico reporting using supplemental materials in about 6 percentage points more lessons than teachers in California and Washington, where incidence of supplementation is similar. Teachers at charter schools report using supplemental materials in seven percentage points more of their lessons than teachers outside charter schools, a finding in the opposite direction as the analogous one for the other use patterns. This could be due to the subject different between the two surveys: perhaps math teachers at charter schools supplement more than math teachers at district schools, while ELA teachers exhibit the opposite pattern. As with the frequency dimension, student demographic measures predict very small changes in incidence of supplementation, with teachers in schools with a greater proportion of White students reporting slightly lower incidence of supplementation.
Mirroring findings from the ATP dimensions, teachers who are provided a teacher guide or software to use alongside their official textbook report about 3.8 and 2.5 percentage points lower incidence of supplementation, respectively. The specific textbook a teacher uses also seems to predict incidence of supplementation somewhat.
Discussion
Comparison Across Supplement Use Patterns
Given that our data come from two different surveys, making direct quantitative comparisons is not feasible, so we present a few qualitative impressions of how these use patterns may connect to and differ from one another. Prevalence of supplementation, the proportion of a teacher’s “regularly used” materials that are supplements, is most predicted by structural characteristics like school’s charter status and urbanicity, which implies that something like school culture may have an effect on the prevalence of teachers’ supplementation. Extent of supplementation, the extent to which teachers tend to modify their official curriculum before using, is more predicted by teacher-level characteristics, with the strongest predictor of a teachers’ extent of supplementation being grade level taught. Frequency of supplementation, the number of times per week that teachers engage in any of ten common supplementation behaviors, is more powerfully predicted by school-level demographic factors (i.e., proportion of students who qualify for free/reduced price lunch or who are Hispanic), indicating that particular student characteristics and needs may relate more to how often teachers supplement and less to how many supplements a teacher uses. Like prevalence of supplementation, incidence of supplementation (the proportion of lessons in which teachers report using teacher-created materials) is predicted most strongly by high-level structural characteristics, like U.S. state and charter status, suggesting that incidence may also be influenced by cultural norms that exist at the school level and above.
Links to the Teacher Curriculum Supplementation Framework
While this work is more exploratory than evaluative in nature, it still carries useful lessons for education researchers and school and district leaders interested in teacher curriculum supplementation. Despite high-level similarities, only four predictors appear in three or more of the four relaxed lasso models (grade level, state, charter school status, and school academic climate) and each dimension is predicted by contextual characteristics from at least two levels: teachers, schools, or the textbooks themselves. Finding wide variation in the predictors associated with each supplement use pattern is consistent with the Teacher Curriculum Supplementation Framework (TCSF), which maintains that supplementation can be conceived as an intersection of one or more use patterns (e.g., prevalence, extent, etc.), one or more reasons to supplement, one or more sources of supplementation, and one or more supplement features. However, our findings also suggest that teachers’ supplement use patterns vary with high-level structural factors like US state or school charter status, indicating that such factors may occupy a more central place in teachers’ real-world supplementation than they do in the theoretical framework and in current supplementation-relevant literature (e.g., Torphy et al., 2019; Tosh et al., 2021; Wang et al., 2021, with Kaufman et al., 2020 as a notable exception). Still, our findings suggest that teachers’ curriculum supplementation is predictable, not random or idiosyncratic. Taken together, all of this suggests that the teacher curriculum supplementation may be a more multidimensional phenomenon than it has often been conceived (Kaufman et al., 2020), so TCSF’s explicit framing of such supplementation as multi-dimensional may be a useful tool to frame researchers’ thinking about it, with future work aimed at testing various relationships hypothesized in the framework.
Practically, the TCSF implies a dizzying array of types of supplementation, so school and district policymakers seeking to change teachers’ supplementation behaviors (perhaps by changing the official curriculum or delivering targeted professional development) should not expect a uniform effect from any intervention. For example, professional development focused on a specific textbook may decrease teachers’ use of virtual resource pools as a source of supplementation or decrease their extent of supplementation (they may modify the textbook’s lessons less), but could increase their use of self-created supplements or their prevalence of supplementation (perhaps they begin to feel more connected to the curriculum and create a wide array of new in-class activities to enhance their students’ engagement).
The Value of Supplementation
The TCSF is clear that attempting to determine the value of supplementation as a whole, whether it should be encouraged or discouraged in general, is of little use. Supplementation is a complex phenomenon, and put tautologically, good supplementation is good and bad supplementation is bad. As researchers ultimately interested in improving student learning, then, it is our charge to determine which contexts, sources, use patterns, and features of supplementation tend to be “good” and which tend to be “bad.” Existing research has found that supplements from large online marketplaces tend to be of low academic quality (Hertel and Wessman-Enziger, 2017; Polikoff and Dean, 2019; Sawyer et al., 2019; Sawyer et al., 2020b), sometimes promote racist or sexist ideas (Hu et al., 2019; Rodriguez et al., 2020; Shelton et al., 2020), and may nudge teachers to view students more as human capital to be produced than as humans to be educated (Attick, 2017; Pittard, 2017; Bartell et al., 2019). Very little research exists that focuses on teachers’ supplement use patterns, so while we can speculate as to the possible value of some of the use patterns we outline, this study was designed to be exploratory, not evaluative, in nature. Determining more confidently which types of supplementation (i.e., which source/context/use pattern/feature combinations) tend to be most fruitful is an important direction for future work.
We do include a measure of textbook standards-alignment, a common proxy for curriculum quality, in our predictors for each supplement use pattern. We might speculate that any use pattern positively associated with higher-quality curriculum may be a “bad” sort of supplementation, since we might assume that higher-quality curricula are less likely to need supplementation. Surprisingly, this measure was not retained in any of the lasso models, indicating that standards-alignment of the official textbook is not a powerful predictor of the four supplement use patterns under study. (Of course, an indicator of standards-alignment is a crude measure of curriculum quality, so we caution against taking this finding as evidence that quality of a teacher’s official curriculum does not impact their supplementation patterns.) Speculatively, the extent use pattern may tend to align with “bad supplementation.” It is positively predicted by a teacher’s desire to get through their lesson in the allotted time, which may imply that teachers with high extent of supplementation are more concerned with “getting through” the content than with deeper academic considerations. Additionally, teachers with these reasons for supplementation commonly supplement using large online marketplaces (Polikoff and Dean, 2019; Silver, in press). The fact that supplements from such sources have been found to be lacking provides further evidence that high extent of supplementation may warrant a closer look as potentially unhelpful for students’ learning. This sort of speculation should be useful as a starting point for researchers looking to begin new projects related to teacher curriculum supplementation, but it should not be used to make decisions in schools or districts until further work in this area is done.
Limitations and Areas for Future Research
We see two main limitations of our research, each of which should be addressable in future work. The first is that we are limited by the survey samples have access to. Our work can only speak to the subject areas that were the focus of the two surveys (mathematics and ELA), and it may well be that teachers in other subjects supplement more or differently. Similarly, we can only report on supplementation in the set of states that were involved in these two studies, though the ATP also includes supplementation measures in some of its main national surveys. Working from teacher surveys also meant we did not have access to any measure of what are ultimately the most important outcomes: student learning and success. As an early exploratory study, the lack of student data did not keep us from addressing our research questions, but there is evidence that teachers’ supplementation strategies do relate to their students’ academic outcomes (Torphy et al., 2019), so future work in this area should certainly incorporate some measure of student success (academic, socioemotional, etc.) as a key outcome measure.
We are also limited by the survey items themselves—as mentioned above, there are undoubtedly other ways to measure supplement use patterns. There might also be concern about the self-reported nature of teacher survey responses as to supplementation. However, there is no particular reason to believe that these items would be subject to concerns about social desirability or theory-driven reconstructions (Ross, 1989; Ross and Conway, 1986), given that there is no obvious policy against supplementation and the vast majority of teachers report doing it. Furthermore, these measures follow best practices in survey studies of teachers’ instruction, such as asking about instruction over a fixed and recent period of time (Desimone et al., 2005) and using multiple items to construct scales where possible (Mayer, 1999).
There is a great deal more to know about teacher supplementation; we hope our study leads to deeper conceptualizations and more precise measurement of this phenomenon. Given the newness of the topic, there are opportunities for research in virtually any direction. But we see several lines of work as especially pressing. First, there is a need for deep, careful qualitative study of supplementation at a fine-grained level to help further tease out some of the relationships proposed in the TCSF. Second, survey researchers should begin to work toward common and consistent measures across studies, so that results can be compared across contexts and over time. Third, researchers need to tackle supplementation in other subjects and locales than what we could study here. Some have already started rigorous study of supplementation in other subjects, like US history (Harris et al., 2020) and civics (Rodriguez et al., 2020). Finally, and perhaps somewhat down the road, there is a need to understand the impact of supplementation on the quality and content of teachers’ instruction and on student learning.
Conclusion
Supplementation is popularly characterized as a mostly-individual phenomenon, with teachers forging off on their own, seeking materials other than what their system has provided. Our results suggest that this is not the full story. In fact, we find that teachers’ patterns of supplement use are predicted as or more powerfully by characteristics typically outside any one teacher’s control, like U.S. state, charter status, demographic makeup of the student body, or frequency of professional development. The fact that a relationship exists between supplementation and these characteristics implies that teachers’ supplementation may be sensitive to school, local, and state policies and norms. Because we believe any act of supplementation represents, at its core, a teacher’s desire to improve on their official curriculum materials for their students or themselves, we must continue to work to understand what exactly drives supplementation.
We hope the study of teacher curriculum supplementation can, on the one hand, shed light on the shortcomings of officially adopted curricula, so those products can be improved. On the other hand, we believe work in this area can empower decision makers in schools and districts to develop their teaching staff’s supplementation capabilities, so teachers are able to skillfully supplement their official curriculum materials to excite, engage, and serve the needs of their students without sacrificing instructional rigor.
Data Availability Statement
The data analyzed in this study is subject to the following licenses/restrictions: The datasets analyzed for this study were obtained via data use agreements with the RAND Corporation (ATP data) and the Harvard Center for Education Policy Research (NECE data). Requests to access the ATP dataset can be completed online at https://www.rand.org/education-and-labor/projects/aep/data-portal.html. Requests to access the NECE dataset should be directed to Jesse Dalton (jesse_dalton@gse.harvard.edu).
Author Contributions
MP and DS each contributed to the study’s conceptual design, data organization and preparation, data analysis, and manuscript preparation.
Conflict of Interest
The authors declare that the research was conducted in the absence of any commercial or financial relationships that could be construed as a potential conflict of interest.
Publisher’s Note
All claims expressed in this article are solely those of the authors and do not necessarily represent those of their affiliated organizations, or those of the publisher, the editors and the reviewers. Any product that may be evaluated in this article, or claim that may be made by its manufacturer, is not guaranteed or endorsed by the publisher.
Supplementary Material
The Supplementary Material for this article can be found online at: https://www.frontiersin.org/articles/10.3389/feduc.2021.722554/full#supplementary-material
Footnotes
1In brief, OLS is built to maximize within-sample explanatory power (the OLS solution minimizes the sum of squared residuals for a given sample), but maximizing within-sample explanatory capability naturally leads to a tendency to over-fit to particularities of a given sample, diminishing out-of-sample predictive power. Regularized regression models address this problem by introducing a small amount of bias (a “regularization term”) to the typical OLS solution. By introducing this term, regularized regression models essentially reduce the extent to which a model can use information from the sample to which it is being fit. This reduces the predictive power of such models within a sample relative to OLS, but also reduces overfitting, giving regularized models higher out-of-sample predictive power than models like OLS. For a more in-depth overview of regularized regression and this “bias-variance tradeoff,” see Hastie et al. (2009).
2We also fit models using traditional multilevel techniques, ridge regression, and the elastic net (a linear combination of the lasso and ridge regression), available upon request. Aside from the variable selection performed by the lasso, there were no major qualitative differences across the model types
3In fact, this description is a slight simplification of how we build our models. Our models are actually built using 10-fold cross validation with “adaptive penalty loadings,” which simply allows each coefficient in the penalty term to have its own λ-value rather than constraining λ to be constant for the whole model. (This is equivalent to having a λj inside the summation in the second term of Eq. 1, rather than a constant λ outside it.) Adaptive penalty loadings have been shown to yield more consistent variable selection (Zou, 2006), and in practice, lasso models fit nowadays often use adaptive loadings. This is more computationally intensive than “classic” lasso since the algorithm iterates across a large range of λ-values for each variable during each fold of cross validation. However, the intuition and theory remain the same
4As is typical in multilevel modeling, Table 3 presents R-squared measures for the overall incidence model and for each level (teachers and schools), as proposed by Bryk and Raudenbush (1992). Because this R-squared formulation does not include a penalty for including spurious predictors, we expect the lasso model for the incidence dimension to appear to perform “worse” than for the other dimensions.
References
Aderhold, A., Husmeier, D., Lennon, J. J., Beale, C. M., and Smith, V. A. (2012). Hierarchical Bayesian Models in Ecology: Reconstructing Species Interaction Networks from Non-homogeneous Species Abundance Data. Ecol. Inform. 11, 55–64. doi:10.1016/j.ecoinf.2012.05.002
Agodini, R., and Harris, B. (2010). An Experimental Evaluation of Four Elementary School Math Curricula. J. Res. Educ. Effectiveness 3 (3), 199–253. doi:10.1080/19345741003770693
Attick, D. (2017). Homo Economicus at School: Neoliberal Education and Teacher as Economic Being. Educ. Stud. 53 (1), 37–48. doi:10.1080/00131946.2016.1258362
Ball, D. L., and Cohen, D. K. (1996). Reform by the Book: What Is-Or Might Be-The Role of Curriculum Materials in Teacher Learning and Instructional Reform?. Educ. Res. 25 (9), 6–14. doi:10.3102/0013189X025009006
Bartell, T., Cho, C., Drake, C., Petchauer, E., and Richmond, G. (2019). Teacher agency and Resilience in the Age of Neoliberalism. J. Teach. Education 70 (4), 302–305. doi:10.1177/0022487119865216
Belloni, A., and Chernozhukov, V. (2013). Least Squares after Model Selection in High-Dimensional Sparse Models. Bernoulli 19 (2), 521–547. doi:10.3150/11-BEJ410
Bhatt, R., and Koedel, C. (2012). Large-Scale Evaluations of Curricular Effectiveness. Educ. Eval. Pol. Anal. 34 (4), 391–412. doi:10.3102/0162373712440040
Blazar, D., Heller, B., Kane, T., Polikoff, M., Staiger, D., Carrell, S., et al. (2019). Learning by the Book: Comparing Math Achievement Growth by Textbook in Six Common Core statesResearch Report. Cambridge, MA: Center for Education Policy Research, Harvard University. Available at: https://cepr.harvard.edu/files/cepr/files/cepr-curriculum-report_learning-by-the-book.pdf.
Bryk, A. S., and Raudenbush, S. W. (1992). Hierarchical Linear Models: Applications and Data Analysis Methods. Thousand Oaks, CA: Sage Publications, Inc.
Caniglia, J., and Meadows, M. (2018). Pre-service Mathematics Teachers' Use of Web Resources. Int. J. Technology Mathematics Education 25 (3), 17–34.
Chingos, M. M., and Whitehurst, G. J. (2012). Choosing Blindly: Instructional Materials, Teacher Effectiveness, and the Common Core. Washington, DC: Brookings Institution. Available at: https://www.brookings.edu/wp-content/uploads/2016/06/0410_curriculum_chingos_whitehurst.pdf.
Danielson, C. (2007). Enhancing Professional Practice: A Framework for Teaching Alexandria, VA: ASCD
Desimone, L. M., Le Floch, K. C., Ansell, S., and Taylor, J. (2005). Are We Asking the Right Questions on National Surveys about Teacher’s Professional Development? Insights from Cognitive Interviews with Teachers. Montreal, CA: Paper presented at the annual meeting of the American Educational Research Association.
Gallagher, J., Swalwell, K., and Bellows, M. (2019). “Pinning” with Pause: Supporting Teachers' Critical Consumption on Sites of Curriculum Sharing. Soc. Education 83 (4), 217–224.
Harris, L., Shelton, C., and Archambault, L. (2020). Examining Issues of Quality on Teachers Pay Teachers: An Exploration of Best-Selling U.S. History Resources. [Paper presentation]. Silver Spring, MD: National Council for the Social Studies: College and University Faculty Assembly.
Hastie, T., Tibshirani, R., and Friedman, J. (2009). The Elements of Statistical Learning. New York, NY: Springer. doi:10.1007/978-0-387-84858-7The Elements of Statistical Learning
Hastie, T., Tibshirani, R., and Wainwright, M. (2015). Statistical Learning with Sparsity: The Lasso and Generalizations. Boca Raton, FL: CRC Press. doi:10.1201/b18401
Hertel, J., and Wessman-Enzinger, N. (2017). Examining Pinterest as a Curriculum Resource for Negative Integers: An Initial Investigation. Education Sci. 7 (2), 45. doi:10.3390/educsci7020045
Hisano, R., Sornette, D., Mizuno, T., Ohnishi, T., and Watanabe, T. (2013). High Quality Topic Extraction from Business News Explains Abnormal Financial Market Volatility. PloS one 8 (6), e64846. doi:10.1371/journal.pone.0064846
Holton III, E. F., Bates, R. A., Bookter, A. I., and Yamkovenko, V. B. (2007). Convergent and Divergent Validity of the Learning Transfer System Inventory. Hum. Resource Development Q. 18, 385–419. doi:10.1002/hrdq.1210
Hu, S., Torphy, K. T., and Opperman, A. (2019). Culturally Relevant Curriculum Materials in the Age of Social Media and Curation. Teach. Coll. Rec. 121 (14).
Jackson, K., and Makarin, A. (2018). Can Online Off-The-Shelf Lessons Improve Student Outcomes? Evidence from a Field Experiment. Am. Econ. J. Econ. Pol. 10 (3), 226–254. doi:10.1257/pol.20170211
Kaufman, J. H., Doan, S., Tuma, A. P., Woo, A., Henry, E., and Lawrence, R. (2020). How Instructional Materials Are Used and Supported in U.S. K-12 Classrooms: Findings from the 2019 American Instructional Resources Survey. Santa Monica, CA: RAND. Available at: https://www.rand.org/pubs/research_reports/RRA134-1.html.
Kaufman, J. H., Opfer, V. D., Bongard, M., and Pane, J. D. (2018). Changes in what Teachers Know and Do in the Common Core Era: American Teacher Panel Findings from 2015 to 2017. Santa Monica, CA: RAND. Available at: https://www.rand.org/pubs/research_reports/RR2658.html.
Kaufman, J. H., Thompson, L. E., and Opfer, V. D. (2016). Creating a Coherent System to Support Instruction Aligned with State Standards. Santa Monica, CA: RAND. Available at: https://www.rand.org/pubs/research_reports/RR1613.html.
Mariooryad, S., Kannan, A., Hakkani-Tür, D., and Shriberg, E. (2014), Automatic Characterization of Speaking Styles in Educational Videos. Institute of Electrical and Electronics Engineers International Conference on Acoustic, Speech, and Signal Processing, Florence, Italy. doi:10.1109/ICASSP.2014.6854523
Marzano, R. J. (2010). Designing & Teaching Learning Goals & Objectives. Denver, CO: Solution Tree Press.
Mayer, D. P. (1999). Measuring Instructional Practice: Can Policymakers Trust Survey Data?. Educ. Eval. Pol. Anal. 21 (1), 29–45. doi:10.3102/01623737021001029
McNeish, D. M. (2015). Using Lasso for Predictor Selection and to Assuage Overfitting: A Method Long Overlooked in Behavioral Sciences. Multivariate Behav. Res. 50 (5), 471–484. doi:10.1080/00273171.2015.1036965
Opfer, V. D., Kaufman, J. H., Pane, J. D., and Thompson, L. E. (2018). Aligned Curricula and the Implementation of the Common Core State Mathematics Standards: Findings from the American Teacher Panel. Santa Monica, CA: RAND. Available at: https://www.rand.org/pubs/research_reports/RR2487.html.
Opfer, V. D., Kaufman, J. H., and Thompson, L. E. (2016). Implementation of K–12 State Standards for Mathematics and English Language Arts and Literacy. Santa Monica, CA: RAND. Available at: https://www.rand.org/pubs/research_reports/RR1529-1.html.
Pittard, E. A. (2017). Gettin' a Little Crafty: Teachers Pay Teachers, Pinterestand Neo-Liberalism in New Materialist Feminist Research. Gend. Education 29 (1), 28–47. doi:10.1080/09540253.2016.1197380
Polikoff, M., and Dean, J. (2019). The Supplemental Curriculum Bazaar: Is What's Online Any Good?. Technical report). Washington, DC: Fordham Institute. Available at: https://fordhaminstitute.org/national/research/supplemental-curriculum-bazaar.
Remillard, J. T. (2005). Examining Key Concepts in Research on Teachers' Use of Mathematics Curricula. Rev. Educ. Res. 75 (2), 211–246. doi:10.3102/00346543075002211
Riling, M., and Dietiker, L. (2018). Given a Traditional Textbook-Now What? Math. Teacher 112 (3), 192–199. doi:10.5951/mathteacher.112.3.0192
Rodriguez, N., Brown, M., and Vickery, A. (2020). Pinning for Profit? Examining Elementary Preservice Teachers’ Critical Analysis of Online Social Studies Resources about Black History. Contemp. Issues Technology Teach. Education 20 (3).
Ross, M., and Conway, M. (1986). “Remembering One’s Own Past: The Construction of Personal Histories,” in Handbook of Motivation and Cognition. Editors R. M. Sorrentino, and E. T. Higgins (New York, NY: Guilford Press).
Ross, M. (1989). Relation of Implicit Theories to the Construction of Personal Histories. Psychol. Rev. 96, 341–357. doi:10.1037/0033-295X.96.2.341
Sawyer, A., Dick, L., Shapiro, E., and Wismer, T. (2019). The Top 500 Mathematics Pins: An Analysis of Elementary Mathematics Activities on Pinterest. J. Technology Teach. Education 27 (2), 235–263.
Sawyer, A. G., Dredger, K., Myers, J., Barnes, S., Wilson, R., Sullivan, J., et al. (2020a). Developing Teachers as Critical Curators: Investigating Elementary Preservice Teachers' Inspirations for Lesson Planning. J. Teach. Education 71 (5), 518–536. doi:10.1177/0022487119879894
Sawyer, A., MacNeille, M., and Dick, L. (2020b). Comparing The Quality of Paid vs. Free Elementary Mathematics Activities Found Online (Conference presentation)Association of Mathematics Teachers Educators 2020 Conference.
Shelton, C., Archambault, L., and Harris, L. (2020). Lesson Plan Platforms for Teachers Have a Racism Problem. Available at: https://slate.com/technology/2020/08/teachers-paying-teachers-racist-materials.html.
Silver, D. A Theoretical Framework for Studying Teachers’ Curriculum Supplementation. Rev. Educ. Res.
Stewart, P. H. (2014). The Great Texas Textbook Debate. Available at: https://www.aljazeera.com/indepth/features/2014/02/great-texas-textbook-debate-201421613551126796.html.
Tarr, J. E., Chávez, Ó., Reys, R. E., and Reys, B. J. (2006). From the Written to the Enacted Curricula: The Intermediary Role of Middle School Mathematics Teachers in Shaping Students' Opportunity to Learn. Sch. Sci. Mathematics 106 (4), 191–201. doi:10.1111/j.1949-8594.2006.tb18075.x
Tibshirani, R. (1996). Regression Shrinkage and Selection via the Lasso. J. R. Stat. Soc. Ser. B (Methodological) 58 (1), 267–288. doi:10.1111/j.2517-6161.1996.tb02080.x
Torphy, K., Chen, Z., Yang, X., and Chhikara, D. (2019). The Impacts of Teachers’ Curation of Mathematics Resources on Students’ Achievement [Paper Presentation]. Evanston, IL: Midwest Sociology of Education Conference.
Torphy, K., Liu, Y., Hu, S., and Chen, Z. (2020). Sources of Professional Support: Patterns of Teachers' Curation of Instructional Resources in Social Media. Am. J. Education 127 (1), 13–47. doi:10.1086/711008
Tosh, K., Woo, A., and Doan, S. (2021). Did Experience with Digital Instructional Materials Help Teachers Implement Remote Learning during the COVID-19 Pandemic? Data Note: Insights from the American Educator Panels. Available at: https://www.rand.org/pubs/research_reports/RRA134-8.html.
Wang, E., Tuma, A., Doan, S., Henry, D., Lawrence, R., Woo, A., et al. (2021). Teachers’ Perceptions of what Makes Instructional Materials Engaging, Appropriately Challenging, and Usable: A Survey and Interview Study of Teachers. Santa Monica, CA: RAND. Available at: https://www.rand.org/pubs/research_reports/RRA134-2.html.
Wu, T. T., Chen, Y. F., Hastie, T., Sobel, E., and Lange, K. (2009). Genome-wide Association Analysis by Lasso Penalized Logistic Regression. Bioinformatics 25 (6), 714–721. doi:10.1093/bioinformatics/btp041
Keywords: supplementation, teaching, curriculum use, LASSO, instructional practices, instructional development, textbooks, survey research
Citation: Polikoff MS and Silver D (2021) Identifying and Distinguishing Among Teachers’ Supplementary Curriculum Use Patterns Using the Lasso. Front. Educ. 6:722554. doi: 10.3389/feduc.2021.722554
Received: 22 June 2021; Accepted: 13 August 2021;
Published: 24 August 2021.
Edited by:
Heidi L. Hallman, University of Kansas, United StatesReviewed by:
Ali Derakhshan, Golestan University, IranDrew Gitomer, Rutgers, The State University of New Jersey, United States
Copyright © 2021 Polikoff and Silver. This is an open-access article distributed under the terms of the Creative Commons Attribution License (CC BY). The use, distribution or reproduction in other forums is permitted, provided the original author(s) and the copyright owner(s) are credited and that the original publication in this journal is cited, in accordance with accepted academic practice. No use, distribution or reproduction is permitted which does not comply with these terms.
*Correspondence: Daniel Silver, ZHNpbHZlckB1c2MuZWR1