 Daniel H. Solis
 David Hutchinson2,4
 Nancy Longnecker
- 1Centre for Science Communication, University of Otago, Dunedin, New Zealand
- 2Department of Physics, The Dodd-Walls Centre for Photonic and Quantum Technologies, University of Otago, Dunedin, New Zealand
- 3Unidad Profesional Interdisciplinaria de Ingeniería Campus Zacatecas, Instituto Politécnico Nacional, Zacatecas, México
- 4Otago Museum Trust Board, Dunedin, New Zealand
Over the past 50 years, the prevalence of interactives in museums and science centres has increased dramatically, with interactive learning proliferating around the world. With a current estimated visitation of 300 million people each year, free-choice learning through museums and related venues has become a major source of human learning over the course of a lifetime. While many studies of visitor experience have examined positive changes in affective components of learning, fewer have examined whether specific scientific content knowledge is included in what is learnt. This research investigated gains in content knowledge through informal science learning. Three surveys were conducted at the Otago Museum’s science centre (Dunedin, New Zealand) with visitors eight years and older. The main component of the survey included a brief “formal” content knowledge assessment in the form of a pre-post multiple-choice test, with a focus on physics concepts illustrated in the science centre. Self-reported examples of science learned during the visit and selected items from the Modes of Learning Inventory complement the data. In the pre-post test, prior knowledge was age and gender dependent, with younger visitors and females getting significantly lower scores. Notwithstanding, visitors to the science centre had an overall average of 13% more correct answers in the test after visiting, independent of age and gender. A learning flow diagram was created to visualise learning in the presence or absence of interactivity. As expected, interactivity was found to increase learning.
Introduction
Science Learning at Science Centres
Learning is one of the most sought-after visitor-related outcomes by museums, second only to revenue (Jacobsen, 2016). This research studied learning in a science centre embedded within a museum.
Stemming from the still discussed deficit model, where knowledge flows from experts to novices (Cortassa, 2016), learning has been traditionally defined in terms of knowledge acquisition (Illeris, 2018). However, it is not knowledge alone what will determine what people will do with information, but their personal values, beliefs and attitudes (Kahan et al., 2012; Cortassa, 2016).
Instead of the deficit model, we have used the Koru Model of Science Communication (Longnecker, 2016) in which informal education is part of a learning ecosystem where facts are transformed into coherent information that can, in turn, be transformed into knowledge when individuals engage with it. Accordingly, we consider science learning to be the structured updating of scientific literacy based on processing new information that challenges a prior state, as described by Barron et al. (2015). In turn, while scientific literacy is a contested construct (Linder et al., 2010), it can be considered to encompass multiple concepts such as attitudes, understanding of the scientific method and engagement with science-related issues (Organisation for Economic Cooperation and Development, 2016). A broad approach to the study of science learning can be found in Solis (2020).
Although not the only component, scientific knowledge is commonly placed at the core of what scientific literacy implies (National Academies of Sciences Engineering and Medicine, 2016). While personal values, beliefs and attitudes need to be considered when speaking of learning, knowledge needs to be considered as well.
This study focuses specifically on learning related to content knowledge, defined as the “knowledge of facts, concepts, ideas, and theories about the natural world that science has established” (Organisation for Economic Cooperation and Development, 2016). Though limited in scope, content and procedural knowledge are reasonable indicators of science knowledge (National Academies of Sciences Engineering and Medicine, 2016). Thus, only for the purposes of this research, science learning is operationalized this time as a change in visitor’s scientific content knowledge before and after visiting the science centre.
Value of Formal Assessment
Free-choice learning refers to learning that is up to the individual (Jacobsen, 2016). Many studies have shown evidence of increasing scientific knowledge at science centres (e.g., National Research Council, 2009; Martin et al., 2016), with some estimates stating that informal learning makes up as much as 70–90% of a person’s learning (Latchem, 2014) However, assessment in informal environments has typically relied on self-reporting (National Research Council, 2009). Employing self-reporting techniques to assess learning of content knowledge has advantages, but it assumes that an honest respondent is enough for an accurate self-report (Paulhus and Vazire, 2007), and this may not always be so. The “familiarity hypothesis” considers that an individual’s familiarity with a science topic is a good reflection of their actual factual science knowledge1 (Ladwig et al., 2012). However, respondent’s confidence is based on the ease with which potential answers come to mind, making people genuinely believe their knowledge or understanding is correct if they feel familiar with it, irrespective of whether it is actually right (Mbewe et al., 2010; Wang et al., 2016).
Using formal testing to measure knowledge in informal settings can detract from the visitor experience and some researchers consider it inappropriate (e.g. National Research Council, 2009; Fenichel and Schweingruber, 2010). Nonetheless, self-reports are biased by personal judgements; assessing content knowledge objectively can be a valuable complement to self-reports and indirect measures.
We conducted an exhaustive literature review for articles, books and reports where formal content knowledge was assessed in informal environments. In total, only six manuscripts included results of knowledge being objectively tested when related to learning experiences in an informal environment (e.g. Mbewe et al., 2010; Salmi et al., 2015; Martin et al., 2016). A discussion of these studies can be found in Solis (2020). While some of those studies conducted a test in the pre-post manner we did, they tended to focus on school students, and none of them was conducted on a wider range of visitors to science centres.
This research included formal testing of scientific knowledge with visitors to a science centre; the drawbacks of such an assessment were considered, the risk of alienation was taken seriously, and the research test was designed to be user-friendly and minimize alienation.
The Otago Museum’s Science Centre
The Otago Museum is located in the city of Dunedin and it is named after the Otago Region in the South Island of New Zealand. The importance of this museum to the community is reflected in it regularly having more than 350,000 annual visitors (Otago Museum, 2018), a substantial proportion who are local residents.
This study was conducted at the Otago Museum’s science centre in two steps. Piloting happened in early 2017 at Discovery World, the museum’s science centre before it underwent a major redevelopment. Surveys were conducted in 2018 at Tūhura, the redeveloped and renamed science centre. The area dedicated to science exhibits increased from 393 sq. m. in Discovery World to 654 sq. m. in Tūhura, with both including a warm and humid enclosure called the Tropical Forest (215 sq. m.). The Tropical Forest is full of greenery and butterflies fly freely throughout. The science centre is a favourite of small children, with one third of Tūhura visitors being under 7 years old (Table 3). Tūhura is also popular with adults, some of whom visit without children. For example, the Museum runs occasional “after-dark” sessions without children and these usually sell out.
Methods
Instruments
Approach
This study triangulated measurement of informal science learning using three approaches: objective testing of scientific content knowledge, self-reporting of learning, and open questions which asked for specific examples of learning. A survey was piloted in 2017 and then three surveys were conducted in 2018, administered by the first author, using the same surveying methodology for all. Surveys were created and hosted in SurveyGizmoTM. The study was approved by the Human Research Ethics Committee at the University of Otago (17/062). The sections of the surveys that provided data analysed in this manuscript are attached as Supplementary Material.
Formal Assessment Questionnaire
The research instrument comprised five multiple-choice questions focused on light and electromagnetism, key topics showcased in Tūhura, plus a control question that was not included in the exhibits (Table 1). Multiple-choice questionnaires can be used to assess content knowledge (Brady, 2005; Kahan et al., 2012). All the items had one answer that was right, two that were wrong, and an extra “I don’t know”. The questionnaire was created by the authors and was iteratively reviewed by a panel of experts in science communication.
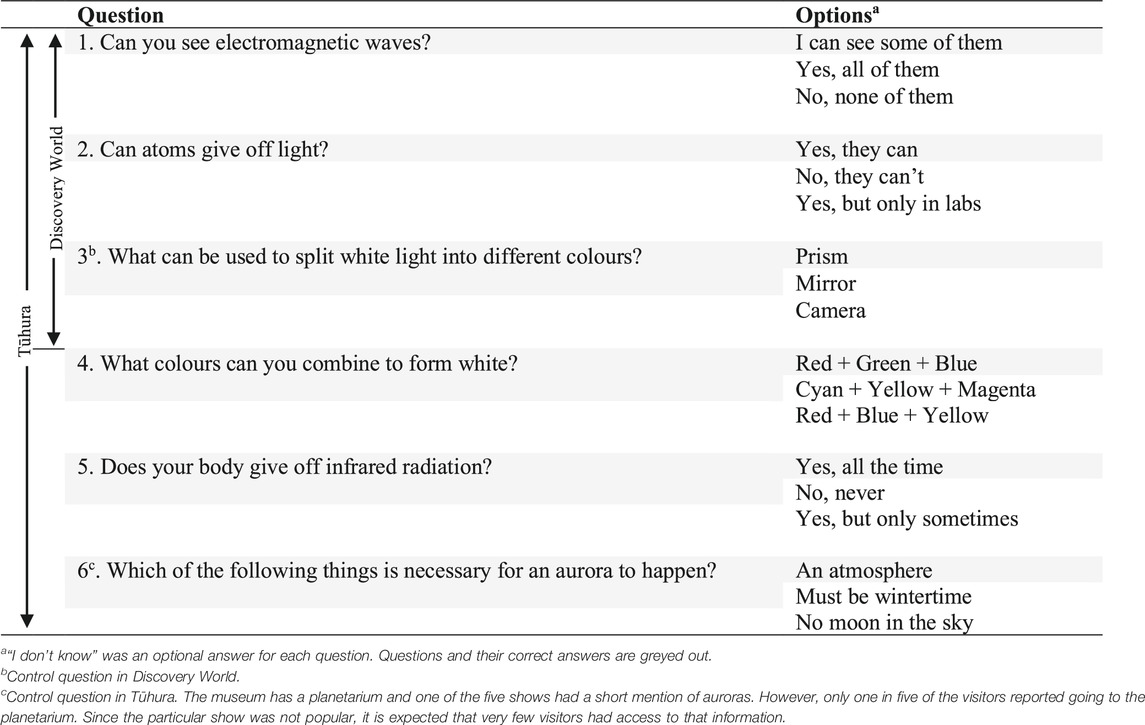
TABLE 1. Questions and answers to assess scientific knowledge.
The score of scientific content knowledge in light and electromagnetism was calculated as the sum of right answers (1 for each right answer, 0 for incorrect answers, not including the control question). “Don’t know” options were counted as incorrect, (Salmi et al., 2015).
A short two-item test (plus a control question) was piloted in 2017 at Discovery World. The number of right answers increased significantly (Wilcoxon Signed Rank Test, Z = 5.816, p < 0.001, r = 0.389, 89 discordant pairs of 224) from a median of 0 before the visit to 1 (out of 2) after the visit.
Given the formal nature of this instrument in an informal setting, alienation could be a concern. To minimize alienation, a number of approaches were taken: 1) Questions were selected such that the risk of conflict between the questions and visitor worldviews were minimal2, 2) The survey was as short as possible, 3) The person administering the survey welcomed visitors and was friendly and respectful when asking for participation, responding to all questions from parents and children, 4) Respondents were given enough space to fill out the survey without feeling observed or pressured, 5) Places to sit were provided), 6) iPads were used to survey (Section 2.2.3), 7) A token was given to respondents on completion, as a sign of appreciation (Section 2.2.4).
There were few signs of bias (e.g. children feeling everything is five stars) or visitor alienation (e.g. skipping questions in the survey), giving confidence to add more questions to a final five-item (plus control) questionnaire that was then conducted in 2018 at Tūhura. The questions from the pilot were included in the final version of the test. The control question in the pilot became an actual question in the final version of the test, as its topic was not covered in an exhibit in Discovery World, but it was in Tūhura. A new control question was added to the final version. This questionnaire (Table 1) was asked in what hereafter is called Survey A. Although all items were related to light and electromagnetism, they cover multiple subtopics and it cannot be expected that someone who learns about one, knows about the others. In other words, the multiple-choice test is not a scale and scientific knowledge is not necessarily mathematically unidimensional, nor a concrete construct. The Kuder-Richardson Formula 20 (KR-20) coefficient (equivalent to Cronbach’s alpha for dichotomous values, such as right/wrong) was 0.506 before and 0.542 after the visit.
Modes of Learning Inventory (Selected Items)
The scientific content knowledge test is able to quantify learning, but does not capture non-content learning, or content learning outside the specific questions asked. To provide a measure of whether visitors themselves believe they have learned and how they learned, Environmetrics Pty Ltd. created the Modes of Learning Inventory (MOLI), a 10-item, five-point, Likert-type scale developed by Griffin et al. (2005). MOLI was designed to be conducted only once, after a visit. For the present research, reversed items and those considered complicated for children were dropped. The remaining six items (Table 2) were included in the after-the-visit Survey B. As expected, the subset was still unidimensional3
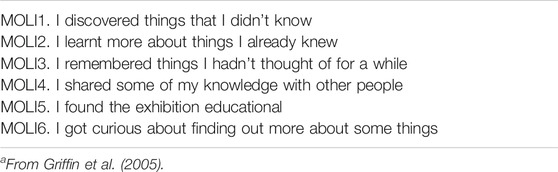
TABLE 2. Items from the Modes of Learning Inventory (MOLI)a used in this research.
Direct Self-Report
Since cognitive changes are highly individual and difficult to assess in a standardized way, outcomes need to be assessed in a variety of ways (National Research Council, 2009). Individuals are capable of understanding and self-reporting their own learning4 (National Research Council, 2009; Falk and Needham, 2013; Colliver and Fleer, 2016). Directly asking a visitor if they learnt something new is one way to assess changed knowledge and understanding (Longnecker et al., 2014). In Survey C, visitors were asked “Do you consider you learnt something at Tūhura’s exhibits that you did not know before? (including any previous visits)” (Yes/No/I haven’t interacted with Tūhura’s exhibits). In total, 276 said Yes and 78 said No5. Those who said Yes were asked “Can you give an example of something you learnt?”. Examples were given by 196 respondents. In addition, “It was cool learning about … ” was an open question included in Survey A, answered by 394 participants. Qualitative responses from both surveys are provided as examples of learning.
Variables Involved in Learning
To combat the view of some young people that science is boring (Linder et al., 2010), the first generation of interactive museums started in 1969 with the Exploratorium in San Francisco and the Ontario Science Centre in Canada (Patiño, 2013). Since then, interactivity has been expected to be a key variable in learning science at a science centre, as interactive elements are more attractive to visitors (McKenna-Cress and Kamien, 2013), promote learning (Fenichel and Schweingruber, 2010), and make the experience more memorable (Maxwell and Evans, 2002).
It is important to define what is meant here by interactivity. Hands-on interactives are those where the user interacts with their hands, but interactivity is a much broader concept, as broad as the ways a visitor can influence an exhibit’s functioning. For example, Tūhura showcased an infrared camera. To interact with it, visitors do not need to touch anything. The simple act of standing in front of the camera makes the exhibit change what is displayed on the screen (the temperatures of the visitor’s body). However, interactivity does not occur until the user completes the cycle of interaction; in this example, the cycle is complete when the visitor pays attention to what the screen is displaying.
Learning is a complex process that is influenced by a multitude of factors, such as age and gender (Wehmeyer et al., 2011). However, conclusions about the relationship between these variables and learning vary. For example, Ramey-Gassert (1997) concluded that both children and adults learn science at science centres, but Allen (1997) found a very different result. Allen interviewed visitors who interacted with a “coloured shadows” exhibit6 to see if they provided more correct answers to questions about the nature of those shadows (asked during the interview and later assessed). The success rate in getting the correct answers after an intervention was null for visitors under 12 years old, very small for those between 13 and 15 years old, and only considerable for those 16 and above (Allen, 1997).
Since learning occurs more readily if there is some prior knowledge and the topic resonates with the visitor (Krajcik and Sutherland, 2010; Falk and Dierking, 2016; Mattar, 2018), prior knowledge (operationalized in this research as the score in the pre-knowledge test) was another variable to study. Comparison of results of pre and post answers to survey questions with answers to a control question which asked about information that was not included in the science centre exhibits provides greater confidence that differences observed after the visit were indeed indications of learning. Even if science learning is one of a venue’s primary objectives, it is not necessarily on a visitor’s free-time radar (Burns and Medvecky, 2016). The three surveys also asked why visitors came to Tūhura (pre-visit) and what they actually did during their visit (post-visit). The option “Interact with the exhibits” appeared in the pre- and post-test surveys to measure how many originally disengaged visitors became engaged with the exhibits. Complementing, but not paired between surveys, “Learn some science” was a pre-visit option and “Read some panels” was a post-visit option. These questions were added to potentially explain other results as complementary factors to interactivity.
Data Collection
Target Population
Visitors of all ages come to Tūhura, but given that survey questions require a certain maturity to be answered correctly, it was decided to limit participants to those over a minimum respondent age. According to the National Research Council (2009), children older than seven years are able to respond to questionnaires, but the age limit for this study was increased to eight years old, as seven to eight is the age when children enter the “concrete operational stage” in Piaget’s theory of cognitive development (Piaget, 1968).
We acknowledge that emotional reactivity and regulation are age-related (Silvers et al., 2012), but as mentioned in Section 2.1.2, questions were designed to minimize alienation. The format was explicitly designed and tested for being easy for younger respondents while not being patronizing for adults. This allows use of age as a variable in statistical comparison of changes in content knowledge. More detail about development of instruments directed at children as well as adults can be found in Solis (2020).
Pre-test/post-test Design
The MOLI instrument and the open questions do not require a comparison between two points of time and were only asked in the corresponding post-survey. The knowledge questionnaire matched participants’ pre-test and post-test responses, allowing true comparison (Friedman, 2008; Hernández et al., 2014) to assess changes in scientific literacy of visitors.
Use of iPads and Visit Time
A strategy used to avoid alienation involved the use of iPads to administer the surveys. The pilot assessed the formal test and compared the use of iPads versus paper. Visitors commented that the use of iPads was “cool” and paper surveys were only kept for emergency (e.g., if internet was down) or visitors who might prefer paper requested one. None of these scenarios happened, all data analyzed in this study were collected on iPad.
Although sometimes younger visitors needed to instruct older relatives on iPad use, the appeal to use iPads in this informal setting was independent of age, gender and group composition. Compared to paper, electronic surveying produces equivalent results in terms of missing data, item means, and internal consistencies (Giduthuri et al., 2014; Ravert et al., 2015), response rates (Ravert et al., 2015; Shah et al., 2016), and time spent completing the survey (Shah et al., 2016). Moreover, using iPads instead of pencil and paper has advantages such as saving time in responding to closed questions (Giduthuri et al., 2014), presenting a more attractive and uncluttered questionnaire (Fowler, 2013), and allowing randomized presentation of items, which increases reliability of the instrument (Fowler, 2013). Lastly, using the iPads allowed visit time to be recorded. However, this information was of limited use, as the time spent at the relevant exhibits could not be separated from time spent in the Tropical Forest.
Non-monetary Incentive
As an incentive for answering a formal questionnaire, a small token was given to respondents as a token of appreciation—a small glow in the dark item or a magnetic butterfly. The token was attached to a piece of paper with a scientific fact and it was given after completing the post-survey.
Sampling and Demographics
All Tūhura visitors were asked to participate in the surveys provided they were at least 8 years old (with consent of the carer), there were at least two iPads available, and there were enough caretakers in a group to look after the youngest children while other members of the group filled out the survey.
Survey A was conducted from May to August 2018, Survey B in September and October 2018, and Survey C from July to September 2018. Piloting at Discovery World happened in June and July 2017.
Table 3 shows respondent demographics. For ease of interpretation, age was divided into groups: Children (8–12 years old), Adolescents (13–18), Young Adults (19–40) and Mature Adults (41+). Visitors came mainly in family groups (75%), their ethnicity was mainly European (87%) and most (78%) agreed to participate. Response rate was calculated by dividing the number of groups that accepted by the number of groups that were asked.
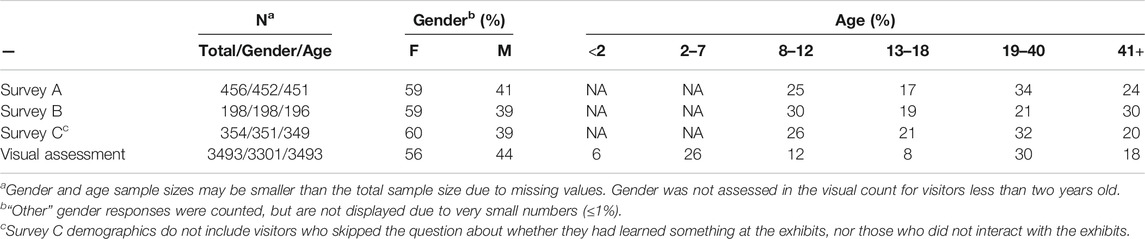
TABLE 3. Percentage demographic comparisons of survey respondents, and general visitors visually assessed.
To be able to compare respondent demographics to those of the general visitor population, visitors (respondents and non-respondents) demographics were also visually assessed (Table 3). The sampling method affected the group distribution because of exclusion of visitors under seven years old.
Data Pre-processing
Ideally, data should be correct, unambiguous and complete (Kimball and Caserta, 2004), but real world data are often inaccurate and need to be cleaned (pre-processed). For example, data quality can be improved by removing survey responses that exceed an acceptable number of missing attributes (Kimball and Caserta, 2004). A method to detect these invalid responses was devised (for full description, Solis, 2020) and data reported in this paper were cleaned. Respectively, for each survey, the number of drop-outs/invalid responses/valid responses with not enough answers in the instrument/and final number of valid responses with enough answers in the instrument, were as follows. Survey A: 45/26/8/456. Survey B7: 18/12/51 (7)/198. Survey C8: 24/13/32/354.
To comply with ethics recommendations by the institutions involved, no questions were forced and respondents were allowed to skip any as they so desired. As a result, sample sizes vary for different questions. Of the 198 valid MOLI responses, 23 included up to two missing values (pre and post counted separately), either blanks or I Don’t Know9. After determining data were missing at random (MAR), missing values were input with Expectation Maximization in SPSS v25. Cronbach’s alpha before and after imputation changed minimally from 0.788 to 0.784. The multiple-choice questionnaire does not form a scale and therefore it is not imputable. Blanks and I Don’t Know responses were counted as incorrect.
Quotes are shown verbatim, with clarifications signaled in brackets. Respondent gender and age in years are reported in brackets after each quote.
Results and Discussion
Learning Scientific Content Knowledge
Scientific Content Learning
Scientific content knowledge about light and electromagnetism increased significantly (N = 456, t (455) = 11.9, p < 0.001) from a mean score of 1.96 correct answers (out of five) before a visit to the Tūhura science centre, to 2.61 after a single visit. Length of visits varied10 from 8 min to 3 h:31 min with an average stay of 1 h:52 min. The control question added confidence to this result as there was no change in proportion of right or wrong answers after the visit.
The effect size (d = 0.560, dCI = 0.068)11 falls in what Hattie (2009) catalogues as the “zone of desired effects learning”, i.e., learning surpassed what is expected from formal schooling. Although formal education may produce deeper learning than a one-off visit to a science centre, Hattie’s interpretation of Cohen’s d reinforces that informal education can be a powerful ally to formal education.
Self-reported Learning
From the questions from the Modes of Learning Inventory (MOLI), 86% (n = 170) of visitors reported their visit resulted in high or very high learning12. While only 36% (n = 128, N = 356) of Tūhura visitors specifically said that they came to the science centre to learn some science in the pre-visit survey, 78% (n = 276, N = 354) reported in the post-visit survey that they had learned something they didn’t know before. Those who responded yes were asked to give an example.
“Plasma the fourth form of matter was something I knew but almost forgot previously” (F, 33). “Recalling torque and inertia was leanring (a learning) event—need to go back to my physics texts of 40 years ago!” (M, 58). Remembering something we have forgotten or strengthening existing knowledge can be considered learning (Falk and Dierking, 2016). These quotes are evidence that formal and informal education can work together to help people learn and consolidate their learning.
The following two responses exemplify that learning is an individual process: “That you can balance an object on the tourqe (torque) board if you get the object to have a matched tourqe (torque)” (F, 19). “That if you spin the ball in the opposite direction that the disc is spinning, it stays on there longer” (F, 52). These two visitors both caught what the Torque Table exhibit13 was trying to convey. The response of the former appears more conceptual, and she is using the terminology displayed at the panel. The second visitor’s explanation is practical and direct, and her learning may have occurred primarily by experimentation rather than reading the panel.
Any doubt of whether children can learn science by visiting a science centre should consider the following self-reported example of learning: “1. I have learned how to make still objects move at the animation station 2. Through an experiment I have learned how humans conduct electricity 3. I learned that white has many different colours” (F, 9).
The effect of the science centre does not stop with learning science content, visitors can develop a sense of inquiry, as can be appreciated from the following quote: “How you could create white by using the colours “Red + Blue + Green = White”. I wonder if [I] could make white using paints?” (F, 11)14.
Learning Factors
Age
The selected MOLI items suggest that learning is not age dependent, as no clear age pattern was found (Children, n = 59, Mdn = 3.83, IQR = 0.83, CI = 0.33; Adolescents, n = 37, Mdn = 4.17, IQR = 0.75, CI = 0.17; Young Adults, n = 42, Mdn = 4.00, IQR = 0.71, CI = 0.17; Adults, n = 58, Mdn = 4.17, IQR = 0.67, CI = 0.17). However, the multiple-choice test provided an opportunity for an objective test of the possible correlation. In results consistent with MOLI, the test found learning at Tūhura was not age dependent (r = 0.023, p = 0.622, N = 451).
To further consider how age relates to learning content knowledge, a LOESS fit15 was done on a scientific content knowledge scatter plot before and after the visit to Tūhura (Figure 1) against the independent variable of age. While a LOESS fit does not produce correlation coefficients, it allows us to see two clear sections with roughly linear relationships between scientific content knowledge and age, but with different slopes. The domain of one of the relationships includes Children and Adolescents, while the domain of the other one includes Young Adults and Mature Adults. The independence of age and learning can be visually appreciated in Figure 1 as shapes from before and after are similar, regardless of the age group, with both shifting upwards after the visit.
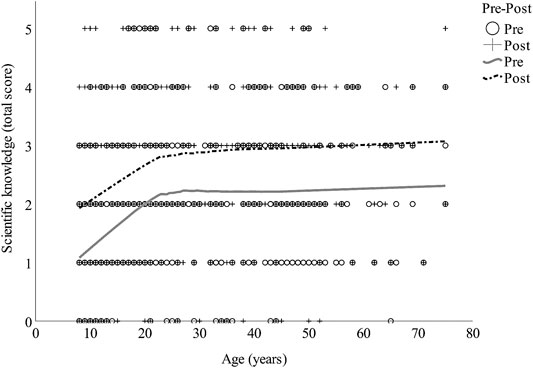
FIGURE 1. Scatter plot with LOESS regressions (smoothing parameter α = 0.70) for scientific content knowledge as a function of age, before and after the visit (N = 451) at Tūhura.
In contrast, Allen (1997) found considerable science learning from a science exhibit only in visitors 16 years and older. However, that result may be due to the nature of the exhibit that was studied. In “coloured shadows”, how shadows get their colour is counterintuitive and requires a good deal of abstraction—something that does not start to develop until adolescence (Piaget, 1968). Also, prior knowledge is important for learning abstract concepts (Krajcik and Sutherland, 2010).
Prior Knowledge
Figure 1 shows how Tūhura visitors’ prior scientific content knowledge in the topic of this study depended on their age in the range from eight to 22 years old16 (r (237) = 0.440, p < 0.001). From the age of 23 there was no further age-related increase in prior scientific knowledge, (r (214) = 0.005, p = 0.938). This finding agrees with Lindon (1996), in that knowledge is accumulated with age, especially in young people. The ages where knowledge increased rapidly is consistent with the typical age of formal schooling. “From eight to 18 years there is great potential for children and young people to extend their knowledge tremendously (Lindon, 1996). Notwithstanding, the parallel upwards shift of curves from pre to post in Figure 1 also demonstrates that the influence of informal learning can be important, even when compared to that of traditional schooling, as has been suggested by Falk and Needham (2013). The increase in scores from pre to post-test at all ages demonstrates that adults continue to learn when provided opportunities outside of school.
The flatter section (from 23 years old) does not mean adults learn less, but that their priorities may tilt their learning to other subjects (Flynn, 2012), not assessed with this instrument (which only measured the topic of light and electromagnetism). Instead of being generalists, adults tend to develop expertise in specific domains (Fenichel and Schweingruber, 2010).
Gender
The prior scientific knowledge of males (M = 2.23, SD = 1.40, CI = 0.20) was significantly higher (t (345) = 3.69, p < 0.001, nm = 185, nf = 267, d = 0.359, dCI = 0.096) than that of females (M = 1.77, SD = 1.15, CI = 0.14). Females scoring lower than males in prior scientific knowledge about physics (Figure 2), is consistent with other reports showing a gender gap in scientific literacy unfavourable to females (e.g. Allen, 1997; Skaalvik and Skaalvik, 2004; Kurtz-Costes et al., 2008). A multitude of reasons have been proposed to explain this gap, including low self-esteem in science (Bamberger, 2014), stereotype related issues (Bian et al., 2017) and lack of opportunities (Aikman and Unterhalter, 2007). We agree with the reasons above and discuss another factor.

FIGURE 2. Medians of correct answer before (pre) and after (post) visiting Tūhura for male (M) and female (F) visitors: male children (n = 56), female children (n = 55), male adolescents (n = 21), female adolescents (n = 55), male young adults (n = 57), female young adults (n = 96), male mature adults (n = 50) and female mature adults (n = 57). Children comprised visitors from 8 to 12 years old, Adolescents from 13 to 18, Young Adults from 19 to 40 and Mature Adults from 41.
In Table 4 it is seen that there is no prior knowledge gap in Children; the gender gap starts from adolescence onwards. This difference does not need to come from some sort of discouragement necessarily. On the one hand, engagement is a cornerstone that supports effective science learning and interest in learning more (Krapp and Prenzel, 2011). On the other hand, career choices are influenced not only by confidence and interest in science, but by relative academic strengths (Stoet and Geary, 2018), and it was found in 2015 PISA that boys had a significantly larger rescaled intra-strength in Science, while girls’ intra-strength was in Reading17 (Stoet and Geary, 2018).
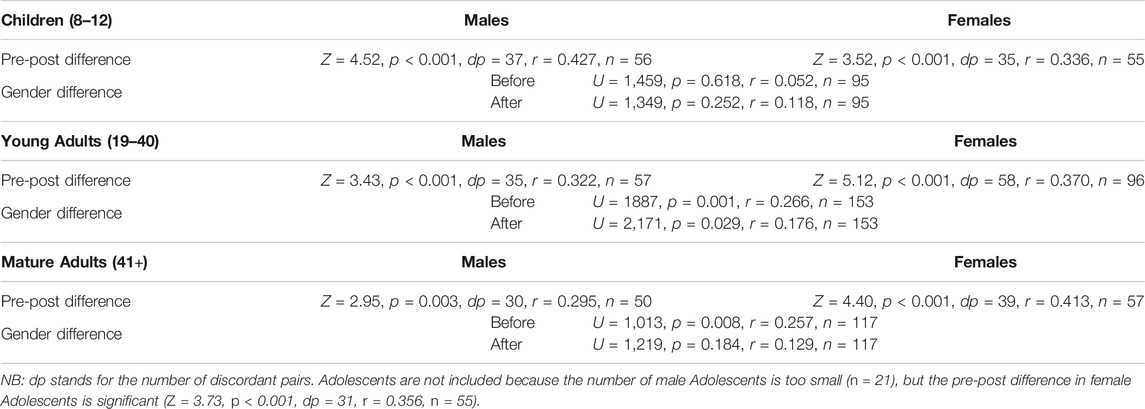
TABLE 4. Statistical significance of differences of correct answers (medians) in scientific content knowledge before (B) and after (A) the visit by gender and age group in Tūhura.
STEM careers can be divided into two broad categories, physical STEM careers and life sciences STEM careers (Mohtar et al., 2019). It is well documented that girls tend to have less interest in physical sciences than boys (Krapp and Prenzel, 2011). More specifically, females tend to be more attracted to biology and males to physics (Akarsu and Kariper, 2013). An important factor for women’s underrepresentation in physics may be their own choices that start at a young age (Williams and Ceci, 2012) and that are based on having more areas where they feel they can succeed (Mostafa, 2019). A deeper discussion on the gender gap and the relation between content knowledge and self-concept will be presented elsewhere. Regardless of the gap, it is interesting to note that both genders increased their content knowledge significantly, males going up from M = 2.23 to M = 2.84 (t (184) = 7.13, p < 0.001, d = 0.524, n = 185, dCI = 0.106) and females from M = 1.77 to M = 2.45 (t (266) = 9.51, p < 0.001, d = 0.582, n = 267, dCI = 0.088). If we take the pre-post difference in right answers (∆M) as a measure of content knowledge learning, females (nfemales = 259, ∆M = 0.68, CI = 0.14) are not significantly different (t (423) = 0.180, p = 0.857) from males (nmales = 175, ∆M = 0.66, CI = 0.17). This agrees with Piraksa et al. (2014), who found that gender did not influence scientific reasoning in students in Thailand.
Self-reports are also interesting in this regard. The MOLI responses for males (n = 78, Mdn = 4.08, IQR = 0.83, CI = 0.08) and females (n = 117, Mdn = 4.00, IQR = 0.83, CI = 0.17) were not statistically different (Mann-Whitney U = 4,342, p = 0.564, r = 0.041), but the percentage of females reporting new learning when asked “Do you consider you learnt something at Tūhura’s Exhibits that you did not know before?” (82%, n = 213) was significantly higher (χ2 (1) = 6.37, p = 0.012) than that of males (72%, n = 138). Due to the small sample size of sub-groups, medians instead of means were used. Table 4 complements Figure 2 by showing the results to testing for statistical differences in these subgroups. While adult female visitors increased their test scores more than adult male visitors, no statistical difference was found in children.
Interactivity
Tūhura visitors who interacted with exhibits changed their answers significantly between the pre and post-test surveys (McNemar-Bowker test χ2(3,n’ = 1973) = 166, pasym<0.001, DPRS = 14.0). The non-interacting group did not (χ2 (3,n’ = 127) = 3.628, pasym = 0.305, DRPS = 0.007). Figure 3 shows this graphically18. The amount of answers that changed19 was the same in both groups (33%). However, those who interacted with the exhibits have a large net flow towards the right answer, while the distribution of those who did not interact is more random.
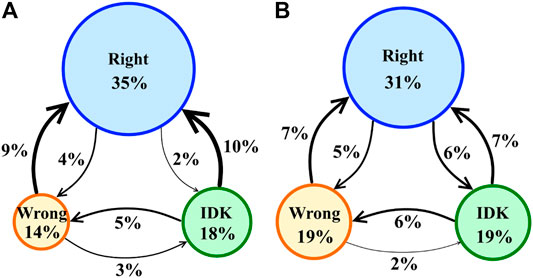
FIGURE 3. Learning flow diagrams for Tūhura visitors who interacted (A) with the exhibits (n = 409, n’ = 1913) and those who did not interact (B) with the exhibits (right, n = 26, n’ = 127). n stands for the number of respondents, n’ for total number of responses. Answers to the scientific content knowledge test were recoded as Right, Wrong and I Don’t Know (IDK). All of the items (except the control question) were pooled together20. Responses were split into groups of visitors who interacted with the exhibits and visitors who did not.
It is important to acknowledge that interactivity is not a factor that works alone. Engagement with the exhibits translates into more time playing with them, and more time at the exhibits means more opportunities for learning (Serrell, 1997). As expected, visitors who interacted with the exhibits stayed (n = 692, t = 67 m 09s, SD = 25 m 02s, CI = 1 m 52 s) significantly longer at Tūhura (t (742) = 3.542, p < 0.001, d = 0.516, F = 0.144) than those who did not interact with the exhibits (n = 52, t = 54 m 26 s, SD = 24 m 14 s, CI = 6 m 34 s). Unfortunately, time spent exclusively at the exhibits could not be isolated from the total which could include time spent in the Tropical Forest.
Another indirect factor that could account for the increased learning by those interacting is the possibility that those interacting also read the panels. But the difference in means of right answers from pre to post in panel readers (ΔM = 0.60) and non-readers (ΔM = 0.60) was not significant (t (425) = 0.544, p = 0.587, nNR = 115, nPR = 312, d = 0.061, dCI = 0.109), meaning that those who did not read the panels were as likely to provide correct answers as those who did. This is predictable to some extent, given the interactive nature of the exhibits, which were designed to be self-explanatory. Another possible factor is that visitors who came with the intention of learning science worked hard towards their aim and their increase in science knowledge was so high that it influenced the results of the entire interacting group. However, the amount learned by those who said they came to learn some science (n = 295, ΔM = 0.64, CI = 1.14) was not statistically different (t (425) = 0.183, p = 0.855, d = 0.03, F = 0.322) from those who stated no intention to learn science in the pre-visit survey (n = 132, ΔM = 0.67, CI = 0.20).
Limitations and Future Work
It is acknowledged that pre-testing may have “cued” (pre-sensitized) visitors (Friedman, 2008), affecting the outcome. However, matching pre and post responses is a widely-used experimental design that allows for changes to be detected in the same population (Friedman, 2008; Hernández et al., 2014). Feedback, worked examples, scaffolding, and elicited explanations play a big role in learning (Honomichl and Chen, 2012). Therefore, an extraneous variable that might have influenced the results of children are parents, as they and others in mentoring roles play a critical role in supporting science learning (Fenichel and Schweingruber, 2010). The role of parents or carers was not determined in this study.
Very little research has been done on formal assessment of content knowledge in informal settings. More research is needed to confirm the results found in this study, especially considering science learning is a much broader concept whose study requires considering other areas.
It would be interesting to investigate whether visit time at specific exhibits is correlated to learning, as has been suggested by Serrell (1997). Unfortunately in this study, recorded visit time could not be split in visit time at the exhibits and at the Tropical Forest. For that reason, how experiencing the Tropical Forest influenced learning could not be isolated.
Why there is a gender difference in prior knowledge for older visitors but not in younger visitors also warrants further study.
Conclusion
This research focused on the fundamental question of whether a single visit to a science centre results in science learning. As discussed earlier, in addition to content knowledge, learning comprises a rainbow of constructs, such as attitudes and engagement (Organisation for Economic Cooperation and Development, 2016). While all types or learning are valuable and contribute to an individual’s cognitive, emotional, and social growth (Eaton, 2010) this study examined scientific knowledge. This construct is a core concept of scientific literacy (National Academies of Sciences Engineering and Medicine, 2016) that can be reliably assessed with multiple-choice questionnaires (Brady, 2005). However, objective testing methods are commonly considered inappropriate in informal venues (e.g. National Research Council, 2009; Fenichel and Schweingruber, 2010), relying its assessment mainly on self-reporting (National Research Council, 2009). The issue is testing in informal environments without alienating visitors.
Our recommendations for researchers who desire to use a formal test in an informal setting, are listed below. The first three recommendations are especially important when surveying young children.
1) Provide visitors with a friendly environment for testing,
2) Word questions such that they are clear, non-threatening, short and unambiguous,
3) Keep the survey as short as possible with the formal test in the middle,
4) Pilot the survey and pay attention to any discomfort of visitors; discard the method if signs of discomfort are detected,
5) Modify the questionnaire if needed,
6) Matched pre-post responses (having the same set of questions before and after with the same respondents) allows for direct pre-post comparison, but may also “cue” visitors; depending on available time, number of respondents and needs, consider alternatives, such as splitting samples.
Using the guidelines above, we managed to reliably assess content knowledge minimizing the bias of self-reporting. Unsurprisingly, prior scientific content knowledge, as measured by this study’s instrument, increases with age during childhood and adolescence (during the years of formal schooling). It then reaches a plateau in adulthood. An important finding in this study was that learning content knowledge at the science centre was independent of age. When exhibits are engaging for people of different ages, nobody is too young or too old to learn from a visit to the science centre.
Gender did not play a role in prior content knowledge of young children, but adult females in this study showed significantly lower scientific content knowledge for these physics-related questions than males. Expanding on the multiple reasons that can cause a gender gap goes beyond the goals of this study, but one of the reasons may arise from personal choices related to females having less interest in physical sciences than boys (Osborne and Dillon, 2008; Krapp and Prenzel, 2011). A deeper discussion will be presented elsewhere.
Interactivity is another factor that heavily influences learning in science centres. A learning flow diagram helped visualize how answers move among the right answer, the wrong answers and the I Don’t Know option after the visit. Visitors who interacted with the exhibits were more likely to provide correct answers after the visit, while answers of non-interacting visitors moved randomly among the options.
Although analyzing the full spectrum of what learning science entails was not part of this study’s aim, the content knowledge test was complemented by qualitative and quantitative data collected through three surveys using the same data collection methodology by the same researcher in the same year (2018). These data helped triangulating the results, providing evidence of learning. While only one third of visitors reported coming to the science centre to learn some science, most of them reported learning as a result of their visit, as measured by both the MOLI instrument (86%), the direct question (78%) and the scientific content knowledge questions. In the latter, mean scores of correct answers increased from 1.96 to 2.61.
Some of the quotes provided by visitors clearly show learning of physics content knowledge, either about something new or refreshing older memories. This learning occurred for all ages, including very young visitors. In addition, some quotes show visitors were able to take what they experienced at the science centre and extrapolate it to personally-relevant contexts.
The combined use of different items and qualitative responses makes a strong case that visitors learned formal physics content knowledge in a single visit to the informal setting of this case study. It could be said that the MOLI instrument provided a quantitative measure of the breadth, the multiple-choice questionnaire provided quantitative depth, and the open question added qualitative breadth and depth.
Data Availability Statement
The raw data supporting the conclusion of this article will be made available by the authors, without undue reservation.
Author Contributions
DS, DH, and NL conceived the project of which this study is part. DS and NL and designed the study. DS collected and analysed all data. DH provided financial support for conference presentations of the project where feedback was provided. DS wrote the first draft of the manuscript. DS and NL contributed to manuscript extension and revisions. DS, DH, and NL read and approved the submitted manuscript.
Funding
This study was supported by the University of Otago through a Doctoral Scholarship for the first author, the Dodd-Walls Centre for Photonic and Quantum Technologies through direct funding, and the Instituto Politécnico Nacional and the Unidad Profesional Interdisciplinaria de Ingeniería Campus Zacatecas through the Licencias con Goce de Sueldo CPE/COTEBAL/105/2016, CPE/COTEBAL/100/2017, CPE/COTEBAL/71/2018 and CPE/COTEBAL/67/2019.
Conflict of Interest
DH and NL are members of the Otago Museum Trust Board.
The remaining author declares that the research was conducted in the absence of any commercial or financial relationships that could be construed as a potential conflict of interest.
Publisher’s Note
All claims expressed in this article are solely those of the authors and do not necessarily represent those of their affiliated organizations, or those of the publisher, the editors and the reviewers. Any product that may be evaluated in this article, or claim that may be made by its manufacturer, is not guaranteed or endorsed by the publisher.
Acknowledgments
The authors are grateful to the University of Otago, the Dodd-Walls Centre for Photonic and Quantum Technologies, the Instituto Politécnico Nacional and the Unidad Profesional Interdisciplinaria de Ingeniería Campus Zacatecas, for their support. Especially, we would like to thank the staff at Otago Museum for their logistical assistance and the visitors who generously gave their time to provide responses and feedback.
Supplementary Material
The Supplementary Material for this article can be found online at: https://www.frontiersin.org/articles/10.3389/feduc.2021.698691/full#supplementary-material
Footnotes
1It also considers that this familiarity is positively correlated with science support, but this is beyond the scope of this research.
2An example of alienating question for some people would be “Is Earth flat?”
3A single factor explains 50% of the variance (Bartlett’s test of sphericity χ2 (198,15) = 319, p < 0.001, KMO = 0.816) the internal consistency was acceptable (α = 0.784).
4Notice that the need for proving there is knowledge gain objectively does not discredit the supposition of self-reporting validity. To the contrary, a positive gain objectively measured can strengthen the self-reporting assumption.
5Also, 17 people skipped the question and 15 people responded that they did not interact with the exhibits. These respondents are not included in the calculation of percentage of visitors learning after interacting with the exhibits.
6In this exhibit, lights of different colors shine on the same spot. Objects blocking these lights produce colored shadows. A very similar exhibit is on display at Tūhura.
7In Survey B, the MOLI questions were not included at first and 44 of visitors who left valid responses, filled out the survey without the instrument. Only seven of those who had the complete version and left a valid response, did not have enough answers in the instrument.
8In Survey C, valid responses with not enough answers comprise those who skipped the direct question (n = 17) and those who did not interact with the exhibits (n = 15).
9Missing values not only come from blanks, but also from I Don’t Know responses (Kimball & Caserta, 2004).
10These calculations come from all available data of visit time (N = 1,090), all coming from the three surveys, but with no restrictions of other types of data availability (for instance, visit time of those who skipped any of the questions or instruments here discussed are still counted).
11dCI is the confidence interval of the reported Cohen’s d.
12MOLI scores range from 6 to 30. Results were recoded as Very Low (6–10 points), Low (11–15), Medium (16–20), High (21–25) and Very High (26–30). Descriptives were rescaled to values from 1 to 5.
13The Torque Table is a turning disc where you can roll objects over the disc to discover how they react to circular motion.
14Scientific inquiry is a desired outcome, but it can lead to misinterpretations if not correctly guided. This topic will be covered elsewhere.
15A LOESS fit (Locally Estimated Scatterplot Smoothing, a.k.a. LOWESS, Locally Reweighted Scatterplot Smoothing) is similar in nature to a linear regression, but instead of producing a single and linear regression from all data points, it creates multiple weighted local linear regressions around each point by using a subset of n neighbouring points. Although the LOESS fit is merely descriptive and does not produce a correlation coefficient as the linear regression would, it is useful to detect relationships by zones, as it will become clearer below.
16The age dependent group was extended beyond Adolescents because the plot and Pearson correlations showed the dependence was still high until 22 years old.
17PISA assess three main subjects: Science, Reading and Mathematics. While there would not be a gap in Science in absolute terms, boys tend to score higher in Science than in the other two subjects, and girls do so in Reading.
18The learning flow diagram was created by the authors to visualize how scientific knowledge learning happens. The way to read it is as follows: circle diameters are proportional to the number of answers that did not change from pre to post. Arrows show how answers moved among the three options. The direction of the arrow explains from what-to-what group answers moved. The width of each arrow is proportional to the number of answers that changed from one group (in pre) to another (in post).
19The total percentage of answers that did not change can be obtained by summing up the percentages in the three circles. The total percentage of answers that did change is obtained from summing up percentages of all arrows.
20In this section, n’ means the sample size of the available number of responses, not number of respondents (n). For example, n = 26 visitors did not interact with Tūhura exhibits, but since each survey had five items, there were 130 possible responses. n’ = 127 means three respondents skipped one item each.
References
Aikman, S., and Unterhalter, E. (2007). Practising Gender Equality in Education. Oxford: Oxfam GB 7 (1), 1–19.
Akarsu, B., and Kariper, A. (2013). Upper Secondary School Pupils' Attitudes towards Natural Science. Eur. J. Phys. Educ. 4 (1), 78–87.
Allen, S. (1997). Using Scientific Inquiry Activities in Exhibit Explanations. Sci. Ed. 81, 715–734. doi:10.1002/(sici)1098-237x(199711)81:6<715::aid-sce8>3.0.co;2-l
Bamberger, Y. M. (2014). Encouraging Girls into Science and Technology with Feminine Role Model: Does This Work? J. Sci. Educ. Technol. 23 (4), 549–561. doi:10.1007/s10956-014-9487-7
Barron, A.B., Hebets, E.A., Cleland, T.A., Fitzpatrick, C.L., Hauber, M.E., and Stevens, J.R. (2015). Embracing multiple definitions of learning. Trends Neurosci. 38 (7), 405–407. doi:10.1016/j.tins.2015.04.008
Bian, L., Leslie, S. J., and Cimpian, A. (2017). Gender Stereotypes about Intellectual Ability Emerge Early and Influence Children's Interests. Science 355 (6323), 389–391. doi:10.1126/science.aah6524
Brady, A. M. (2005). Assessment of Learning with Multiple-Choice Questions. Nurse Educ. Pract. 5 (4), 238–242. doi:10.1016/j.nepr.2004.12.005
Burns, M., and Medvecky, F. (2016). The Disengaged in Science Communication: How Not to Count Audiences and Publics. Public Underst Sci. 27 (2), 118–130. doi:10.1177/0963662516678351
Colliver, Y., and Fleer, M. (2016). 'I Already Know what I Learned': Young Children's Perspectives on Learning through Play. Early Child. Dev. Care 186 (10), 1559–1570. doi:10.1080/03004430.2015.1111880
Cortassa, C. (2016). In Science Communication, Why Does the Idea of a Public Deficit Always Return? the Eternal Recurrence of the Public Deficit. Public Underst Sci. 25 (4), 447–459. doi:10.1177/0963662516629745
Eaton, S. E. (2010). in Formal, Non-formal and Informal Learning: The Case of Literacy, Essential Skills, and Language Learning in Canada. Editor H.L. Ainsworth (Eaton International Consulting Inc.)
Falk, J. H., and Needham, M. D. (2013). Factors Contributing to Adult Knowledge of Science and Technology. J. Res. Sci. Teach. 50 (4), 431–452. doi:10.1002/tea.21080
Fenichel, M., and Schweingruber, H. (2010). Surrounded by Science: Learning Science in Informal Environments. Washington, DC: The National Academies Press.
Flynn, J. R. (2012). Are We Getting Smarter? Rising IQ in the Twenty-First century. Cambridge, United Kingdom: Cambridge University Press.
A. J. Friedman (Editor) (2008). Framework for Evaluating Impacts of Informal Science Education Projects (National Science Foundation).
Giduthuri, J. G., Maire, N., Joseph, S., Kudale, A., Schaetti, C., Sundaram, N., et al. (2014). Developing and Validating a Tablet Version of an Illness Explanatory Model Interview for a Public Health Survey in Pune, India. PLoS One 9, e107374. doi:10.1371/journal.pone.0107374
Griffin, J., Kelly, L., Savage, G., and Hatherly, J. (2005). Museums Actively Researching Visitors Experiences and Learning (MARVEL): a Methodological Study. Open Mus. J.
Hattie, J. (2009). Visible Learning: A Synthesis of over 800 Meta-Analyses Relating to Achievement. Abingdon, United Kingdom: routledge.
Hernández, S., Fernández, C., and Baptista, P. (2014). Metodología de la investigación [Investigation methodology]. Mexico City, Mexico: McGraw-Hill.
Honomichl, R. D., and Chen, Z. (2012). The Role of Guidance in Children's Discovery Learning. Wiley Interdiscip. Rev. Cogn. Sci. 3 (6), 615–622. doi:10.1002/wcs.1199
Illeris, K. (2018). Contemporary Theories of Learning: Learning Theorists...in Their Own Words. London, UK: Routledge.
Jacobsen, J. W. (2016). Measuring Museum Impact and Performance: Theory and Practice. Lanham, MD: Rowman & Littlefield.
Kahan, D. M., Peters, E., Wittlin, M., Slovic, P., Ouellette, L. L., Braman, D., et al. (2012). The Polarizing Impact of Science Literacy and Numeracy on Perceived Climate Change Risks. Nat. Clim Change 2, 732–735. doi:10.1038/nclimate1547
Kimball, R., and Caserta, J. (2004). “Cleaning and Conforming,” in The Data Warehouse ETL Toolkit: Practical Techniques for Extracting, Cleaning, Conforming, and Delivering Data (Indianapolis: John Wiley & Sons), 113–160.
Krajcik, J. S., and Sutherland, L. M. (2010). Supporting Students in Developing Literacy in Science. Science 328 (5977), 456–459. doi:10.1126/science.1182593
Krapp, A., and Prenzel, M. (2011). Research on Interest in Science: Theories, Methods, and Findings. Int. J. Sci. Educ. 33 (1), 27–50. doi:10.1080/09500693.2010.518645
Beth Kurtz-Costes, B., Stephanie J. Rowley, S. J., April Harris-Britt, A., and Taniesha A. Woods, T. A. (2008). Gender Stereotypes about Mathematics and Science and Self-Perceptions of Ability in Late Childhood and Early Adolescence. Merrill-Palmer Q. 54, 386–409. doi:10.1353/mpq.0.0001
Ladwig, P., Dalrymple, K. E., Brossard, D., Scheufele, D. A., and Corley, E. A. (2012). Perceived Familiarity or Factual Knowledge? Comparing Operationalizations of Scientific Understanding. Sci. Public Pol. 39 (6), 761–774. doi:10.1093/scipol/scs048
Latchem, C. (2014). Informal Learning and Non-formal Education for Development. Journal of Learning for Development Available at: https://jl4d.org/index.php/ejl4d/article/view/6/.
Linder, C., Östman, L., Roberts, D. A., Wickman, P.-O., Ericksen, G., and MacKinnon, A. (2010). Exploring the Landscape of Scientific Literacy. New York, NY: Routledge.
Longnecker, N., Elliot, J., and Gondwe, M. (2014). Inspiring Australia: An Evaluation Tool for Science Engagement Activities. Canberra, Australia: Minister for Innovation, Industry, Science and Research.
Longnecker, N. (2016). An Integrated Model of Science Communication. J. Sci. Commun. 15, 1–12. doi:10.22323/2.15050401
Martin, A. J., Durksen, T. L., Williamson, D., Kiss, J., and Ginns, P. (2016). The Role of a Museum-Based Science Education Program in Promoting Content Knowledge and Science Motivation. J. Res. Sci. Teach. 53 (9), 1364–1384. doi:10.1002/tea.21332
Mattar, J. (2018). Constructivism and Connectivism in Education Technology: Active, Situated, Authentic, Experiential, and Anchored Learning. Ried 21 (2), 201–217. doi:10.5944/ried.21.2.20055
Maxwell, L. E., and Evans, G. W. (2002). Museums as Learning Settings. J. Mus. Educ. 27 (1), 3–7. doi:10.1080/10598650.2002.11510454
Mbewe, S., Chabalengula, V. M., and Mumba, F. (2010). Pre-service Teachers’ Familiarity, Interest and Conceptual Understanding of Science Process Skills. Probl. Educ. 21st Century 22 (22), 76–86.
McKenna-Cress, P., and Kamien, J. (2013). Creating Exhibitions: Collaboration in the Planning, Development, and Design of Innovative Experiences. Hoboken, NJ: John Wiley & Sons.
Mohtar, L. E., Halim, L., Abd Rahman, N., Maat, S. M., Iksan, Z. H., and Osman, K. (2019). A Model of Interest in Stem Careers Among Secondary School Students. Jbse 18 (3), 404–416. doi:10.33225/jbse/19.18.404
Mostafa, T. (2019). “Why Don’t More Girls Choose to Pursue a Science Career?,” in PISA in Focus (Paris: OECD Publishing).
National Academies of Sciences Engineering and Medicine (2016). in Science Literacy: Concepts, Contexts, and Consequences. Editors C. Snow, and K. Dibner (Washington, DC: National academies press).
National Research Council (2009). Learning Science in Informal Environments: People, Places, and Pursuits. Washington, DC: National Academies Press.
Organisation for Economic Cooperation and Development (2016). PISA 2015 Assessment and Analytical Framework: Science, reading, Mathematic and Financial Literacy. Paris: PISA, OECD.
Osborne, J., and Dillon, J. (2008). Science Education in Europe: Critical Reflections. London: The Nuffield Foundation.
Otago Museum (2018). Annual Report 2017-2018 (Dunedin, New Zealand: Otago Museum) Available at: https://otagomuseum.nz/assets/Uploads/Otago-Museum-Annual-Report-2017-2018-DIGITAL.pdf/.
M. d. L. Patiño (Editor) (2013). “La divulgación de la ciencia en México desde distintos campos de acción: Visiones, retos y oportunidades, (México, DF: SOMEDICYT).
Paulhus, D. L., and Vazire, S. (2007). “The Self-Report Method,” in Handbook of Research Methods in Personality Psychology. Editors R.W. Robins, R. C. Fraley, and R.A. Krueger (New York, NY: Guilford Press), 224–239.
Piraksa, C., Srisawasdi, N., and Koul, R. (2014). Effect of Gender on Student's Scientific Reasoning Ability: A Case Study in Thailand. Proced. - Soc. Behav. Sci. 116, 486–491. doi:10.1016/j.sbspro.2014.01.245
Ramey-Gassert, L. (1997). Learning Science beyond the Classroom. Elem. Sch. J. 97 (4), 433–450. doi:10.1086/461875
Ravert, R. D., Gomez-Scott, J., and Donnellan, M. B. (2015). Equivalency of Paper versus Tablet Computer Survey Data. Educ. Res. 44, 308–310. doi:10.3102/0013189X15592845
Salmi, H., Thuneberg, H., and Vainikainen, M.-P. (2015). Mathematical Thinking Skills, Self-Concept and Learning Outcomes of 12-Year-Olds Visiting a Mathematics Science Centre Exhibition in Latvia and Sweden. J. Sci. Commun. 14 (4), A03. doi:10.22323/2.14040203
Serrell, B. (1997). Paying Attention: The Duration and Allocation of Visitors' Time in Museum Exhibitions. Curator: Mus. J. 40 (2), 108–125. doi:10.1111/j.2151-6952.1997.tb01292.x
Shah, K. N., Hofmann, M. R., Schwarzkopf, R., Pourmand, D., Bhatia, N. N., Rafijah, G., et al. (2016). Patient-Reported Outcome Measures: How Do Digital Tablets Stack up to Paper Forms? A Randomized, Controlled Study. Am. J. Orthop. (Belle Mead Nj) 45, E451–E457.
Silvers, J. A., McRae, K., Gabrieli, J. D., Gross, J. J., Remy, K. A., and Ochsner, K. N. (2012). Age-related Differences in Emotional Reactivity, Regulation, and Rejection Sensitivity in Adolescence. Emotion 12 (6), 1235–1247. doi:10.1037/a0028297
Skaalvik, S., and Skaalvik, E. M. (2004). Gender Differences in Math and Verbal Self-Concept, Performance Expectations, and Motivation. Sex roles 50 (3-4), 241–252. doi:10.1023/b:sers.0000015555.40976.e6
Solis, D. H. (2020). Exploration and Discovery: Learning at a Science centre. Dunedin, New Zealand: University of Otago. Doctor of Philosophy.
Stoet, G., and Geary, D. C. (2018). The Gender-equality Paradox in Science, Technology, Engineering, and Mathematics Education. Psychol. Sci. 29 (4), 581–593. doi:10.1177/0956797617741719
Wang, W. C., Brashier, N. M., Wing, E. A., Marsh, E. J., and Cabeza, R. (2016). On Known Unknowns: Fluency and the Neural Mechanisms of Illusory Truth. J. Cogn. Neurosci. 28 (5), 739–746. doi:10.1162/jocn_a_00923
Wehmeyer, M. L., Abery, B. H., Zhang, D., Ward, K., Willis, D., Hossain, W. A., et al. (2011). Personal Self-Determination and Moderating Variables that Impact Efforts to Promote Self-Determination. Exceptionality 19 (1), 19–30. doi:10.1080/09362835.2011.537225
Keywords: scientific literacy, formal assessment, multiple-choice test, scientific knowledge, science centre, content knowledge
Citation: Solis DH, Hutchinson D and Longnecker N (2021) Formal Learning in Informal Settings—Increased Physics Content Knowledge After a Science Centre Visit. Front. Educ. 6:698691. doi: 10.3389/feduc.2021.698691
Received: 22 April 2021; Accepted: 06 August 2021;
Published: 19 August 2021.
Edited by:
Diogo Lopes de Oliveira, Federal University of Campina Grande, BrazilReviewed by:
Ana Claudia Nepote, National Autonomous University of Mexico, MexicoJessica Norberto Rocha, Fundação CECIERJ, Brazil
Copyright © 2021 Solis, Hutchinson and Longnecker. This is an open-access article distributed under the terms of the Creative Commons Attribution License (CC BY). The use, distribution or reproduction in other forums is permitted, provided the original author(s) and the copyright owner(s) are credited and that the original publication in this journal is cited, in accordance with accepted academic practice. No use, distribution or reproduction is permitted which does not comply with these terms.
*Correspondence: Daniel H. Solis, ZHNvbGlzQGlwbi5teA==