 Kathleen Scalise
 Mark Wilson
 Perman Gochyyev
- 1Department of Educational Methodology, Policy, and Leadership, University of Oregon, Eugene, OR, United States
- 2Graduate School of Education, University of California, Berkeley, Berkeley, CA, United States
- 3Berkeley Evaluation and Assessment Research Center, University of California, Berkeley, Berkeley, CA, United States
From a measurement perspective, a variety of analytic approaches are fast emerging in the data mining and exploratory analytics branches of the field of data sciences. In particular, for learning analytics, more theory is needed showing how the analytical approaches are related to one another and to their respective purposes when measurement is involved. For example, machine learning acting on process data can yield sets of specific patterns as results, but the critical question from a measurement perspective is: What do these results mean and how can they be used successfully in learning analytics? That is, if the goal is to make an inference regarding some underlying variable or set of elements about a student (or a teacher, school, or other agent or program within an educational setting), what claims are being made regarding the evidence and how can learning analytics contribute? In this paper we introduce techniques that move toward theory extensions that need to be developed at the intersection of learning analytics with measurement technology. For elucidating potential theoretical components from a measurement perspective, we draw on a type of case study research in the computer science domain, specifically employing “use cases.” A use case in computer science describes a scenario of use for software. Different use cases can describe different situations in which software may have utility. Like other multi-case designs, use cases can offer a means of exploring relationships and advancing potential theories by comparing similarities and differences among the cases. Here we explore three LA use case examples that differ purposively in critical ways. Examining their similarities and differences highlights potential dimensions that distinguish among emerging LA use cases at the intersection of data science and measurement technology.
Introduction
In the field of learning analytics, it is critical to consider the meaningful interpretation of data analysis, not simply the reporting of the results. This is especially key when complex data analysis methodologies and process data are employed. One helpful direction may be to explore the state-of-play in the overlap between learning analytics (LA), specifically data mining and exploratory analytics, and the field of measurement science. Recently termed “metrolytics” (Milligan, 2018), the goal of studying this overlap is to combine measurement science and learning analytics to yield data science with a robust interpretive focus especially for complex and rich data sets.
From an evidentiary perspective, some researchers such as Sclater (2014) and Wilson et al. (2012, 2016) have begun to establish standards of practice in learning analytics for 21st century complex data analysis methodologies when measurement is involved. Others describe the need for conceptual frameworks when LA goes beyond data analysis alone and is to be used for predictive analytics, actionable intelligence, and decision-making (van Barneveld et al., 2012), all of which arguably have relationships with formal measurement and assessment.
Brief Overview of Literature on the State of Taxonomies in This Area
In this paper we employ use cases to investigate if it is possible to develop and exemplify a set of critical dimensions in LA at the intersection specifically with measurement science. Before proceeding to examine the potential for theory generation through examining such use cases, we briefly discuss some taxonomies already described for learning analytics. These manuscripts make helpful and important contributions to the literature on learning analytics. They are taking a broader view of LA than we do in our contribution, which is aiming to point out previously under-developed elements that intersect with measurement science.
For instance in 2012, researchers developed an important “reference model” for learning analytics (Chatti et al., 2012). The researchers pointed out that LA was an emerging multidisciplinary field bringing together a great deal of complexity so taxonomical work was needed. Not only might LA include machine learning, they described, but also artificial intelligence, information retrieval, statistics, and visualization. Applications were diverse and would become more so: from academic analytics to action research, educational data mining, recommender systems, personalized adaptive learning, and more.
The Chatti et al. (2012) paper proved insightful. It cited the most recent Horizon Report at that time (2011) and other sources to document the importance of the emerging complexity. This emergence has since blossomed such as in subsequent Horizon reports (2020; Adaptive Learning Technologies) and led to a diaspora of literature about applications of learning analytics. However we see gaps and blind spots in the taxonomy specifically in relation to measurement and consider that attention to this is urgently needed. The four dimensional reference model developed in the 2012 paper was and remains important. It suggested organizing LA into quadrants based on four essential questions: What kind of data and systems were employed, who was the intended inference about, why were the analyses undertaken, and how were the analyses to be conducted?
The Chatti et al. (2012) reference model has overlaps with a measurement perspective, in particular in the “why” and “how” questions. For instance, under “why,” the researchers discussed that there are many objectives for LA, and cited six, such as adaptation to the needs of the learner, where sound measurement of needs is of paramount importance. Another LA “why” cited “monitoring and analysis,” where objectives were described as tracking student activities and generating reports in order to support decision-making by the teacher or school. Each of these involves important measurement concepts which are crucial to the success of efforts to address them.
Specifically, among the measurement challenges is the characterization of the important dimensions of both the learning environment and the learning processes of the students as they progress through those environments. Measuring them both well involves challenges discussed extensively in the measurement literature. In recent years due to innovative forms of assessments, there has been extensive innovation in measurement in these questions and also in the “what” question–and even the “who” question may be answered. No longer does “who” refer only to the person but also may be a program evaluation, audit or other more systemic process, artifact or action.
In summary, we believe the LA agenda in terms of the dimensions in the Chatti et al. (2012) reference model has significant overlaps with the measurement agenda. Indeed, much of the work is situated within the sub-domain of innovative measures due to the “what” nature of the data and the systems, which increasingly include semi-structured and unstructured data. These become complex measurement challenges that demand measurement principles and tools to examine their validity and claims of inferences, especially in the arena of latent variables and predictions as well as manifest variables with deterministic training sets.
The overlap is also reflected in the “how” dimension, as most of the analysis tools listed in the Chatti et al. (2012) paper are shared with formal measurement. The analytic approaches sometimes but not always employ innovative methods and innovative observables for which there is now an extensive measurement literature.
The question we ask nearly a decade after the publication of this reference model then is why have measurement principles and practices not been prominently examined in the LA literature in the ensuing years? And to help address this need, can emerging use cases examined purposively begin to generate theory toward these questions that remain mostly unaddressed at the intersection of LA and measurement science?
An additional 2012 manuscript introduced a contrasting but related LA typology (Greller and Drachsler, 2012). It described six emerging topics (“dimensions”) in LA based on analyzing discussions at that time in the field using general morphological analysis. This method explores the topics of current conversation in a field. It is similar in some ways to typology analysis. The six topics identified most in LA conversations at that time included stakeholders, objectives, data, instruments, so called (by the paper) external limitations such as privacy and ethics, and so called (by the paper) internal limitations such as interpretability and understanding inferences made.
The Greller and Drachsler (2012) typology paper also well described the complex field of LA emerging in 2012. It employed the concept of LA as “multilayered,” acknowledging the complexity of the emerging field. Again there are strong, though unexplored, measurement concepts implicit in the typology in this paper. These are not explicitly described or handled in the theoretical typology frame, which is not surprising considering the morphological analysis and early timing of the paper. Little had taken place at the intersection of LA and measurement at that time. However from the perspective of educational measurement, six of the nine scenarios in the paper’s example table are inherently measurement situations and thus, one needs to consider how one can address the measurement standards, in the conversations which have emerged extensively since then:
• Predict Student’s Performance
• Individualize Learning
• Evaluate Social Learning
• Improve Learning Materials and Tools
• Assessment of Personal Learning Environments
• Support Educational Decision Making
A later 2017 paper returned to the multi-layered perspective (Nguyen et al., 2017). This later paper does acknowledge that measurement extensions are needed in LA taxonomies. For example, in describing the chief goals of LA, it included a definition of a latent variable, the heart of modern educational measurement. However, an example of where further elaboration was needed in the 2017 “layers” was that the paper does not consider whether the particular LA latent variable approach in a given product employs latent class techniques (such as in many cluster analyses), or latent continua (such as in some neural network applications).
These are key foundational questions in aggregating and interpreting data from a measurement perspective. The decision of which type of modeling to employ can lead to different conclusions, result in different inferences and different implications for students, and hence require justification if to be used validly in educational analytics that result in consequences. Consequences as described in the Nguyen et al. (2017) paper can include course placement and supporting other types of educational decisions on behalf of students. These types of omissions will be a vexing “internal limitation” for interpreting LA results effectively; thus the limitation falls under the typology’s topic on interpretability and understanding what inferences can be made.
Interestingly, in the Nguyen et al. (2017) paper another key measurement concept of constructs emerges, under “Instruments” (p. 50):
“Under the dimension “instruments” in our model (Figure 1), we also subsume conceptual instruments such as theoretical constructs, algorithms, or weightings, by which we mean different ways of approaching data. These ways in the broadest sense “translate” raw data into information. The quality of the output information and its usefulness to the stakeholders depend heavily on the methods chosen.”
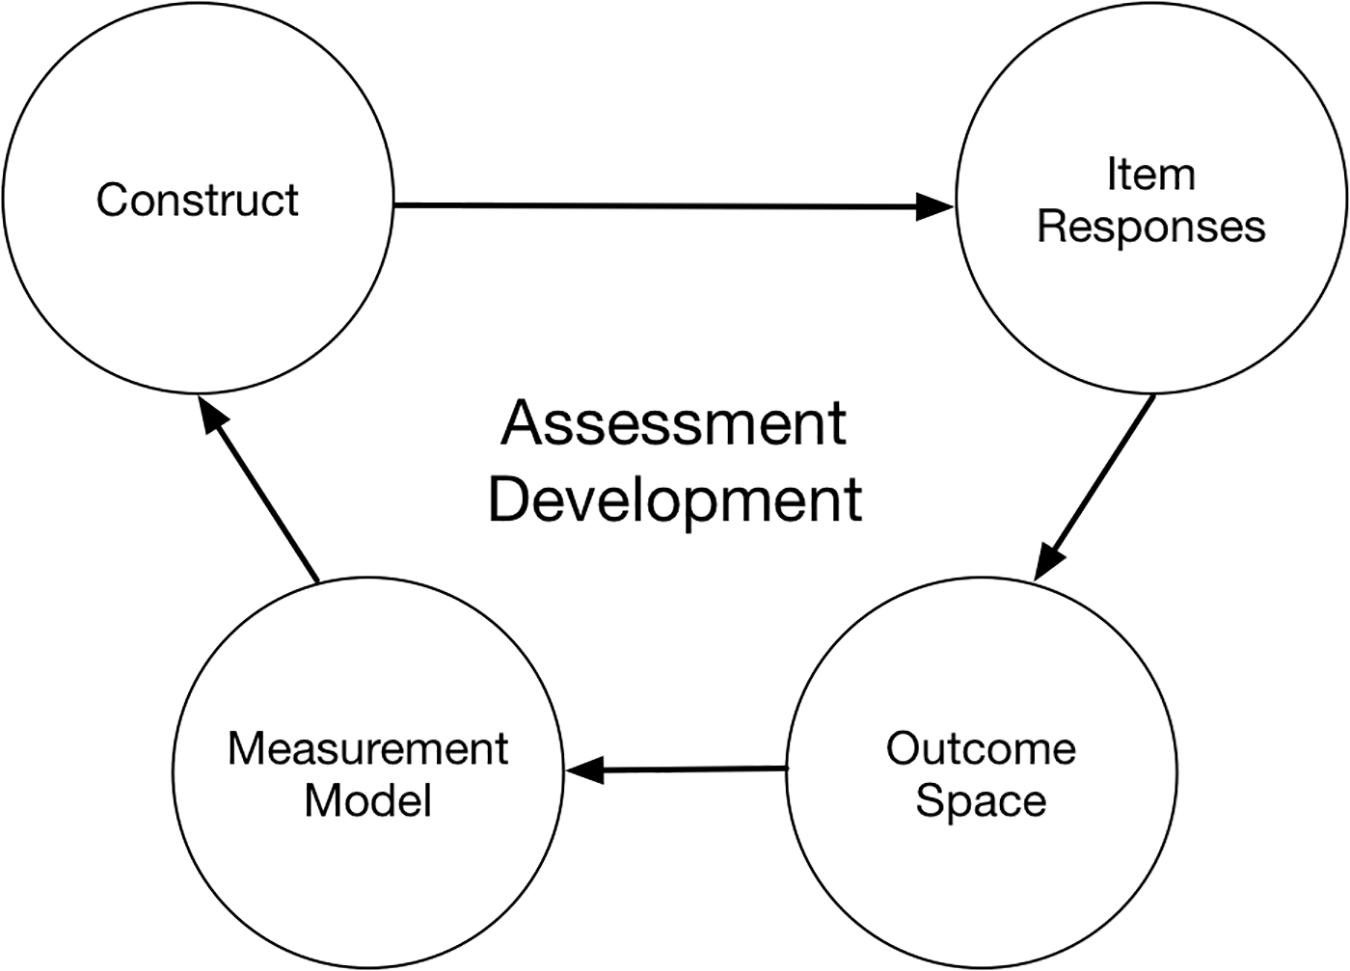
Figure 1. BEAR Assessment System.
With a bit of editing, we note this description could be drawn from a typical measurement textbook. These papers help show that LA scholars have been converging at least in very basic ways on important topics at the interface of LA and measurement technology in recent years.
Learning analytics often attracts scholars with different scholarly preparation, discourse language, epistemologies, ontological commitments, and pedagogical grammars from measurement scholars. Early on, measurement concerns in LA that were treated in a sentence or paragraph by one group of scholars might consume volumes elsewhere on the same or similar topic in the measurement and assessment literature. In modern software products, it is critical to consider these aspects together.
Exploring Use Cases to Move Toward Theory Extensions
Since directly mapping to discourse between the communities of practice is challenging due to the different foci of the communities, our work here uses techniques of exploring use cases to suggest how we might move toward needed theory extensions. Examining specifically what commitments are being made in different software is possible through use cases.
A use case in computer science describes a scenario of use for software. Different use cases can describe different situations or scenarios of use in which software may have utility, and the same or different software may be examined within and between cases. Like other multi-case research designs, employing multiple use cases can offer a means of exploring relationships and advancing potential theories by comparing similarities and differences among the cases (Miles and Huberman, 1994; Colquitt and Zapata-Phelan, 2007; Eisenhardt and Graebner, 2007; Ridder, 2017). This can especially be true when cases are purposively selected, if an array of key cases can be identified that may occupy different parts of the space.
With each use case then, we can pose essential questions. For our work, first we selected three cases on a purposive basis at the intersection of LA and measurement technology, to range from (a) more traditional LA to (b) a mix of LA and measurement science to (c) more traditional measurement science. Then three measurement scholars working also in LA and data science but with different backgrounds examined each case together and discussed specifically the measurement attributes while understanding its LA objectives–what aspects of measurement technology could be observed that the use case was specifically employing?
As each aspect emerged that could be observed from the first to the third use case, did decisions on the same aspect come into play in the subsequent use cases? If so, did different decisions around these aspects appear to influence how the product performed and what inferences could be claimed and validated? Could this lead to the concept of a spectrum or at least nominal or ordinal categories within each identified aspect?
Once all three use cases were examined and a set of aspects emerged, we returned to each case and examined it with respect to each aspect. Note that we are not claiming enough use cases were examined among these three to be exhaustive but rather to be informative. Nor were we claiming that additional raters would note all the same aspects in this emerging field, so not only are more perspectives welcome but indeed we do not attempt to generalize here but to note directions that future theory might take. Indeed, future explorations are needed to generalize the work.
Here, the aspects were renamed as “dimensions” to capture that a spectrum of decisions was often observed. We asked, how is each dimension addressed in a given use case? Can we apply the dimensions to see if we can successfully classify the three use cases purposively sampled? We finally conclude not by attempting to generalize from so few use cases, but by discussing needs for future directions of the field, where an intersection between data science and measurement technology is developing and needs more thorough examination and theory generation.
Therefore, the nature of the taxonomy described here is a set of critical dimensions at the intersection of LA and measurement science that we intend to be applicable to a range of different use cases and helpfully depict the differences among them. We believe this is an initial step toward satisfying the need for new conceptual frameworks at the intersection of measurement and LA, and will be helpful in moving the field forward, especially by encouraging others to debate our suggestions. Of course, many more use cases would need to be examined to extend thinking here, and we do not expect this initial exploration to be an exhaustive approach.
Process data enters into this discussion because it has been traditionally little collected in large-scale educational measurement but has been extensively collected in e-learning contexts. We created the taxonomy here from our own experiences and reflections, and focused it by examining three different use cases that were purposively sampled to represent a range of typical contexts, all from technology-enhanced (TE) applications since this is where data sets including process data are most plausible and currently richest. To be more likely to encounter useful differences among use cases to distinguish the start of a taxonomy, we selected a TE range that spanned the contexts:
• From primarily a large-scale educational measurement context,
• To a context blending measurement goals and analytics during e-learning,
• To a context primarily involving analytics during e-learning.
We describe these contexts in more complete detail in section “Introducing Three Use Cases”.
Definitions and Use Cases
Some Brief Definitions
A commonly used definition of learning analytics that we will draw on here was proposed by the first international Conference on Learning Analytics and Knowledge (LAK, 2011) and adopted by the Society for Learning Analytics Research at the 21st International Conference on Learning Analytics and Knowledge (Gasevic et al., 2011, p. 5):
“Learning analytics is the measurement, collection, analysis and reporting of data about learners and their contexts, for purposes of understanding and optimizing learning and the environments in which it occurs.”
While this definition is helpful, two additional aspects are important to consider from a measurement perspective as noted by Wilson and Scalise (2016): the interpretation of results, and the choice of appropriate data types and algorithms.
Interpretation is not directly included in the LAK/SoLAR definition of “collection, analysis and reporting.” This weakness in the definition can lead to the assumption that once results are composed and reported, their meaning for learners and learning outcomes is self-evident. Hence Wilson et al. (2016) offered an extension to the definition to include interpretation.
However, that said, learning analytics as described in the LAK/SoLAR definition constitute a type of educational assessment. As such, meaningful interpretation as Wilson notes Wilson (2005) usually means having an evidentiary framework designed to connect results clearly and on an empirical basis back to the goals and objectives of the analysis. This can help to make clear evidentiary claims about the learner (Mislevy et al., 2003). It also means being able to understand the uncertainty or range and degree of error likely to be present in the results.
In learning analytics, the need to establish a coherent evidentiary argument to support claims about learners can be approached either a priori, therefore in advance of the analysis, or a posteriori, therefore following the analysis. The a priori approach is essentially a theoretical approach, based on a strong theory or prior empirical information (or better, both), and thus might be considered a confirmatory learning analytic technique.
The a posteriori approach can be considered generative, or in other words, exploratory, and in many cases will need to be confirmed by a subsequent data collection and analysis. The exploratory approach is sometimes called by the name “data mining” (Papamitsiou and Economides, 2014). Exploratory approaches can be useful when the goal is to learn more about the patterns in the data sets in a context where little is yet understood, or where new patterns may become evident that were not previously suspected.
The choice between an exploratory or confirmatory approach will be limited by the availability of theory and prior results. Put together, these exploratory and confirmatory stages can be seen as a cycle in the evidence chain, as Wilson, Scalise and Gochyyev previously described and exemplified Wilson et al. (2016). Learning environments for either approach may require extensive data. Adaptive technology platforms may collect “big data” as described by Wilson et al. (2018).
The data structure employed in LA can also generate complexity, with formats ranging from unstructured to semi-structured and structured data. Integrating together data sets with a variety of structures can provide a higher degree of flexibility when examining large amounts of data to uncover and explore patterns, so new tools are emerging to integrate and explore across data types for big data (Monica and Kumar, 2013; Praveen and Chandra, 2017). The structured data type encompasses all data that is possible to store in relational databases, for example as in Structured Query Language (SQL) with tables consisting of rows and columns. Entries typically have relational keys and can readily map onto designed fields. Analysis tools such as traditional statistical packages can be applied to investigate patterns and relationships in the data sets.
Semi-structured data do not reside in relational databases but will have organizational guidelines or rules that structure the data. Examples for learning analytics are common in the collection of “process data” or actions taken by students in online activities, which usually are collected in semi-structured formats such as:
• Extensible Markup Language (XML) that defines a set of rules for encoding documents in a format that is both human-readable and machine-readable.
• JavaScript Object Notation (JSON) that uses human-readable text to transmit data objects in the form of attribute–value pairs and array data types.
• NoSQL databases that specify relationships other than in tabular form such as through cyclic or acyclic graphs with nodes and arcs.
Unstructured data, by contrast, may be audio, video, text, animation, multimodal, or many other formats. It may have human-readable internal structure but generally will have no pre-defined rules or syntax for parsing the data by machine. While there is a gray area in degrees of structuring that may involve tags such as metadata about the data, unstructured data objects will have no established machine-readable schema or ontology. In learning analytics this may include student work products such as essays, problem solutions, drawings, and audio or video productions; chat logs, email and texting such as in collaborative tasks; and even some social media and mobile data when captured in full transcript or as bitstream rather than in pre-defined attributes as in XML or JSON.
Much of what goes by the name of learning analytics in educational systems today consists of work associated solely with structured data: student credit award or denial, enrollment, attendance, recruitment and retention records, graduation rates, gradebooks, transcripts, survey data and other fully relational data such as may be collected and stored in student information systems or administrative systems. While investigating structured relationships in such data warehouses can be important for educational systems, techniques for analyzing and interpreting such data sets have been explored for many decades and their use is not new to data science, statistics, etc. By contrast, process data almost always takes the form of either semi-structured or unstructured data. As such, techniques for analysis and use are much less well understood. In trying to encompass how to deal with this more complete data form, it would be helpful to have a set of key elements that can distinguish the range of applications, and so next we consider some use cases to abstract possible critical dimensions.
Introducing Three Use Cases
As the research literature at the intersection of LA and measurement science is sparse, what can be gleaned readily from the LA field to date are aspects of use, or use cases. In this section we introduce a set of use cases from which we will draw elements to consider the start of a taxonomy of dimensions. In this way we describe the work here as “toward” generating theory; we do not begin with hypotheticals except to say that we believe this area is an important emerging interface and more conversation is needed between fields. More discourse will help to support inferences and evidentiary claims being made about learners.
The use cases and taxonomic dimensions derived must of course relate to many of the topics discussed in the brief literature review above. Here however we intend to go beyond the simple presence or absence of the literature elements in a particular use case, and begin to describe a taxonomy. If a taxonomy of critical dimensions at the intersection of LA and measurement science is to be useful, it should apply to a range of different use cases and be able to helpfully depict the differences among them. So we selected three use cases purposively sampled to provide a range of uses–rich in process data in some cases and less so in others–and examine how the use cases are classified by the dimensions of the taxonomy.
Use Case 1: Smarter Balanced (SB) Summative Assessment in ELA/Literacy and Math
Now housed at the University of California-Los Angeles (UCLA) Graduate School of Education and Information Studies in the United States, Smarter Balanced is a public agency that prepares and administers assessments in Language Arts/Literacy and Math used for some state assessments in the United States (Smarter Balanced, 2018). The smarter balanced (SB) assessments are aligned to the Common Core State Standards (National Governors Association Center for Best Practices, and Council of Chief State School Officers, 2010), and consist of formative assessments, interim assessments, and summative assessments. We focus here for the use case example only on the summative assessment and not the full SB system.
Smarter balanced follows a traditional item generation procedure, including a framework that drives (a) definition of aim of item, (b) either (i) a creative process carried out by professional subject matter experts (SMEs), or (ii) a cloning process carried out by SMEs, and (c) an item-trialing procedure including small scale implementation within trial slots in regular SB implementations, item paneling by a committee of professionals with relevant qualifications and skills, and empirical results from pilot administration to inform decisions for the main study.
The metacognitive element of SB is mainly related to the test-wiseness of the respondents, which is in part due to specific SB test-training that occurs by teachers in schools, the interim components of SB, and the residual of “test-prep” that is inherent in the United States student population due to the commonality of test-use for significant decisions about students. In SB, the measurer determines the entirety of the test content. The individual respondent is the focus of SB reporting, but the results are usually also aggregated to higher levels.
In SB, we see a classic depiction of measurement science at least in the United States as of the late 20th century as manifested in a state assessment, with also a number of innovations for 21st century designs such as somewhat richer new media in some prompts, some innovative item types, and an adaptive algorithm to select individual forms. The SB case was intentionally selected to capture a fairly classic “testing” example for use case 1. Note that the collection, analysis and use of process data which was explored for SBAC in its early years was not implemented then, in part due to limitations of the delivery platform. Examples of materials can be seen at the SB site.
Use Case 2: The Khan Academy Beta Product (KAB)
In the Khan Academy Beta Product (KAB), Web 3.0 learning analytics are built in to assist users and teachers to drive a personalized design for instruction and tutoring. The design process within KAB consists of writing items by content experts and can be refined based on feedback from KAB users. In KAB, the aim in the design process is to create a pool of items and process data such as time to help students to master a breadth of skills and concepts. Therefore, the focus is not on generating a scale score but the end result of the claims is the same or similar, since a range of content is sampled to make an inference on whether the student has achieved proficiency in a given area of the construct.
In KAB, the system is designed to compare a student with themselves, showing their performance progress across time. Indicators are categorical, but continuous indicators (e.g., time to respond) can also play a role in inferences on mastery and hence helping to determine the next question. Items are considered fixed and are drawn from an item pool. Concerning modeling, for the portion of KAB examined here, the model performs a binary classification for each of the attributes. The underlying premise of the model is that there is a curriculum map that also has pre-requisites (i.e., ordering of the skills), and completing one skill means that the respondent is ready to move on to the next. If a respondent struggles with that next skill, they are expected to go back and review the skill that came before it.
The model uses a deterministic approach to classification–the wrong answer means zero mastery and correct answers represents a full mastery. As a result, false positives and false negatives pose a risk in cases when the student gets lucky, or not, and provides a correct response to an item without mastery, or if they are slipping up on one of the items for a construct-irrelevant reason or measurement error and then are expected to review a skill that actually they knew. In the KAB assessment system, the student ability is dynamic, in the sense that interventions take place and the classification results of the student are updated.
Use Case 3: Harvard Study on Virtual Performance Assessments (VPAs)
Designed originally at Harvard Graduate School of Education to assess students while engaged in science inquiry, Virtual Performance Assessments (VPAs) have many qualities of learning games, as explored by Scalise and Clarke-Midura (2018). Learning games target acquisition of knowledge as its own end and foster habits of mind and understanding that are generally useful and/or show utility within an academic context (Klopfer et al., 2009a,b).
Learning games are being used in some cases to collect student assessment evidence, and can often involve feedback or teaching interventions (Halverson and Owen, 2014). The VPAs, however, are not intended to teach but are built for the purpose of assessments that are intended to provide a rich immersive context to students for evidence generation in scientific inquiry. The VPAs are built using underlying standards for science performance expectations that teachers, schools, districts, or states use to assess science understanding including scientific inquiry practices for K-12.
In VPA, the assessor specifies a universe of overall content and the total pool of observations that can be collected. In this way, the Q-matrix (i.e., the content) is fixed in VPA, but students can make many choices through the gamification elements. The system is designed to collect cross-sectional information on a student’s performance, therefore the person estimate is static and not dynamic. While it is acknowledged by developers that learning may take place within the VPA, learning is not the intended outcome. Sessions are intentionally kept short, do not provide instructional feedback, and are not intended to change performance on the latent traits for subsequent observations. Parallel forms are constructed in the VPAs.
Toward a Theory of a Taxonomy: Deriving Some Sets of Critical Dimensions
With use cases described, we next want to consider whether a set of elements that may be critical at the intersection of measurement and LA can be usefully considered as “dimensions” in a conceptual taxonomy based on the use cases as well as the literature described earlier. We see such “dimensions” very modestly specified at this time as only a set of ordered categories along a spectrum. In other words, can a set of key elements be described that take on a variety of different ordinal values in different LA use cases?
More dimensions could of course be added or some removed as the field matures. In our process of examining use cases we identified ten initial elements. The first five are primarily theoretical, and so will be grouped in one section for this paper. The remaining five are statistical, and need to be presented with modeling from additional use cases. We introduce the theoretical set here as Conceptual Elements.
Summarizing Five Conceptual Elements
After examining the use cases, which are summarized above, we identified five conceptual elements that span a gamut of considerations. For clarity, first we summarize the five conceptual elements found. Then we return to the use cases and show how we found them to vary in these elements. We summarize the five conceptual elements in this section as:
• The extent to which a designed process is employed, which we call coherence of the evidentiary design.
• The extent of “stealthiness” or intentional unobtrusiveness of the evidence collection, which we call self-awareness of being assessed.
• The extent of respondent choice or adaptivity involved, which we call respondent agency.
• The focus or use of the intended inference(s), whether they are aimed at the persons under assessment, or other aspects of the assessment context, such as categories of the responses, processes, systems, contexts, societal outcomes, and so forth. We call this the focus of assessment.
• The extent to which the methodology employed in the design and analysis is made public, which we refer to as open-ness.
As a group, the five together may seem somewhat bewilderingly diverse. Yet they are important elements along which LA tools and methods then span a spectrum of approaches, and do intersect with educational measurement. So the elements themselves seem important to collect and consider.
In each case, we also propose some values along the spectrum for the dimension. This information is embedded into the table cells in Table 1, and more fully developed in the text in the next sections.
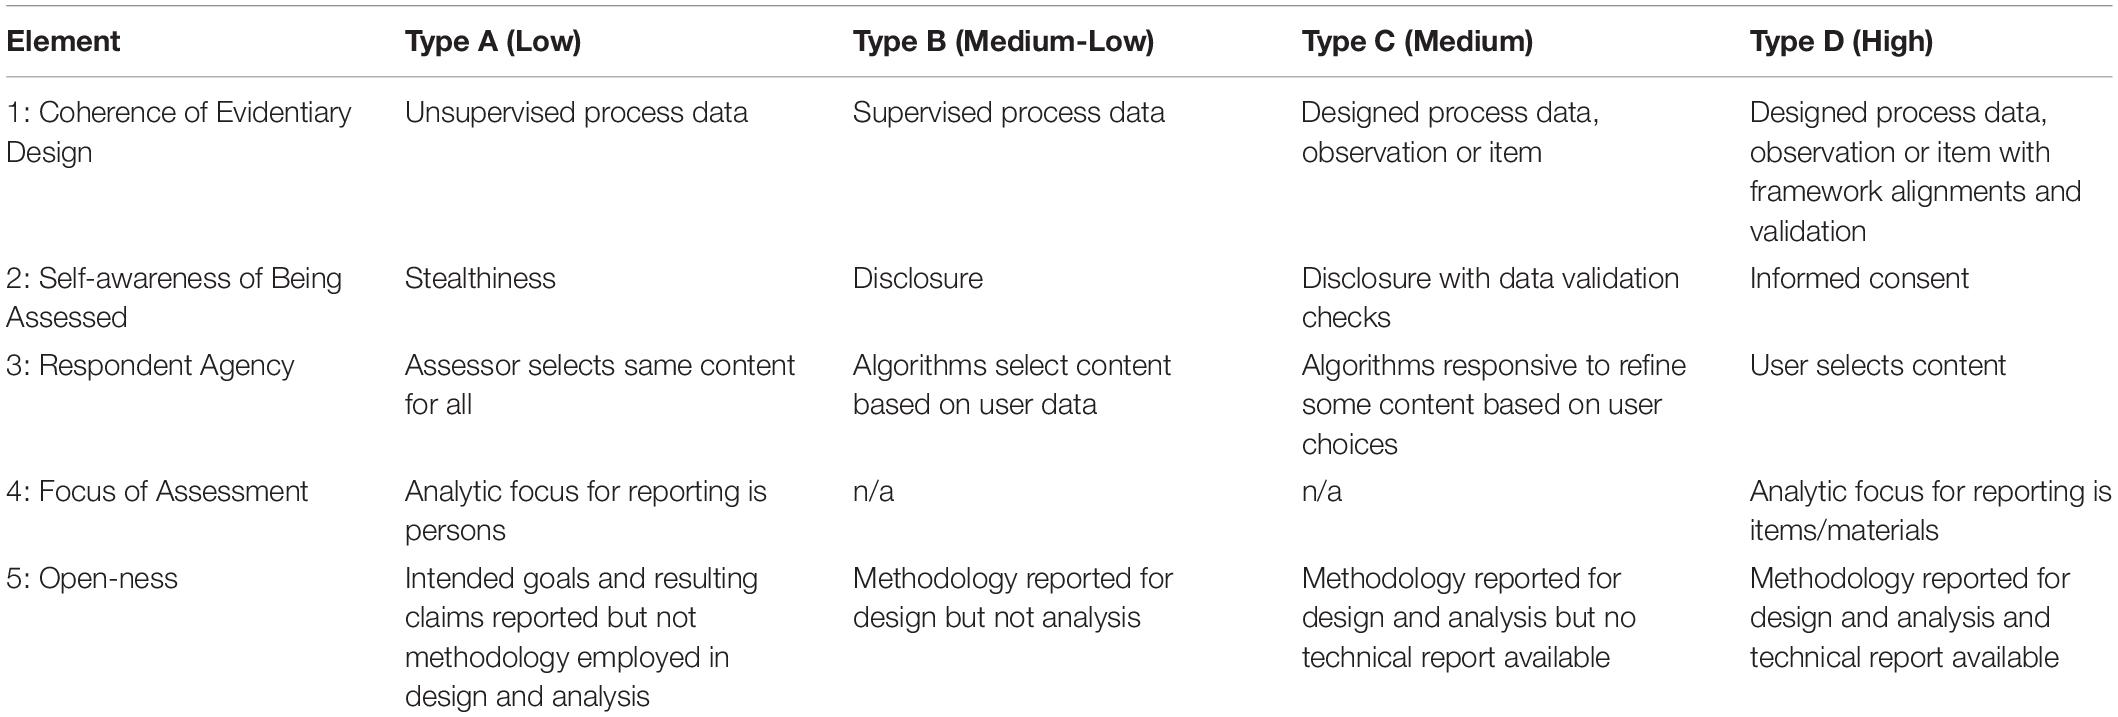
Table 1. A taxonomy of elements at the intersection of measurement science and learning analytics.
A key question that arises at this point is why these five conceptual elements? For instance, are these five elements the most useful and important to distinguish conceptually at the intersection of measurement and LA, and if so, how? At this point we refer back to the purposes in the introduction of this paper. Our objective was to try to begin clarifying the differences–and thus by contrast perhaps similarities–in this complex emerging arena at the intersection of measurement and LA.
To do so, we purposively sampled a small but representative set of use cases and then explored ways in which they differed, producing the set of five conceptual elements. At this point, we do not yet know if these are the most key elements in describing uses at this intersection. We do describe below, however, how the elements seem to usefully distinguish between the cases. Could there be other important elements? Definitely. We use the rest of the paper to better describe what the elements identified so far are, how they relate to the use cases, and why they may seem helpful and important. We acknowledge this is based only on exploration of the purposively sampled use cases so far, and look forward to seeing if the elements apply in other cases, and also future implications of whether systematically varying some of the elements, such as might be done with A/B testing approaches in online contexts, could prove helpful for future work.
Categories and Ordinal Directions: Composing a Preliminary Taxonomy
Since an ordinal variable is a categorical variable for which the possible values are ordered, each critical dimension involves not only a set of categories, but the arrangement of categories into an ordering. Table 1 shows the elements described in the upcoming sections, arranged to include a set of possible categories to reflect the discussion in the last section. We have also added a direction of ordering for each to reflect how the variation has been described in the prior sections. Other categories and arrangements of ordering could be possible but here we pose those discussed in the paper with the goal of comparing this ordering to our set of use cases in the next section.
Coherence of the Evidentiary Design
We begin with the degree to which the evidence collected for the analytics process is derived via a designed process. Here we reference back to the definitions of structured, semi-structured, and unstructured data provided earlier in the paper. This is a common view for data scientists, who may see structured and semi-structured data sets as derived from a designed data collection process, while unstructured data is deemed as not being derived from a designed process. This, however, would be an incorrect interpretation from a content analysis standpoint. A designed process here encompasses approaches by which the construct of interest is described and specified, appropriate observations for the intended purpose are designed to elicit evidence about the construct, and an approach for interpreting the evidence and aggregating it for the intended purpose, related both to the construct or constructs, is specified.
We have noted a range on the spectrum of this critical dimension can be categorized as sampling from low to high for (a) process data that is unsupervised, or in other words not organized a priori with a training set providing elements or dimensions for the analysis (b) supervised process data that includes providing elements of dimensions for the analysis to (c) designed observations or items provided with dimensions or elements for the analysis to (d) the same as in (c) but with framework alignments and substantive validation supporting the design arguments (see Table 1).
Considering coherence of the evidentiary design in learning analytics, we see that the observations may be intentionally designed as structured, semi-structured or unstructured. What matters beyond this is whether the design also includes approaches for interpreting and aggregating whatever the selected evidence is–in other words, can we interpret and aggregate the evidence, validate inferences and relate them back to the construct, based on a pre-defined set of design ideas?
When such processes are in place, this has been described as a coherent evidentiary process (Mislevy et al., 2003). In education, approaches may involve domain modeling, models of the learner, and depictions of how to identify and aggregate observable evidence in a variety of formats (Haertel et al., 2012). Employing principles for a coherent assessment system is advocated as Wilson describes Wilson (2005).
Designed coherence to an evidentiary process is something that necessarily occurs first, and therefore it is the first element we identify here. In learning analytics, data mining for “found” results can be helpful and provide utility to developing understanding of new patterns in student learning data. But data mining is at a different end of the spectrum on this element from approaches based in coherent evidentiary design.
It is important to note that at the intersection of measurement science and learning analytics, the place where an approach falls on the spectrum of a given element does not implicate a value judgment. Various approaches can be effective depending on the intended purpose and the degree to which the approach yields inferences that are helpful and can be validated, interpreted and utilized for the given purpose. However, we do take the stance in this paper that approaches which differ on this element do have some fundamentally different attributes that are important to understand. Thus, both for selecting the approach and for determining its utility for achieving the intended purpose, we list “designed process” as the first element in a proposed taxonomy.
As a general vantage point, less design coherence implies that more discovery is taking place during the analysis itself. Therefore in cases of low coherence, the analysis is more exploratory than confirmatory. More design coherence, by contrast, supposes pre-structured ideas that could then have the potential for evidence collected about them to be more confirming or disconfirming, depending on the design and quality of the evidence collection. Wilson and Scalise described this as an exploratory/confirmatory cycle that may take place via variation in the analytic techniques employed Wilson and Scalise (2016).
Self-Awareness of Being Assessed
We next take up an issue that has received much discussion and attention in measurement science contexts but seemingly more limited discussion in learning analytics–the extent to which the person who is supplying information is aware of that fact. Here we discuss this not so much from the view of social desirability, as has often been a strong consideration in survey research (Tourangeau et al., 2000), but rather, for the intersection of measurement science and learning analytics, we take up the perspective of metacognition and the degree to which the respondent is aware of being assessed when evidence is being sought.
Respondents may differ in their response patterns depending on the degree to which they are metacognitively aware that they are engaging in a process for evidence collection, or in other words engaging in something that will be used as an assessment. Thus, the dimension here is specified by the degree of stealthiness involved in the evidence collection (Snow et al., 2015; Shute and Ventura, 2018), also called “unobtrusive ubiquitous assessment” (which sounds nicer) in some settings. We suggest a range on the spectrum of this critical dimension can be categorized as self-awareness by respondent, from the low end of awareness of being assessed to the high end, as (a) stealthiness, (b) disclosure, (c) disclosure with data validation checks, and (d) informed consent.
On this spectrum, an example of “low” might be a videogame with evidence taking the form of digital logs of student actions during gaming while students are not aware of being assessed, which is stealth assessment that does not draw on awareness during responding or metacognition for the respondent (see Table 1). A medium state of transparency might be keeping the assessment engaging and interactive which will tend to take the focus off the evidence collection but nevertheless informing students they are being assessed in advance and including them in data validation checks during the assessment that will tend to interrupt the flow of activity. A high state of awareness might be where students or their parents or guardians provide informed consent and who also respond in formats that are traditional in assessment contexts, such as multiple-choice selected response in a survey or performance instrument.
Stealthiness is applied in numerous LA assessment contexts, with the name derived from assessments in gaming. Gaming developers have asserted that stealth assessment is useful to combat student disengagement from school or learning contexts, to provide more continuous or ongoing measures of learning, and to supply opportunities to apply complex competencies such as problem solving and persistence (Shute et al., 2016; Shute and Ventura, 2018). It is not clear that these last two are restricted to stealth-like contexts, although they may, of course, be present in such.
On the one hand, embedding assessments within other activities or using found data not intended for evidence accumulation can take the focus off students being aware that evidence is being gathered, so unobtrusive assessment may be less threatening or anxiety-provoking in some cases. On the other hand, finding only after the fact that data has been gathered and used may also be quite threatening and anxiety-provoking, and of course, never being informed, even after the event, can have other serious consequences. At the same time it is subject to all the issues of stealth in educational contexts, including over-riding assessment considerations such as measurement standards; the need for construct, content and consequential validity; and the complicated paradox of claiming informed use when the goal is to obscure use on a moment-to-moment basis.
Once again we encourage the reader to suspend seeing location on a “stealth” spectrum as intrinsically of more or less value in any absolute way, although some who are advocates or critics of stealth may disagree with this view. Rather when at the intersection of measurement science and learning analytics, utility is dependent on characteristics such as purpose, validity and the student experience. Similarly to the first element of the degree of design process, whether stealthiness is useful or not, and the degree of stealthiness that might be employed, is likely to be determined by the intended purposes and to what degree the evidence collected is useful, valid and interpretable. However, since different approaches do vary in this element across use cases, as we will show in our examples here, this can have important implications. So it seems important to identify the stealthiness in each LA application.
Respondent Agency
For a third critical dimension at the intersection of measurement science and learning analytics, we enter the realm of choice: Does the user select what they will provide evidence about or does the assessor or developer specify this in a fixed manner for all respondents? We suggest a range on the spectrum of this critical dimension can be categorized as: (a) assessor selects the same content for all respondents, (b) algorithms select content based on user data, (c) algorithms are somewhat responsive using simple decision tree choices, also known as branching, to refine some content based on user choices, and (d) user selects content (see Table 1).
As examined by Scalise (2007a,b) several approaches for how technology-based products introduce choice through adaptivity can help us understand this element. Scalise describes different means of choice in dynamic technologies–diffuse, self-directed, naïve, Boolean, and model-based. The first, diffuse, is common in education. Students are offered a range of ways to access and process information, such as multi-modal (text and images for instance). They may attend to one more than another, leading to a type of “diffuse” choice, but all students have the opportunity to view everything available. Self-directed choice is less universal. Students are exposed to a subset of content or evidence elicitation by a mechanism of self-selection built into the content–choose this and not that. But the control over choice remains completely with the respondent.
In contrast, there are naïve, Boolean and model-based approaches which introduce mechanisms by which the software makes the choices. Naïve is a random approach from the user’s perspective, such as a constraint to give equal exposure over an A/B testing experiment, which is neither under the user’s control nor related to the user’s attributes, experiences or performance. Boolean and model-based approaches encompass the employment of elements related to the user, but still not under the user’s direct control, to make the choice, such as adaptive recommenders in LA and computer-adaptive (CAT) and multistage testing (MST) in measurement. These may employ simple Boolean logic–if the respondent takes one particular action, respond with one of two screens for instance–or may involve a more complex model that accumulates information and changes state in response to a vector or accumulation of results.
Thus, the degree to which elements of choice are included is the third distinction in our developing set of elements. Products without choice are called “fixed form” or “linear” in measurement and “static” in LA. At the opposite end are more adaptive (measurement) or dynamic (LA) types of evidence collection, such as computer-adaptive (CAT), multistage (MST), or branching (Responsive). The introduction of some degree of choice, whether by human or machine, and the vehicle by which the choice is deployed is an important differentiation among products at the intersection of measurement science and learning analytics.
Focus of Assessment
Our next critical dimension we have described as “focus” but in some senses it is the unit of analysis, or perhaps better said for the LA context, the unit of inference. In other words, what is the focus of the conclusions to be made from the evidence collection and analysis? As described here, this is less about the construct in traditional terms and more about the target of decision-making. We suggest a two-part range on the spectrum of this critical dimension can be categorized as focus for reporting is persons as compared to focus for reporting is a non-person attribute such as the items or the materials (see Table 1).
In many ways we believe this “focus” of inference is both the most neglected of the elements discussed so far and the most startlingly different between measurement and some LA contexts. The focus of measurement science in education usually entails a unit of analysis involving persons, such as the individual or a collection of individuals in a classroom, school or other unit. A “side effect” of estimating for a person or group may involve placing the observation itself on the same metric, such as through item response models. However in some LA projects, the intended inference is not about a person or group of persons at all (Cooper et al., 2010; Pardos, 2018). Rather it is more about mining data to achieve results about something in the context such as to impute a new course catalog description, to generate a revised educational image or video, or to describe more optimal use of an educational building or network.
Thus the difference in the intended target of inference can often be confusing between measurement and LA contexts, especially when process data are employed. We believe this should be intentionally called out by developers. Clearly specifying whether persons and their learning goals are the intended focus of inference or whether the investigation is about a non-person attribute such as the physical setting of the education or the materials is important. Another important specification may be the intended reporting unit, such as the individual in the three use cases here. Such distinctions seem like an obvious but worthwhile element that can often be confusing between the two fields.
When generalizing evidence from a small incomplete sample of evidence to a more complete sample (updating a missing catalog description, correcting an image or video, completing an incomplete building plan), conclusions can be made about the persons who provided the evidence (learner-centered LA), or alternatively about the non-person aspects of the data context. When using an incomplete sample to generate a more complete or revised sample, this is like imputing missing data, so we would then enter the realm of missing data problems. For LA, this may look different from a missing data problem if it is situated in semi-structured and unstructured LA contexts with rich data, because the results can take on the form of imputing whole new passages of text or portions of images for instance. But the challenges of utility and validation are similar to missing data imputation.
Open-Ness
The fifth critical dimension begins to edge toward the analytic space described in the next section of elements, but we argue the fifth element remains conceptual in nature. A key distinction between interpretive contexts that we have been noticing in LA and measurement science is the extent to which the methodology employed in the design and analysis is made public, and the released information meets some common, agreed-upon standards in the field. We refer to this as open-ness. It is the most recent element added to our taxonomic thinking and therefore the fifth dimension is only briefly described here with more to be said in a future paper.
However we think it is important to capture the fact that in many applications of LA and in some often less formal applications of educational measurement, information is not available on the techniques used to aggregate the evidence into inferences, as well as some aspects of the design and often of the scoring if automated via scoring engine or machine rules. The specific analytic techniques to go from goals to inferences and claims are often missing.
For a range of categories, low is specified here as some information offered about the intended goals and resulting inferences and claims described, but no methodology offered for how the design was constructed or the evidence aggregated. Medium-low incorporates information on the design and evidence collected but does not well describe the analysis, especially how the aggregation of the evidence is conducted to generate claims. Medium describes the methodology employed in both the design and analysis but does not make a technical report available. High includes a full technical report.
Note that sometimes applications of LA or measurement science use rate low on open-ness due to proprietary claims of intellectual property. But regardless of the reason for lack of open-ness, the result impacts the ability of the field to evaluate the evidence aggregation and claims made through understanding the methodology of the design and analysis.
Discussion and Conclusion: Comparing Across Use Cases and Generalizing
Next we compare across use cases, which we summarize in Table 2 and discuss in this section. The goal here is to see to what extent the dimensions serve to differentiate the three use cases, which were purposively sampled to represent at least some of the different contexts at the intersection of LA and measurement science.
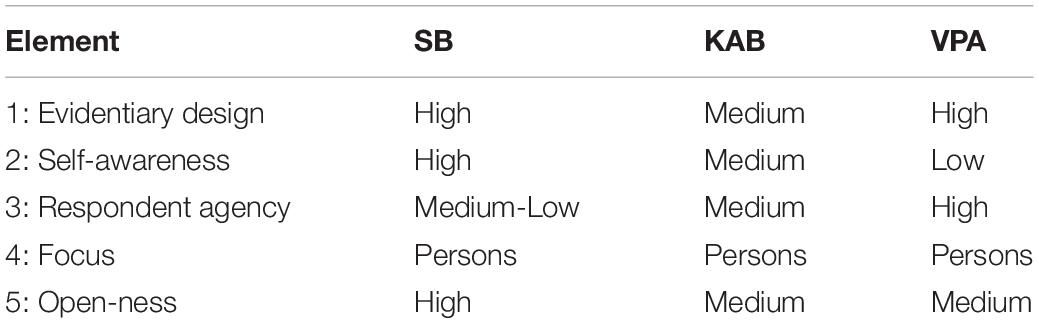
Table 2. Results of use cases for elements at intersection of measurement science and learning analytics.
One Schematic for Intersection With Measurement Technology
To discuss Table 2 results, it seems useful next to introduce a schematic based on prior work with the UC Berkeley BEAR Assessment System (BAS), an approach built on the idea that a quality assessment structure must rely on sound measurement. The BAS approach as described by Wilson (2005) employs “four building blocks of measurement,” which are illustrated in Figure 1. We will use these four building blocks to examine our use cases, so introduce the building blocks here:
• The first building block of BAS, “construct definition,” defines the theoretical domain model. For BAS, this must include not only knowledge and skills but also a developmental perspective of how the learning emerges.
• The second block of BAS, “item design,” specifies the evidence that should be elicited for the development perspective of the domain model (item design).
• The third building block of BAS specifies how the evidence is to be interpreted, or scored, to generate information that is accessible for quantitative inferences within the learning environment (outcome space definition).
• The final building block of BAS caps the evidentiary case that is needed to generate inferences about the learner. The “measurement model” building block is applied, which accumulates the evidence from the observations and scoring to generate an empirically validated “student model.”
Comparing Across Cases
The three use cases in this paper tend to include each of these building blocks to some extent but we see the three use cases as emphasizing, or prioritizing, the building blocks differently. The first use case, SBAC, places much of the focus on high evidentiary quality in the accumulation of evidence, or Building Block 4. Because of the results being used for monitoring student proficiency on Common Core state assessments, accumulation for reporting is a strong focus.
Khan academy beta product, by contrast in use case 2, is about determining if students can be seen as mastering specific items. If so, this is revealed by the scoring and eventually moves the student to a new set of items. Hence, the focus of innovation seems to be on the scoring of individual bits of evidence, or Building Block 3, to flag mastery of fine-grained skills and knowledge.
Virtual performance assessment in use case 3 with its focus on an immersive student experience in the serious gaming inquiry context places a strong emphasis on innovating for Building Block 2. This is the item design, which is altered in VPA both through the types of observations collected through the performance activity and the agency of the student experience during the inquiry scenario.
If we examine one of many key points at the intersection of measurement science and LA through these schematics, we might take the example of the transition to the ability to capture and process “big data.” The LA field discusses this as placing a priority on semi-structured and unstructured data with less data reduction to simple structured tables (Baker and Inventado, 2014; Baker and Siemens, 2014). LA researchers point out that many traditional assessments were originally developed in what has been described from the point of view of the amount of data collected as an era of parsimony–relatively a “data desert” compared to what is available today (DiCerbo and Behrens, 2012). DiCerbo and Behrens have called this the transition to a “data jungle” or more recently, a “data ocean,” where parsimony of what is collected and analyzed is much less a major concern.
However, to take the analogy of an ocean, when navigating across an ocean, one needs reference points, such as latitude and longitude coordinates, for otherwise one is lost. These coordinates form a type of multidimensional space (in this case a curved space in the primary scale of degrees). Instruments are used for reckoning in the space, or positioning oneself using time, direction, and speed. The historic sextant has given way of course to global positioning using satellites, atomic clocks that keep time within billionths of a second, and imaging techniques that provide fine detail.
So data possibilities for collection, analysis and reporting have become richer. But just as a “mapped ocean” can be a very complex ecosystem to examine for scientists and geologists who are engaged in a mapping process, ultimately the rich contours of the terrain and even sometimes its change over time may be possible to understand if appropriate information is collected for this purpose. Of course, a well-planned data collection may also be intentionally parsimonious, such as sampling an ocean floor. This may still yield good results for the purpose, and require fewer resources and have other desirable attributes to it. Therefore the data collection even in a complex terrain may be parsimoniously designed for an intended purpose. We will see this in parallel within the different designed purposes in our use cases as we look at the specific features in the emerging taxonomy here.
For coherence of the evidentiary design, SB and VPA rank high, not because of their use of process data, which varies between the two, but rather because regardless of the form of evidence used, the two uses cases have attempted to establish and document a clear evidentiary argument among the inferential building blocks. In other words, the goals and objectives of the use cases for their intended inferences have been clearly described and linked to the types of data collected for observations, how the observations will be interpreted by applying a score or categorization, and how the separate observations will be accumulated into a body of evidence to generate the intended inferences. SBAC and VPA items and observations do have associated meta-data specifying the intended learning standards and the developers have undertaken documented processes of alignment reviews with expert panels.
Note that the specifics of the evidentiary argument can be and often are challenged in these and other use cases. The point here is that the use case itself has attempted to establish and document its process of linking the intended inferences to the observations that serve as evidence (whether the observations are process data, item response data, or other types of data) and have made and validated a case for the interpretation and accumulation of the evidence.
Khan academy beta product by contrast ranks as medium in the taxonomy for this element, see Table 2. A difference is in standards alignment and validation of alignments–KAB makes numerous claims but whether these claims and their observations are well-aligned to learning objectives (such as standards) and whether a validation process with sufficient expertise has taken place to make the claims fully credible is not well documented. For KAB, comparisons are made available to NWEA MAP norms and items, which might be considered a secondary type of alignment–the alignment of one instrument to another. More information on what the alignments are for KAB, to which standards and frameworks, how alignments are determined, and the extent to which alignments are reviewed and validated would be needed to better document this dimension for KAB.
In terms of the coherent design process, KAB might be thought to be essentially similar to SB and VPA–but it is actually not. The numbers of reviews and committee experts involved, the stakeholders consulted, the extent of the alignments tracked, and the verification and validation of the match of alignments to specifications seems much greater in SB and VPA. Furthermore the modeling of results at pilot or in field trials is used extensively to help support the validation of the design–for instance, does item analysis show the expected progression of achievement in the score categories? Does empirical data fit the modeled result? And so forth.
The VPAs do use a strongly designed process for coherent evidentiary design through the extensive efforts made by learning scientists to document what would be salient. Some types of data mining also have taken place subsequently to identify additional useful evidence, and to empirically update some of the approaches. However, there remain differences, so it would seem useful to extend the dimension since there are still substantial differences in validation between SB and VPA. This is a place where more categories might be useful in the dimension to capture some of the nuances of validation.
Also, for this dimension, future work might look for a use case with less pre-design than either KAB or VPA, and more data mining. It may be that this will be less common in education however if person performance measures are the focus, because of strong tendencies in the field for educational standards at K-12, or learning goals and objectives at post-secondary. These are likely to drive at least some attention to pre-design.
For self-awareness of being assessed, SB rates as high, KAB as medium, and VPA as medium-low. SB includes not only disclosure but some degree of informed consent with parents prior to state assessments. Some states for instance have voluntary opt-out rules that have to be followed in SB assessments. By contrast, none of the three use case products are fully stealthy, in that all disclose to students that these are assessments. KAB keeps this emphasis present during administration with aspects of the interface that look and feel like a standardized test. The VPA interface is a serious game, but there is standardization of the assessment administration so the context includes instructions from teachers, along with assessment disclosure and directions for students to follow. SB and KAB look and feel like traditional assessments, and VPA does not, relative to this dimension.
For respondent agency, SB is item-level CAT, so is medium-low on this dimension. Algorithms are making some constrained choices based on user data but the student is not directly employing agency to make choices in the assessment. KAB is medium in that some meaningful choices can be made, while VPA is high with more choices made by the student.
Again, this dimension could likely use some more categories because certainly even VPA allows choices only within a fairly constricted universe. In this way, agency is more limited than might seem to be the case for a high rating.
However that said, in VPA the gamification is embedded more deeply than in the KAB example. Respondents not only select an avatar but also role play as the avatar throughout the response process. The look and feel of the content entails navigating within a colorful, virtual world, where choices are made and evidence collected. Some direct questions are asked but they are fully integrated within the activity and most often involve other avatars in a type of user-selected virtual collaboration.
Choice is not only part of the how the respondents engage in agency within the VPA, but is also used to build an atmosphere of ubiquitous unobtrusive assessment. Respondents are notified in advance that this is an assessment so stealth is not the direct goal, but the experience nevertheless takes the immediate focus off participating in an assessment, and so can be considered stealthy. The strong simulation of virtual reality does tend to invite agency, so respondents focus less on self-awareness about participating in an assessment and more about role playing within an activity. Here we call this “stealth by stealth” meaning a stealth-like experience due to distractions.
In this way, the Q-matrix (i.e., the content) is fixed in VPA as in the KAB above but is used very differently and not according to CAT-like rules as is the case for SB. Rather, the respondent selects which portions of the virtual world to engage in and what content will therefore be accessed and available as evidence, as part of their role playing experience.
The content is responsive to each individual person, but not by system configuration such as in computer adaptive testing (CAT) with configurable constraints, delivery algorithms for item selection, and starting and stopping rules. Rather self-selection differentiation takes place as described by Scalise (2007a,b). The software can prompt respondents in order to obtain some critical pieces of salient evidence about the construct when necessary, so there is an element of adaptivity in the content but it is more broadly conceptual (via basic Boolean, a branching into a conditional prompt when certain conditions are present) rather than at the item-difficulty level. Note that being able to successfully attend to the key parts of the virtual world is part of the construct being measured, since the VPA example is in scientific inquiry and explaining.
For the fourth dimension of focus in all three uses cases, the focus for inference is on the person. In KAB, some allocations of decisions seem to involve item content and person “mastery” in the latent categories, with the Q-matrix (i.e., the content) of the test adapting to the examinee. In particular, students are not repeatedly tested on the content in which they have demonstrated the mastery. This is also true for SB. In VPA, students can return to testing contexts they have already completed due to the choice and agency element, but there are prompts that keep the student moving to some degree.
The KAB product does have extensive evidence accumulation approaches without which the inferences made by the product could not be made. Here it might be said the inferences are only as good as the evidence elicitation and accumulation. Little information seems yet available on KAB to judge the result, which is a focus of the fifth dimension, see below. Intended inferences do claim to be primarily formative, and therefore one would expect KAB to gather more and noisier data points than a more traditional test. How much noise can be tolerated even given more data points is one question. In KAB, much more priority is placed on other elements of the design such as an extensive degree of self-selected or instructor-selected choice, a moderate degree of stealth by intentionally taking the focus off of completing assessments, and frequent inferences of what appears to be a dynamic interpretation of estimated ability, given that so little evidence is elicited before updating occurs, that this cannot be considered a complete assessment between updates.
It should also perhaps be noted in this section KAB was originally developed as a set of videos that helped support student instruction. Materials have been added over the years including assessments, and most recently the beta personalization version considered here. Inferences are extensive and much fine-grained data on the individual student are collected by KAB over frequent time intervals. However assessment content tends to be rather simple, mostly simple selected response, and most relying on structured or semi-structured data (xml codings). Design choices are likely due at least in part to the relative ease of creating simple assessment forms for which at least some claims can be made regarding comparable to other instruments used as norms (NWEA MAP). Each piece of evidence elicitation is readily scored by the computer and there appears to be little if any collection of unstructured data.
In VPA, the data consist primarily of observations of process data rather than traditional items, although some constructed response and selected response questions are included such as explanation and argumentation for a student’s claim about the results of the inquiry they conducted in the game with some validation. Much of the data are collected by recording actions in an immersive serious-gaming environment, in xml with tags and as an action log. Thus, as with many LA techniques, the process data stream does eventually end up being parsed from unstructured and semi-structured data into tables of relationships. Such “hash” tables of various types employ a data structure with rows for persons identified with each logged event and often store keys along with value pairs for relationships that have been determined within the unstructured or semi-structured data.
This last dimension of open-ness is something that probably needs to be better explored for all three uses cases, but here we have listed SB as high, and KAB and VPA as medium. Technical reports are released on SB approaches, and considerable information is available on websites and to the users of the SB products. By contrast, methodological information certainly on VPA and seemingly on KAB seems to be less systematic, and is contained in journal articles and research publications rather than being more systematically available in detailed technical reports that document what analysis approaches were used, what studies were completed, and what validation efforts were undertaken, and the results. The degree to which methodology for evidence elicitation and accumulation is stable and shared with stakeholders, or made transparent to teachers, schools, and the field, and the degree to which standards are in place and responded to for this is important to this dimension, product by product.
Conclusion: Generalizing, or the Lack Thereof Here
It is somewhat intentional in this paper as we advance toward theory that we do not conclude with a full theory, or even a strong hypothesis about what this theory should be. We do not believe enough cases have been reviewed to generalize to a strong stance on a full theory at the intersection of LA and measurement when using our approach of multi-case theory generation.
That said, we do advance several views that generalize across the cases here. The first is that the five dimensions identified in this paper do seem to systematically vary in important ways across products at the interface of LA and educational measurement, as we have described. To be explicit, we are pointing out that the three purposively sampled cases systematically vary in these dimensions and we suggest that other cases are likely to do so as well. That in our mind is an important generalization. We could say the dimensions indicate a type of developing ontology that does not exist in the field.
We invite others to add to such an ontology, challenge it, clarify it, and so forth. But also to become aware of the important choices being made and the potential impact on inferences in LA at the intersection with measurement.
By contrast, we could have found, but did not, that there was no overlap in the shared elements across cases. Or we could have found shared elements but no variation across the purposively selected cases. Then a developing ontology, we believe, would have been less helpful to examining the field and we would have felt less inclined to share it.
Furthermore, we do believe the five elements already are a breathtaking array, in our opinion, of fairly unexamined theoretical choices that LA developers are making, from a measurement perspective. The choices are likely to influence inferences about learners. Prior taxonomies or LA “layers” discussed in our brief literature review point to the importance of the intersection of LA with educational measurement, but do not fully treat or well develop the intersection. Here we point out that if inferences about the learner could vary depending on these choices, which they certainly could from a measurement stance, then they are important elements toward a complete theory. So we restate our stance that more products should be examined and more dialog take place across fields, to identify and discuss critical dimensions.
Hence the research literature should be examining these dimensions, and likely others that influence LA and inferences about learners. It would be helpful to show how to make and defend the choices in at least this set of five dimensions in a more conscious and/or transparent way. Two ways that occur to us are to show that (i) inferences would not vary in a meaningful way for the intended purpose if the choices within these dimensions were different, or (ii) to alternatively show that for the intended purposes, the choices are restricted to the selected set.
Furthermore, we believe LA at the intersection with educational measurement has not much begun to examine topics presented in the paper in respect to subgroup analysis, which has had significant development over the last 30 years within educational measurement. Clearly this is an important focus for claims such as of fairness and sensitivity, and to show that LA is addressing concerns of diversity, equity and inclusion. Developing an ontology and more complete theory of what the intersection we have described entails would better allow such future explorations.
So there is much potentially fruitful work in these directions. We hope that advancing theoretical components might provoke important conversations, and help inform at the intersection of fields in a complex space.
Data Availability Statement
The original contributions presented in the study are included in the article/supplementary material, further inquiries can be directed to the corresponding author/s.
Author Contributions
KS initiated and led the project, completed the use case identification and analysis with the co-authors, completed the overarching portions of the writing, and completed specific portions of the writing and tables with co-authors. MW trained the other researchers, completed the use case identification and review with the co-authors, completed specific portions of the writing and tables with co-authors, and reviewed drafts. PG completed use case identification and review with the co-authors, specific portions of the writings and tables, developed the figures, and reviewed drafts. All authors contributed to the article and approved the submitted version.
Funding
Examples, data sets, and/or results used in this work were supported by a grant from the United States National Science Foundation (award 0737056) and a Bill & Melinda Gates grant (award 255-20881-xxxx-256246-250353- 0001-23233).
Conflict of Interest
The authors declare that the research was conducted in the absence of any commercial or financial relationships that could be construed as a potential conflict of interest.
Acknowledgments
This authors thank contributions of people with whom we have worked as part of the examples in this article including Jody Clarke Midura and Geoffrey Barrett.
References
Baker, R. S., and Siemens, G. (2014). “Educational data mining and learning analytics,” in The Cambridge Handbook of the Learning Sciences, ed. K. Sawyer (New York, NY: Cambridge University Press), 253–274.
Baker, R. S., and Inventado, P. S. (2014). “Educational data mining and learning analytics,” in Learning Analytics: From Research to Practice, eds J. A. Larusson and B. White (New York, NY: Springer), 61–75. doi: 10.1007/978-1-4614-3305-7_4
Chatti, M. A., Dyckhoff, A. L., Schroeder, U., and Thüs, H. (2012). A reference model for learning analytics. Int. J. Technol. Enhanc. Learn. 4, 318–331.
Colquitt, J. A., and Zapata-Phelan, C. P. (2007). Trends in theory building and theory testing: a five-decade study of the academy of management journal. Acad. Manag. J. 50, 1281–1303. doi: 10.5465/amj.2007.28165855
Cooper, S., Khatib, F., Treuille, A., Barbero, J., Lee, J., Beenen, M., et al. (2010). Predicting protein structures with a multiplayer online game. Nature 466, 756–760. doi: 10.1038/nature09304
DiCerbo, K. E., and Behrens, J. (2012). “Implications of the digital ocean on current and future assessment,” in Computers and Their Impact on State Assessment: Recent History and Predictions for the Future, eds R. W. Lissitz and H. Jiao (Charlotte, NC: Information Age).
Eisenhardt, K. M., and Graebner, M. E. (2007). Theory building from cases: opportunities and challenges. Acad. Manag. J. 50, 25–32. doi: 10.5465/amj.2007.24160888
Gasevic, G., Dawson, C., Ferguson, S. B., Duval, E., Verbert, K., and Baker, R. S. J. D. (2011). Open Learning Analytics: An Integrated & Modularized Platform (Concept Paper), Society for Learning Analytics Research. Gurugram: SOLAR.
Greller, W., and Drachsler, H. (2012). Translating learning into numbers: a generic framework for learning analytics. Int. Forum Educ. Technol. Soc. 15, 42–57.
Haertel, G. D., Cheng, B. H., Cameto, R., Fujii, R., Sanford, C., Rutstein, D., et al. (2012). “Design and development of technology-enhanced assessment tasks: integrating evidence-centered design and universal design for learning frameworks to assess hard to measure science constructs and increase student accessibility,” in Paper Presented at the Invitational Research Symposium on Technology Enhanced Assessments, (Washington, DC).
Halverson, R., and Owen, V. E. (2014). Game-based assessment: an integrated model for capturing evidence of learning in play. Int. J. Learn. Technol. 9, 111–138. doi: 10.1504/ijlt.2014.064489
Klopfer, E., Osterweil, S., and Salen, K. (2009a). Moving Learning Games Forward. Cambridge, MA: The Education Arcade.
Klopfer, E., Scheintaub, H., Huang, W., Wendel, D., and Roque, R. (2009b). The Simulation cycle – combining games, simulations, engineering and science using starlogo TNG. J. Elearn. Digital Media 6, 71–96. doi: 10.2304/elea.2009.6.1.71
LAK (2011). Proceedings of the 1st International Conference on Learning Analytics and Knowledge, Banff, Canada.
Miles, M. B., and Huberman, A. M. (1994). Qualitative Data Analysis: An Expanded Sourcebook. Thousand Oaks, CA: SAGE Publications.
Milligan, S. (2018). DesignLAK18: Evaluating Systems and Tools that Link Learning Analytics and Learning Design. Learning Analytics & Knowledge Conference. Available online at: https://sites.google.com/site/designlak18/home (accessed August 18, 2018).
Mislevy, R. J., Almond, R. G., and Lukas, J. F. (2003). A Brief Introduction to Evidence-Centered Design. Los Angeles, CA: Educational Testing Service.
Monica, N., and Kumar, K. R. (2013). Survey on big data by coordinating mapreduce to integrate variety of data. Int. J. Sci. Res. 2, 427–432.
National Governors Association Center for Best Practices, and Council of Chief State School Officers (2010). Common Core State Standards. Washington DC: National Governors Association Center.
Nguyen, A., Gardner, L., and Sheridan, D. P. (2017). “A multi-layered taxonomy of learning analytics applications,” in Paper Presented at the Pacific Asia Conference on Information Systems. Project: An Adaptive Learning System - Improving Teaching and Learning by Data Analytics, (Langkawi).
Papamitsiou, Z. K., and Economides, A. A. (2014). Learning analytics and educational data mining in practice: a systematic literature review of empirical evidence. Educ. Techno. Soc. 17, 49–64.
Pardos, Z. (2018). Studying Distributed Representations Of Pedagogical Objects From Learner Process Data. Berkeley Evaluation and Assessment Research Center Seminar. Berkeley, CA: Berkeley Evaluation and Assessment Research.
Praveen, S., and Chandra, U. (2017). Influence of structured, semi-structured, unstructured data on various data models. Int. J. Sci. Eng. Res. 8, 67–69.
Ridder, H.-G. (2017). The theory contribution of case study research designs. Bus. Res. 10, 281–305. doi: 10.1007/s40685-017-0045-z
Scalise, K. (2007a). Differentiated e-Learning: five approaches through instructional technology. Int. J. Learn. Technol. 3, 169–182. doi: 10.1504/ijlt.2007.014843
Scalise, K. (2007b). Differentiated e-Learning: what it is and five approaches. J. Educ. Technol. 4, 24–28. doi: 10.26634/jet.4.1.626
Scalise, K., and Clarke-Midura, J. (2018). The many faces of scientific inquiry: effectively measuring what students do and not only what they say. J. Res. Sci. Teach. 1469–1496. doi: 10.1002/tea.21464
Sclater, N. (2014). JISC: Code of Practice for Learning Analytics: A Literature Review of the Ethical and Legal Issues. Bristol: Jisc.
Shute, V., and Ventura, M. (2018). Stealth Assessment: Measuring and Supporting Learning in Video Games. Boston, MA: The MIT Press.
Shute, V., Wang, L., Greiff, S., Zhao, W., and Moore, G. R. (2016). Measuring problem solving skills via stealth assessment in an engaging video game. Comput. Hum. Behav. 63, 106–117. doi: 10.1016/j.chb.2016.05.047
Smarter Balanced (2018). Smarter Assessments. Available online at: http://www.smarterbalanced.org/assessments/ (accessed September 28, 2018).
Snow, E. L., Allen, L. K., Jacovina, M. E., and Mcnamara, D. S. (2015). Does agency matter: Exploring the impact of controlled behaviors within a game-based environment. Comput. Educ. 82, 378–392. doi: 10.1016/j.compedu.2014.12.011
Tourangeau, R., Rips, L. J., and Rasinski, K. (2000). “Chapter 6: attitude questions,” in The Psychology of Survey Response, (Cambridge: Cambridge University Press), 165–179. doi: 10.1017/cbo9780511819322.007
van Barneveld, A., Arnold, K. E., and Campbell, J. P. (2012). Analytics in Higher Education: Establishing a Common Language. Louisville, CO: EDUCAUSE Learning Initiative.
Wilson, M. (2005). Constructing Measures: An Item Response Modeling Approach. Mahwah, NJ: Lawrence Erlbaum Association.
Wilson, M., and Scalise, K. (2016). “Learning analytics: negotiating the intersection of measurement technology and information technology,” in Learning, Design, and Technology. An International Compendium of Theory, Research, Practice, and Policy, eds J. M. Spector, B. B. Lockee, and M. D. Childress (New York, NY: Springer).
Wilson, M., Bejar, I., Scalise, K., Templin, J., Wiliam, D., and Torres Irribarra, D. (2012). “Perspectives on methodological issues,” in Assessment and Teaching of 21st Century Skills, eds P. Griffin, B. McGaw, and E. Care (New York, NY: Springer).
Wilson, M., Scalise, K., and Gochyyev, P. (2016). Assessment of learning in digital interactive social networks: a learning analytics approach. Online Learn. J. 20, 97–119. doi: 10.1080/10494820.2011.641677
Keywords: learning analytics, theory, data science, taxonomy, measurement, assessment
Citation: Scalise K, Wilson M and Gochyyev P (2021) A Taxonomy of Critical Dimensions at the Intersection of Learning Analytics and Educational Measurement. Front. Educ. 6:656525. doi: 10.3389/feduc.2021.656525
Received: 21 January 2021; Accepted: 12 April 2021;
Published: 20 May 2021.
Edited by:
Sedat Sen, Harran University, TurkeyReviewed by:
Dirk Tempelaar, Maastricht University, NetherlandsDavid Carroll Gibson, Curtin University, Australia
Copyright © 2021 Scalise, Wilson and Gochyyev. This is an open-access article distributed under the terms of the Creative Commons Attribution License (CC BY). The use, distribution or reproduction in other forums is permitted, provided the original author(s) and the copyright owner(s) are credited and that the original publication in this journal is cited, in accordance with accepted academic practice. No use, distribution or reproduction is permitted which does not comply with these terms.
*Correspondence: Kathleen Scalise, a3NjYWxpc2VAdW9yZWdvbi5lZHU=
†ORCID: Kathleen Scalise, orcid.org/0000-0001-8254-878X; Mark Wilson, orcid.org/0000-0002-0425-5305; Perman Gochyyev, orcid.org/0000-0002-4663-4426