 Maurice Mutisya
 John Munyui Muchira
 Benta A. Abuya
- African Population and Health Research Center, Nairobi, Kenya
Introduction: Urbanization is a double-edged sword, while it is transforming the world, it is also creating spaces that pose threats to its benefits. In sub-Saharan Africa, urbanization is occurring amidst slowed economic growth and into spaces that are already strained. This is resulting in the growth of urban poverty and possibly increasing inequalities. It is thus imperative to understand the effects of urbanization in realizing inclusive and equitable education for all.
Objective: We examine inequalities in enrolment of schooling going children aged 6–17 years living in urban areas using the latest Demographic and Health Surveys data from 24 SSA countries.
Methods: We utilize three measures of inequality: Rate difference, rate ratio, and relative concentration index to examine inequalities in education access. Using wealth status as the key inequality indicator, we compute and compare school enrollment of children living in urban poor households with that of those living in urban rich households for each measure of inequality. Where appropriate, we stratify the results by country, age, and gender.
Results: The results show high levels of inequalities in education access in urban settings. Across all the measures of inequality, in most countries, children from urban poor households were significantly less likely to be in school compared to those from the richest ranked households. The degree of inequality varied considerably between countries and the age groups. Among children aged 6–11 years, Tanzania, Burundi, Nigeria, and Uganda had the highest degree of inequality favouring the urban rich. We also find intriguing results in few countries such as Ethiopia, Benin, Senegal and Mali, which the urban poor had, better school enrolments than the urban rich. We do not find a clear pattern to suggest girls from poor households are overly disadvantaged than boys from similar households.
Conclusion: Our study shows a high level of inequalities in education access in an urban setting, with children age in urban poor settings hugely disadvantaged. There is a need for strategic efforts in terms of deliberate interventions and policy frameworks to combat the apparent inequalities that disadvantage children from poor families from accessing education.
Introduction
Education is regarded as a human right and economists have demonstrated that it is a means of empowering societies and a key contributor to human development. Thus, education is a pathway for access to the labour market, creates an intergenerational outcome for those who access it, and has a positive impact on individual earnings and the country’s economic development (Louw et al., 2006). Those with more years of schooling get better employment outcomes which translate to higher household income compared with those with fewer (Lloyd and Hewett, 2009). The earned income is used in providing access to education for the children thus breaking the family poverty cycle and developing a literate society. Besides better job prospects and income, education has other accrued benefits that are complementary, more so among women, not limited to better decision making, fewer children, better health choices and increased awareness (Kritz and Makinwa-Adebusoye, 1999).
Despite the documented benefits, access to equitable and quality education topical is yet achieved, with millions of children in low and middle-income countries (LMICS) left behind. In particular, growing urban populations in LMICS are posing challenges to achieving universal access to quality education. Urbanization is a double-edged sword, on the one hand, it is transforming the world, but on the other hand creating spaces that pose threats to its benefits, particularly the growth of urban populations living in poverty in low and middle-income countries (UNDESA, 2019). In the education sector, urbanization is creating opportunities for attaining quality education but also posing a risk to achieving Education for All (EFA) and the Sustainable Development Goal (SDGs) four on equitable and inclusive quality education for all.
Unfortunately, the rate of urbanization is not paralleled by social transformation to cater for its apparent needs. As a result, the growth of urban poverty which is characterized by urban populations with limited access to adequate housing, water and sanitation, and social services in health and education is evident (Brockerhorff and Brennan, 1998). For example, in Kenya urbanization has resulted in an increase in population living in the urban informal settlements due to limited and lack of formal wage employment and housing—a situation that is not different from other developing countries in SSA. With the unemployment rate in these settlements being very high and the youth comprising the highest segment, this poses a youth challenge and constrain of social amenities including schools as the higher population of children is projected to be born from families struggling financially due to lack of wages.
The United Nation’s World Urbanization Prospects project that almost one half of the sub-Saharan Africa (SSA) population will be living in urban spaces by the year 2030 (UNDESA, 2019). This poses serious problems in ensuring school-going children living in urban poor households have access to education, post grade progression and transition rates that are comparable with the urban rich population segment as well as their peers living in rural. The aim of this paper is therefore to analyze data from several SSA countries to understand inequalities in accessing education in an urbanizing context and as an effort of supporting the achievement of EFA and SDG. We hypothesise that growing urban poverty is creating vulnerabilities and disparities in education with the poorest likely to experience worse schooling and education outcomes.
Inequalities in Education
While it is expected that adoption of Universal Primary Education (UPE) should lead to higher access to education, the proportional benefit could vary with the context (urban or rural, socioeconomic status) of the family or even within contexts (Buchmann and Hannum, 2001). To a large extent, there has been lower school attendance and enrolment in rural areas compared with those residing in the urban spaces, with research evidence indicating that enrolment in rural areas is three times lower than that in urban settings (Roby et al., 2016). This disparity could be associated with the opportunity cost of schooling and household cost-benefit analysis (Akyeampong, 2009) in rural contexts where child labour sometimes is a survival necessity for poor households making school-going children forego education at the expense of earning a livelihood. Nevertheless, family socioeconomic status (SES)/household wealth index and gender seem to moderate the influence of rural versus urban contexts on learners’ access to education. For instance, in Ghana, the implementation of Free Compulsory Universal Basic Education (FCUBE) led to a decrease in attendance by the urban poor compared with the rural poor since the mean household expenditure was higher among urban poor families since costs of education-related items are higher in urban settings than in rural areas (Akyeampong, 2009).
On the other hand, a study by Roby et al. (2016) revealed that rural rich children had high school attendance than their urban counterparts in Uganda and Zimbabwe—with Zimbabwe decreased enrolment being attributed to the existence of urban informal settlements. These conflicting results call for more studies on issues of inequalities among the urban poor especially in the recent days where there has been an increase in rural-urban migration, particularly among the youth in search of better livelihoods and employment opportunities. The migration to urban cities in developing SSA economies will undoubtedly create a strain in social services and high enrolment in the primary education level, especially in the urban informal settlements. This demographic shift is likely to affect the quality of education and grade progression in impoverished urban contexts. These social and economic driven barriers pose a threat to the urban population living in poverty, particularly learners in terms of achieving their full capabilities, offering their maximum contribution in the community, the realization of their freedom, and their eventual empowerment.
Demystifying the Urban Advantage
Despite the various milestones towards ensuring EFA and achievement of SDGs, access to the entry-level of schooling and progression to secondary school across the developing African economies remains biased particularly for children from low SES. Those living in the poorest household are less likely to enrol in school and generally experience a high dropout rate compared with those from rich households (Lewin and Sabates, 2012). Poverty index/socioeconomic level is a key indicator of assessing inequalities in terms of access to essential resources including education (Sabates et al., 2013). Based on the analysis of the monetary and non-monetary determinants of access to education in Cameroon, a one-point increase in household income was found to have a 30% increase in the likelihood of children enrolling on school (Ningaye et al., 2019). This indicates that increased household income and the reduction of indirect and direct costs associated with schooling reduces the burden of meeting costs of education which is a major reprieve to the economically disadvantaged parents.
The poverty index is correlated with access to education and scholars have demonstrated individual income level influences their capacity to access education, remain in school and actively engage in the learning process (Akyeampong, 2009; Sabates et al., 2010; Hattori, 2014). This is evident from 63 countries analysis of the out-of-school rates conducted by Hattori (2014) in which children from the poorest quintile households had a 22% out-of-school rate compared with only 6% rate among children from the richest quintile households. Besides, there exists a highly statistically significant correlation between household wealth and school attendance in most of the sub-Saharan Africa and South Asia countries with children from poor households showing a 20 per cent less points likelihood of being in school compared with those from rich households (Hattori, 2014; UNESCO Institute for Statistics (UIS) and UNICEF, 2015).
Considering that urban informal settlements are characterized by high poverty index and high cost of living, the number of unenrolled school-going children are likely to increase as the population increases. Additionally, the families living in urban informal settlements are usually unable to provide supplementary educational resources to their children and this has an effect on their children learning achievements, grade progression and can consequently lead to low transition rates from primary to secondary school. Understanding the association between household wealth and access to education is significant given the fact that a large percentage of the population in SSA is living in poverty. Furthermore, inequalities including gender-related are magnified among the low SES households who might not envision education as a worthwhile investment as returns associated with schooling is long term and usually, the learner only reaps those benefits later in life (Akyeampong, 2009).
Also, the disadvantaged households often struggle with limited financial resources, there are opportunity costs associated with keeping the child in school at the expense of making income for the family through child labour or the value of that child’s labour for the assigned tasks at home (Lloyd and Hewett, 2009). The effect that labour intensive livelihoods have on enrolment and general schooling patterns is worse for poor families whose survival is pegged on child labour at the expense of attending school (Ye et al., 2002). For example, the likelihood of child labour in Ethiopia, which reduced education attainment, was found to increase with increased family size and ownership of livestock, which could imply poverty study context (Haile and Haile, 2012). This is likely to be the case for urban informal settlements where the increased cost of living without sustained income generation will potentially force learners from the families living in poverty to opt to stay out of school and to even engage in wage employment or support their families to run informal businesses as a means of survival.
Furthermore, access to schooling and quality education, in general, is limited for girls from poor backgrounds and countries (Abuya et al., 2018). Girls’ primary school completion rate has been found to increase with the increase in the country’s per capita income (Lloyd and Hewett, 2009), as well as individuals’ family income/poverty index. Thus, assessing the moderation effect that gender has on access to schooling for learners from urban households living in poverty is important. This is because girls, particularly in developing countries, continue to endure discrimination and gender parity to access education (Jayachandran, 2015). Socio-cultural practices such as early marriages, pregnancy, child labour, none inclusive religious practices and lack of sufficient economic and social opportunities for girls limit girls participation in education (Lloyd and Mensch, 2008; Birchall, 2018). Notwithstanding, poverty, has a direct effect on education affordability, level of access to the physical classroom and essential educational resources thus consequently determining the educational achievements and both short term and long term benefits accrued by those who access education (Motala et al., 2009).
Evidence emanating from studies conducted among populations living in poverty in urban settings has highlighted the high utilization of low-fee private schools among those considered (Ngware et al., 2013) even though Kenya provides free basic education (Oketch et al., 2010b). This is due to limited government investment in providing public education to children living in these settings and the perceived quality of education offered in these schools. In Kenya, individuals enrolled in low-cost private schools are excluded from accessing government provided capitation, exposed to untrained teachers, and likely to be exploited given the majority of the schools are profit-driven. Enrolment into the low-fee private schools is also motivated by their accessibility—in terms of their physical location (distance) and low fee charges (Ngware and Mutisya, 2021). However, almost three in every four of the low-fee schools are not registered with the Ministry of Education (Edwards Jr et al., 2017).
Therefore, understanding inequalities in education access by various measures, and particularly wealth and gender is important in guiding policy frameworks for the EFA initiatives and inform decision-making on how SSA countries can achieve the set goals on increasing access to education without compromising education quality. Increased disparities and waning urban advantage underscore the need to understand the effects of urbanization in realizing inclusive and equitable education for all. In this paper, we, therefore, examine socioeconomic inequalities in education because of urbanization and growing urban poverty witnessed in SSA. Specifically, we draw data from Demographic and Health Surveys (DHS) to determine household wealth and gender inequalities in school enrolments among urban populations in 24 Sub-Saharan Africa countries.
Materials and Methods
We utilize data from Demographic Health Surveys (DHS) for 24 Sub-Saharan African countries. We included the most recent datasets available as of March 2020 that were collected between 2013 and 2018. DHS surveys, usually conducted after every 5 years, draws a nationally representative sample to provide data on population, reproductive health, child survival and health, and nutrition. The DHS administers a household module, which collects detailed information including education for each household member in the sampled households. The education items include and are not limited to information about if the child has ever been in school, current schooling status, level and grade attained among others. The current schooling information is collected for school-going individuals, defined as those aged between 5 and 24 years across the participating SSA countries. We construct an indicator of school enrolment, our key outcome measure of access to education, from ever been in school and the current schooling status of individuals aged between 6 and 17 years in analysing inequalities in education access among urban populations. Those within the age range and enrolled in school at the time of the survey were coded as yes (1), while those not currently in school or have never enrolled were coded as no (0). In total our analysis sample consists of 180,171 individuals aged between 6 and 17 years, of which 5,610 had never been in school, 22,764 had been in school and not enrolled at the time of the survey, while 151,797 were enrolled in school.
While the countries included in the analysis have differences in school entry policies and curriculum, the choice of the age 6 to 17 coincides with school entry and the 12 basic schooling years for the majority of them. Majgaard and Mingat (2012) standardized years of enrolment in 47 SSA countries according to the international standard classification of education and mapped them to the three major categories. The first 6 years in primary (6–11), the next 3 years into lower secondary (11 and 13) and the final four (14–17) to upper secondary schools, with an automatic transition from lower to upper secondary schools. Hence, we categorize the age individuals included in the analysis into two age groups i.e., 6 to 11 and 12 to 17.
The DHS through the module also collects detailed data to estimate household socioeconomic status. The data mainly includes ownership of specific items/assets, toilet type, housing materials, source of water, and ownership of animals, poultry, and land among others. Given the focus of this study, household wealth status was recomputed only for urban households (excluded rural households) for each country using the procedures described by the DHS (Rutstein, Undated). The re-computation of wealth was essential to estimate the relative wealth status of households for each type of residence by allowing for differing item weightings for specific analyses of the urban households (Rutstein and Staveteig, 2014). The computed wealth score was categorized into five categories from the poorest 20% to the richest 20%.
Data Analysis
Different measures have been developed to estimate inequality- and are classified as either ordered or non-ordered (McKay, 2002; Hosseinpoor et al., 2016). In this study, our main inequality measure is the household wealth index grouped into five categories from poorest 20% (most-disadvantaged) to the richest 20% (most-advantaged). Wealth status given its natural ordering and with more than two groups is treated as an ordered measure (Hosseinpoor et al., 2016). We further, where necessary stratify our analysis by age group and the gender of the child. Examining the effect of gender interactions is crucial given the persistent gender inequalities in accessing education and literacy rates across developing countries and especially in Africa. Girls from poor families are mostly unable to enrol in school in comparison to their male counterparts and particularly when resources are scarce (UNESCO, 2019).
We utilize three key measures of inequality of ordered dimension: Rate difference (absolute difference), rate ratio (relative inequality) and relative concentration index (Ibourk and Amaghouss, 2012; Hosseinpoor et al., 2016). The rate difference is the absolute difference between two subgroups of interest and thus shows the absolute inequality between the subgroups. For instance, in our study, the rate difference was computed ass the absolute difference in the proportion of school-going age children enrolled in school between the most-advantaged (richest) and most-disadvantaged (poorest). A positive difference shows higher enrolment among the most advantaged compared to the poorest.
The rate ratio is the ratio between two subgroups and is obtained by dividing the indicator of interest of the most advantaged group by that of the most disadvantaged. The rate ratio takes a value of one if there is no inequality and a value greater than one when the rate of enrolment favours the most advantaged group, indicating inequality. It is important to note that the rate ratio only takes positive values (Hosseinpoor et al., 2016). Both the rate difference and rate ratio and only focus on external categories of the inequality measure and do not take into account the population share i.e. are unweighted.
The relative concentration index is a complex measure of inequality that shows whether enrolment is concentrated among the advantaged or the disadvantaged. Unlike the rate difference and ratio, the concentration index takes into account the population share and measures the absolute inequality based on the deviation of the concentration curve from the line of equality (Ibourk and Amaghouss, 2012; Hosseinpoor et al., 2016). The concentration index is twice the area between the line of equality and the concentration curve. The data analysis was conducted in STATA version 15. The estimation of the absolute difference and rate ratio was based on the mean enrolment for each country for the children from the most advantaged and disadvantaged children. The concentration index was estimated using the approach provided by Wagstaff (2011) which calls for normalization when the measure of interest is binary as is the case. We used conindex STATA command developed by O’Donnell et al. (2016) in estimating the concentration index. Finally, we conducted a sensitivity analysis by fitting a regression analysis that allows taking into consideration background characteristics and interaction of key variables of interest, and with country fixed effects.
Results
Table 1 presents the distribution of the sample by country, age, gender, and schooling status. In total, the sample consisted of 180,171 individuals aged between 6 and 24 years, of which 51 and 54% were girls and aged between 6 and 11 years respectively. There was a consistent distribution of gender across all countries and favouring girls. However, in terms of age group, there were more individuals aged 6 to 11, than those aged between 12 and 17 years. In terms of school enrolment, overall, 84.3% of the individuals were enrolled in school at the time of data collection. While slightly more individuals aged 6–11 years were in school, the proportion does not significantly differ from that of those aged between 12 and 17 years. However, there are apparent variations across countries, with Chad (69%), Benin (73%) and Mali (75%) having the lowest enrolment. South Africa, (97%), Malawi (95%), Zimbabwe and Lesotho (94%) and Namibia (93%), mostly located in Southern Africa had the highest overall enrolments. In terms of age, enrolments were high between ages 8 and 14. In terms of the level of education, among those reporting to be in school, 68% (87 and 46% ages 6 to 11 and 12 to 17 respectively) were enrolled in primary, while a further 21% of individuals aged 12 to 17were in secondary schools. Among those not in school, 61% had no education, 22 and 6% had incomplete or completed primary education, while 8 and 2% had incomplete or completed secondary level respectively. Further examination of the age distribution of those with no education and currently not in school, showed that 37, 16 and 10% were aged six, seven and 8 years respectively. Overall, 72, 83 and 87% of those aged six; seven and 8 years were enrolled in school at the time of the survey.
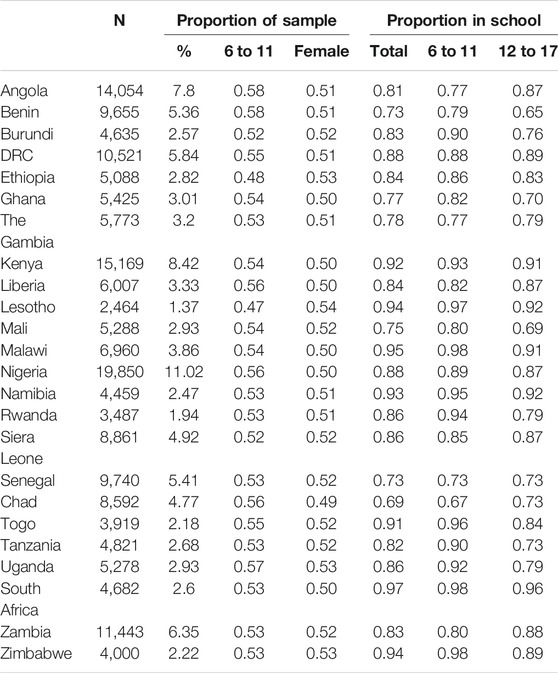
TABLE 1. Background characteristics of the study sample.
Table 2 shows the distribution of the sample by wealth index and age group of children living in urban areas in the 24 countries participating in the analysis. We restricted the presentation of results to the two wealth categories of interest: Q1, which is the lowest wealth category (more disadvantaged) and Q5 is the wealthiest category (less disadvantaged). Overall, among children aged 6–11 years, 22.4% were living in the wealthiest households as compared to 18.2%, while among the 12 to 17, 25.2% compared to 17.1% respectively. The differences were statistically significant given the large sample size. Senegal had both the highest number of school-going aged children ranked in the poorest category as well as the lowest proportion in the wealthiest category, overall and across the age groups. Ethiopia, on the other hand, had the highest proportion of school-going children ranked in the wealthiest category, while Zambia and Angola had the least proportion of children ranked in the poorest category for ages 6 to 11 and 12 to 17 respectively.
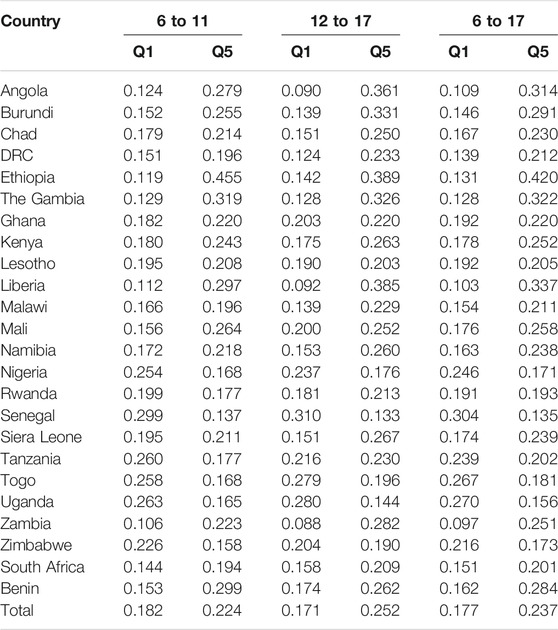
TABLE 2. Proportion of population of school going aged children living in urban areas by wealth and age group.
Enrolment Patterns by Wealth
Table 3 shows the enrolment patterns and absolute differences in enrolment for the two wealth categories of interest stratified by age group for each country. The proportion of children enrolled in school, and in particular, among children aged 6–11 years is significantly lower for urban children living in extreme poverty in most of the countries as indicated by the positive absolute differences. In the majority of the countries, more than 90% of children in urban rich households were enrolled in school; a few countries such as Benin, Gambia, Mali, and Senegal have enrolments of below 80%. In 15 of the 24 countries, have less than 90% of the children aged 6 to 11 and from the lowest wealth group enrolled in school. Among children aged between 12 and 17 years, though most countries (14 out of the 24) posit positive absolute differences, there is no clear emerging pattern to suggest an urban rich advantage. The absolute differences are small and not statistically significant for this age group.
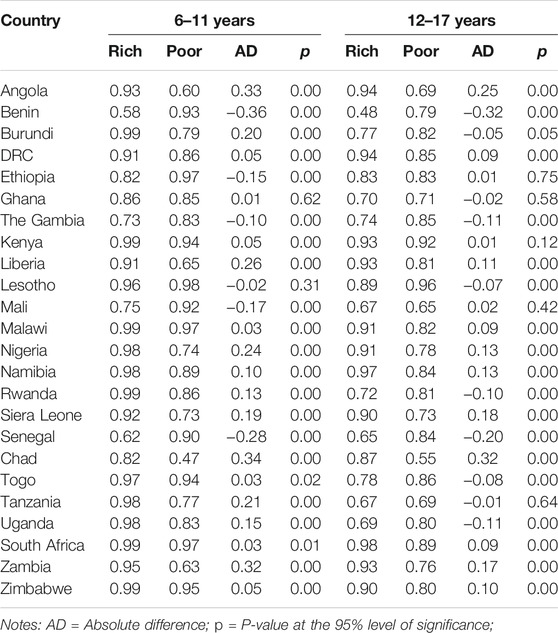
TABLE 3. Enrolment rates and absolute difference by wealth and age group.
Rate Ratio in School Enrolment
Figures 1A,B show inequalities in education access measured using rate ratio for ages 6–11 and 12–17 respectively. The rate ratio takes a value of one if there is no inequality, a value greater than one when the rate of enrolment favours the most advantaged group, indicating inequality. Thus, countries placed above the horizontal line shows increased enrolment among the wealthy group relative to the most disadvantaged category. The far the country is placed above or below the line the higher the inequality. From Figure 1A, 18 of the 24 countries showed inequality in school enrolment among children aged 6–11 years in favour of urban rich households. That is, children living in urban households living in poverty in the 18 countries were less likely to be enrolled in school as compared to those from urban wealthiest households. Inequality in school enrolment, based on the rate ratio was pronounced in Angola, Liberia and Chad, with children aged between 6 and 11 years in urban poor households having at least a 30% chance of not being in school as compared to those in urban wealth households (rate ratio of at least 1.4). We also note better enrolment patterns to the advantage of the poorest in five countries: Benin, Ethiopia, Gambia, Mali and Senegal. In these countries, the rate ratio is below one, indicating that children from the lowest wealth category were more likely to be enrolled in school as compared to those from the wealthiest households.
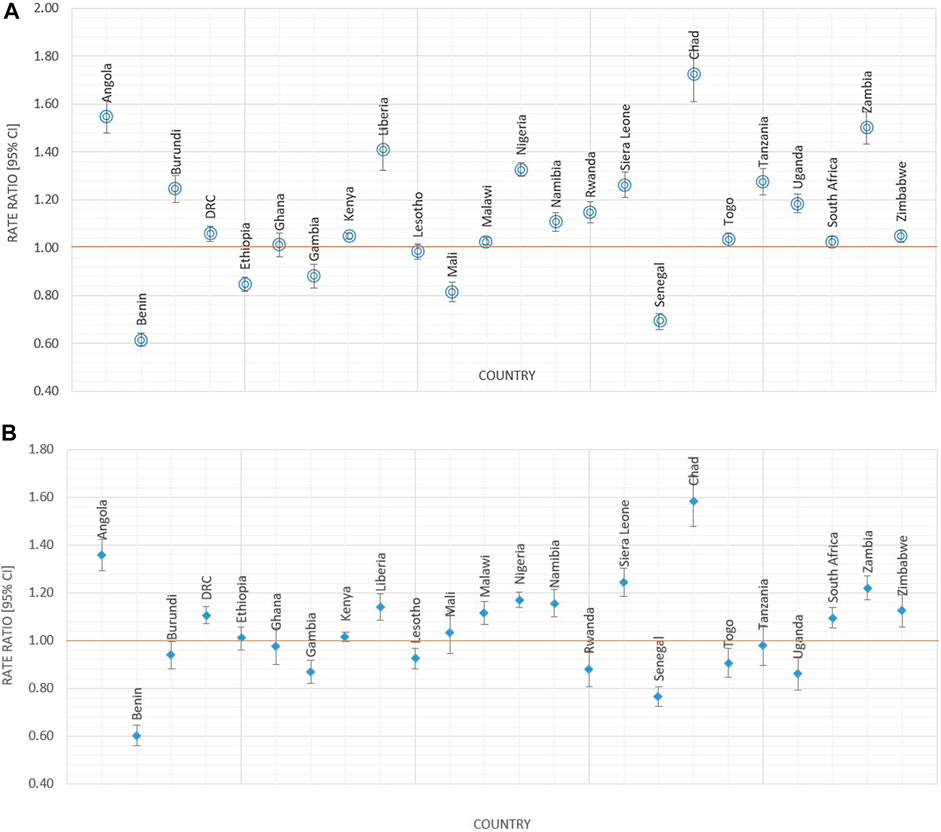
FIGURE 1. (A) Rate ratio in school enrolment among children aged 6–11 years. (B) Rate ratio in school enrolment among children aged 12–17 years.
We observe a similar pattern from Figure 1B, which shows inequality in school enrolment among children aged 12–17 years. However, among this age group, 14 countries show an urban rich advantage. Inequality in school enrolment among this age was pronounced in both Angola and Chad, with a rate ratio of at least 1.4; the two countries also showed a high inequality among children aged 6–11 years. In 10 countries, show an urban rich disadvantage including Rwanda, Burundi, Ghana, Togo, Tanzania and Uganda. Four countries, Benin, Gambia, Lesotho and Senegal show an urban rich disadvantage for both ages groups.
It is worth noting that, several countries seem to achieve near equality in education access irrespective of the wealth status. These countries are placed close to the rate ratio of one and include DRC, Ghana, Kenya, Lesotho, Malawi, Togo, South Africa and Zimbabwe for the ages 6–11 years. Among the population of children aged 12–17, Ethiopia, Ghana, Kenya, Mali and Tanzania are also near to equal education access when comparing the between the two extreme wealth categories. It is only Kenya and Ghana that seemed to have near equality for both age groups when using rate ratio as a measure of inequality.
When the data were stratified by gender of the child (Tables 4, 5), the patterns as observed in Figures 1A,B remain. However, in some countries, inequalities are pronounced for a specific gender. There is however no clear pattern to suggest girls are overly disadvantaged than girls. We isolated countries that had the highest difference in the rate ratio of school enrolment by gender. Among children aged 6–11 years, Liberia (Boys RR = 1.48, Girls RR = 1.36) and Chad (Boys RR = 1.57, Girls RR = 1.96), inequality among girls were significantly higher than among boys; while in Sierra Leonne (Boys RR = 1.38, Girls RR = 1.16) and Zambia (Boys RR = 1.62, Girls RR = 1.40) boys in urban seemed to be disadvantaged compared to girls. For individuals aged 12–17 years, inequality in school enrolment was highest in girls than in boys in Angola, Mali, Malawi and Chad; and in highest among boys than in girls in Burundi, Rwanda, Tanzania and Uganda. In Uganda and Tanzania, girls aged between 12 and 17 and from urban households living in poverty had better enrolment patterns than those in urban rich households, while the result was the opposite among the boys.
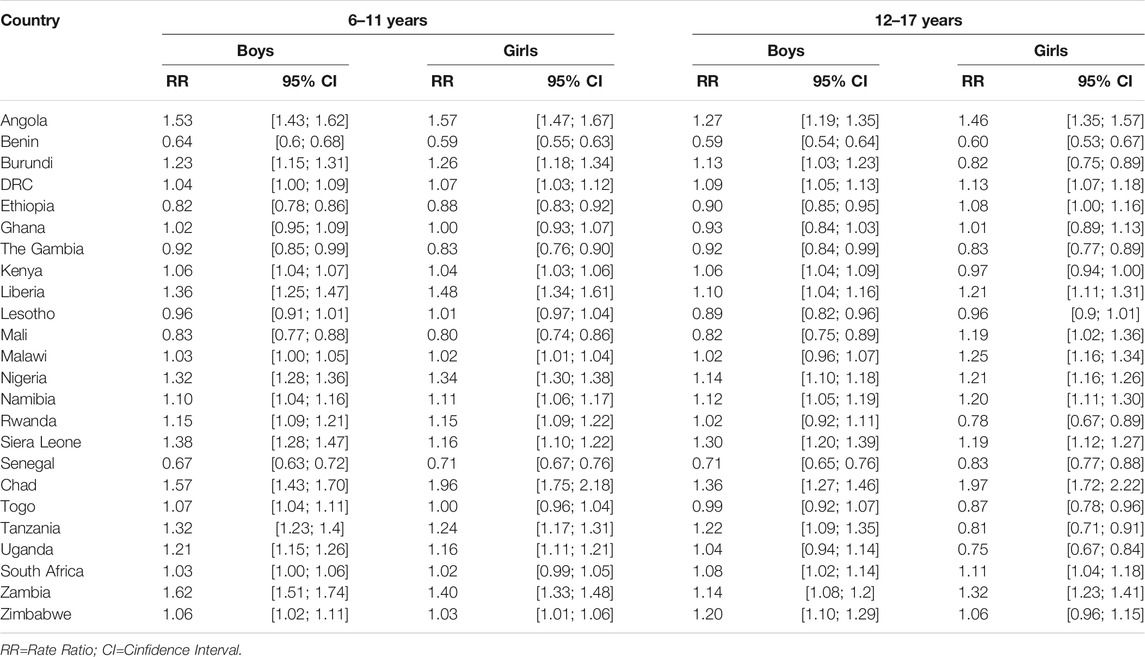
TABLE 4. Rate ratio in school enrolment by age group and gender.
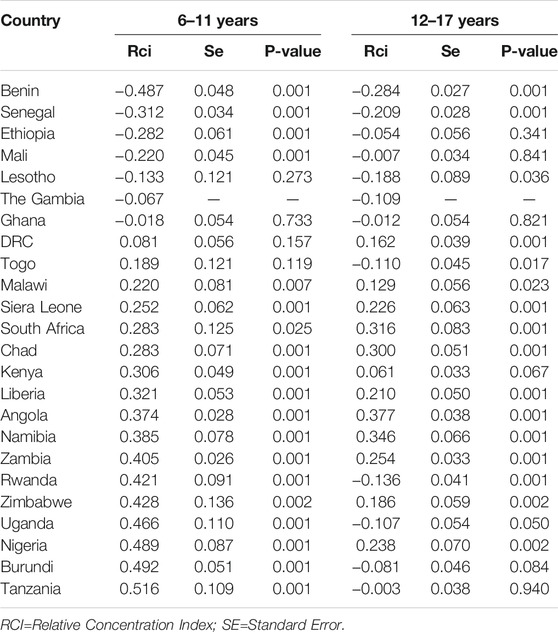
TABLE 5. Relative concentration index in school enrolment by age group.
Concentration Index
The rate ratio and rate difference only take into consideration the extreme categories—the most advantaged and disadvantaged—and they do not account for the population share. To overcome this weakness, we computed the relative concentration index, which measures the absolute inequality based on the deviation of the concentration curve from the line of equality (Table 4) and Figures 2A,B. When the concentration index (CI) is negative (CI < 0), the curve lies above the equality line, suggesting that school enrolment is more concentrated among households living in poverty; while when CI > 0, the curve is below the equality line implying school enrolment is concentrated among the urban rich.
FIGURE 2. (A) Relative concentration index in school enrolment among children aged 6–11 years. (B) Relative concentration index in school enrolment among children aged 12–17 years.
The observed inequality based on the CI mimics those of the rate among the population of children aged 6–11 years, 17 of the 24 countries had positive CI indicating. This implied school enrolment was concentrated more heavily among children from wealthier urban households. The positive coefficients for these countries are statistically significant with an exception of DRC and Togo. The remaining countries, with an exception of Lesotho, Gambia and Ghana, have a significant negative coefficient indicating an advantage in school enrolment among urban households living in poverty.
Among the population of children aged between 12 and 17 years, the results are mixed, with half of the countries experiencing a higher concentration of school enrolment among the wealthier (positive CI) and the rest among the poorest (negative CI). However, the results for eight, (other than Kenya, the rest have a negative index) countries are not statically significant, implying an overall higher concentration of school enrolment among the urban rich households.
The size of the CI indicates the degree of inequality and shows the deviation from attaining equitable school enrolment; with large values (both negative and positive) indicating a high degree of inequality. In this study, the degree of inequality varied considerably between countries and the age groups. Taking into consideration the population aged between 6 and 11 years, on the one hand, Tanzania had the highest degree of school enrolment inequality favouring the urban rich followed by Burundi, Nigeria, and Uganda. On the other hand, Burundi had the highest degree in inequality of school enrolment concentrated among the urban households living in poverty followed by Senegal and Ethiopia. Benin and Senegal also have the highest degree of inequality in school enrolment favouring children aged 12–17 years and living in poverty. Moreover, among this population. Angola, Namibia, South African and Chad have the highest inequality in school enrolment concentrated among the urban rich.
Ghana appears to be the only country that has near equality—based on the results of the concentration index, which show very small and insignificant CI for both age groups. While Benin seems like the country with the highest degree of inequality, with a high concentration of enrolment among the urban poor than the urban rich. Further analysis showed that there was no systematic evidence to suggest that inequalities were higher amongst a particular gender than the other, despite some differences in the magnitude of the CI.
We further explored inequalities by gender within the lowest wealth category. At the young ages (6–11 years), both boys and girls had almost equal access to education as indicated by absolute differences of almost zero and rate ratios of almost one. However, at higher ages (12–17) boys in eight of the 24 countries had about a 10% percentage point advantage in enrolment than girls from the same socioeconomic status. This implies that even within the resources deprived and low SES urban households generally considered to be living in poverty, at higher ages, there are gendered inequalities that favour boys over girls. The regression analysis after controlling for country effects and interacting wealth, gender and age group showed persistent wealth inequalities and disparities in school enrolment (Table 6). Children from high socioeconomic statuses were more likely to enroll in school compared to those from the lowest irrespective of their gender and age group. Moreover, the likelihood of enrolment significantly increased (OR = 1.18) among girls aged 6–11 years compared to boys of the same age group. When gender interacted with wealth, we find that boys in wealthier households (wealth statuses Q2 to Q4) were more likely to enroll in school compared to boys from the poorest wealth category (Q1). While girls from wealthier households were also likely to enroll in school than boys from the poorest wealth category, the magnitude of the odds ratio was smaller compared to that of male children indicating gendered inequality in schooling access by wealth. Despite there being no specific criteria for selecting Angola as the reference category other than the alphabetical order, we note that DRC, Togo, Kenya, Namibia, Zimbabwe, Malawi, and South Africa had significantly higher odds of their school-going population being in school. Whereas Benin, Chad and Senegal had significantly lower enrolments irrespective of the country of reference.
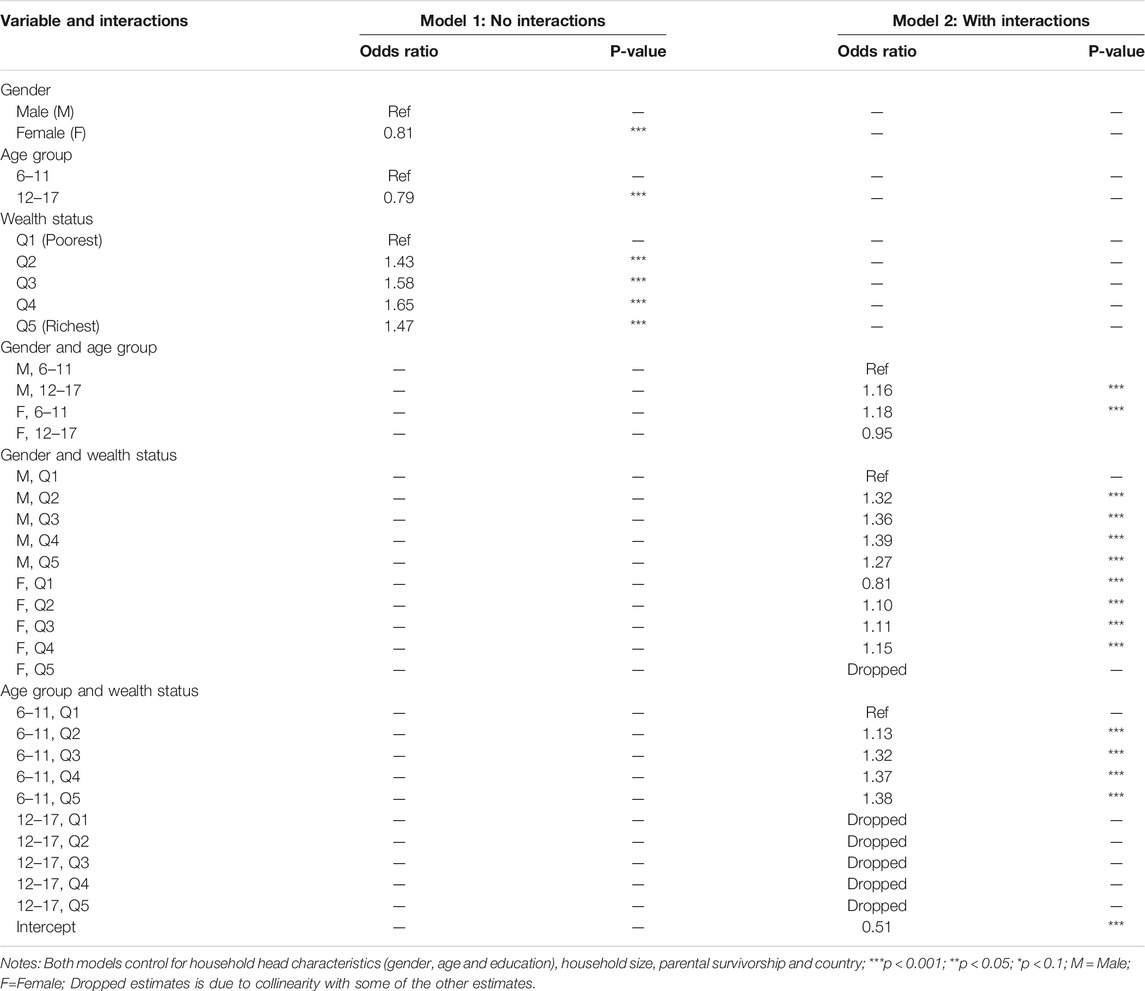
TABLE 6. Logistic regression models for the effect of wealth and gender on school enrolment in 24 SSA countries.
Discussion
Equity, equality and inclusion in education are essential to enable individuals and their families to emerge from poverty as envisioned in the 2030 agenda SDGs. Indeed achieving shared prosperity, self-generated, and sustainable urban spaces in SSA may not be successful without expanding education opportunities for all children including urban households struggling with poverty. Expansion of access to education to populations that are historically excluded, but also those experiencing new forms of exclusion due to urbanization is critical and urgent. Equality exists when there is an equal state of a certain phenomenon, in this case, education access in terms of key deprivation measures such as wealth, gender, race, special needs among others. When one group is deprived more than the other inequality features. Notably, SDG4 stipulates the need for inclusivity and equal access to educational opportunities for all, in Africa and a concentrated effort of eliminating disparities among children living in vulnerable situations, which in our case include urban dwellers living in extreme poverty.
Inequity gaps in education are more pronounced based on residence, wealth and gender (Kaffenberger and Pritchett, 2020). Even within residences, socioeconomic and gender differences exist. To this end, many studies in education e.g., Filmer (2005) tended to focus on wealth and gender inequalities irrespective of the residency type. There is a growing need to examine the interactions of the inequity measures. Thus, in our study, we attempted to fit the gap by understating wealth inequalities in education enrolment in an urbanizing context using data from 24 SSA countries. In particular, we compared enrolment into school between the most advantaged (urban rich) and disadvantaged (urban poor) populations in the participating countries.
While there have been concerted efforts to improve access to education among households with the lowest wealth index because of perceived urban advantage persistent inequalities in education access exist in urban settings(Fafo, 2015). The results demystify the urban advantage to show high levels of inequalities in education access in an urban setting, with children of school-going age in urban poor settings significantly less likely to be in school compared to those from richest ranked households; the inequalities were worse at young ages. We also find enrolment was unequally distributed across the different countries included in the analysis. Particularly, the urban households living in poverty in some countries such as Liberia experienced high inequalities compared to others such as Kenya and Ghana. We also find intriguing results in few countries such as Ethiopia, Benin, Senegal and Mali, which had better school enrolments children from impoverished urban households compared with the urban rich demographic. These results align with the evidence from prior studies for instance in Ethiopia that countries with multi-dimensional poverty including in health, enrolments were generally low for the majority of school-going children (UNICEF, 2019). Further, an out of school study in Senegal showed that more than 20% of school-going from the wealthiest households were out of school (World Bank, 2013). Thus while our findings in these countries may sound intriguing they potentially point to other factors and call for studies to deeply examine influences of school enrolment outside wealth, gender and age.
While the urban advantage has been touted over time, our results illustrate that access to education remains a challenge in SSA; this is even more daunting among the urban households from low SES who mainly reside in informal settlements. Several other studies that support our findings have examined wealth inequalities on several education outcomes (Spaull and Taylor, 2015; Rose et al., 2017). Rose et al. (2017) showed that learning poverty was high among children from poor backgrounds, and was more pronounced when interacting with poverty and gender. Spaull and Taylor (2015) showed that access to literacy achievement gap to be larger by the socioeconomic status of the child more than the gender.
The majority of the urban population living in poverty in SSA mainly reside in urban informal settlements or the so-called slums. These settlements are characterized by limited investments in social services by governments. In these settlements, limited provision of public education has resulted in the mushrooming of low-fee private education providers (Ngware et al., 2013; Zuilkowski et al., 2018). In Kenya, and possibly a majority of other countries, children living in informal settlements to pay for education for the majority are enrolled in non-state schools that are excluded from government initiatives such as universal education capitation(Oketch et al., 2010a). Other than Kenya, the majority of the countries included in the analysis lacked legal and policy frameworks to address the fate of urban poor households. This potentially explains the inequities observed in the study, in which those with limited financial resources and ranked lowest on the wealth index have to pay for education due to the absence of specific intervention to address their educational needs. For instance, in Kenya majority of households living in low resourced informal urban settings are forced to send their children to low-cost private schools thus have to pay for tuition expenses regardless of the quality of education in these resource-deprived institutions despite the provision for free primary education (Ngware and Mutisya, 2021).
Urban low resources households rely on unskilled and informal employment, which offers little returns to invest in their children education. Buchmann and Hannum (2001) underscore the importance of family background on children’ education attainment and social mobility. These connections point to returns in investment and particularly available employment opportunities for children from low socioeconomic status. In this study, we also found gendered based differences in schooling outcome by wealth status, with male children from wealthier households more likely to enroll in school compared to females from similar wealth categories. While it is anticipated that inequalities in education access by gender would reduce with increases in wealth, van Hek et al. (2016) argue that the returns on investment particularly women labour participation to play an important role in closing the gap. In most SSA countries the rates of urbanization are not coupled with economic opportunities for youth, leading to higher unemployment rates. For instance, the unemployment to population ratio in Africa has remained consistently at 40% between 2012 and 2020, with the youth disproportionately disadvantaged (ILO, 2020; Fox and Gandhi, 2021). Thus parents, particularly those living in poverty may not see the benefits of investing in the education of their children in the long term if there are no foreseeable returns on their investment (Hedges et al., 2016). Therefore, amidst other competing needs like food and shelter in urban areas education may not be a priority and the limited returns can act as a barrier to keeping children in school.
The wealth inequities in education access have a bearing on other outcomes beyond enrollment. Wealth, measured by household socioeconomic status (SES) affects not only access to education but also attendance, retention, progression, and ultimate completion of basic education. Therefore, exploring how the household wealth index is correlated with the aforementioned variables remains crucial as countries grapple with challenges facing the achievements of EFA. Most importantly, children from low resourced contexts are faced with low education attainment, hence limiting upward social mobility (McMahon and Oketch, 2013). The underlying effect that the identified education inequalities indicators could have on learners enrolled in basic education and living in poverty was illustrated from the results on access and learning in ten countries Southern and East African countries between 2000 and 2007 (Spaull and Taylor, 2015). The study examined learning outcomes among the ten countries based on the data derived from the Southern and East African Consortium for Monitoring Evaluation (SACMEQ). The assessment revealed that countries like Kenya, Tanzania and Swaziland registered high combined measures of access and learning referred to in the study as access to learning—“proportion of children who reach a particular grade and have acquired specific learning outcome”, specifically in literacy and numeracy at the primary school level. These results indicate that there exists strong evidence that access to schooling in these countries was accompanied by improved access to learning outcomes (Spaull and Taylor, 2015).
Limitations
While measures of learning outcomes (specifically basic literacy and numeracy) were beyond the scope of this article, we acknowledge that they are important indicators for a more comprehensive analysis of how inequality in education access is directly linked to access to schooling. Socioeconomic disadvantage and weak performance have strongly been associated with dropping out of school (Filmer and Pritchett, 1999). Moreover, considering that learners from households living in poverty have higher opportunity costs in education, utilizing variables of access to education alone is limiting in understanding inequalities in education for this population segment as SSA countries have a high rate of drop out from schools, poor grades progression and low learning outcomes. Moreover, we acknowledge that determinants of enrolment are diverse and contextual beyond socioeconomic status including other household characteristics (Samir and Peasgood, 1998). It is however important to note that SES has been studied as a predictor of a vast array of outcomes including in health (Darin-Mattsson et al., 2017), for it is highly correlated and manifests other deprivations in a population such as food security.
Conclusion
Access to education is central and critical to the realization of other human rights, such as health. Education, an investment in human capital development is also central to overall economic growth and development. However, despite the importance, there remains large variations in education access within, and specifically among urban populations, and across countries. To address the variations, or rather, inequalities in education access, African governments should invest more in education to support quality education through increasing investments in public education and reducing the financial burden that could impede poor families from sending their children to school. This is also expected to increase access to education for learners with diverse physical and learning needs and improve the quality of education by ensuring adequate resources are provided and sufficient qualified teachers are hired as they are in a better position of embedding gender-responsive techniques in their teaching practices.
Given its every child’s right to access education, government authorities in respective SSA countries should ensure that parents who fail to abide by the set basic education policies are held accountable as parents can help to support and enforce enrolment, retention in education and progression from primary to secondary level. There is a need for strategic efforts to combat the apparent inequalities that disadvantage learners from poor families to access education (Rose et al., 2017). In particular, education for girls is important in reversing exiting gendered inequalities in health, education and economic participation. Investing in girls, especially those from poorer backgrounds can have ripple effects in reducing the economic vulnerability of poor households and increasing school participation among girls.
Interventions and policy frameworks should focus on reducing inequalities in access to education, ensure retention and progress from one grade to the other, and most importantly develop strategies that will improve quality in education and foster learning achievement for diverse groups of learners. Moreover, promoting access to and quality education should be coupled with the expansion of employment opportunities particularly targeting the youth. This will encourage parents, and more so those living in poverty to view education as an investment with returns and as social security. This is even critical and urgent for populations that have not been on focus such as the urban poor. These strategies will stimulate the achievement of sustainable development goals in general, and the realization of individual countries vision and development agenda, which are requisites for a more inclusive human development and sustainable growth of the economy.
Data Availability Statement
Publicly available datasets were analyzed in this study. This data can be found here: https://dhsprogram.com/Data/.
Ethics Statement
We use secondary data collected through the Demographic and Health Surveys (DHS). Procedures and questionnaires for standard DHS surveys are approved by ICF Institutional Review Board (IRB). Additionally, country-specific DHS survey protocols are reviewed by the ICF IRB and typically by an IRB in the host country. ICF IRB ensures that the survey complies with the U.S. Department of Health and Human Services regulations for the protection of human subjects (45 CFR 46), while the host country IRB ensures that the survey complies with laws and norms of the nation. Written informed consent to participate in this study was provided by the participants’ legal guardian/next of kin.
Author Contributions
MM conceptualized the manuscript, conducted data analysis, description of results and contributed to the discussion and the overall review of the manuscript; JM contributed to the literature review, discussion and overall review of the manuscript; BA reviewed the manuscript and contributed to the conceptualization and shaping of the paper.
Conflict of Interest
The authors declare that the research was conducted in the absence of any commercial or financial relationships that could be construed as a potential conflict of interest.
Publisher’s Note
All claims expressed in this article are solely those of the authors and do not necessarily represent those of their affiliated organizations, or those of the publisher, the editors and the reviewers. Any product that may be evaluated in this article, or claim that may be made by its manufacturer, is not guaranteed or endorsed by the publisher.
Acknowledgments
We acknowledge the two reviewers for their comments that have greatly improved this work.
References
Abuya, B. A., Wekulo, P., and Muhia, N. (2018). Support to Children's Education in the Urban Slums of Nairobi: Community and Parents' Perceptions with an Expanded Phase of an Education Intervention Program. Qre 7 (2), 118–143. doi:10.17583/qre.2018.3240
Akyeampong, K. (2009). Revisiting Free Compulsory Universal Basic Education (FCUBE) in Ghana. Comp. Edu. 45 (2), 175–195. doi:10.1080/03050060902920534
Birchall, J. (2018). “Early Marriage, Pregnancy and Girl Child School Dropout,” in Knowldege, Evidence and Learning for Development (United Kingdom: DFID).
Brockerhorff, M., and Brennan, E. (1998). The Poverty of Cities in Developing Countres. Popul. Dev. Rev. 24 (1), 75–114. doi:10.2307/2808123
Buchmann, C., and Hannum, E. (2001). Education and Stratification in Developing Countries: A Review of Theories and Research. Annu. Rev. Sociol. 27(1), 77–102. doi:10.1146/annurev.soc.27.1.77
Darin-Mattsson, A., Fors, S., and Kåreholt, I. (2017). Different Indicators of Socioeconomic Status and Their Relative Importance as Determinants of Health in Old Age. Int. J. Equity Health 16 (1), 173. doi:10.1186/s12939-017-0670-3
Edwards Jr, D. B., Klees, S., and Wildish, J. (2017). Dynamics of Low-Fee Private Schools in Kenya: Governmental Legitimation. School-Community Dependence, and Resource Uncertainty, Teach Col Rec, 119(7):1-42. doi:10.13140/RG.2.1.4606.7923
Fafo, A. K. (2015). “Evolution in Approaches to Improve Access to Education for Children Living in Urban Slums,” in Background Paper Prepared for the Education for All Global Monitoring Report 2015, Education for All 2000-2015: Achievements and Challenges (Place de Fontenoy, Paris, UNESCO).
Filmer, D. (2005). Gender and Wealth Disparities in Schooling: Evidence from 44 Countries. Int. J. Educ. Res. 43 (6), 351–369. doi:10.1016/j.ijer.2006.06.012
Filmer, D., and Pritchett, L. (1999). The Effect of Household Wealth on Educational Attainment: Evidence from 35 Countries. Popul. Dev. Rev. 25 (1), 85–120. doi:10.1111/j.1728-4457.1999.00085.x
Fox, L., and Gandhi, D. (2021). “Youth Employment in Sub-saharan Africa: Progress and Prospects,” in Addressing Africa’s Youth Unemployment through Industries without Smokestacks. African Growth Initiative at Brookings.
Haile, G., and Haile, B. (2012). Child Labour and Child Schooling in Rural Ethiopia: Nature and Trade-Off. Edu. Econ. 20 (4), 365–385. doi:10.1080/09645292.2011.623376
Hattori, H. (2014). “Demographic and Socioeconomic Determinants of School Attendance: An Analysis of Household Survey Data,” in Background Paper Prepared for Fixing the Broken Promise of Education for All: Findings from the Global Initiative on Out-Of-School Children (Montreal: UNESCO Institute for Statistics.).
Hedges, S., Borgerhoff Mulder, M., James, S., and Lawson, D. W. (2016). Sending Children to School: Rural Livelihoods and Parental Investment in Education in Northern Tanzania. Evol. Hum. Behav. 37 (2), 142–151. doi:10.1016/j.evolhumbehav.2015.10.001
Hosseinpoor, A. R., Nambiar, D., Schlotheuber, A., Reidpath, D., and Ross, Z. (2016). Health Equity Assessment Toolkit (HEAT): Software for Exploring and Comparing Health Inequalities in Countries. BMC Med. Res. Methodol. 16 (1), 141. doi:10.1186/s12874-016-0229-9
Ibourk, A., and Amaghouss, J. J. (2012). Measuring Education Inequalities: Concentration and Dispersion-Based Approach. Lessons from Kuznets Curve in MENA Region 2 (6), 51–65. doi:10.5430/wje.v2n6p51
ILO (2020). Global Employment Trends for Youth 2020: Africa. International Labour Organization. Geneva, Switzerland (ILO).
Jayachandran, S. (2015). The Roots of Gender Inequality in Developing Countries. Annu. Rev. Econ. 7 (1), 63–88. doi:10.1146/annurev-economics-080614-115404
Kaffenberger, M., and Pritchett, L. (2020). Aiming Higher: Learning Profiles and Gender equality in 10 Low- and Middle-Income Countries. Int. J. Educ. Dev. 79, 102272. doi:10.1016/j.ijedudev.2020.102272
Kritz, M. M., and Makinwa-Adebusoye, P. (1999). Determinants of Women's Decision-Making Authority in Nigeria: the Ethnic Dimension Sociological Forum. 399–424. doi:10.1023/A:1021495418633
Lewin, K. M., and Sabates, R. (2012). Who Gets what? Is Improved Access to Basic Education Pro-poor in Sub-saharan Africa, Int. J. Educ. Dev. 32 (4), 517–528. doi:10.1016/j.ijedudev.2012.02.013
Lloyd, C. B., and Mensch, B. S. (2008). Marriage and Childbirth as Factors in Dropping Out from School: An Analysis of DHS Data from Sub-saharan Africa. Popul. Stud. (Camb) 62, 1–13. doi:10.1080/00324720701810840
Lloyd, C. B., and Hewett, P. (2009). Educational Inequalities in the Midst of Persistent Poverty: Diversity across Africa in Educational Outcomes. J. Int. Dev. 21 (8), 1137–1151. doi:10.1002/jid.1650
Louw, M., Van der Berg, S., and Derek, Y. (2006) Educational Attainment and Intergenerational Mobility in South Africa. in:Stellenbosch Working Paper 09/2006. Stellenbosch, South Africa: Bureau for Economic Research/Department of Economics, University of Stellenbosch.
Majgaard, K., and Mingat, A. (2012). Education in Sub-saharan Africa : A Comparative Analysis. Washington, DC, USA: World Bank. License CC BY 3.0 IGO.
McMahon, W. W., and Oketch, M. (2013). Education's Effects on Individual Life Chances and on Development: An Overview. Br. J. Educ. Stud. 61 (1), 79–107. doi:10.1080/00071005.2012.756170
Motala, S., Dieltiens, V., and Sayed, Y. (2009). Physical Access to Schooling in South Africa: Mapping Dropout, Repetition and Age‐grade Progression in Two Districts. Comp. Edu. 45 (2), 251–263. doi:10.1080/03050060902920948
Ngware, M. W., Abuya, B., Admassu, K., Mutisya, M., Musyoka, P., and Oketch, M. (2013). Quality and Access to Education in Urban Informal Settlements in Kenya. Nairobi, Kenya: African Population and Health Research Center. https://aphrc.org/publication/quality-and-access-to-education-in-urban-informal-settlements-in-kenya/.
Ngware, M. W., and Mutisya, M. (2021). Demystifying Privatization of Education in Sub-saharan Africa: Do Poor Households Utilize Private Schooling Because of Perceived Quality, Distance to School, or Low Fees, Comp. Edu. Rev. 65 (1), 124–146. doi:10.1086/712090
Ningaye, P., Koyeu, F. P. F., and Africa, E. o. (2019). Inequality of Opportunities and Distribution of Accessibility to Basic Education in Cameroon. SSRN Elec J.12(2/3), 275–298. doi:10.2139/ssrn.3349930
O'Donnell, O., O'Neill, S., Van Ourti, T., and Walsh, B. (2016). Conindex: Estimation of Concentration Indices. Stata J. 16 (1), 112–138. doi:10.1177/1536867x1601600112
Oketch, M., Mutisya, M., Ngware, M., Ezeh, A. C., and Epari, C. (2010b). Free Primary Education Policy and Pupil School Mobility in Urban Kenya. Int. J. Educ. Res. 49, 173–183. doi:10.1016/j.ijer.2011.01.002
Oketch, M., Mutisya, M., Ngware, M., and Ezeh, A. C. (2010a). Why Are There Proportionately More Poor Pupils Enrolled in Non-state Schools in Urban Kenya in Spite of FPE Policy? Int. J. Educ. Dev. 30, 23–32. doi:10.1016/j.ijedudev.2009.08.001
Roby, J. L., Erickson, L., Nagaishi, C., and Review, Y. S. (2016). Education for Children in Sub-saharan Africa: Predictors Impacting School Attendance. Child. Youth Serv. Rev. 64, 110–116. doi:10.1016/j.childyouth.2016.03.002
Rose, P., Sabates, R., Alcott, B., and Ilie, I. (2017). Overcoming Inequalities within Countries to Achieve Global Convergence in Learning. doi:10.17863/CAM.7673
Rutstein, S. O., and Staveteig, S. (2014)Making the Demographic and Health Surveys Wealth Index Comparable. in DHS Methodological Reports. Rockville, Maryland, USA: ICF International).
Sabates, R., Akyeampong, K., Westbrook, J., and Hunt, F. (2010). School Drop Out: Patterns, Causes, Changes and Policies in:Background Paper Prepared for the Education for All Global Monitoring Report 2011.
Sabates, R., Hossain, A., and Lewin, K. M. (2013). School Drop Out in Bangladesh: Insights Using Panel Data. Int. J. Educ. Dev. 33 (3), 225–232. doi:10.1016/j.ijedudev.2012.09.007
Samir, A.-S., and Peasgood, T. (1998). Educational Attainment and Household Characteristics in Tanzania. Econ. Edu. Rev. 17 (4), 395–417. doi:10.1016/s0272-7757(97)00052-6
Spaull, N., and Taylor, S. (2015). Access to what? Creating a Composite Measure of Educational Quantity and Educational Quality for 11 African Countries. Comp. Edu. Rev. 59 (1), 133–165. doi:10.1086/679295
UNDESA (2019). World Population Prospects 2019: Highlights. New York, USA: United NationsUnited Nations, Department of Economic and Social Affairs, Population Division (UNDESA)).
UNESCO Institute for Statistics (UIS) and UNICEF, (2015). Fixing the Broken Promise of Education for All: Findings from the Global Initiative on Out-of-School Children. Montreal: UIS. doi:10.15220/978-92-9189-161-0-en
UNESCO (2019). Rights to Education Handbook. Paris, France: United Nations Educational, Scientific and Cultural Organization (UNESCO).
UNICEF (2019). UNICEF. in Nearly 36 Million Children in Ethiopia Are Poor and Lack Access to Basic Social Services, a New Report Reveals. Editors E. Muleta, and W. Mulatu (Ethiopia: UNICEF).
van Hek, M., Kraaykamp, G., and Wolbers, M. H. J. (2016). Comparing the Gender gap in Educational Attainment: the Impact of Emancipatory Contexts in 33 Cohorts across 33 Countries. Educ. Res. Eval. 22 (5-6), 260–282. doi:10.1080/13803611.2016.1256222
Wagstaff, A. (2011). The Concentration index of a Binary Outcome Revisited. Health Econ. 20 (10), 1155–1160. doi:10.1002/hec.1752
World Bank (2013). Senegal - Quality Improvement and Equity of Basic Education Project. Washington, DC, USA: The World Bank.
Ye, X., Canagarajah, S., and White, P. J. (2002). Efficiency of Public Expenditure Distribution and beyond: A Report on Ghana's 2000 Public Expenditure Tracking Survey in the Sectors of Primary Health and Education. The World Bank Washington, D.C, USA.
Keywords: inequaility, urban poor, demographic and health survey (DHS), absolute difference, relative concentration index, rate ratio, Sub-Sahara Africa (SSA)
Citation: Mutisya M, Muchira JM and Abuya BA (2021) Understanding Wealth Inequalities in Education Access in Urbanizing Sub-Saharan Africa. Front. Educ. 6:649730. doi: 10.3389/feduc.2021.649730
Received: 05 January 2021; Accepted: 17 September 2021;
Published: 09 December 2021.
Edited by:
Dieudonne Uwizeye, University of Rwanda, RwandaReviewed by:
Marsha E. Modeste, The Pennsylvania State University (PSU), United StatesJoseph Nkurunziza, University of Rwanda, Rwanda
Copyright © 2021 Mutisya, Muchira and Abuya. This is an open-access article distributed under the terms of the Creative Commons Attribution License (CC BY). The use, distribution or reproduction in other forums is permitted, provided the original author(s) and the copyright owner(s) are credited and that the original publication in this journal is cited, in accordance with accepted academic practice. No use, distribution or reproduction is permitted which does not comply with these terms.
*Correspondence: Maurice Mutisya, bW11dGlzeWFAYXBocmMub3Jn