 Okan Bulut
 Damien C. Cormier
 Jinnie Shin
- 1Centre for Research in Applied Measurement and Evaluation, Faculty of Education, University of Alberta, Edmonton, AB, Canada
- 2Department of Educational Psychology, Faculty of Education, University of Alberta, Edmonton, AB, Canada
The introduction of computerized formative assessments in schools has enabled the monitoring of students’ progress with more flexible test schedules. Currently, the timing and frequency of computerized formative assessments are determined based on districts and school authorities’ agreements with testing organizations, the teachers’ judgment of students’ progress, and grade-level testing guidelines recommended by researchers. However, these practices often result in a rigid test scheduling that disregards the pace at which students acquire knowledge. Furthermore, students are likely to experience the loss of instructional time due to frequent testing. To administer computerized formative assessments efficiently, teachers should be provided systematic guidance on finding an optimal testing schedule based on each student’s progress. In this study, we aim to demonstrate the utility of intelligent recommender systems (IRSs) for generating individualized test schedules for students. Using real data from a large sample of students in grade 2 (n = 355,078) and grade 4 (n = 390,336) who completed the Star Math assessment during the 2017–2018 school year, we developed an IRS and evaluated its performance in finding a balance between data quality and testing frequency. Results indicated that the IRS was able to recommend a fewer number of test administrations for both grade levels, compared with standard practice. Further, the IRS was able to maximize the score difference from one test administration to another by eliminating the test administrations in which students’ scores did not change significantly. Implications for generating personalized schedules to monitor student progress and recommendations for future research are discussed.
Introduction
Classroom assessments allow K–12 teachers to evaluate student learning (i.e., monitor students’ progress) and make a variety of important decisions about learning outcomes (e.g., producing feedback, assigning grades). Teachers use two types of assessments to evaluate student learning in the classroom: summative and formative (Black and Wiliam, 2009). Summative assessments are typically used at the end of an instructional period, such as a unit or a semester, to evaluate student learning relative to content standards or benchmarks. Quizzes, midterm exams, or a final project are common examples of teacher-made summative assessments. There are also statewide accountability assessments for measuring student performance on specific learning standards (e.g., Common Core State Standards). Unlike summative assessments, formative assessments are used during instruction to monitor student learning, provide students with feedback, and help them identify target skills that need improvement. When Scriven (1967) first proposed the idea of formative assessment in education, he specifically emphasized that it should be used to inform “on-going improvement of the curriculum” (p. 41). Over the past few decades, formative assessments have evolved to be much broader, and now include uses such as monitoring student’s response to instruction, identifying at-risk students, and informing the instruction to address individual student needs. Today, the primary goal of formative assessments is to provide students with timely and descriptive feedback based on the learning goals or criteria for success (Hattie and Timperley, 2007; McManus, 2008).
During the past decade, the introduction of various educational technologies, such as computerized assessments including computer-based and computerized-adaptive tests, has drastically changed the implementation of formative assessments in the classroom. Computerized formative assessments provide an integration of computer technologies and measurement theory to effectively manage and deliver classroom assessments (Russell, 2010; Webb et al., 2013). With computerized formative assessments that consist of selected-response items (e.g., multiple-choice, alternative response, and matching items), teachers can evaluate the progress of individual students, while generating timely and detailed feedback without spending much time on grading and evaluating assessments (Maier et al., 2016; Bulut and Cormier, 2018; Tomasik et al., 2018). In addition, computerized formative assessments can be designed with technology-enhanced items involving visual and auditory elements, simulations, and interactive games. The availability of technology-enhanced items not only allows educators to assess higher-order thinking and problem-solving skills, but also improves students’ engagement with the assessment process (Boyle and Hutchinson, 2009; Parshall et al., 2010; Bryant, 2017).
Although the availability of computerized formative assessments has been a boon for teachers who frequently measure students’ learning progress and tailor their instruction accordingly, several improvements could still be made to maximize the potential of these tools. Currently, one of the major challenges for school-based professionals is determining the timing and frequency of test administrations. For some time, researchers have argued that frequent test administrations over a long period can be highly beneficial when making individual-level decisions based on formative assessments (Christ et al., 2012; Thornblad and Christ, 2014; January et al., 2019). The potential issue with this approach, however, is that frequent testing (e.g., weekly or bi-weekly) diminishes the amount of instructional time that students receive, which may exacerbate some of their difficulties in further developing their academic skills. In addition, using a rigid testing schedule (e.g., a set of pre-determined dates and times for testing) that disregards the pace at which students acquire knowledge may also decrease the effectiveness of formative assessments. In other words, if students are being tested again before their skills have had a chance to grow, then the time dedicated to collecting these data is likely to be wasted. To minimize the loss of instructional time that students might experience due to frequent testing and maximize the quality of the data gathered when students are assessed, computerized formative assessments need to be administered efficiently (Shinn, 2008; Bulut and Cormier, 2018).
Currently, decisions regarding the timing and frequency of formative assessments rely on general, grade-level guidelines produced by researchers (e.g., Shapiro, 2011) and educators’ ability to apply visual analysis to progress monitoring data (see Van Norman et al., 2013). These influences likely lead teachers to follow a one-size-fits-all test schedule, which requires all students to be tested during a limited number of pre-determined dates within a school year. Advanced data analytics and the availability of massive amounts of data in education can provide educators with valuable insight into student learning and help them make strong, individualized decisions for their students. Consequently, the aim of the current study is twofold: (1) develop an intelligent recommender system (IRS) that can use existing assessment data to produce an individualized test administration schedule for each student; and (2) evaluate the performance of the IRS in identifying the optimal balance between test administration frequency and data quality.
Literature Review
Computerized Assessments
Since the introduction of computer-based testing during the 1960s, computer technologies have continued to change assessment practices in education (Way and Robin, 2016). Today’s education systems are considered to implement the third generation of computerized educational assessments (i.e., formal computerized assessments that allow for the continuous and dynamic measurement of students’ academic growth). The third generation emerged as the theory and application associated with the continuous measurement approach were developed (e.g., Bunderson et al., 1989). Currently, many schools in the United States are increasingly employing computerized assessments in the classroom to evaluate and monitor students’ progress in core academic subjects – such as mathematics, reading, and science – throughout the school year (Sharkey and Murnane, 2006). These assessments are delivered not only via computers, but also with the use of other electronic devices, such as tablets, smartphones, and virtual reality devices (Davey, 2005). The data produced from computerized formative assessments are used for tailoring instruction based on students’ learning needs, identifying students who are not meeting grade-level standards, and informing parents and other stakeholders about students’ proficiency levels.
There are many advantages of computerized assessments when compared to traditional paper-and-pencil assessments. The benefits include paperless and efficient data collection (Bridgeman, 2009), automated test assembly and test-form quality control (Luecht and Sireci, 2011; Gierl et al., 2018), automated scoring of both selected-response and constructed-response items (Bennett, 2010; Williamson et al., 2012; Gierl et al., 2017), and automated score reporting for delivering timely and individualized feedback (van der Kleij et al., 2012; Bulut et al., 2019). Computerized assessments also provide greater flexibility in test scheduling (Way and Robin, 2016). In addition, the analysis of supplementary data from computerized assessments (e.g., item response times, process data, and user interaction history) allows educators, researchers, and assessment specialists to have a better understanding of students’ test-taking behaviors such as disengaged responding, rapid guessing, and aberrant responses (e.g., Wise and Kong, 2005; Lee and Jia, 2014; Kroehne and Goldhammer, 2018).
Some computerized assessments are designed as a fixed-form assessment, which involves having all students respond to the same items and complete the same tasks. Typically, fixed-form assessments consist of many items at different difficulty levels to measure a wide range of abilities accurately. Computerized adaptive tests (CATs) are a more sophisticated type of computerized assessments. Unlike fixed-form assessments, CATs administer items to students by selecting them on-the-fly from a large item bank based on the student’s performance during testing. In other words, instead of administering the same items to all students, a CAT successively selects the most suitable item for each student based on what is known about the student from previous items and thereby enabling a unique testing procedure to be generated for each student (Weiss and Kingsbury, 1984). As a result, CATs can prevent the fixed-form problem of administering items that are either too easy or too difficult for some students, which helps to maintain students’ test-taking motivation during the administration (Wise, 2014; Tomasik et al., 2018). By employing item response theory (IRT) models and adaptive algorithms for item selection, CATs can increase measurement efficiency by substantially reducing test length without sacrificing measurement accuracy (Straetmans and Eggen, 1998). Previous research also showed that the individualized and dynamic item selection procedure makes CATs highly precise in measuring individual growth over multiple time points when compared to conventional assessments (e.g., paper-and-pencil assessments and fixed-form computerized assessments; Weiss and Von Minden, 2011). There are many advantages to using CATs instead of other test formats, but ongoing developments in the areas of data science and technology could lead to additional benefits.
Optimizing Test Administrations
As emerging technologies continue to reshape all facets of life, practical challenges also arise for users of these technologies. In his best-selling book, The Design of Everyday Things, Norman (2013) states that “the same technology that makes our lives easier by adding new features in each device also complicates our lives by making these devices harder to learn and use” (p. 34). He refers to this phenomenon as the paradox of technology. Today’s educators appear to experience the paradox of technology in various ways. In schools, ease of administering computerized formative assessments frequently has enabled educators to gather large amounts of information on student performance. With the frequent administration of formative assessments (e.g., weekly or bi-weekly), educators can continuously monitor and evaluate students’ progress relative to a specific set of academic goals, which also informs policymaker decisions at the school or district level (Crane, 2008; Schildkamp, 2019). However, this situation poses several challenges in practice, such as identifying which students need to be tested, when they should be tested, and how frequently test administration should occur.
Some researchers argue that schools might follow a standardized testing approach by administering computerized formative assessments to all students at the same time, using the same test administration procedures (e.g., Sharkey and Murnane, 2006). However, this practice disregards the key assumption that, unlike summative assessments, formative assessments are contingent on the instructional situation in each classroom and thus should be tailored to the students being assessed (Black and Wiliam, 2009, p. 12). As Redecker and Johannessen (2013) pointed out, teachers should be the ultimate decision-makers when formative assessment data are used to inform instruction and develop individualized testing schedules. Yet, the process of interpreting data and implementing data-driven decisions requires considerable time, effort, and expertise (e.g., Schildkamp and Kuiper, 2010; Vanlommel et al., 2017), which may inevitably overburden teachers, given that they are primarily concerned with delivering instruction.
As mentioned earlier, educators can use computerized formative assessments for various purposes, such as identifying students who may be at-risk for learning difficulties or measuring academic progress in a given subject within a school year or from 1 year to another. Depending on how the data from computerized formative assessments are to be utilized, the timing and frequency of test administrations may also differ. For example, if a teacher wants to screen students for mathematics difficulties before starting instruction, the computerized formative assessment should be administered at least once or more at the beginning of the school year (e.g., Gersten et al., 2005; Seo and Bryant, 2012). If, however, the teacher wants to measure students’ progress toward acquiring specific skills in mathematics as they move from one unit to another (e.g., Stecker and Fuchs, 2000; Moors et al., 2010), then the computerized formative assessment could be administered multiple times (e.g., weekly or bi-monthly) over a longer period.
To date, many researchers have provided practical recommendations regarding the timing and frequency of computerized assessments using both empirical and simulated data (e.g., Gersten et al., 2005; Mellard et al., 2009; Moors et al., 2010). Within the context of progress monitoring, the most common view among school-based professionals and researchers is that frequent testing is essential for maximizing the precision of academic growth estimates from progress monitoring data while minimizing the influence of measurement error involved in each test administration (e.g., Mellard et al., 2009; Christ et al., 2012). However, this view fails to consider the effect of testing on the individual student (i.e., testing fatigue or burn-out) and the effect of the broader educational context (e.g., missing instructional time or wasted resources). Also, many researchers have noted the lack of consensus on the optimal number of test administrations or the testing frequency that should be used with computerized formative assessments (e.g., Nelson et al., 2017; January et al., 2018, 2019; Van Norman and Ysseldyke, 2020). This is due, at least in part, to the fact that the optimal number and frequency of test administrations depends on many factors such as grade level, subject (e.g., reading or mathematics), the type of computerized assessment (e.g., adaptive or non-adaptive assessment), and individual students’ response to instruction.
Current Study
As January et al. (2019) noted, teachers should use the data from computerized formative assessments to monitor students individually and make informed decisions for each student, not for groups of students. To achieve this goal, teachers must balance the time and resources associated with data collection. Therefore, it is crucial to provide teachers with systematic guidance on finding an optimal testing schedule based on each student’s progress. It may also be beneficial to automate the process as much as possible to minimize the time and expertise that is required to make good decisions from the formative assessment data.
With the increased availability of big data in education, advanced data analytic approaches offer promising solutions to the daunting task of individualizing student formative assessment schedules in meaningful ways (Dede, 2016; Fischer et al., 2020). IRSs are an example of advanced data analytic approaches, which use all of the available data to produce optimal recommendations for users. In this study, we aim to demonstrate the utility of IRSs for generating individualized testing schedules for students who complete computerized formative assessments. Using real data from a large sample of students in grades 2 and 4 who completed the Star Math assessment across the 2017–2018 school year, we developed an IRS and evaluated its performance in establishing a balance between data quality and testing frequency. The goals of the proposed IRS are: (1) to optimize the number of test administrations to produce accurate growth estimates; (2) to reduce the number of test administrations by eliminating uninformative test administrations; and (3) to create a personalized test schedule with the optimal timing of test administrations. The following research questions guided the study:
(1) To what extent does the IRS minimize the number of test administrations, without sacrificing the accuracy of growth estimates?
(2) Does the IRS produce robust recommendations for students with abnormal growth patterns (e.g., non-linear increase/decrease, flat growth trajectory)?
(3) Does the performance of the IRS depend on grade level?
Materials and Methods
Sample
The sample of this study consisted of students in grade 2 (n = 355,078) and grade 4 (n = 390,336) in the United States who participated in a number of Star Math assessments during the 2017–2018 school year. The number and frequency of test administrations varied by students because the teachers in the participating elementary schools independently determined the test schedule for their students. For both grade levels, the number of Star Math administrations ranged from four to twenty across the sample (Grade 2: M = 6.5, SD = 2.7; Grade 4: M = 6.4, SD = 2.6). To build the IRS, the total sample for each grade level was divided into two random samples: training and test. The training set was implemented to build up the IRS based on the existing data with students’ test scores and test administration dates, while the test set was used to validate and evaluate the IRS. The grade 2 training sample included 159,999 of the students and the remaining 195,079 students were included in the test sample. For grade 4, the training sample included 173,433 students while the test sample included the remaining 216,903 students.
Instrument
Star Math is a fully adaptive, computerized assessment developed by Renaissance (2018) for assessing the mathematical abilities of students in grades K–12. As a periodic progress-monitoring assessment, it provides teachers with consistent estimates of students’ mathematical levels based on the instruction provided in the classroom throughout the school year. It was developed to measure four broad domains of mathematics: (a) numbers and operations; (b) algebra; (c) geometry and measurement; and (d) data analysis, statistics, and probability. To ensure that specific skills are assessed to best inform targeted instruction, more than 790 individual skills are included within one of the four broad domains. The inclusion of a wide range of mathematical skills allows Star Math to be administered to students from kindergarten to grade 12 (Renaissance, 2018).
Star Math items follow the multiple-choice format with four response options, although some items may have two or three response options depending on the skill being measured. This study utilized two versions of Star Math (comprehensive and brief) for assessing K–12 students’ mathematical abilities. The comprehensive version is a 34-item CAT, with an average administration time of less than 25 min. The brief version is a 24-item CAT, with the average administration time of less than 14 min. Both versions of Star Math are aligned to state and national curriculum standards and thus provide estimates of students’ mathematics achievement relative to national norms. Also, both versions of Star Math report students’ scaled scores using the same score scale, ranging from 600 to 1400. For the comprehensive version, empirical reliability estimates based on IRT are 0.91 and 0.92; split-half reliability estimates are 0.90 and 0.91, for Grades 2 and 4, respectively. For the brief version, empirical reliability estimates based on IRT are 0.85 and 0.87; split-half reliability estimates are 0.87 and 0.89, for Grades 2 and 4, respectively. Furthermore, meta-analytic analyses of Star Math Correlations with other mathematics tests are 0.63 and 0.76, for Grades 2 and 4, respectively. These correlations provide evidence supporting the concurrent and predictive validity of Star Math scores (Renaissance, 2018).
Data Analysis
Data Preprocessing
Before building the IRS, we performed several steps of data preprocessing to prepare the raw data. First, we used the training dataset for each grade level to quantify students’ academic growth in mathematics during the 2017–2018 school year. To estimate students’ growth (i.e., slopes), we used the Theil-Sen estimation method (Vannest et al., 2012). The Theil-Sen estimator is similar to traditional regression approaches (e.g., ordinary least-squares) but it provides more accurate estimates of growth in the presence of outliers – which is typically the case in progress monitoring data (Bulut and Cormier, 2018). The first step of the Theil-Sen estimation method is to calculate all possible slopes for a given student using the following formula:
where StarMathScoreTime 1 and StarMathScoreTime 2 are the student’s Star Math scores from two Time 1 test administrations, DateTime 1 and DateTime 2 are the dates that the test administrations occurred, and Slope is the growth estimated based on the average daily change between the two scores. The second step of the Theil-Sen estimation is to find the median value of all the slopes calculated in the first step as the best estimate of student growth.
Second, we used the growth estimates to identify students with optimal growth trajectories. These students were identified using a two-step selection process. First, the students whose Theil-Sen slope was larger than the median value of all slope estimates in the training dataset (0.275 for grade 2; 0.205 for grade 4) were selected. This group represents the students whose growth rates were better than the normative growth in the training dataset for each grade level. In the second step, we removed the students whose final Star Math scores were below the 25th percentile, which is often considered a cutoff for identifying students who are at-risk for difficulties in acquiring mathematics skills (e.g., Codding and Connell, 2008; Shapiro, 2011; Codding et al., 2017).
Building the Intelligent Recommender System
In this study, we aimed to develop an IRS that could provide individualized recommendations to optimize test administration schedules. To operationally define an optimal test administration schedule, we used two criteria. First, the optimal test administration schedule should produce a minimal number of assessments to reduce the instructional time that students are expected to miss while they are being assessed. Second, the optimal test schedule should maximize the score change between test administrations (i.e., academic growth), which reduces the likelihood of assessing students’ mathematical skills before they have had adequate time to show improvement. Therefore, the IRS was developed to find a balance between the number of test administrations required and the production of quality data to assess student growth in mathematics.
The first step of the development process focused on defining a reasonable test window based on two factors: the amount of time that it may take for students to demonstrate growth in mathematics and the practicality of the test window for teachers. A monthly testing window would likely be too lengthy because students who are struggling should be tested more frequently. On the other hand, a relatively shorter test window (i.e., weekly or daily) would not provide enough time for students to receive an adequate amount of instruction to acquire additional mathematical skills. Also, giving teachers a specific day or week for testing would may impose significant logistical challenges in practice. Therefore, we selected a bi-weekly test window as an optimal timeframe for the IRS.
We divided the training dataset into 19 test windows (each 15 days in length) from August 16, 2017 to May 31, 2018. There were, however, two exceptions. The number of tests taken at the end of December was extremely low due to school closures over the holidays. The other test window with low counts was the second half of March, which was due to school closures during spring break. To account for these breaks, the data collected in December and March were captured within a single window, reducing the total number of test windows to 17. The numbers of individual administrations of Star Math across the 17 test windows are displayed in Figure 1. This figure highlights the variability in testing that occurs throughout the school year.
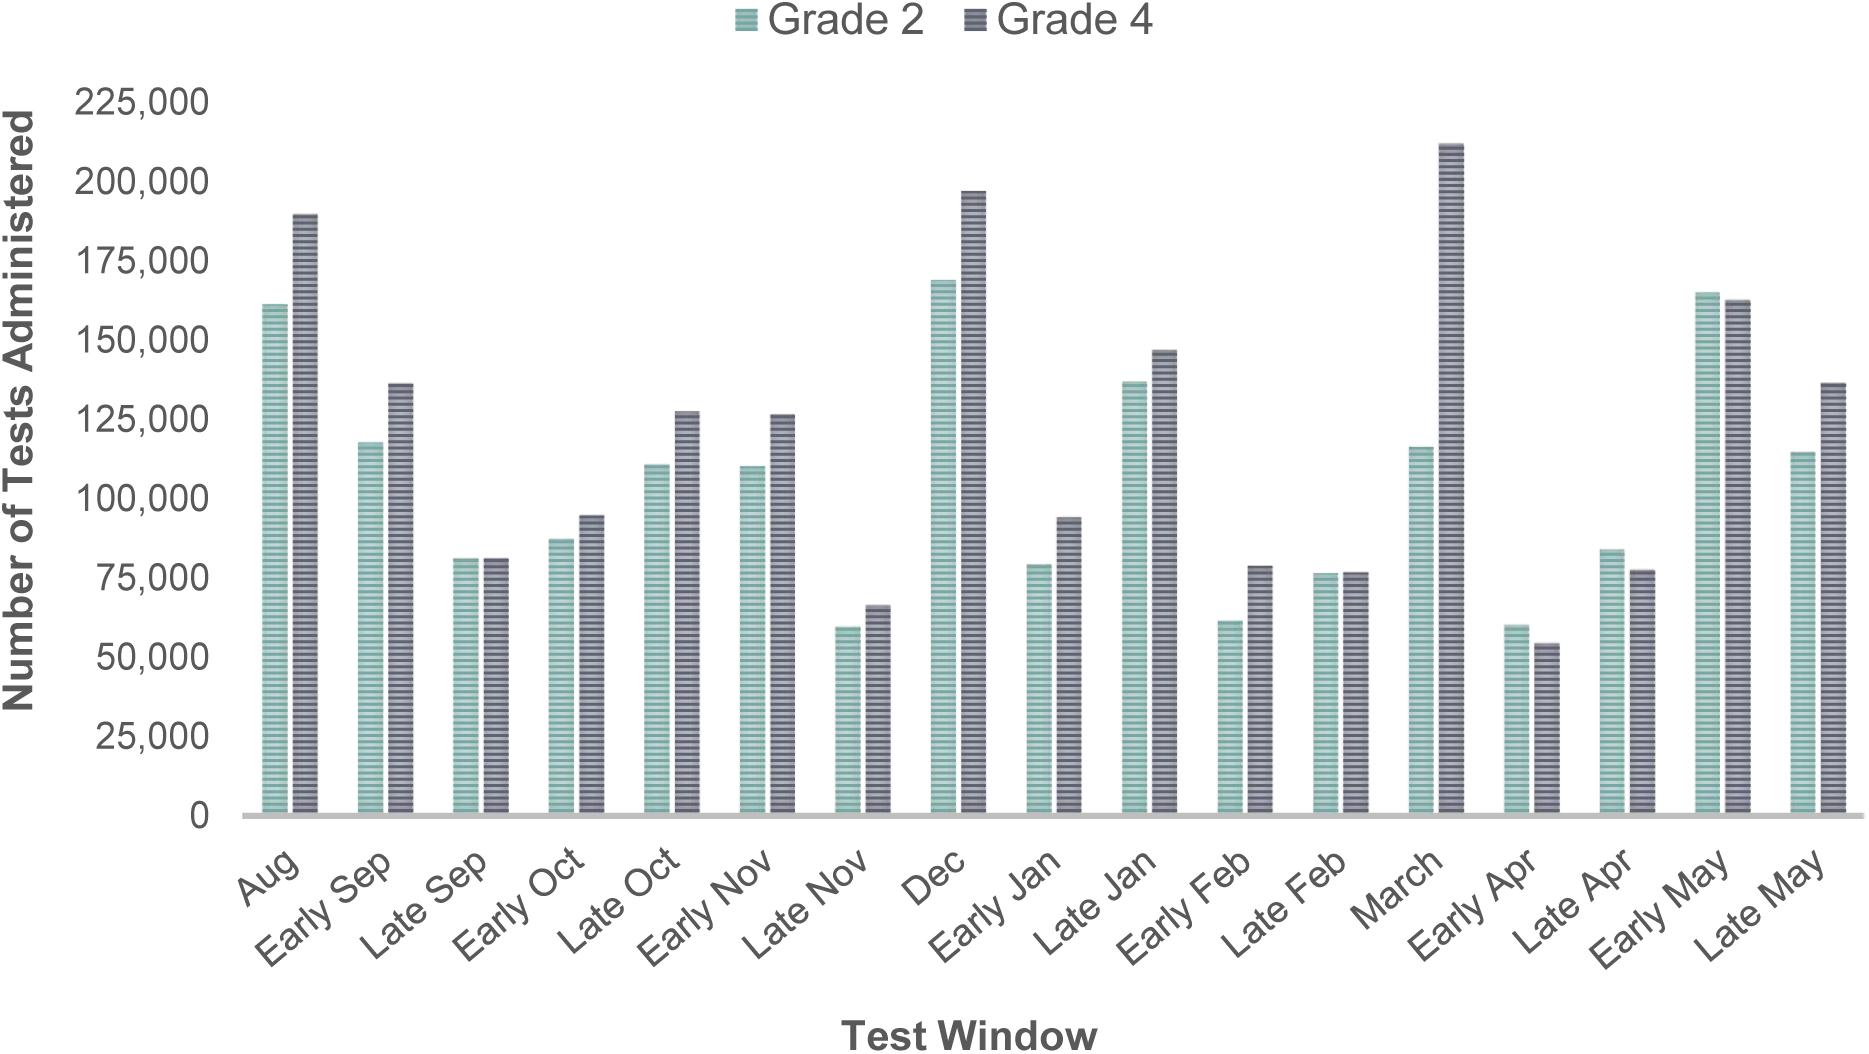
Figure 1. Number of test administrations within the training dataset by test window.
The second step of the system development process focused on the selection of an optimization algorithm for the IRS. After considering several conventional algorithms (e.g., collaborative filtering with cosine similarity), we opted to use Dijkstra’s Shortest Path First (SPF) algorithm with a priority queue (Dijkstra, 1959). The SPF is a greedy algorithm for solving single-source, shortest path problems (e.g., finding the shortest route to take from one city to another). We selected this algorithm because: (1) it takes the sequence of test administrations into account as it tries to find students who are similar in terms of their test administration patterns; (2) it has a lower computing requirement than other algorithms; and (3) it can be easily scaled up even if it is applied to millions of cases on a regular basis.
In this study, we used the SPF algorithm to search for the least number of test administrations that yields the maximum positive change in the Star Math scores across the test windows. First, we identified all possible routes between the test windows (e.g., August to early October, early September to early January, late September to early March). All of the routes found in the pathfinding process were unidirectional given the one-way direction of time. Second, we computed the distance between the test windows based on the magnitude of the positive score difference in the Star Math scores. The larger the positive score difference, the shorter the distance between the test windows. Figure 2 depicts the grade-level trends in Star Math scores across the 17 test windows. Although there was an increasing trend in the Star Math scores for both grade levels, the magnitude of change did not appear to be the same between the test windows. An increasing trend was, generally, observed for individual students in the training sample; however, some students exhibited more dramatic score changes between the test windows. The SPF algorithm was used to capture these variations at the student level to be able to recommend a reasonable test schedule to students who follow similar score patterns (i.e., growth trajectory).
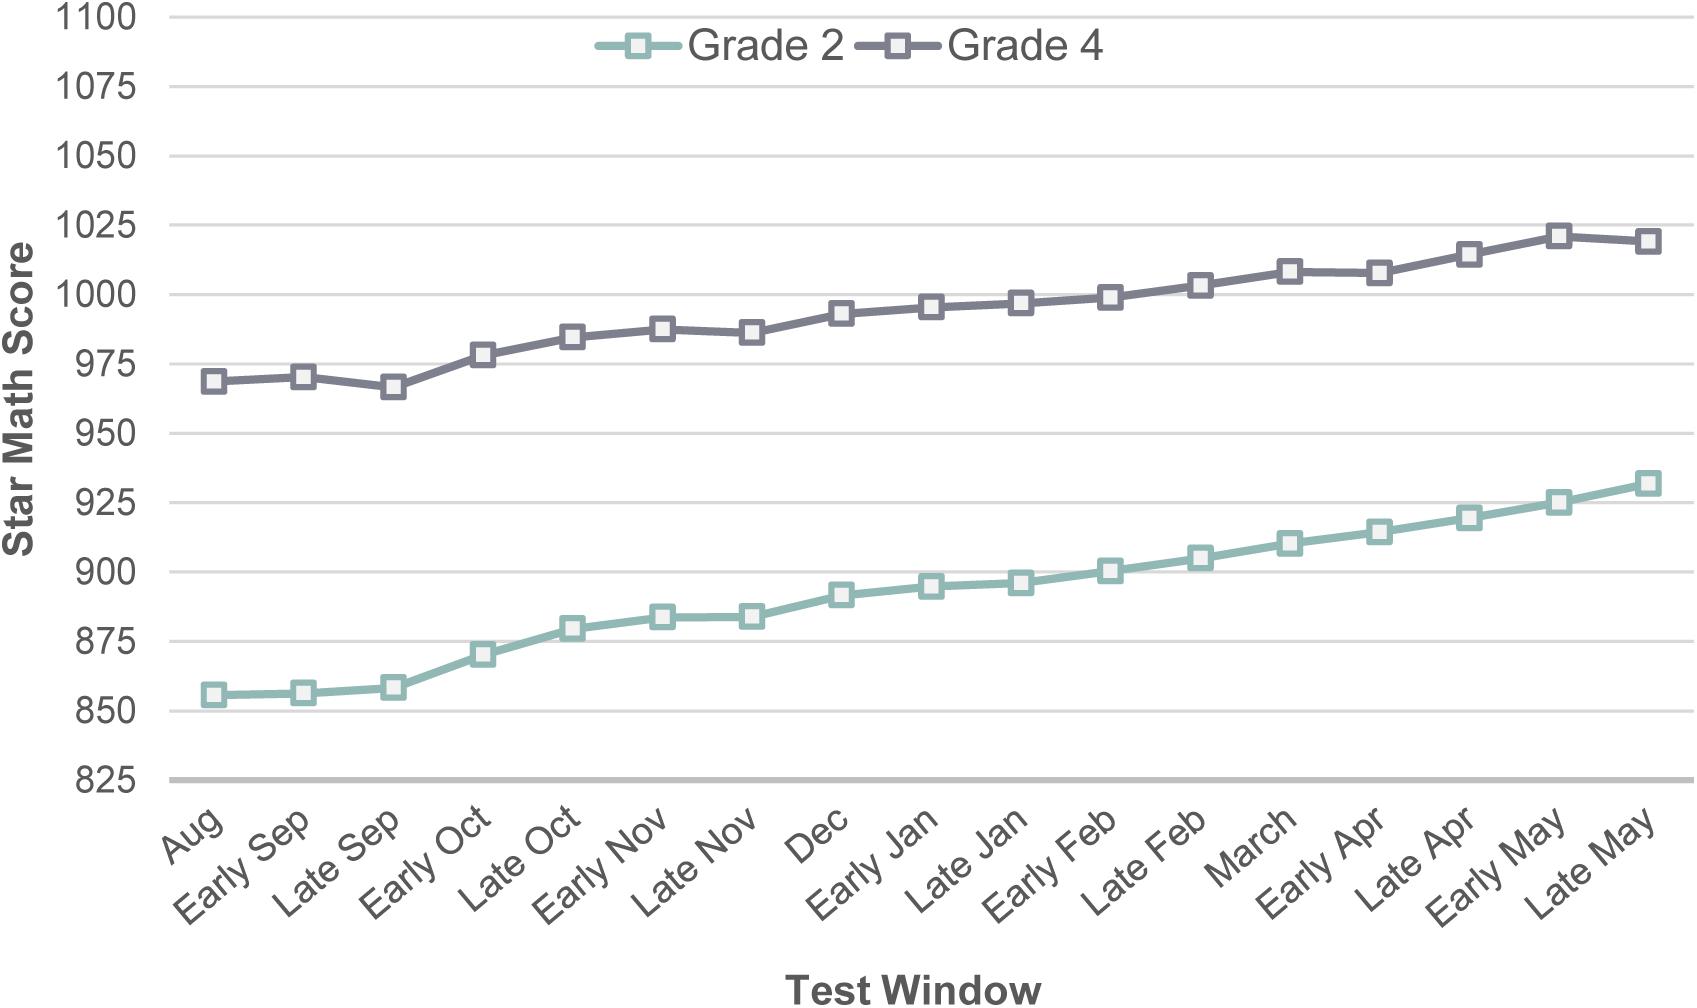
Figure 2. Average Star Math scores by test window.
Evaluating the Intelligent Recommender System
To evaluate the performance of the IRS, we first extracted all the possible routes (i.e., test administration schedules) that lead to optimal growth trajectories for the students in the training dataset. Then, we calculated the Euclidean distance to identify a list of students from the training dataset that are recommendable for the students in the test dataset. That is, we match the students from the training and test datasets who indicate similar growth trajectories. For each student, the IRS begins the process by considering the test window of the student’s first assessment and the slope estimated from the first two Star Math scores. Second, it finds the test schedules of students who appear to have a similar growth trajectory within the same test window. Finally, the test schedule that yields the largest, positive score change is recommended to the student. After each test administration, the system automatically determines whether the student should stay in the same recommendable schedule or switch to an alternative test schedule that better suits the student’s growth trajectory.
Using students’ existing scores in the test sample, we simulated a hypothetical scenario in which we explored which test administrations our IRS would recommend to the students. Furthermore, we used linear interpolation to extrapolate the missing scores for the test windows that the students did not take Star Math. Using the complete dataset, we tested whether the IRS would recommend a higher number of test administrations than standard practice (i.e., testing decisions being made by the teachers). The performance of the IRS was evaluated based on four criteria: (1) the average number of test administrations; (2) the magnitude of average positive score change; (3) the range of test administrations; and (4) the proportion of non-recommendable cases. All of the analyses were implemented using the Python programming language (Version 3.8; Python Software Foundation, 2019).
Results
A comparison between the performance of the IRS and standard practice are summarized in Table 1. Standard practice is essentially a summary of the assessment practices that are represented in the original dataset – the teachers were able to select the number of test administrations and the timing between test administration. For both grade levels, the IRS was able to reduce the number of test administrations, while also maximizing the positive score change between test administrations. The latter is important because it ensures that strong decisions can be made from the data that are collected over time. The results indicate that the IRS could reduce the number of tests administered to as few as four tests per student in grade 2 and three tests per student in grade 4. Previous research on decision-making using Star Math data suggests that based on standard practices followed by teachers, at least five tests should be administered to students for accurate decision-making (Bulut and Cormier, 2016). The results of this study, however, show that the IRS could generate test administration schedules with fewer tests, without sacrificing the accuracy of growth estimates. For both grade levels, the IRS could not generate a test administration schedule for less than 0.07% of the students.
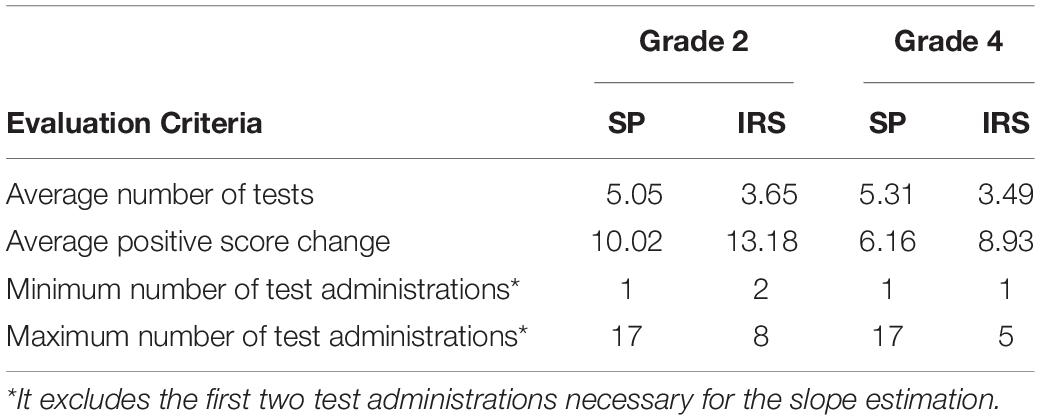
Table 1. Results of the intelligent recommender system (IRS) compared to standard practice (SP).
Figure 3 demonstrates two students with very different growth trajectories in Grade 2 based on their Star Math scores. In the test dataset, the first student (top panel) was assessed in 18 times and the second student (bottom panel) was assessed 14 times over the course of the academic year. The dashed, regression lines show the students’ growth trajectories based on their scores in Star Math. Although both students show a linearly increasing trajectory, the magnitude of growth appears to be larger for the second student (bottom panel). The points with green shadowing represent the test administrations recommended by the IRS. Based on the recommended tests, the total number of test administrations would reduce to four for both students. Also, the positive score change per test would increase from 6.38 to 28 for the first student, and from 0.9 to 18.07 for the second student.
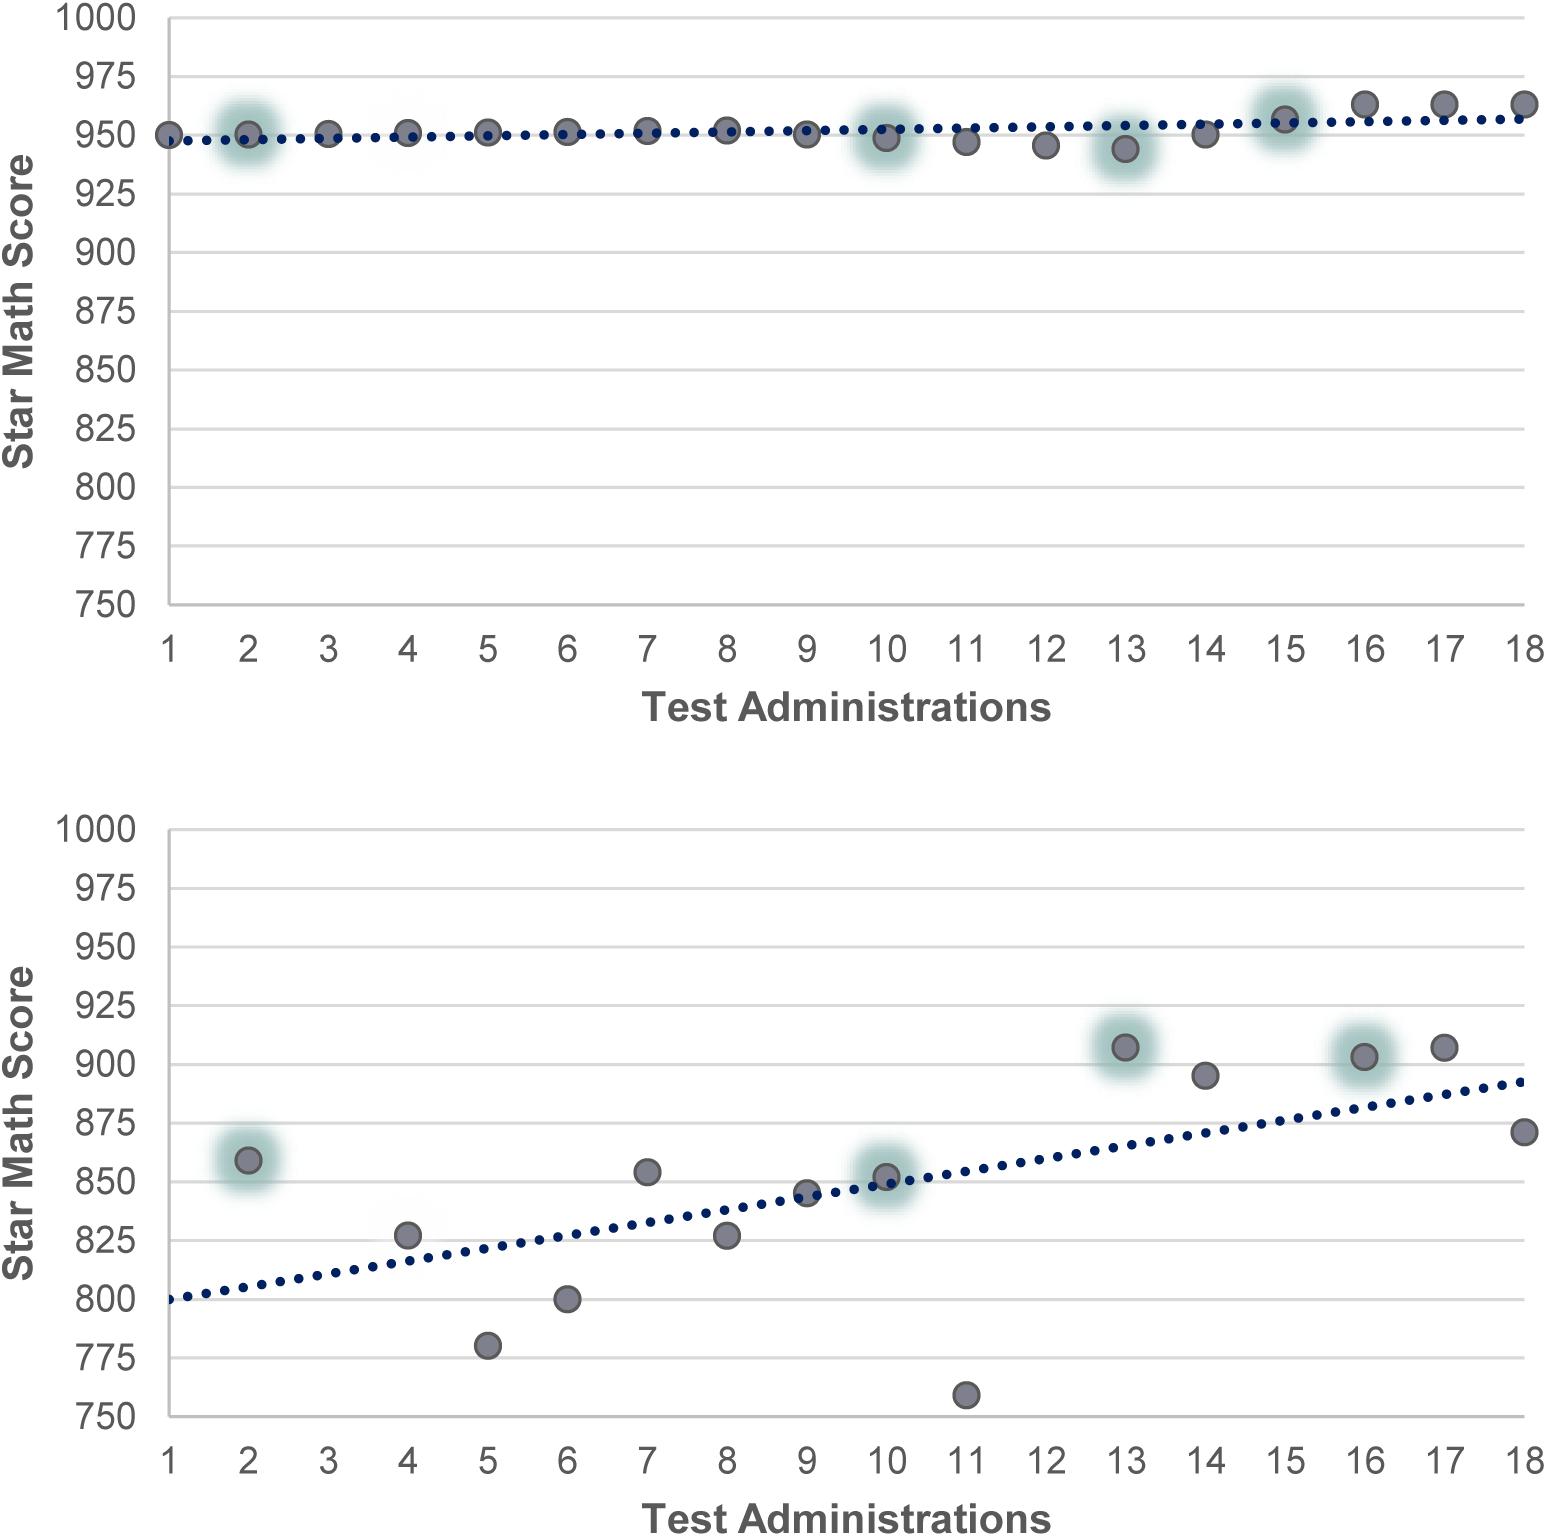
Figure 3. Original and recommended test administrations for two students in grade 2.
In addition to the overall results for the test sample, we also wanted to further examine the performance of the IRS for individual students. Upon closer inspection, it appears that the system was able to either reduce the number of test administrations or maintain the same number of test administrations for a large proportion of students (see Figure 4). However, there was a small proportion of students (3% for grade 2; 5% for grade 4) who required more tests than the number of tests that were originally recommended by standard practices. It is possible that these students showed uncommon patterns of performance on multiple assessments, which made it difficult for the IRS to optimize their testing schedules. It is also possible that these students were not tested enough based on standard practices.
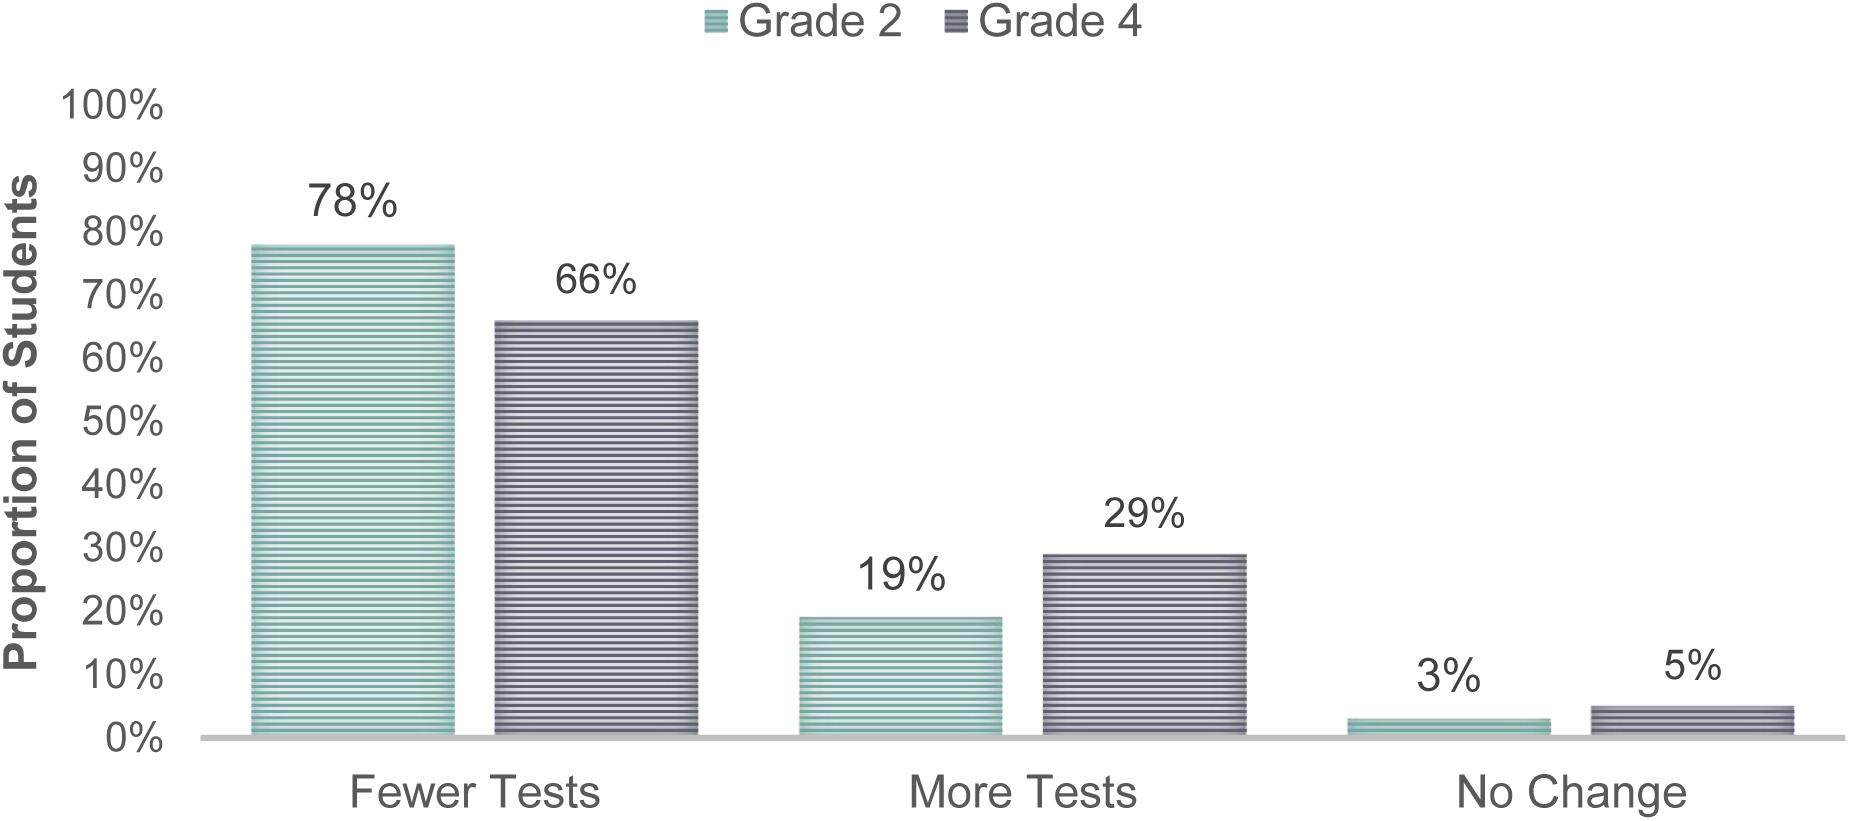
Figure 4. Percentage of the students with changes to the recommended number of tests to be administered based on the IRS.
Discussion and Conclusion
The IRS produced from this study is the first of its kind within the context of computerized formative assessments. Historically, the assessment of progress toward learning goals has relied on large-scale national or local data (Shapiro, 2008; Koehler-Hak, 2014). Regardless of the scope, these data were generally summarized by producing grade-based norms that would serve as an expectation for academic growth in key curricular areas (e.g., mathematics). Individual student performance would be compared to these general growth trends to determine whether adequate growth was being made. Over time, more nuanced approaches to evaluating student growth were developed. For example, student growth percentiles are used to better capture some of the individual differences in the mastery of curricular content as students are assessed throughout the school year (Renaissance, 2018). Although the general trend was to develop norms that are more sensitive to individual differences, there had yet to be a methodology that allowed the determination of an appropriate test schedule to be completely individualized. The IRS developed in this study appears to meet this critical need. As an advanced method for exploiting big data, the IRS can accurately predict when data-driven actions, such as test administration decisions, should be taken for individual students. This is a good example of using big data for extracting actionable knowledge in education (Fischer et al., 2020).
The significant reduction in the number of test administrations, as well as the overall increase in test scores between test administrations, highlights the advantages of employing data analytics to optimize computerized formative assessment practices. Although data-driven decision making is central to many of the practices in schools (e.g., Ysseldyke et al., 2006), the use of data analytics had yet to be incorporated into this process. Reducing or even eliminating the need for educators to make tedious decisions, such as test administration schedules, seems to be an ideal application for data science within education. This may be especially true if a system, such as the IRS, is able to optimize a testing schedule on-the-fly throughout the school year, while maximizing the quality of the data that are produced from the computerized formative assessment.
In a previous study with Star Math, Nelson et al. (2017) found that student-level growth estimates are likely to differ depending on the test administration schedules used for data collection (e.g., pre-post testing or monthly testing). The authors argue that the variation in growth estimates could lead to different instructional decisions about students (e.g., increasing or decreasing intensive supports). The results of this study are in line with those reported by Nelson et al. (2017), with regard to the advantages of periodic test administrations over intensive data collection. Our findings suggest that a one-size-fits-all testing procedure (e.g., monthly testing for all students) could result in a rigid test schedule that overlooks students’ level of progress. Therefore, a more flexible approach is necessary for creating test administration schedules tailored to student needs. The individualization of test administration schedules for computerized formative assessments dovetails well with the practice of delivering differentiated or personalized instruction. In other words, it allows assessment to move toward a more student-centered approach.
A recommender system would not be useful if it were not able to produce robust and scalable recommendations for almost every student that takes a computerized formative assessment. In the rare cases where the IRS was unable to produce a reasonable test schedule, these students would likely be re-tested relatively soon to ensure that the data collected were an accurate representation of their skills. Although it was not possible to test this process within the current study, it is likely that some of these rare cases would be eliminated with re-testing only a few weeks later. The outcomes of this re-testing could be the focus of additional studies on recommender systems to further strengthen their ability to produce testing schedules for all students.
It appears that the IRS that was developed for the Star Math assessments was able to produce similar results across two grade levels. Although the general positive trajectories may appear similar, the amount of growth that is expected between these grade levels is somewhat different. The differences in growth are demonstrated in the comparison between the average score growth in Figure 1. Despite the differences in growth for the two grade levels (i.e., grades 2 and 4), the IRS was still able to decrease the number of test administrations and increase the positive score change between test administrations. This finding suggests that the IRS could be applied to the full range of grade levels. Future research should consider the possibility of examining differences between grade levels and whether further adjustments would need to be made to the IRS to account for some of the variability in the growth trajectories between grade levels.
A core feature of the IRS is that it reduces the additional load placed on school-based professionals by automating the generation of an optimized formative assessment schedule. Some may be concerned that the professional judgment of teachers is being replaced by a computer. This is in fact not the case – even if this system were implemented in schools, a teacher could still choose to administer a test to a particular student at any point in the school year. The system would simply use this additional information to make a recommendation about the next testing window. To validate the effectiveness of the IRS in practice, the views of teachers on the use of the IRS should be considered after the system has been successfully implemented. It should also be noted that the decisions to refer a student for additional services (e.g., academic interventions) or to provide them with supplemental instruction in the classroom is still retained by school-based professionals such as classroom teachers, resource teachers, school psychologists, and school administrators. As such, a system like the IRS should be well-received by teachers and other school-based professionals, as it relieves them of the complex task of optimizing formative assessment schedules and allows them to focus their time and efforts on other important decisions. Moreover, the use of the IRS would ensure that the best data possible are collected in the process to inform these decisions.
Finally, the results of this study reveal significant trends regarding how teacher use student data from computerized formative assessments. First, our findings indicate that teachers are likely to follow a frequent testing approach to gauge student learning and identify students with additional needs, despite not observing significant score changes between subsequent test administrations. Future research should investigate the internal and external factors (e.g., lack of testing guidelines, logistical challenges in school, and attitudes toward testing) that motivate teachers to employ frequent testing in their classrooms. Second, student data collected through computerized formative assessments allow teachers to identify learning gaps and address them during their instruction. Therefore, some teachers might utilize computerized formative assesments to receive immediate feedback on their instruction. A further study focusing on how teachers incorporate feedback from computerized formative assessments into their instructional practices is suggested. Lastly, in this study we assume that teachers are the ultimate decision makers when determining how frequently students should be tested. The What Works Clearinghouse guidelines for using student achievement data suggest that students be given the opportunity to examine their own data and get involved in setting their learning goals (Hamilton et al., 2009). Following this recommendation, teachers could share the data from computerized formative assessments with their students, help students understand their progress, and jointly determine the time of the next test administration. Further experiments, involving students in the decision-making process, could shed more light on the effectiveness of personalized test administration scheduling.
Data Availability Statement
The data analyzed in this study was obtained from Renaissance, Inc., the following restrictions apply: all data is solely owned and licensed by Renaissance, Inc. and thus it cannot be discussed or shared by the researchers in any form or format. Requests to access these datasets should be directed to Erick Stickney,ZXJpYy5zdGlja25leUByZW5haXNzYW5jZS5jb20=.
Author Contributions
OB and DC jointly developed the intelligent recommender system for generating personalized test administration schedules and completed the manuscript write-up together. OB was primarily responsible for designing the intelligent recommender system and planned the studies for evaluating the performance of the system. JS played a key role in the programming phase of the intelligent recommender system, also assisted with data analysis, and summarizing the findings. All authors contributed to the article and approved the submitted version.
Conflict of Interest
OB and DC were paid consultants for Renaissance, Inc. during the design and implementation of the project that resulted in this manuscript.
The remaining author declares that the research was conducted in the absence of any commercial or financial relationships that could be construed as a potential conflict of interest.
References
Bennett, R. E. (2010). “Technology for large-scale assessment,” in International Encyclopedia of Education, 3rd Edn, Vol. 8, eds P. Peterson, E. Baker, and B. McGaw (Oxford: Elsevier), 48–55. doi: 10.1016/b978-0-08-044894-7.00701-6
Black, P., and Wiliam, D. (2009). Developing the theory of formative assessment. Educ. Assess. Eval. Acc. 21, 5–31. doi: 10.1007/s11092-008-9068-5
Boyle, A., and Hutchinson, D. (2009). Sophisticated tasks in e-assessment: what are they and what are their benefits? Assess. Eval. High. Educ. 34, 305–319. doi: 10.1080/02602930801956034
Bridgeman, B. (2009). “Experiences from large-scale computer-based testing in the USA,” in The Transition to computer-Based Assessment, eds F. Scheuermann and J. Björnsson (Luxembourg: Office for Official Publications of the European Communities), 39–44.
Bryant, W. (2017). Developing a strategy for using technology-enhanced items in large-scale standardized tests. Pract. Assess. Res. Eval. 22:1. doi: 10.7275/70yb-dj34
Bulut, O., and Cormier, D. C. (2016). Developing Psychometrically Sound Decision Rules for STAR Math. Wisconsin Rapids, WI: Renaissance Inc.
Bulut, O., and Cormier, D. C. (2018). Validity evidence for progress monitoring with star reading: slope estimates, administration frequency, and number of data points. Front. Educ. 3:68. doi: 10.3389/feduc.2018.00068
Bulut, O., Cutumisu, M., Aquilina, A. M., and Singh, D. (2019). Effects of digital score reporting and feedback on students’ learning in higher education. Front. Educ. 4:65. doi: 10.3389/feduc.2019.00065
Bunderson, V. C., Inouye, D. K., and Olsen, J. B. (1989). “The four generations of computerized educational measurement,” in Educational Measurement, 3rd Edn, ed. R. L. Linn (New York, NY: Macmillan), 367–407.
Christ, T. J., Zopluoǧlu, C., Long, J. D., and Monaghen, B. D. (2012). Curriculum-based measurement of oral reading: quality of progress monitoring outcomes. Except. Child. 78, 356–373. doi: 10.1177/001440291207800306
Codding, R. S., and Connell, J. E. (2008). “Preparing educators to use curriculum-based measurement,” in Handbook on Data-Based Decision Making in Education, eds T. J. Kowalski and T. J. Lasley (New York, NY: Routledge), 136–152.
Codding, R. S., Volpe, R. J., and Poncy, B. C. (2017). Effective Math Interventions, a Guide to Improving whole-number knowledge. New York, NY: Guilford Press.
Crane, E. W. (2008). Interim Assessment Practices and Avenues for State Involvement. Washington, DC: Council of Chief State School Officers.
Davey, T. (2005). “Computer-based testing,” in Encyclopedia of Statistics in Behavioral Science, eds B. S. Everitt and D. Howell (West Sussex: Wiley). doi: 10.1002/0470013192.bsa040
Dede, C. (2016). Next steps for “big data” in education: utilizing data-intensive research. Educ. Technol. 2, 37–42.
Dijkstra, E. W. (1959). A note on two problems in connexion with graphs. Numer. Math. 1, 269–271. doi: 10.1007/BF01386390
Fischer, C., Pardos, Z. A., Baker, R. S., Williams, J. J., Smyth, P., Yu, R., et al. (2020). Mining big data in education: affordances and challenges. Rev. Res. Educ. 44, 130–160. doi: 10.3102/0091732X20903304
Gersten, R., Jordan, N. C., and Flojo, J. R. (2005). Early identification and interventions for students with mathematics difficulties. J. Learn. Disabil. 38, 293–304. doi: 10.1177/00222194050380040301
Gierl, M. J., Bulut, O., Guo, Q., and Zhang, X. (2017). Developing, analyzing, and using distractors for multiple-choice tests in education: a comprehensive review. Rev. Educ. Res. 87, 1082–1116. doi: 10.3102/0034654317726529
Gierl, M. J., Bulut, O., and Zhang, X. (2018). “Using computerized formative testing to support personalized learning in higher education: An application of two assessment technologies,” in Digital Technologies and Instructional Design for Personalized Learning, ed. R. Zheng (Hershey, PA: IGI Global), 99–119. doi: 10.4018/978-1-5225-3940-7.ch005
Hamilton, L., Halverson, R., Jackson, S. S., Mandinach, E., Supovitz, J. A., and Wayman, J. C. (2009). Using Student Achievement Data to Support Instructional Decision Making. IES Practice Guide. NCEE 2009-4067. National Center for Education Evaluation and Regional Assistance. Available online at: https://ies.ed.gov/ncee/wwc/Docs/PracticeGuide/dddm_pg_092909.pdf (accessed August 10, 2020).
Hattie, J., and Timperley, H. (2007). The power of feedback. Rev. Educ. Res. 77, 81–112. doi: 10.3102/003465430298487
January, S.-A. A., Van Norman, E. R., Christ, T. J., Ardoin, S. P., Eckert, T. L., and White, M. J. (2018). Progress monitoring in reading: comparison of weekly, bimonthly, and monthly assessments for students at risk for reading difficulties in grades 2-4. Sch. Psychol. Rev. 47, 83–94. doi: 10.17105/SPR-2017-0009.V47-1
January, S.-A. A., Van Norman, E. R., Christ, T. J., Ardoin, S. P., Eckert, T. L., and White, M. J. (2019). Evaluation of schedule frequency and density when monitoring progress with curriculum-based measurement. Sch. Psychol. 34, 119–127. doi: 10.1037/spq0000274
Koehler-Hak, K. M. (2014). Measurement of educational progress in the context of local demographics: using general outcome measurement as a basis for the development and use of local norms. Prevent. Sch. Fail. Altern. Edu. Child. Youth 58, 50–57. doi: 10.1080/1045988X.2012.760511
Kroehne, U., and Goldhammer, F. (2018). How to conceptualize, represent, and analyze log data from technology-based assessments? A generic framework and an application to questionnaire items. Behaviormetrika 45, 527–563. doi: 10.1007/s41237-018-0063-y
Lee, Y., and Jia, Y. (2014). Using response time to investigate students’ test-taking behaviors in a NAEP computer-based study. Large Scale Assess. Educ. 2:8. doi: 10.1186/s40536-014-0008-1
Luecht, R. M., and Sireci, S. G. (2011). A Review of Models for Computer-Based Testing. Research Report 2011-12. New York, NY: College Board.
Maier, U., Wolf, N., and Randler, C. (2016). Effects of a computer-assisted formative assessment intervention based on multiple-tier diagnostic items and different feedback types. Comput. Educ. 95, 85–98. doi: 10.1016/j.compedu.2015.12.002
McManus, S. (2008). Attributes of Effective Formative Assessment. Washington, DC: Council for Chief State School Officers.
Mellard, D. F., McKnight, M., and Woods, K. (2009). Response to intervention screening and progress-monitoring practices in 41 local schools. Learn. Disabil. Res. Pract. 24, 186–195. doi: 10.1111/j.1540-5826.2009.00292.x
Moors, A., Weisenburgh-Snyder, A., and Robbins, J. (2010). Integrating frequency-based mathematics instruction with a multi-level assessment system to enhance response to intervention frameworks. Behav. Analyst Today 11, 226–244. doi: 10.1037/h0100703
Nelson, P. M., Van Norman, E. R., Klingbeil, D. A., and Parker, D. C. (2017). Progress monitoring with computer adaptive assessments: the impact of data collection schedule on growth estimates. Psychol. Sch. 54, 463–471. doi: 10.1002/pits.22015
Parshall, C. G., Harmes, J. C., Davey, T., and Pashley, P. (2010). “Innovative items for computerized testing,” in Computerized Adaptive Testing: Theory and Practice, 2nd. Edn, eds W. J. van der Linden and C. A. W. Glas (Norwell, MA: Kluwer Academic Publishers). doi: 10.1007/978-0-387-85461-8_11
Python Software Foundation (2019). Python Language Reference (Version 3.8) [Computer Software]. Available online at: http://www.python.org (accessed November 15, 2019).
Redecker, C., and Johannessen, Ø (2013). Changing assessment —Towards a new assessment paradigm using ICT. Eur. J. Educ. 48, 79–96. doi: 10.1111/ejed.12018
Renaissance (2018). Star AssessmentsTM for Math Technical Manual. Wisconsin Rapids, WI: Renaissance.
Russell, M. K. (2010). “Technology-aided formative assessment of learning: new developments and applications,” in Handbook of Formative Assessment, eds H. L. Andrade and G. J. Cizek (New York, NY: Routledge), 125–138.
Schildkamp, K. (2019). Data-based decision-making for school improvement: research insights and gaps. Educ. Res. 61, 257–273. doi: 10.1080/00131881.2019.1625716
Schildkamp, K., and Kuiper, W. (2010). Data-informed curriculum reform: which data, what purposes, and promoting and hindering factors. Teach. Teach. Educ. 26, 482–496. doi: 10.1016/j.tate.2009.06.007
Scriven, M. (1967). “The methodology of evaluation,” in Perspectives of Curriculum Evaluation, Vol. 1, eds R. W. Tyler, R. M. Gagné, and M. Scriven (Chicago, IL: Rand McNally), 39–83.
Seo, Y.-J., and Bryant, D. (2012). Multimedia CAI program for students with mathematics difficulties. Remed. Spec. Educ. 33, 217–225. doi: 10.1177/0741932510383322
Shapiro, E. S. (2008). “Best practices in setting progress monitoring goals for academic skill improvement,” in Best Practices in School Psychology, eds A. Thomas and J. Grimes (Washington, DC: National Association of School Psychologists), 141–157.
Shapiro, E. S. (2011). Academic Skills Problems: Direct Assessment and Intervention. New York, NY: Guilford Press.
Sharkey, N. S., and Murnane, R. J. (2006). Tough choices in designing a formative assessment system. Am. J. Educ. 112, 572–588. doi: 10.1086/505060
Shinn, M. R. (2008). “Best practices in using curriculum-based measurement in a problem-solving model,” in Best Practices in School Psychology, eds A. Thomas and J. Grimes (Bethesda, MD: National Association of School Psychologists), 243–262.
Stecker, P. M., and Fuchs, L. S. (2000). Effecting superior achievement using curriculum-based measurement: the importance of individual progress monitoring. Learn. Disabi. Res. Pract. 15, 128–134. doi: 10.1207/SLDRP1503_2
Straetmans, G., and Eggen, T. J. H. M. (1998). Computerized adaptive testing: what it is and how it works. Educ. Technol. 38, 45–52.
Thornblad, S. C., and Christ, T. J. (2014). Curriculum-based measurement of reading: is 6 weeks of daily progress monitoring enough? School Psych. Rev. 43, 19–29. doi: 10.1080/02796015.2014.12087451
Tomasik, M. J., Berger, S., and Moser, U. (2018). On the development of a computer-based tool for formative student assessment: epistemological, methodological, and practical issues. Front. Psychol. 9:2245. doi: 10.3389/fpsyg.2018.02245
van der Kleij, F. M., Eggen, T. J. H. M., Timmers, C. F., and Veldkamp, B. P. (2012). Effects of feedback in a computer-based assessment for learning. Comput. Educ. 58, 263–272. doi: 10.1016/j.compedu.2011.07.020
Van Norman, E. R., Nelson, P. M., Shin, J. E., and Christ, T. J. (2013). An evaluation of the effects of graphic aids in improving decision accuracy in a continuous treatment design. J. Behav. Educ. 22, 283–301. doi: 10.1007/s10864-013-9176-2
Van Norman, E. R., and Ysseldyke, J. E. (2020). The impact of data collection frequency and trend estimation method on the consistency of growth estimates from two computer-adaptive tests. Sch. Psychol. Rev. 49, 20–30. doi: 10.1080/2372966X.2020.1716634
Vanlommel, K., Van Gasse, R., Vanhoof, J., and Van Petegem, P. (2017). Teachers’ decision-making: Data based or intuition driven? Intern. J. Educ. Res. 83, 75–83. doi: 10.1016/j.ijer.2017.02.013
Vannest, K. J., Parker, R. I., Davis, J. L., Soares, D. A., and Smith, S. L. (2012). The Theil-Sen slope for high-stakes decisions from progress monitoring. Behav. Disord. 37, 271–280. doi: 10.1177/019874291203700406
Way, W. D., and Robin, F. (2016). “The history of computer-based testing,” in Educational Measurement: from Foundations to Future, eds C. S. Wells and M. Faulkner-Bond (New York, NY: The Guilford Press), 185–207.
Webb, M., Gibson, D., and Forkosh-Baruch, A. (2013). Challenges for information technology supporting educational assessment. J. Comput. Assist. Learn. 29, 451–462. doi: 10.1111/jcal.12033
Weiss, D. J., and Kingsbury, G. G. (1984). Application of computerized adaptive testing to educational problems. J. Educ. Measur. 21, 361–375. doi: 10.1111/j.1745-3984.1984.tb01040.x
Weiss, D. J., and Von Minden, S. (2011). Measuring individual growth with conventional and adaptive tests. J. Methods Measur. Soc. Sci. 2, 80–101. doi: 10.2458/azu_jmmss_v2i2_weiss
Williamson, D. M., Xi, X., and Breyer, F. J. (2012). A framework for evaluation and use of automated scoring. Educ. Measur. Issues Pract. 31, 2–13. doi: 10.1111/j.1745-3992.2011.00223.x
Wise, S. L. (2014). The utility of adaptive testing in addressing the problem of unmotivated examinees. J. Comput. Adapt. Test. 2, 1–17. doi: 10.7333/1401-0201001
Wise, S. L., and Kong, X. (2005). Response time effort: a new measure of examinee motivation in computer-based tests. Appl. Measur. Educ. 18, 163–183. doi: 10.1207/s15324818ame1802_2
Keywords: recommender system, formative assessment, personalized learning, progress monitoring, mathematics
Citation: Bulut O, Cormier DC and Shin J (2020) An Intelligent Recommender System for Personalized Test Administration Scheduling With Computerized Formative Assessments. Front. Educ. 5:572612. doi: 10.3389/feduc.2020.572612
Received: 15 June 2020; Accepted: 04 September 2020;
Published: 23 September 2020.
Edited by:
Kasia Muldner, Carleton University, CanadaReviewed by:
Wei Shin Leong, Ministry of Education (Singapore), SingaporeApril Lynne Zenisky, University of Massachusetts Amherst, United States
Copyright © 2020 Bulut, Cormier and Shin. This is an open-access article distributed under the terms of the Creative Commons Attribution License (CC BY). The use, distribution or reproduction in other forums is permitted, provided the original author(s) and the copyright owner(s) are credited and that the original publication in this journal is cited, in accordance with accepted academic practice. No use, distribution or reproduction is permitted which does not comply with these terms.
*Correspondence: Okan Bulut, YnVsdXRAdWFsYmVydGEuY2E=