 Vivekanandan Kumar
 David Boulanger*
- School of Computing and Information Systems, Faculty of Science and Technology, Athabasca University, Edmonton, AB, Canada
Automated essay scoring (AES) is a compelling topic in Learning Analytics for the primary reason that recent advances in AI find it as a good testbed to explore artificial supplementation of human creativity. However, a vast swath of research tackles AES only holistically; few have even developed AES models at the rubric level, the very first layer of explanation underlying the prediction of holistic scores. Consequently, the AES black box has remained impenetrable. Although several algorithms from Explainable Artificial Intelligence have recently been published, no research has yet investigated the role that these explanation models can play in: (a) discovering the decision-making process that drives AES, (b) fine-tuning predictive models to improve generalizability and interpretability, and (c) providing personalized, formative, and fine-grained feedback to students during the writing process. Building on previous studies where models were trained to predict both the holistic and rubric scores of essays, using the Automated Student Assessment Prize’s essay datasets, this study focuses on predicting the quality of the writing style of Grade-7 essays and exposes the decision processes that lead to these predictions. In doing so, it evaluates the impact of deep learning (multi-layer perceptron neural networks) on the performance of AES. It has been found that the effect of deep learning can be best viewed when assessing the trustworthiness of explanation models. As more hidden layers were added to the neural network, the descriptive accuracy increased by about 10%. This study shows that faster (up to three orders of magnitude) SHAP implementations are as accurate as the slower model-agnostic one. It leverages the state-of-the-art in natural language processing, applying feature selection on a pool of 1592 linguistic indices that measure aspects of text cohesion, lexical diversity, lexical sophistication, and syntactic sophistication and complexity. In addition to the list of most globally important features, this study reports (a) a list of features that are important for a specific essay (locally), (b) a range of values for each feature that contribute to higher or lower rubric scores, and (c) a model that allows to quantify the impact of the implementation of formative feedback.
Background
Automated essay scoring (AES) is a compelling topic in Learning Analytics (LA) for the primary reason that recent advances in AI find it as a good testbed to explore artificial supplementation of human creativity. However, a vast swath of research tackles AES only holistically; only a few have even developed AES models at the rubric level, the very first layer of explanation underlying the prediction of holistic scores (Kumar et al., 2017; Taghipour, 2017; Kumar and Boulanger, 2020). None has attempted to explain the whole decision process of AES, from holistic scores to rubric scores and from rubric scores to writing feature modeling. Although several algorithms from XAI (explainable artificial intelligence) (Adadi and Berrada, 2018; Murdoch et al., 2019) have recently been published (e.g., LIME, SHAP) (Ribeiro et al., 2016; Lundberg and Lee, 2017), no research has yet investigated the role that these explanation models (trained on top of predictive models) can play in: (a) discovering the decision-making process that drives AES, (b) fine-tuning predictive models to improve generalizability and interpretability, and (c) providing teachers and students with personalized, formative, and fine-grained feedback during the writing process.
One of the key anticipated benefits of AES is the elimination of human bias such as rater fatigue, rater’s expertise, severity/leniency, scale shrinkage, stereotyping, Halo effect, rater drift, perception difference, and inconsistency (Taghipour, 2017). At its turn, AES may suffer from its own set of biases (e.g., imperfections in training data, spurious correlations, overrepresented minority groups), which has incited the research community to look for ways to make AES more transparent, accountable, fair, unbiased, and consequently trustworthy while remaining accurate. This required changing the perception that AES is merely a machine learning and feature engineering task (Madnani et al., 2017; Madnani and Cahill, 2018). Hence, researchers have advocated that AES should be seen as a shared task requiring several methodological design decisions along the way such as curriculum alignment, construction of training corpora, reliable scoring process, and rater performance evaluation, where the goal is to build and deploy fair and unbiased scoring models to be used in large-scale assessments and classroom settings (Rupp, 2018; West-Smith et al., 2018; Rupp et al., 2019). Unfortunately, although these measures are intended to design reliable and valid AES systems, they may still fail to build trust among users, keeping the AES black box impenetrable for teachers and students.
It has been previously recognized that divergence of opinion among human and machine graders has been only investigated superficially (Reinertsen, 2018). So far, researchers investigated the characteristics of essays through qualitative analyses which ended up rejected by AES systems (requiring a human to score them) (Reinertsen, 2018). Others strived to justify predicted scores by identifying essay segments that actually caused the predicted scores. In spite of the fact that these justifications hinted at and quantified the importance of these spatial cues, they did not provide any feedback as to how to improve those suboptimal essay segments (Mizumoto et al., 2019).
Related to this study and the work of Kumar and Boulanger (2020) is Revision Assistant, a commercial AES system developed by Turnitin (Woods et al., 2017; West-Smith et al., 2018), which in addition to predicting essays’ holistic scores provides formative, rubric-specific, and sentence-level feedback over multiple drafts of a student’s essay. The implementation of Revision Assistant moved away from the traditional approach to AES, which consists in using a limited set of features engineered by human experts representing only high-level characteristics of essays. Like this study, it rather opted for including a large number of low-level writing features, demonstrating that expert-designed features are not required to produce interpretable predictions. Revision Assistant’s performance was reported on two essay datasets, one of which was the Automated Student Assessment Prize (ASAP)1 dataset. However, performance on the ASAP dataset was reported in terms of quadratic weighted kappa and this for holistic scores only. Models predicting rubric scores were trained only with the other dataset which was hosted on and collected through Revision Assistant itself.
In contrast to feature-based approaches like the one adopted by Revision Assistant, other AES systems are implemented using deep neural networks where features are learned during model training. For example, Taghipour (2017) in his doctoral dissertation leverages a recurrent neural network to improve accuracy in predicting holistic scores, implement rubric scoring (i.e., organization and argument strength), and distinguish between human-written and computer-generated essays. Interestingly, Taghipour compared the performance of his AES system against other AES systems using the ASAP corpora, but he did not use the ASAP corpora when it came to train rubric scoring models although ASAP provides two corpora provisioning rubric scores (#7 and #8). Finally, research was also undertaken to assess the generalizability of rubric-based models by performing experiments across various datasets. It was found that the predictive power of such rubric-based models was related to how much the underlying feature set covered a rubric’s criteria (Rahimi et al., 2017).
Despite their numbers, rubrics (e.g., organization, prompt adherence, argument strength, essay length, conventions, word choices, readability, coherence, sentence fluency, style, audience, ideas) are usually investigated in isolation and not as a whole, with the exception of Revision Assistant which provides feedback at the same time on the following five rubrics: claim, development, audience, cohesion, and conventions. The literature reveals that rubric-specific automated feedback includes numerical rubric scores as well as recommendations on how to improve essay quality and correct errors (Taghipour, 2017). Again, except for Revision Assistant which undertook a holistic approach to AES including holistic and rubric scoring and provision of rubric-specific feedback at the sentence level, AES has generally not been investigated as a whole or as an end-to-end product. Hence, the AES used in this study and developed by Kumar and Boulanger (2020) is unique in that it uses both deep learning (multi-layer perceptron neural network) and a huge pool of linguistic indices (1592), predicts both holistic and rubric scores, explaining holistic scores in terms of rubric scores, and reports which linguistic indices are the most important by rubric. This study, however, goes one step further and showcases how to explain the decision process behind the prediction of a rubric score for a specific essay, one of the main AES limitations identified in the literature (Taghipour, 2017) that this research intends to address, at least partially.
Besides providing explanations of predictions both globally and individually, this study not only goes one step further toward the automated provision of formative feedback but also does so in alignment with the explanation model and the predictive model, allowing to better map feedback to the actual characteristics of an essay. Woods et al. (2017) succeeded in associating sentence-level expert-derived feedback with strong/weak sentences having the greatest influence on a rubric score based on the rubric, essay score, and the sentence characteristics. While Revision Assistant’s feature space consists of counts and binary occurrence indicators of word unigrams, bigrams and trigrams, character four-grams, and part-of-speech bigrams and trigrams, they are mainly textual and locational indices; by nature they are not descriptive or self-explanative. This research fills this gap by proposing feedback based on a set of linguistic indices that can encompass several sentences at a time. However, the proposed approach omits locational hints, leaving the merging of the two approaches as the next step to be addressed by the research community.
Although this paper proposes to extend the automated provision of formative feedback through an interpretable machine learning method, it rather focuses on the feasibility of automating it in the context of AES instead of evaluating the pedagogical quality (such as the informational and communicational value of feedback messages) or impact on students’ writing performance, a topic that will be kept for an upcoming study. Having an AES system that is capable of delivering real-time formative feedback sets the stage to investigate (1) when feedback is effective, (2) the types of feedback that are effective, and (3) whether there exist different kinds of behaviors in terms of seeking and using feedback (Goldin et al., 2017). Finally, this paper omits describing the mapping between the AES model’s linguistic indices and a pedagogical language that is easily understandable by students and teachers, which is beyond its scope.
Methodology
This study showcases the application of the PDR framework (Murdoch et al., 2019), which provides three pillars to describe interpretations in the context of the data science life cycle: Predictive accuracy, Descriptive accuracy, and Relevancy to human audience(s). It is important to note that in a broader sense both terms “explainable artificial intelligence” and “interpretable machine learning” can be used interchangeably with the following meaning (Murdoch et al., 2019): “the use of machine-learning models for the extraction of relevant knowledge about domain relationships contained in data.” Here “predictive accuracy” refers to the measurement of a model’s ability to fit data; “descriptive accuracy” is the degree at which the relationships learned by a machine learning model can be objectively captured; and “relevant knowledge” implies that a particular audience gets insights into a chosen domain problem that guide its communication, actions, and discovery (Murdoch et al., 2019).
In the context of this article, formative feedback that assesses students’ writing skills and prescribes remedial writing strategies is the relevant knowledge sought for, whose effectiveness on students’ writing performance will be validated in an upcoming study. However, the current study puts forward the tools and evaluates the feasibility to offer this real-time formative feedback. It also measures the predictive and descriptive accuracies of AES and explanation models, two key components to generate trustworthy interpretations (Murdoch et al., 2019). Naturally, the provision of formative feedback is dependent on the speed of training and evaluating new explanation models every time a new essay is ingested by the AES system. That is why this paper investigates the potential of various SHAP implementations for speed optimization without compromising the predictive and descriptive accuracies. This article will show how the insights generated by the explanation model can serve to debug the predictive model and contribute to enhance the feature selection and/or engineering process (Murdoch et al., 2019), laying the foundation for the provision of actionable and impactful pieces of knowledge to educational audiences, whose relevancy will be judged by the human stakeholders and estimated by the magnitude of resulting changes.
Figure 1 overviews all the elements and steps encompassed by the AES system in this study. The following subsections will address each facet of the overall methodology, from hyperparameter optimization to relevancy to both students and teachers.
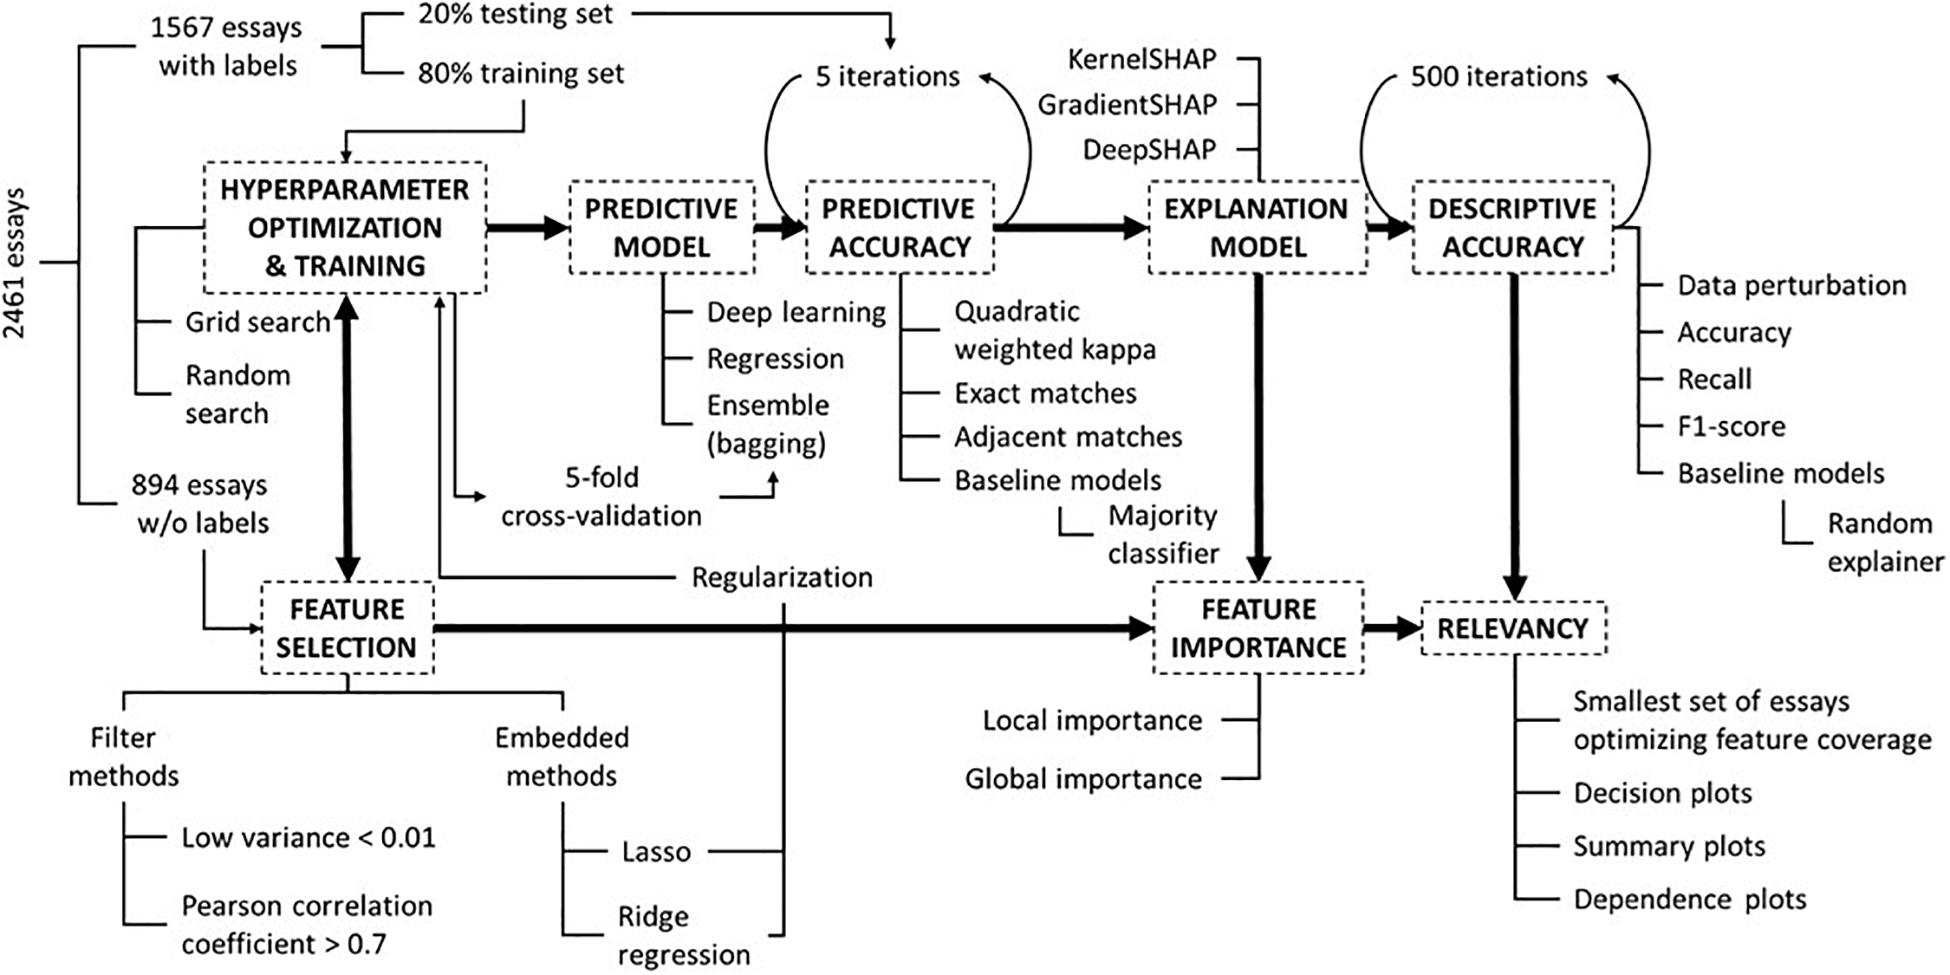
Figure 1. A flow chart exhibiting the sequence of activities to develop an end-to-end AES system and how the various elements work together to produce relevant knowledge to the intended stakeholders.
Automated Essay Scoring System, Dataset, and Feature Selection
As previously mentioned, this paper reuses the AES system developed by Kumar and Boulanger (2020). The AES models were trained using the ASAP’s seventh essay corpus. These narrative essays were written by Grade-7 students in the setting of state-wide assessments in the United States and had an average length of 171 words. Students were asked to write a story about patience. Kumar and Boulanger’s work consisted in training a predictive model for each of the four rubrics according to which essays were graded: ideas, organization, style, and conventions. Each essay was scored by two human raters on a 0−3 scale (integer scale). Rubric scores were resolved by adding the rubric scores assigned by the two human raters, producing a resolved rubric score between 0 and 6. This paper is a continuation of Boulanger and Kumar (2018, 2019, 2020) and Kumar and Boulanger (2020) where the objective is to open the AES black box to explain the holistic and rubric scores that it predicts. Essentially, the holistic score (Boulanger and Kumar, 2018, 2019) is determined and justified through its four rubrics. Rubric scores, in turn, are investigated to highlight the writing features that play an important role within each rubric (Kumar and Boulanger, 2020). Finally, beyond global feature importance, it is not only indispensable to identify which writing indices are important for a particular essay (local), but also to discover how they contribute to increase or decrease the predicted rubric score, and which feature values are more/less desirable (Boulanger and Kumar, 2020). This paper is a continuation of these previous works by adding the following link to the AES chain: holistic score, rubric scores, feature importance, explanations, and formative feedback. The objective is to highlight the means for transparent and trustable AES while empowering learning analytics practitioners with the tools to debug these models and equip educational stakeholders with an AI companion that will semi-autonomously generate formative feedback to teachers and students. Specifically, this paper analyzes the AES reasoning underlying its assessment of the “style” rubric, which looks for command of language, including effective and compelling word choice and varied sentence structure, that clearly supports the writer’s purpose and audience.
This research’s approach to AES leverages a feature-based multi-layer perceptron (MLP) deep neural network to predict rubric scores. The AES system is fed by 1592 linguistic indices quantitatively measured by the Suite of Automatic Linguistic Analysis Tools2 (SALAT), which assess aspects of grammar and mechanics, sentiment analysis and cognition, text cohesion, lexical diversity, lexical sophistication, and syntactic sophistication and complexity (Kumar and Boulanger, 2020). The purpose of using such a huge pool of low-level writing features is to let deep learning extract the most important ones; the literature supports this practice since there is evidence that features automatically selected are not less interpretable than those engineered (Woods et al., 2017). However, to facilitate this process, this study opted for a semi-automatic strategy that consisted of both filter and embedded methods. Firstly, the original ASAP’s seventh essay dataset consists of a training set of 1567 essays and a validation and testing sets of 894 essays combined. While the texts of all 2461 essays are still available to the public, only the labels (the rubric scores of two human raters) of the training set have been shared with the public. Yet, this paper reused the unlabeled 894 essays of the validation and testing sets for feature selection, a process that must be carefully carried out by avoiding being informed by essays that will train the predictive model. Secondly, feature data were normalized, and features with variances lower than 0.01 were pruned. Thirdly, the last feature of any pair of features having an absolute Pearson correlation coefficient greater than 0.7 was also pruned (the one that comes last in terms of the column ordering in the datasets). After the application of these filter methods, the number of features was reduced from 1592 to 282. Finally, the Lasso and Ridge regression regularization methods (whose combination is also called ElasticNet) were applied during the training of the rubric scoring models. Lasso is responsible for pruning further features, while Ridge regression is entrusted with eliminating multicollinearity among features.
Hyperparameter Optimization and Training
To ensure a fair evaluation of the potential of deep learning, it is of utmost importance to minimally describe this study’s exploration of the hyperparameter space, a step that is often found to be missing when reporting the outcomes of AES models’ performance (Kumar and Boulanger, 2020). First, a study should list the hyperparameters it is going to investigate by testing for various values of each hyperparameter. For example, Table 1 lists all hyperparameters explored in this study. Note that L1 and L2 are two regularization hyperparameters contributing to feature selection. Second, each study should also report the range of values of each hyperparameter. Finally, the strategy to explore the selected hyperparameter subspace should be clearly defined. For instance, given the availability of high-performance computing resources and the time/cost of training AES models, one might favor performing a grid (a systematic testing of all combinations of hyperparameters and hyperparameter values within a subspace) or a random search (randomly selecting a hyperparameter value from a range of values per hyperparameter) or both by first applying random search to identify a good starting candidate and then grid search to test all possible combinations in the vicinity of the starting candidate’s subspace. Of particular interest to this study is the neural network itself, that is, how many hidden layers should a neural network have and how many neurons should compose each hidden layer and the neural network as a whole. These two variables are directly related to the size of the neural network, with the number of hidden layers being a defining trait of deep learning. A vast swath of literature is silent about the application of interpretable machine learning in AES and even more about measuring its descriptive accuracy, the two components of trustworthiness. Hence, this study pioneers the comprehensive assessment of deep learning impact on AES’s predictive and descriptive accuracies.
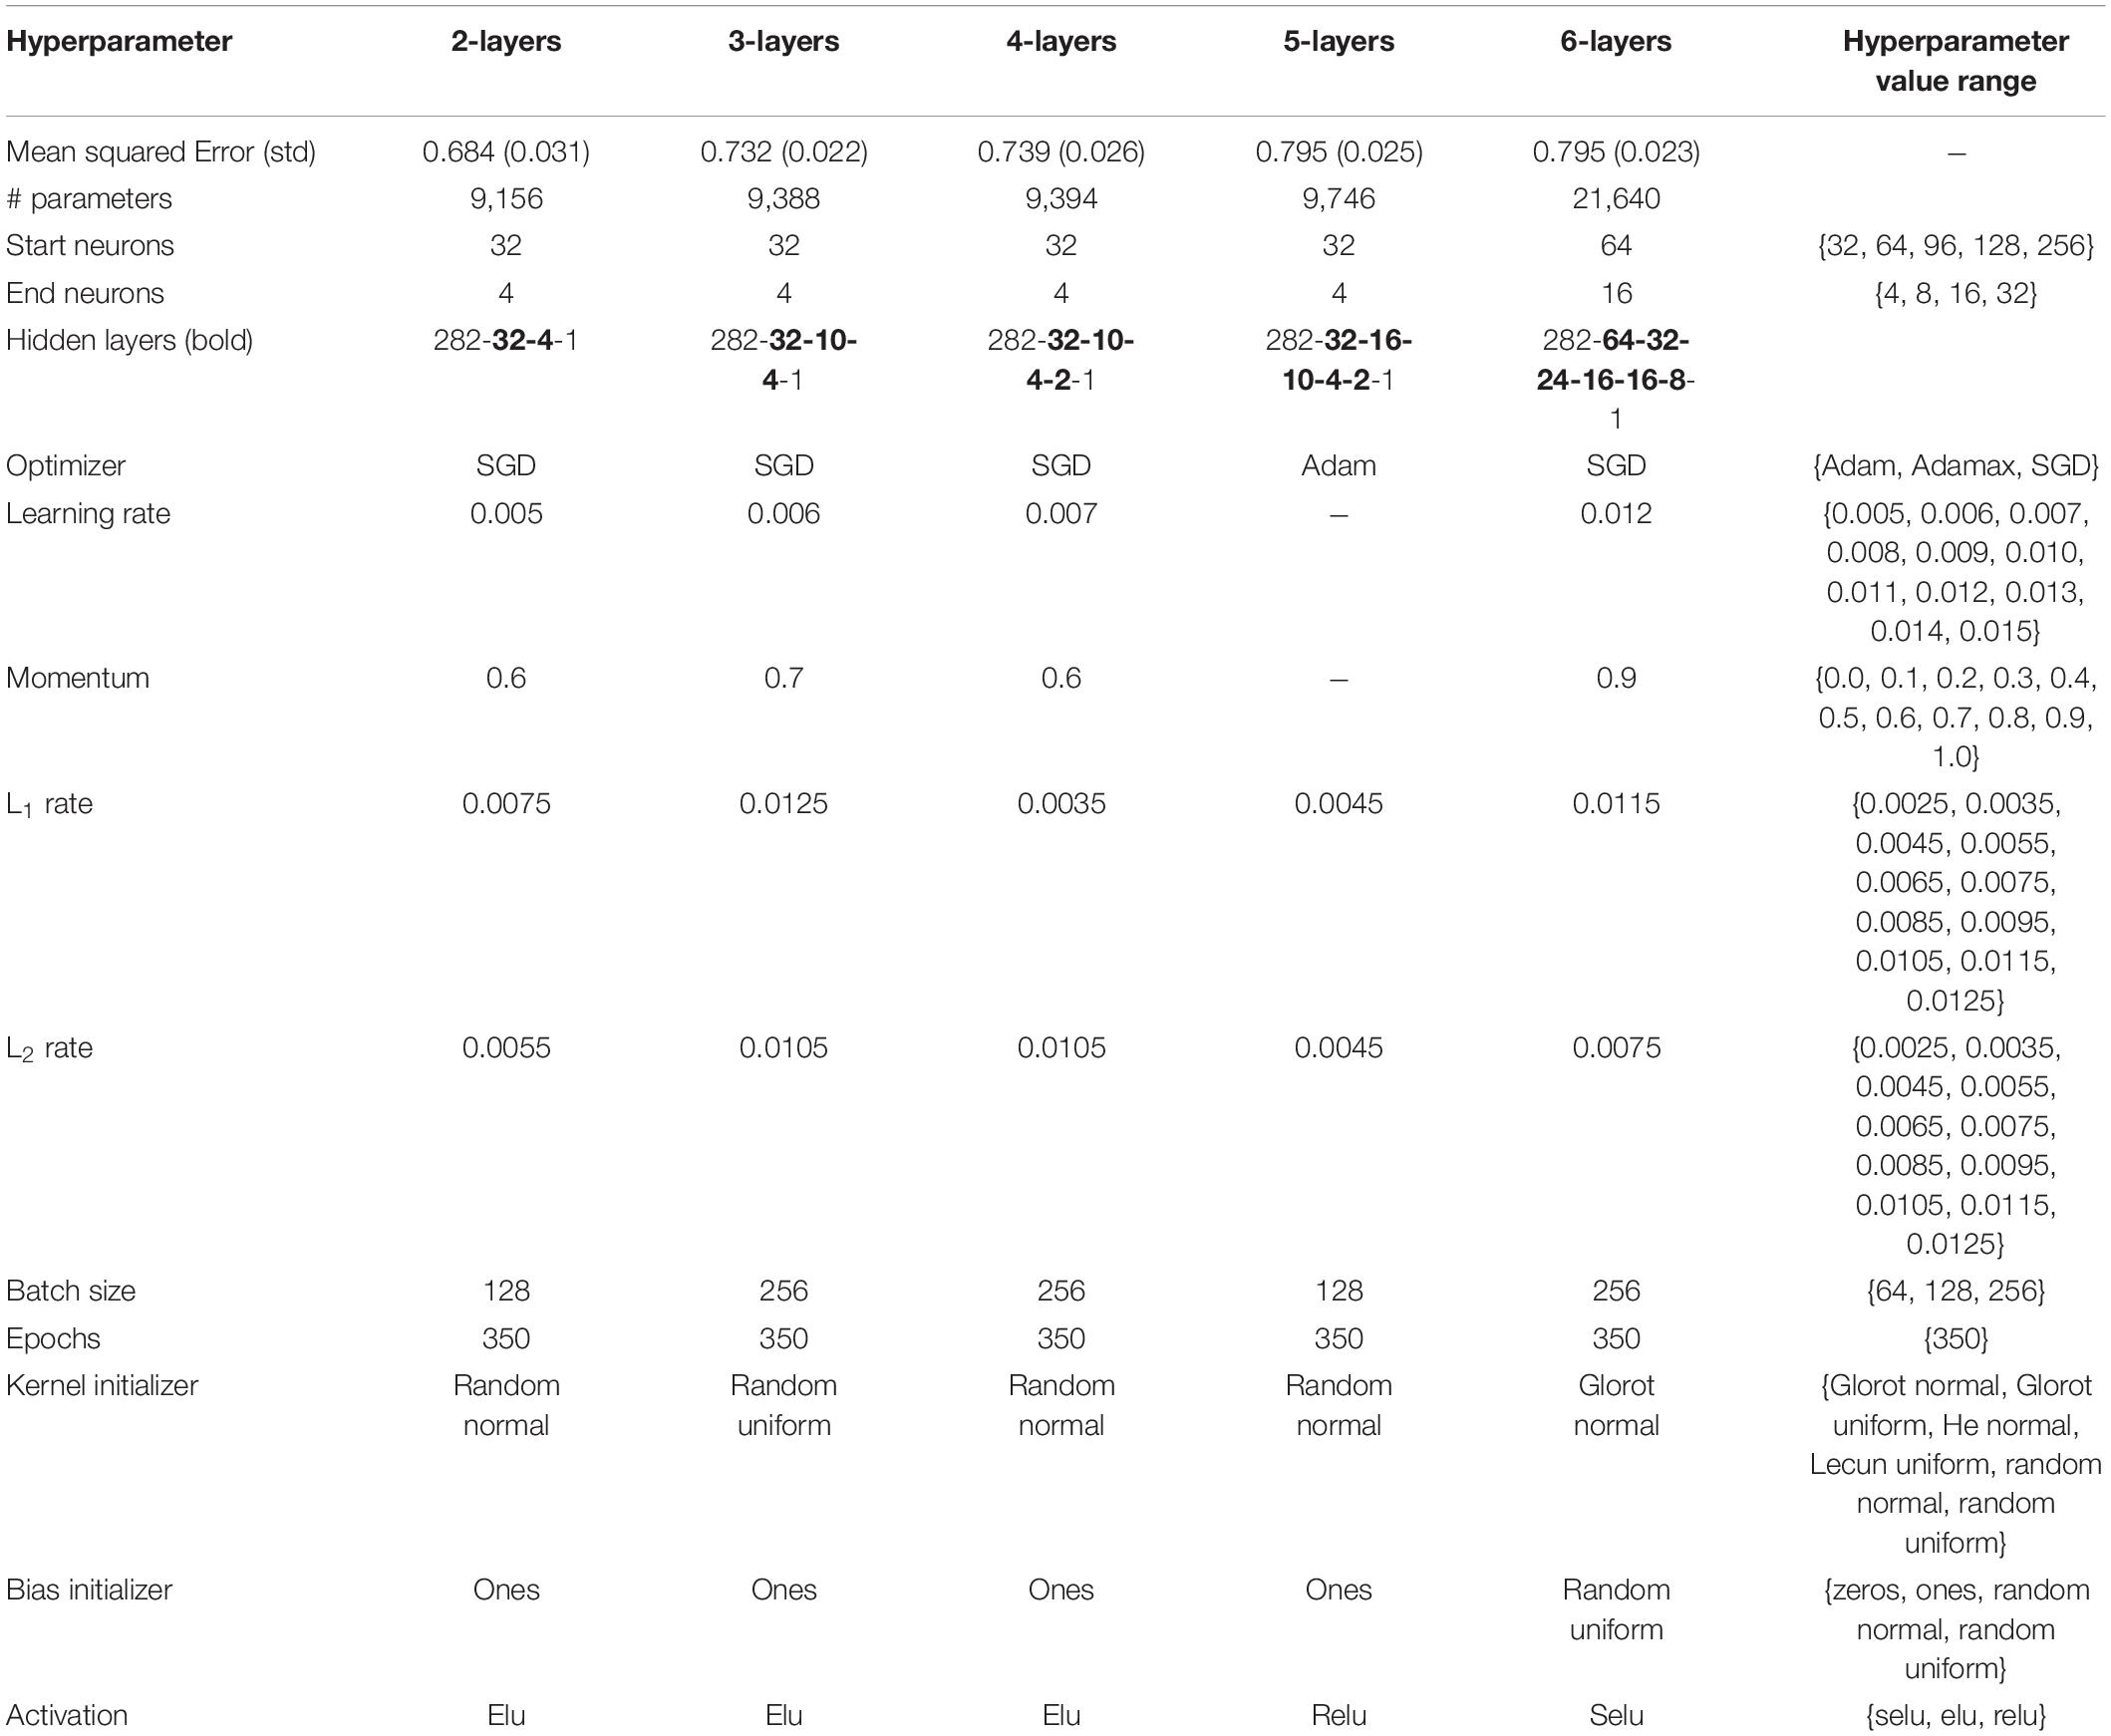
Table 1. Hyperparameter subspace investigated in this article along with best hyperparameter values per neural network architecture.
Consequently, the 1567 labeled essays were divided into a training set (80%) and a testing set (20%). No validation set was put aside; 5-fold cross-validation was rather used for hyperparameter optimization. Table 1 delineates the hyperparameter subspace from which 800 different combinations of hyperparameter values were randomly selected out of a subspace of 86,248,800 possible combinations. Since this research proposes to investigate the potential of deep learning to predict rubric scores, several architectures consisting of 2 to 6 hidden layers and ranging from 9,156 to 119,312 parameters were tested. Table 1 shows the best hyperparameter values per depth of neural networks.
Again, the essays of the testing set were never used during the training and cross-validation processes. In order to retrieve the best predictive models during training, every time the validation loss reached a record low, the model was overwritten. Training stopped when no new record low was reached during 100 epochs. Moreover, to avoid reporting the performance of overfit models, each model was trained five times using the same set of best hyperparameter values. Finally, for each resulting predictive model, a corresponding ensemble model (bagging) was also obtained out of the five models trained during cross-validation.
Predictive Models and Predictive Accuracy
Table 2 delineates the performance of predictive models trained previously by Kumar and Boulanger (2020) on the four scoring rubrics. The first row lists the agreement levels between the resolved and predicted rubric scores measured by the quadratic weighted kappa. The second row is the percentage of accurate predictions; the third row reports the percentages of predictions that are either accurate or off by 1; and the fourth row reports the percentages of predictions that are either accurate or at most off by 2. Prediction of holistic scores is done merely by adding up all rubric scores. Since the scale of rubric scores is 0−6 for every rubric, then the scale of holistic scores is 0−24.
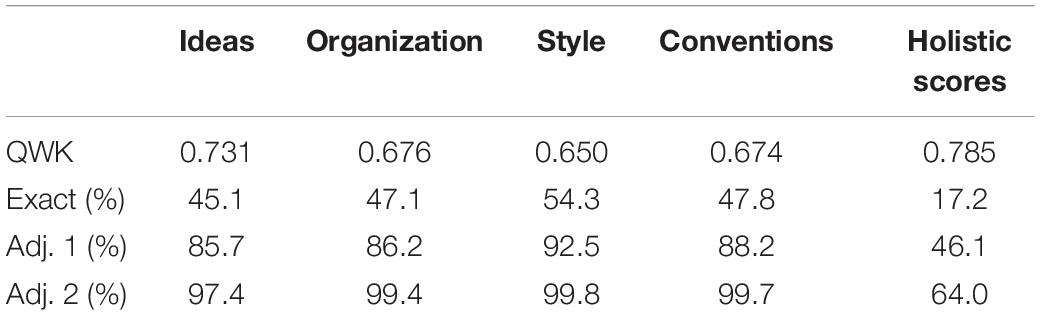
Table 2. Rubric scoring models’ performance on testing set.
While each of these rubric scoring models might suffer from its own systemic bias and hence cancel off each other’s bias by adding up the rubric scores to derive the holistic score, this study (unlike related works) intends to highlight these biases by exposing the decision making process underlying the prediction of rubric scores. Although this paper exclusively focuses on the Style rubric, the methodology put forward to analyze the local and global importance of writing indices and their context-specific contributions to predicted rubric scores is applicable to every rubric and allows to control for these biases one rubric at a time. Comparing and contrasting the role that a specific writing index plays within each rubric context deserves its own investigation, which has been partly addressed in the study led by Kumar and Boulanger (2020). Moreover, this paper underscores the necessity to measure the predictive accuracy of rubric-based holistic scoring using additional metrics to account for these rubric-specific biases. For example, there exist several combinations of rubric scores to obtain a holistic score of 16 (e.g., 4-4-4-4 vs. 4-3-4-5 vs. 3-5-2-6). Even though the predicted holistic score might be accurate, the rubric scores could all be inaccurate. Similarity or distance metrics (e.g., Manhattan and Euclidean) should then be used to describe the authenticity of the composition of these holistic scores.
According to what Kumar and Boulanger (2020) report on the performance of several state-of-the-art AES systems trained on ASAP’s seventh essay dataset, the AES system they developed and which will be reused in this paper proved competitive while being fully and deeply interpretable, which no other AES system does. They also supply further information about the study setting, essay datasets, rubrics, features, natural language processing (NLP) tools, model training, and evaluation against human performance. Again, this paper showcases the application of explainable artificial intelligence in automated essay scoring by focusing on the decision process of the Rubric #3 (Style) scoring model. Remember that the same methodology is applicable to each rubric.
Explanation Model: SHAP
SHapley Additive exPlanations (SHAP) is a theoretically justified XAI framework that can provide simultaneously both local and global explanations (Molnar, 2020); that is, SHAP is able to explain individual predictions taking into account the uniqueness of each prediction, while highlighting the global factors influencing the overall performance of a predictive model. SHAP is of keen interest because it unifies all algorithms of the class of additive feature attribution methods, adhering to a set of three properties that are desirable in interpretable machine learning: local accuracy, missingness, and consistency (Lundberg and Lee, 2017). A key advantage of SHAP is that feature contributions are all expressed in terms of the outcome variable (e.g., rubric scores), providing a same scale to compare the importance of each feature against each other. Local accuracy refers to the fact that no matter the explanation model, the sum of all feature contributions is always equal to the prediction explained by these features. The missingness property implies that the prediction is never explained by unmeasured factors, which are always assigned a contribution of zero. However, the converse is not true; a contribution of zero does not imply an unobserved factor, it can also denote a feature irrelevant to explain the prediction. The consistency property guarantees that a more important feature will always have a greater magnitude than a less important one, no matter how many other features are included in the explanation model. SHAP proves superior to other additive attribution methods such as LIME (Local Interpretable Model-Agnostic Explanations), Shapley values, and DeepLIFT in that they never comply with all three properties, while SHAP does (Lundberg and Lee, 2017). Moreover, the way SHAP assesses the importance of a feature differs from permutation importance methods (e.g., ELI5), measured as the decrease in model performance (accuracy) as a feature is perturbated, in that it is based on how much a feature contributes to every prediction.
Essentially, a SHAP explanation model (linear regression) is trained on top of a predictive model, which in this case is a complex ensemble deep learning model. Table 3 demonstrates a scale explanation model showing how SHAP values (feature contributions) work. In this example, there are five instances and five features describing each instance (in the context of this paper, an instance is an essay). Predictions are listed in the second to last column, and the base value is the mean of all predictions. The base value constitutes the reference point according to which predictions are explained; in other words, reasons are given to justify the discrepancy between the individual prediction and the mean prediction (the base value). Notice that the table does not contain the actual feature values; these are SHAP values that quantify the contribution of each feature to the predicted score. For example, the prediction of Instance 1 is 2.46, while the base value is 3.76. Adding up the feature contributions of Instance 1 to the base value produces the predicted score:
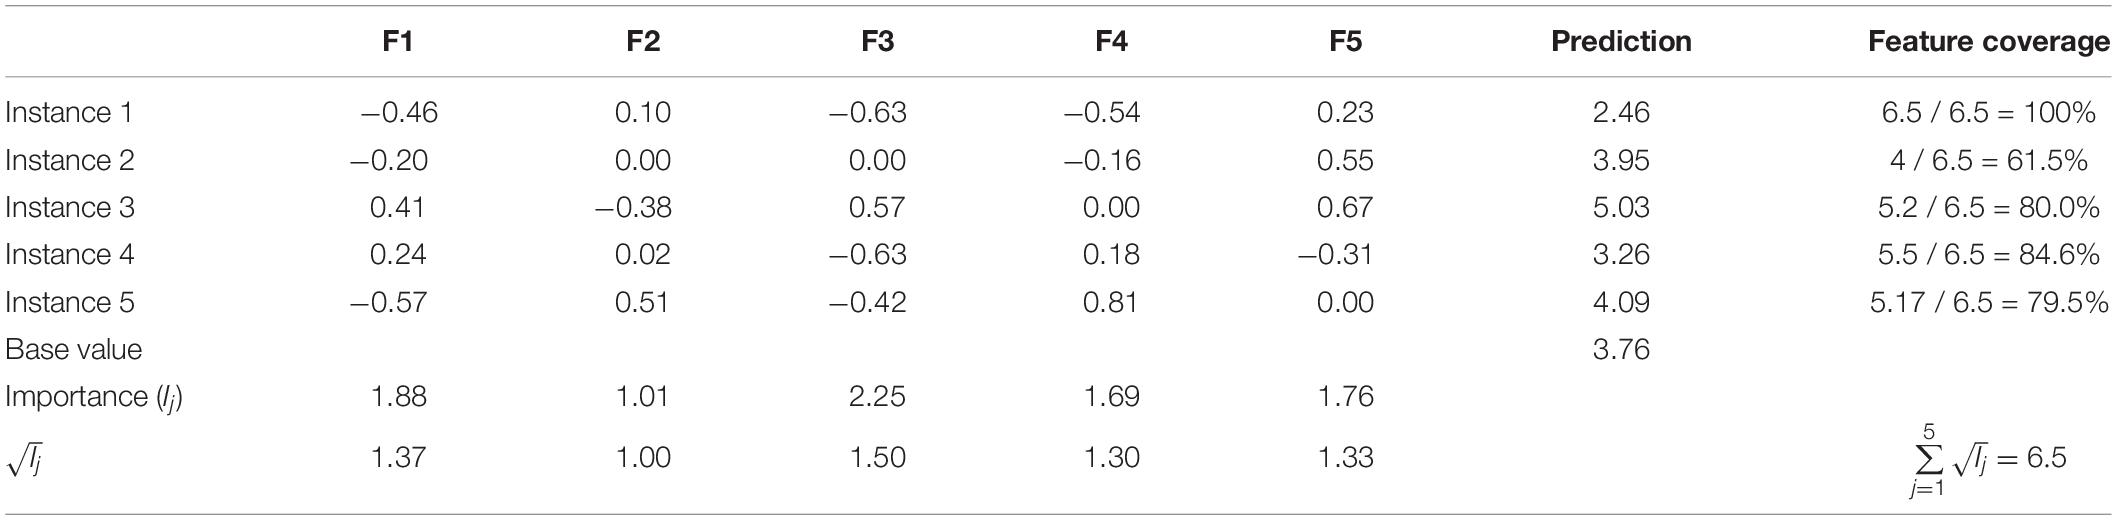
Table 3. Array of SHAP values: local and global importance of features and feature coverage per instance.
Hence, the generic equation of the explanation model (Lundberg and Lee, 2017) is:
where g(x) is the prediction of an individual instance x, σ0 is the base value, σi is the feature contribution of feature xi, xi ∈ {0,1} denotes whether feature xi is part of the individual explanation, and j is the total number of features. Furthermore, the global importance of a feature is calculated by adding up the absolute values of its corresponding SHAP values over all instances, where n is the total number of instances and is the feature contribution for instance i (Lundberg et al., 2018):
Therefore, it can be seen that Feature 3 is the most globally important feature, while Feature 2 is the least important one. Similarly, Feature 5 is Instance 3’s most important feature at the local level, while Feature 2 is the least locally important. The reader should also note that a feature shall not necessarily be assigned any contribution; some of them are just not part of the explanation such as Feature 2 and Feature 3 in Instance 2. These concepts lay the foundation for the explainable AES system presented in this paper. Just imagine that each instance (essay) will be rather summarized by 282 features and that the explanations of all the testing set’s 314 essays will be provided.
Several implementations of SHAP exist: KernelSHAP, DeepSHAP, GradientSHAP, and TreeSHAP, among others. KernelSHAP is model-agnostic and works for any type of predictive models; however, KernelSHAP is very computing-intensive which makes it undesirable for practical purposes. DeepSHAP and GradientSHAP are two implementations intended for deep learning which takes advantage of the known properties of neural networks (i.e., MLP-NN, CNN, or RNN) to accelerate up to three orders of magnitude the processing time to explain predictions (Chen et al., 2019). Finally, TreeSHAP is the most powerful implementation intended for tree-based models. TreeSHAP is not only fast; it is also accurate. While the three former implementations estimate SHAP values, TreeSHAP computes them exactly. Moreover, TreeSHAP not only measures the contribution of individual features, but it also considers interactions between pairs of features and assigns them SHAP values. Since one of the goals of this paper is to assess the potential of deep learning on the performance of both predictive and explanation models, this research tested the former three implementations. TreeSHAP is recommended for future work since the interaction among features is critical information to consider. Moreover, KernelSHAP, DeepSHAP, and GradientSHAP all require access to the whole original dataset to derive the explanation of a new instance, another constraint TreeSHAP is not subject to.
Descriptive Accuracy: Trustworthiness of Explanation Models
This paper reuses and adapts the methodology introduced by Ribeiro et al. (2016). Several explanation models will be trained, using different SHAP implementations and configurations, per deep learning predictive model (for each number of hidden layers). The rationale consists in randomly selecting and ignoring 25% of the 282 features feeding the predictive model (e.g., turning them to zero). If it causes the prediction to change beyond a specific threshold (in this study 0.10 and 0.25 were tested), then the explanation model should also reflect the magnitude of this change while ignoring the contributions of these same features. For example, the original predicted rubric score of an essay might be 5; however, when ignoring the information brought in by a subset of 70 randomly selected features (25% of 282), the prediction may turn to 4. On the other side, if the explanation model also predicts a 4 while ignoring the contributions of the same subset of features, then the explanation is considered as trustworthy. This allows to compute the precision, recall, and F1-score of each explanation model (number of true and false positives and true and false negatives). The process is repeated 500 times for every essay to determine the average precision and recall of every explanation model.
Judging Relevancy
So far, the consistency of explanations with predictions has been considered. However, consistent explanations do not imply relevant or meaningful explanations. Put another way, explanations only reflect what predictive models have learned during training. How can the black box of these explanations be opened? Looking directly at the numerical SHAP values of each explanation might seem a daunting task, but there exist tools, mainly visualizations (decision plot, summary plot, and dependence plot), that allow to make sense out of these explanations. However, before visualizing these explanations, another question needs to be addressed: which explanations or essays should be picked for further scrutiny of the AES system? Given the huge number of essays to examine and the tedious task to understand the underpinnings of a single explanation, a small subset of essays should be carefully picked that should represent concisely the state of correctness of the underlying predictive model. Again, this study applies and adapts the methodology in Ribeiro et al. (2016). A greedy algorithm selects essays whose predictions are explained by as many features of global importance as possible to optimize feature coverage. Ribeiro et al. demonstrated in unrelated studies (i.e., sentiment analysis) that the correctness of a predictive model can be assessed with as few as four or five well-picked explanations.
For example, Table 3 reveals the global importance of five features. The square root of each feature’s global importance is also computed and considered instead to limit the influence of a small group of very influential features. The feature coverage of Instance 1 is 100% because all features are engaged in the explanation of the prediction. On the other hand, Instance 2 has a feature coverage of 61.5% because only Features 1, 4, and 5 are part of the prediction’s explanation. The feature coverage is calculated by summing the square root of each explanation’s feature’s global importance together and dividing by the sum of the square roots of all features’ global importance:
Additionally, it can be seen that Instance 4 does not have any zero-feature value although its feature coverage is only 84.6%. The algorithm was constrained to discard from the explanation any feature whose contribution (local importance) was too close to zero. In the case of Table 3’s example, any feature whose absolute SHAP value is less than 0.10 is ignored, hence leading to a feature coverage of:
In this paper’s study, the real threshold was 0.01. This constraint was actually a requirement for the DeepSHAP and GradientSHAP implementations because they only output non-zero SHAP values contrary to KernelSHAP which generates explanations with a fixed number of features: a non-zero SHAP value indicates that the feature is part of the explanation, while a zero value excludes the feature from the explanation. Without this parameter, all 282 features would be part of the explanation although a huge number only has a trivial (very close to zero) SHAP value. Now, a much smaller but variable subset of features makes up each explanation. This is one way in which Ribeiro et al.’s SP-LIME algorithm (SP stands for Submodular Pick) has been adapted to this study’s needs. In conclusion, notice how Instance 4 would be selected in preference to Instance 5 to explain Table 3’s underlying predictive model. Even though both instances have four features explaining their prediction, Instance 4’s features are more globally important than Instance 5’s features, and therefore Instance 4 has greater feature coverage than Instance 5.
Whereas Table 3’s example exhibits the feature coverage of one instance at a time, this study computes it for a subset of instances, where the absolute SHAP values are aggregated (summed) per candidate subset. When the sum of absolute SHAP values per feature exceeds the set threshold, the feature is then considered as covered by the selected set of instances. The objective in this study was to optimize the feature coverage while minimizing the number of essays to validate the AES model.
Research Questions
One of this article’s objectives is to assess the potential of deep learning in automated essay scoring. The literature has often claimed (Hussein et al., 2019) that there are two approaches to AES, feature-based and deep learning, as though these two approaches were mutually exclusive. Yet, the literature also puts forward that feature-based AES models may be more interpretable than deep learning ones (Amorim et al., 2018). This paper embraces the viewpoint that these two approaches can also be complementary by leveraging the state-of-the-art in NLP and automatic linguistic analysis and harnessing one of the richest pools of linguistic indices put forward in the research community (Crossley et al., 2016, 2017, 2019; Kyle, 2016; Kyle et al., 2018) and applying a thorough feature selection process powered by deep learning. Moreover, the ability of deep learning of modeling complex non-linear relationships makes it particularly well-suited for AES given that the importance of a writing feature is highly dependent on its context, that is, its interactions with other writing features. Besides, this study leverages the SHAP interpretation method that is well-suited to interpret very complex models. Hence, this study elected to work with deep learning models and ensembles to test SHAP’s ability to explain these complex models. Previously, the literature has revealed the difficulty to have at the same time both accurate and interpretable models (Ribeiro et al., 2016; Murdoch et al., 2019), where favoring one comes at the expense of the other. However, this research shows how XAI makes it now possible to produce both accurate and interpretable models in the area of AES. Since ensembles have been repeatedly shown to boost the accuracy of predictive models, they were included as part of the tested deep learning architectures to maximize generalizability and accuracy, while making these predictive models interpretable and exploring whether deep learning can even enhance their descriptive accuracy further.
This study investigates the trustworthiness of explanation models, and more specifically, those explaining deep learning predictive models. For instance, does the depth, defined as the number of hidden layers, of an MLP neural network increases the trustworthiness of its SHAP explanation model? The answer to this question will help determine whether it is possible to have very accurate AES models while having competitively interpretable/explainable models, the corner stone for the generation of formative feedback. Remember that formative feedback is defined as “any kind of information provided to students about their actual state of learning or performance in order to modify the learner’s thinking or behavior in the direction of the learning standards” and that formative feedback “conveys where the student is, what are the goals to reach, and how to reach the goals” (Goldin et al., 2017). This notion contrasts with summative feedback which basically is “a justification of the assessment results” (Hao and Tsikerdekis, 2019).
As pointed out in the previous section, multiple SHAP implementations are evaluated in this study. Hence, this paper showcases whether the faster DeepSHAP and GradientSHAP implementations are as reliable as the slower KernelSHAP implementation. The answer to this research question will shed light on the feasibility of providing immediate formative feedback and this multiple times throughout students’ writing processes.
This study also looks at whether a summary of the data produces as trustworthy explanations as those from the original data. This question will be of interest to AES researchers and practitioners because it could allow to significantly decrease the processing time of the computing-intensive and model-agnostic KernelSHAP implementation and test further the potential of customizable explanations.
KernelSHAP allows to specify the total number of features that will shape the explanation of a prediction; for instance, this study experiments with explanations of 16 and 32 features and observes whether there exists a statistically significant difference in the reliability of these explanation models. Knowing this will hint at whether simpler or more complex explanations are more desirable when it comes to optimize their trustworthiness. If there is no statistically significant difference, then AES practitioners are given further flexibility in the selection of SHAP implementations to find the sweet spot between complexity of explanations and speed of processing. For instance, the KernelSHAP implementation allows to customize the number of factors making up an explanation, while the faster DeepSHAP and GradientSHAP do not.
Finally, this paper highlights the means to debug and compare the performance of predictive models through their explanations. Once a model is debugged, the process can be reused to fine-tune feature selection and/or feature engineering to improve predictive models and for the generation of formative feedback to both students and teachers.
Results
The training, validation, and testing sets consist of 1567 essays, each of which has been scored by two human raters, who assigned a score between 0 and 3 per rubric (ideas, organization, style, and conventions). In particular, this article looks at predictive and descriptive accuracy of AES models on the third rubric, style. Note that although each essay has been scored by two human raters, the literature (Shermis, 2014) is not explicit about whether only two or more human raters participated in the scoring of all 1567 essays; given the huge number of essays, it is likely that more than two human raters were involved in the scoring of these essays so that the amount of noise introduced by the various raters’ biases is unknown while probably being at some degree balanced among the two groups of raters. Figure 2 shows the confusion matrices of human raters on Style Rubric. The diagonal elements (dark gray) correspond to exact matches, whereas the light gray squares indicate adjacent matches. Figure 2A delineates the number of essays per pair of ratings, and Figure 2B shows the percentages per pair of ratings. The agreement level between each pair of human raters, measured by the quadratic weighted kappa, is 0.54; the percentage of exact matches is 65.3%; the percentage of adjacent matches is 34.4%; and 0.3% of essays are neither exact nor adjacent matches. Figures 2A,B specify the distributions of 0−3 ratings per group of human raters. Figure 2C exhibits the distribution of resolved scores (a resolved score is the sum of the two human ratings). The mean is 3.99 (with a standard deviation of 1.10), and the median and mode are 4. It is important to note that the levels of predictive accuracy reported in this article are measured on the scale of resolved scores (0−6) and that larger scales tend to slightly inflate quadratic weighted kappa values, which must be taken into account when comparing against the level of agreement between human raters. Comparison of percentages of exact and adjacent matches must also be made with this scoring scale discrepancy in mind.
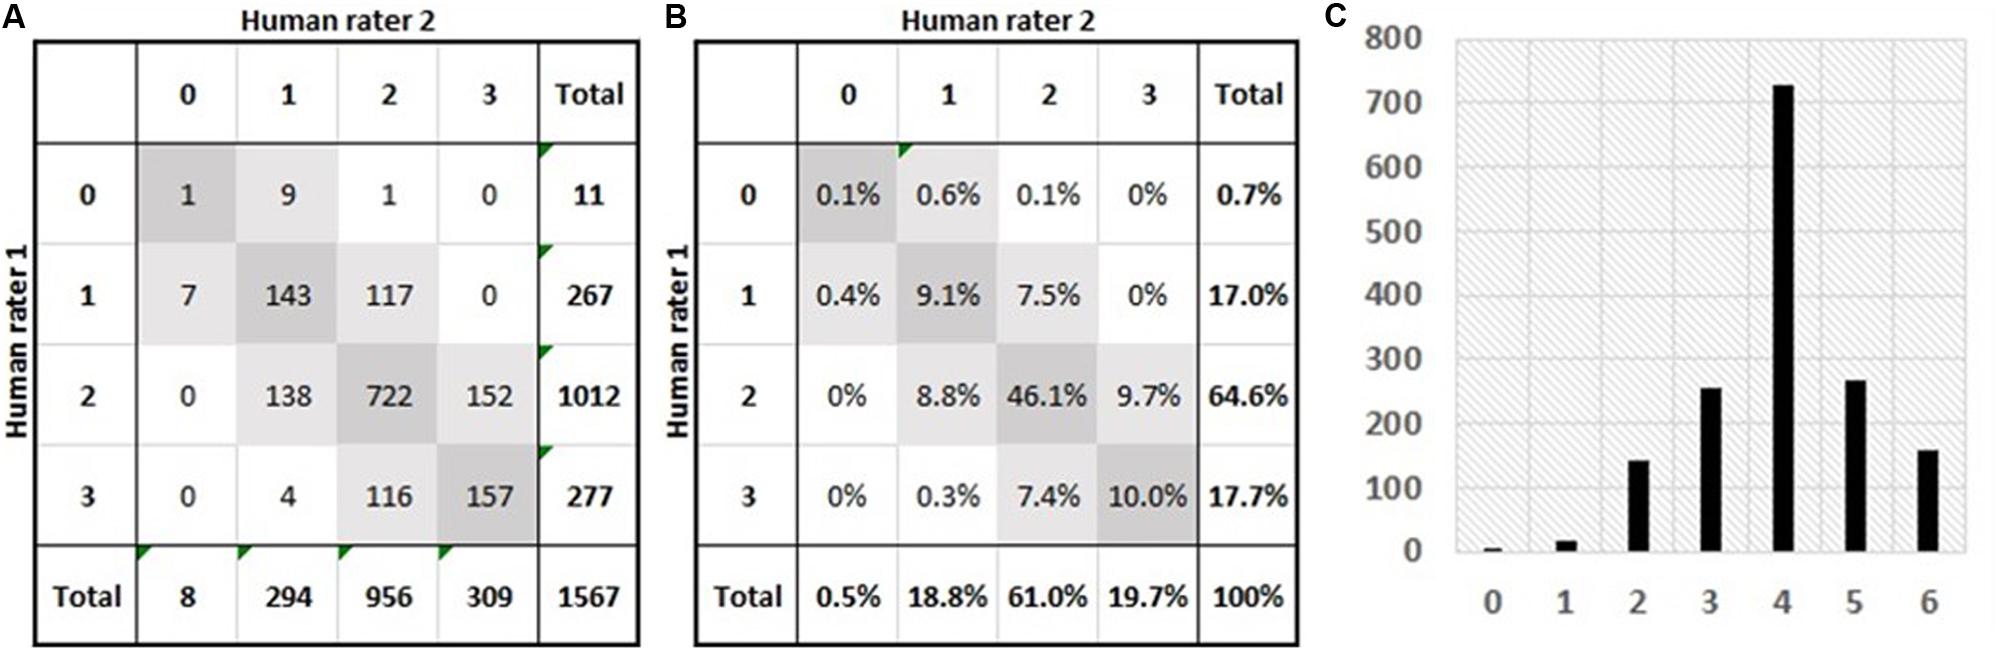
Figure 2. Summary of the essay dataset (1567 Grade-7 narrative essays) investigated in this study. (A) Number of essays per pair of human ratings; the diagonal (dark gray squares) lists the numbers of exact matches while the light-gray squares list the numbers of adjacent matches; and the bottom row and the rightmost column highlight the distributions of ratings for both groups of human raters. (B) Percentages of essays per pair of human ratings; the diagonal (dark gray squares) lists the percentages of exact matches while the light-gray squares list the percentages of adjacent matches; and the bottom row and the rightmost column highlight the distributions (frequencies) of ratings for both groups of human raters. (C) The distribution of resolved rubric scores; a resolved score is the addition of its two constituent human ratings.
Predictive Accuracy and Descriptive Accuracy
Table 4 compiles the performance outcomes of the 10 predictive models evaluated in this study. The reader should remember that the performance of each model was averaged over five iterations and that two models were trained per number of hidden layers, one non-ensemble and one ensemble. Except for the 6-layer models, there is no clear winner among other models. Even for the 6-layer models, they are superior in terms of exact matches, the primary goal for a reliable AES system, but not according to adjacent matches. Nevertheless, on average ensemble models slightly outperform non-ensemble models. Hence, these ensemble models will be retained for the next analysis step. Moreover, given that five ensemble models were trained per neural network depth, the most accurate model among the five is selected and displayed in Table 4.
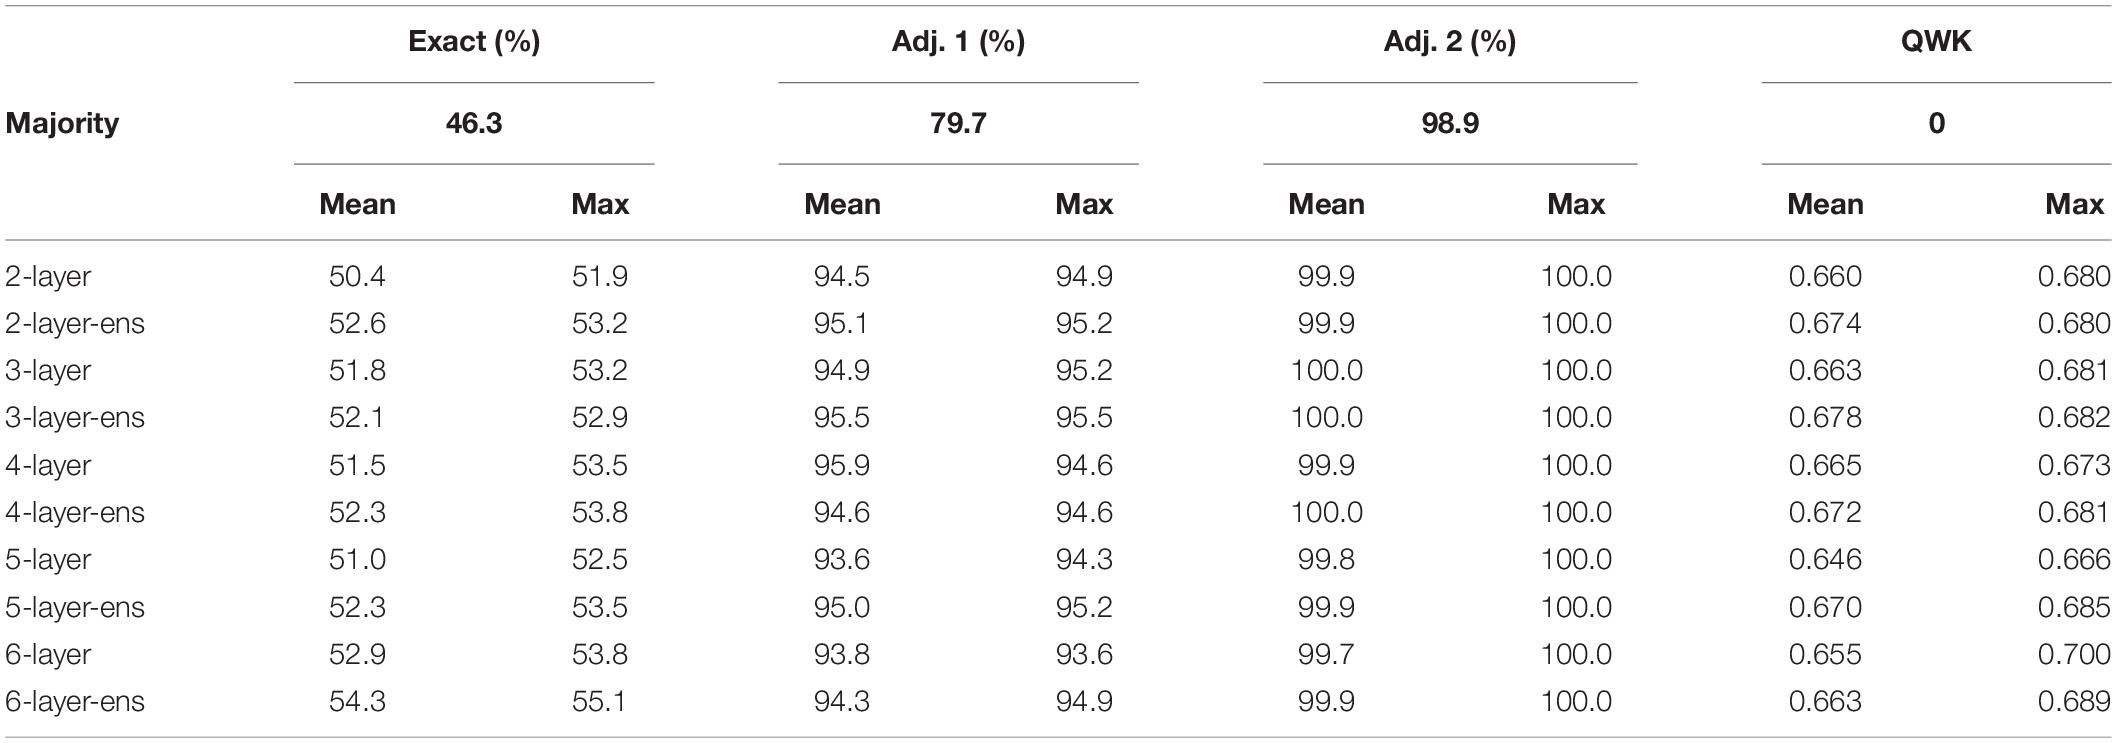
Table 4. Performance of majority classifier and average/maximal performance of trained predictive models.
Next, for each selected ensemble predictive model, several explanation models are trained per predictive model. Every predictive model is explained by the “Deep,” “Grad,” and “Random” explainers, except for the 6-layer model where it was not possible to train a “Deep” explainer apparently due to a bug in the original SHAP code caused by either a unique condition in this study’s data or neural network architecture. However, this was beyond the scope of this study to fix and investigate this issue. As it will be demonstrated, no statistically significant difference exists between the accuracy of these explainers.
The “Random” explainer serves as a baseline model for comparison purpose. Remember that to evaluate the reliability of explanation models, the concurrent impact of randomly selecting and ignoring a subset of features on the prediction and explanation of rubric scores is analyzed. If the prediction changes significantly and its corresponding explanation changes (beyond a set threshold) accordingly (a true positive) or if the prediction remains within the threshold as does the explanation (a true negative), then the explanation is deemed as trustworthy. Hence, in the case of the Random explainer, it simulates random explanations by randomly selecting 32 non-zero features from the original set of 282 features. These random explanations consist only of non-zero features because, according to SHAP’s missingness property, a feature with a zero or a missing value never gets assigned any contribution to the prediction. If at least one of these 32 features is also an element of the subset of the ignored features, then the explanation is considered as untrustworthy, no matter the size of a feature’s contribution.
As for the layer-2 model, six different explanation models are evaluated. Recall that layer-2 models generated the least mean squared error (MSE) during hyperparameter optimization (see Table 1). Hence, this specific type of architecture was selected to test the reliability of these various explainers. The “Kernel” explainer is the most computing-intensive and took approximately 8 h of processing. It was trained using the full distributions of feature values in the training set and shaped explanations in terms of 32 features; the “Kernel-16” and “Kernel-32” models were trained on a summary (50 k-means centroids) of the training set to accelerate the processing by about one order of magnitude (less than 1 h). Besides, the “Kernel-16” explainer derived explanations in terms of 16 features, while the “Kernel-32” explainer explained predictions through 32 features. Table 5 exhibits the descriptive accuracy of these various explanation models according to a 0.10 and 0.25 threshold; in other words, by ignoring a subset of randomly picked features, it assesses whether or not the prediction and explanation change simultaneously. Note also how each explanation model, no matter the underlying predictive model, outperforms the “Random” model.
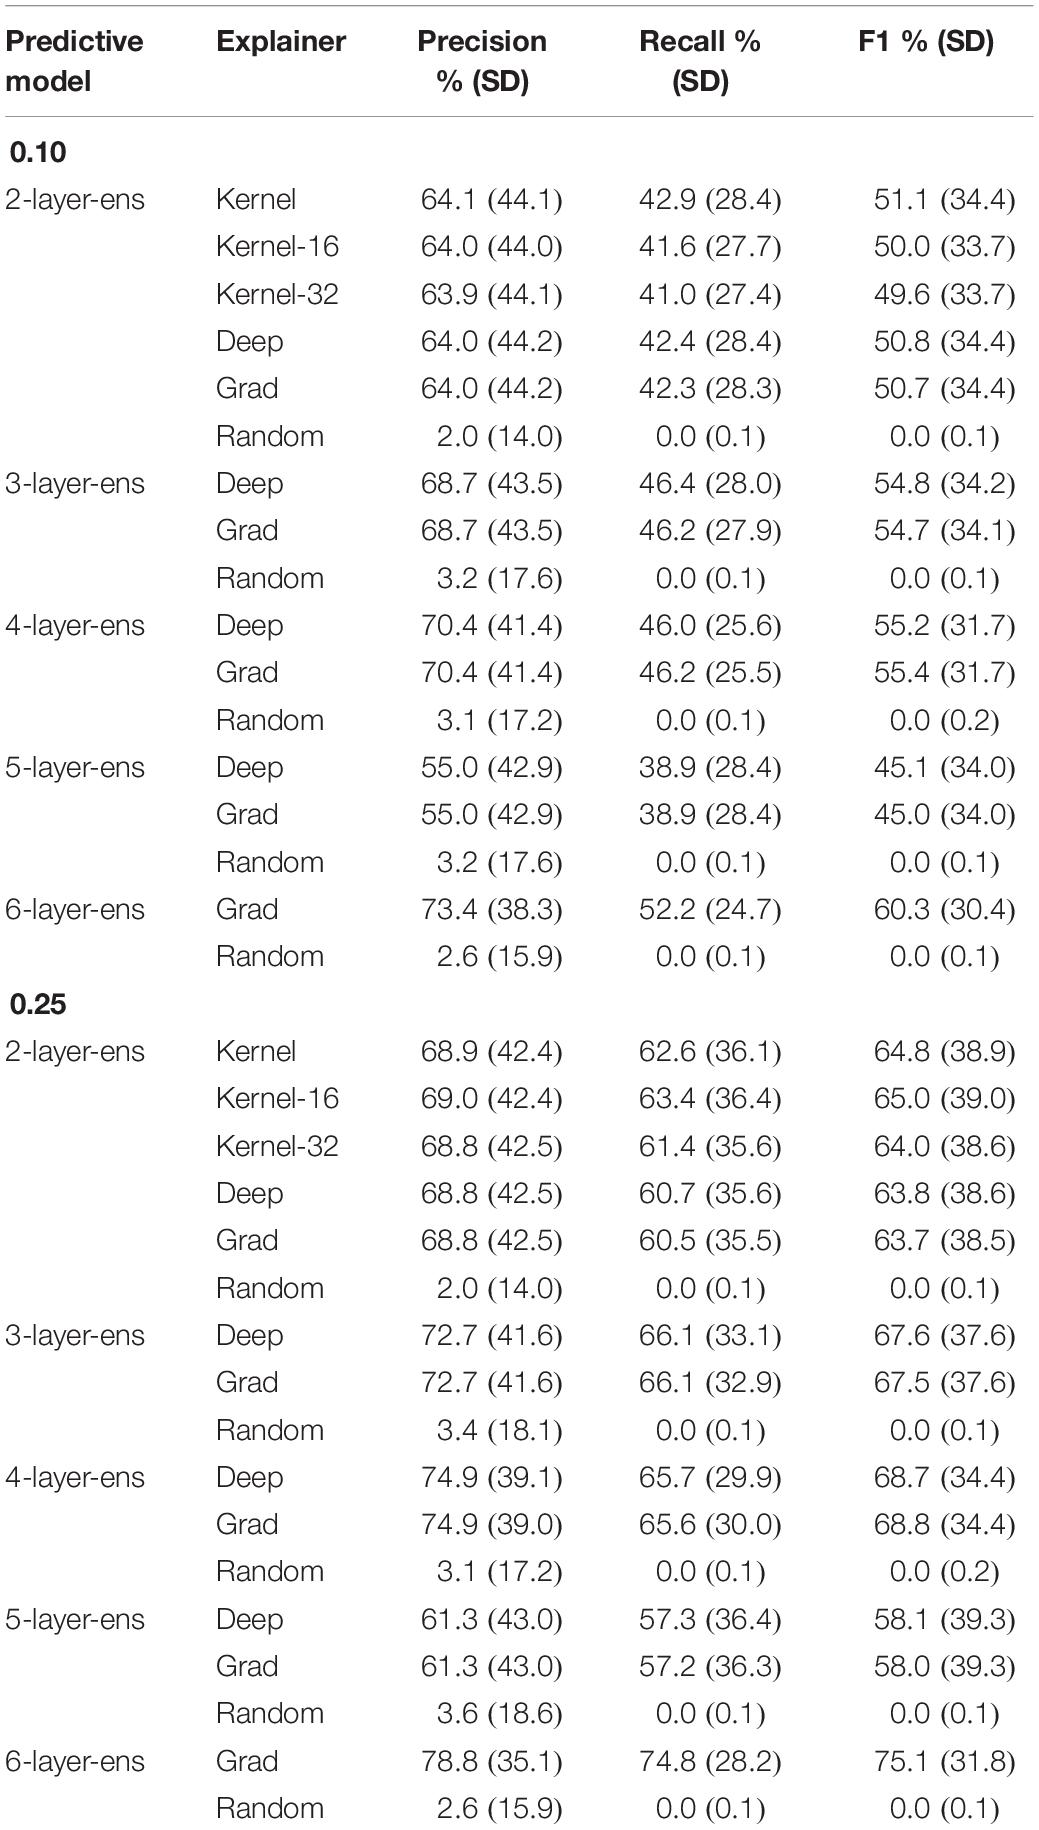
Table 5. Precision, recall, and F1 scores of the various explainers tested per type of predictive model.
The first research question addressed in this subsection asks whether there exists a statistically significant difference between the “Kernel” explainer, which generates 32-feature explanations and is trained on the whole training set, and the “Kernel-32” explainer which also generates 32-feature explanations and is trained on a summary of the training set. To determine this, an independent t-test was conducted using the precision, recall, and F1-score distributions (500 iterations) of both explainers. Table 6 reports the p-values of all the tests and for the 0.10 and 0.25 thresholds. It reveals that there is no statistically significant difference between the two explainers.
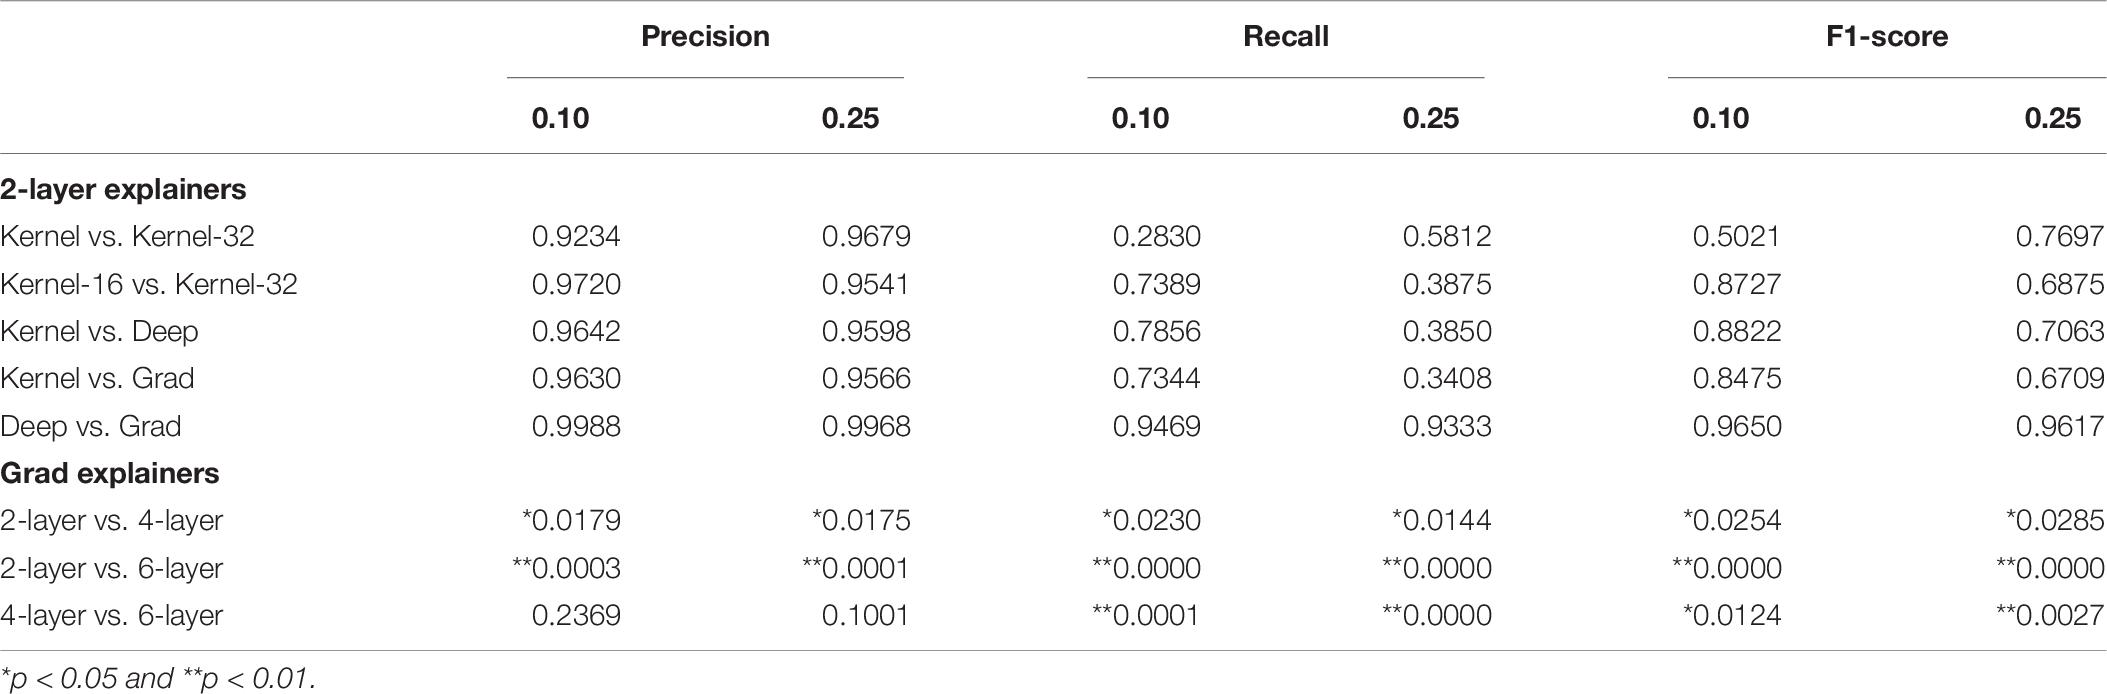
Table 6. p-values of independent t-tests comparing whether there exist statistically significant differences between the mean precisions, recalls, and F1-scores of 2-layer explainers and between those of the 2-layer’s, 4-layer’s, and 6-layer’s Gradient explainers.
The next research question tests whether there exists a difference in the trustworthiness of explainers shaping 16 or 32-feature explanations. Again t-tests were conducted to verify this. Table 6 lists the resulting p-values. Again, there is no statistically significant difference in the average precisions, recalls, and F1-scores of both explainers.
This leads to investigating whether the “Kernel,” “Deep,” and “Grad” explainers are equivalent. Table 6 exhibits the results of the t-tests conducted to verify this and reveals that none of the explainers produce a statistically significantly better performance than the other.
Armed with this evidence, it is now possible to verify whether deeper MLP neural networks produce more trustworthy explanation models. For this purpose, the performance of the “Grad” explainer for each type of predictive model will be compared against each other. The same methodology as previously applied is employed here. Table 6, again, confirms that the explanation model of the 2-layer predictive model is statistically significantly less trustworthy than the 4-layer’s explanation model; the same can be said of the 4-layer and 6-layer models. The only exception is the difference in average precision between 2-layer and 4-layer models and between 4-layer and 6-layer models; however, there clearly exists a statistically significant difference in terms of precision (and also recall and F1-score) between 2-layer and 6-layer models.
The Best Subset of Essays to Judge AES Relevancy
Table 7 lists the four best essays optimizing feature coverage (93.9%) along with their resolved and predicted scores. Notice how two of the four essays were picked by the adapted SP-LIME algorithm with some strong disagreement between the human and the machine graders, two were picked with short and trivial text, and two were picked exhibiting perfect agreement between the human and machine graders. Interestingly, each pair of longer and shorter essays exposes both strong agreement and strong disagreement between the human and AI agents, offering an opportunity to debug the model and evaluate its ability to detect the presence or absence of more basic (e.g., very small number of words, occurrences of sentence fragments) and more advanced aspects (e.g., cohesion between adjacent sentences, variety of sentence structures) of narrative essay writing and to appropriately reward or penalize them.
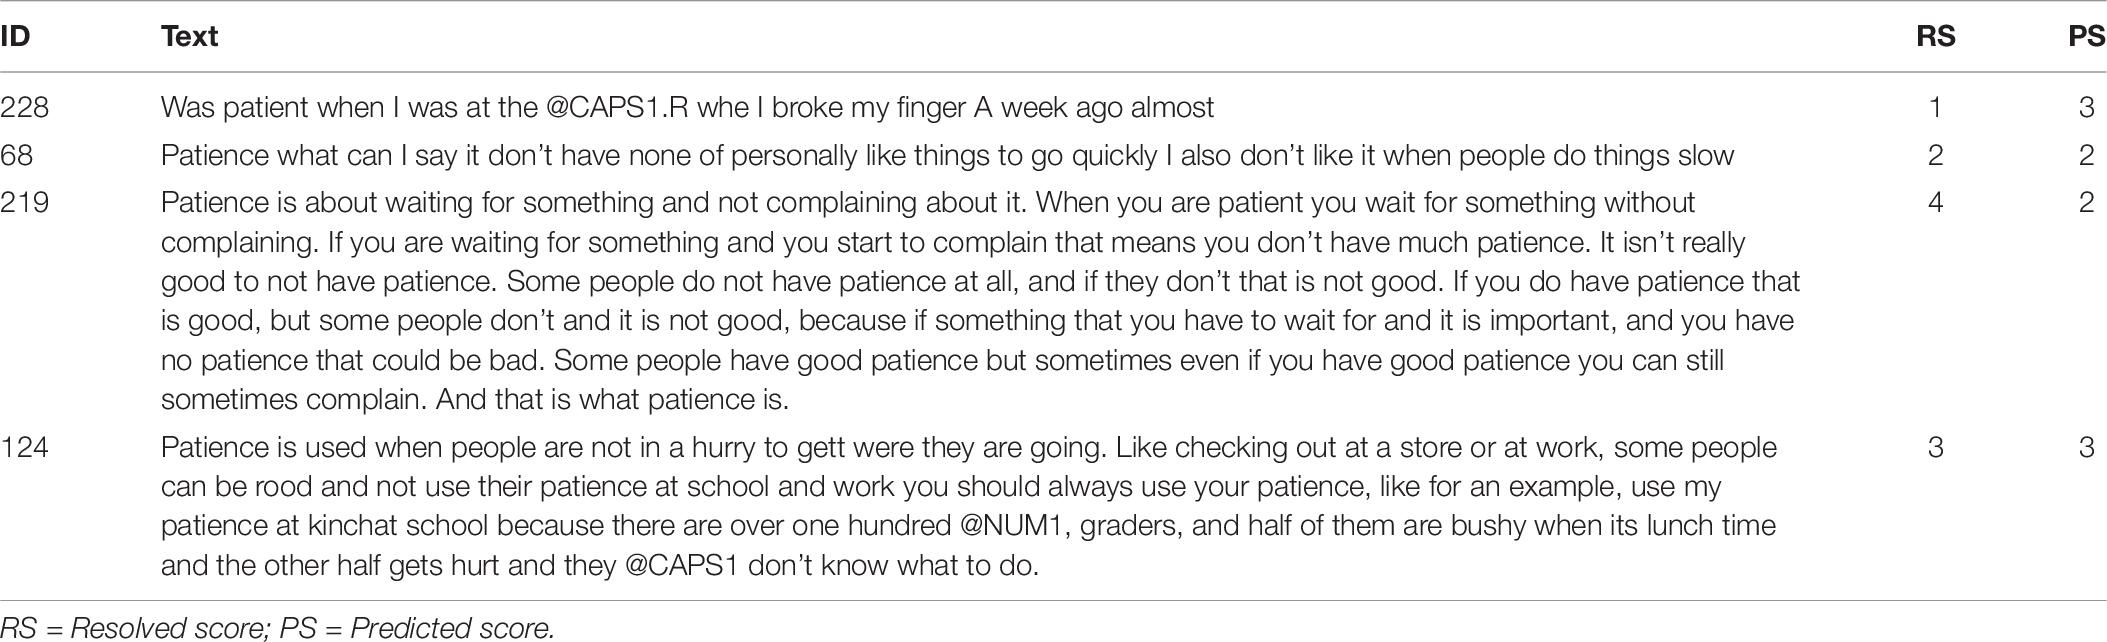
Table 7. Set of best essays to evaluate the correctness of the 6-layer ensemble AES model.
Local Explanation: The Decision Plot
The decision plot lists writing features by order of importance from top to bottom. The line segments display the contribution (SHAP value) of each feature to the predicted rubric score. Note that an actual decision plot consists of all 282 features and that only the top portion of it (20 most important features) can be displayed (see Figure 3). A decision plot is read from bottom to top. The line starts at the base value and ends at the predicted rubric score. Given that the “Grad” explainer is the only explainer common to all predictive models, it has been selected to derive all explanations. The decision plots in Figure 3 show the explanations of the four essays in Table 7; the dashed line in these plots represents the explanation of the most accurate predictive model, that is the ensemble model with 6 hidden layers which also produced the most trustworthy explanation model. The predicted rubric score of each explanation model is listed in the bottom-right legend. Explanation of the writing features follow in a next subsection.
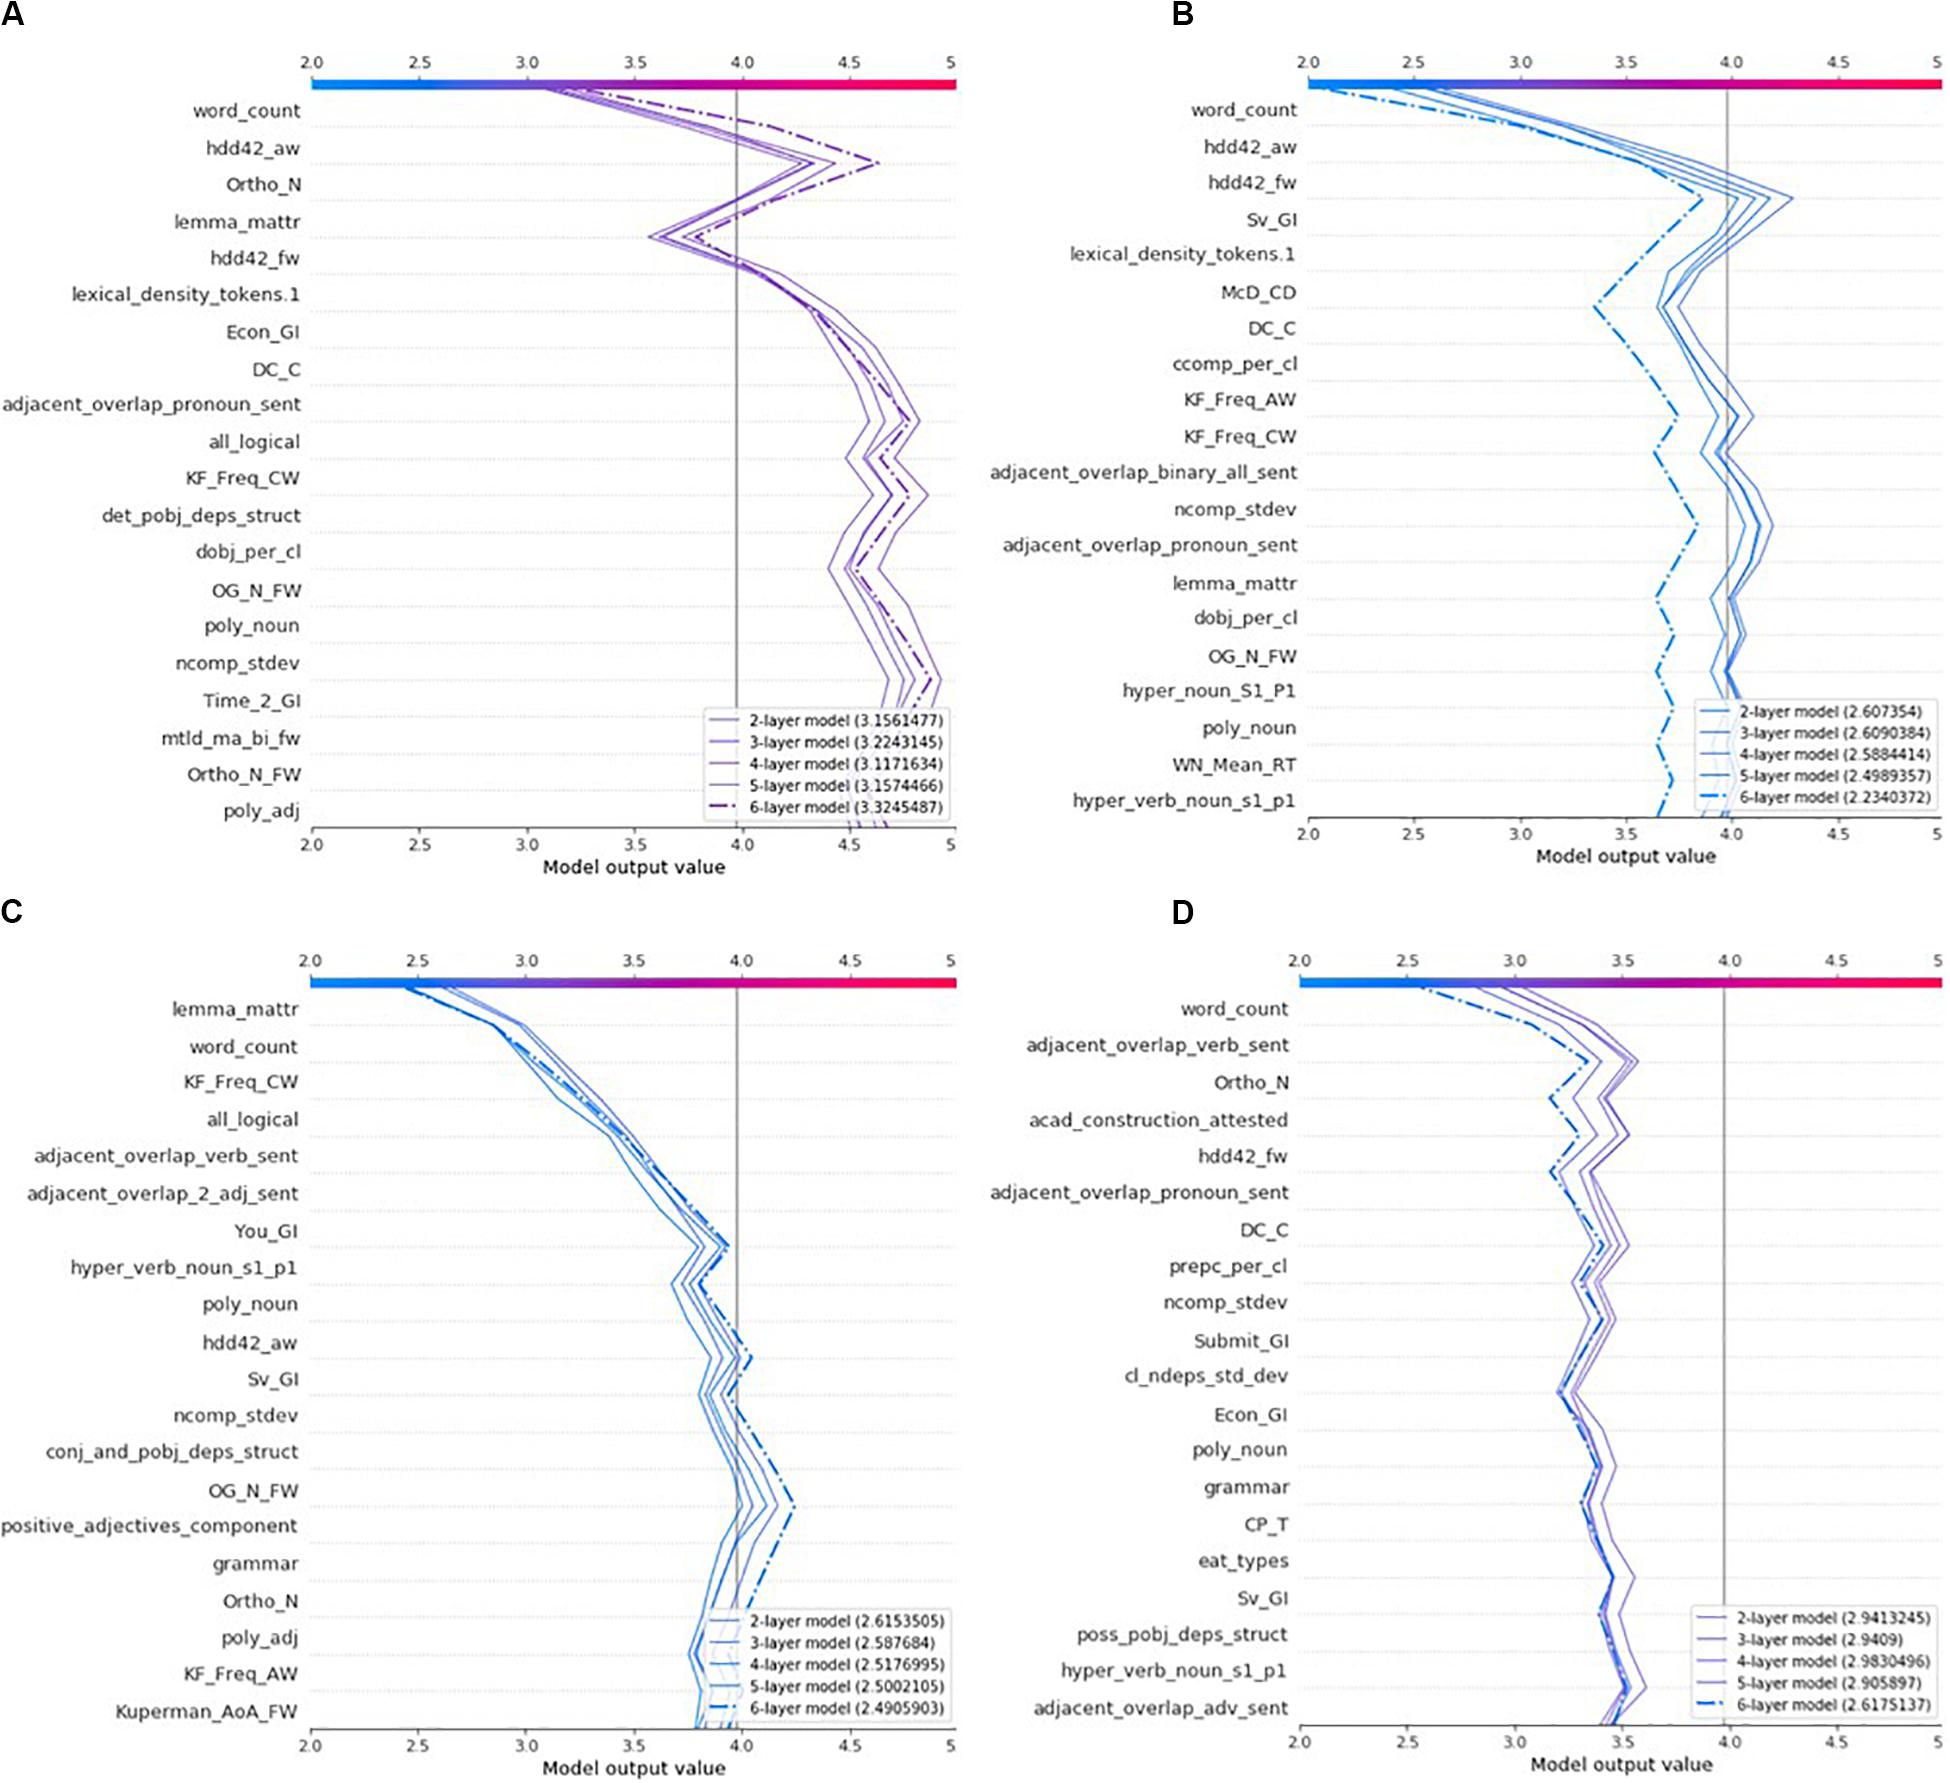
Figure 3. Comparisons of all models’ explanations of the most representative set of four essays: (A) Essay 228, (B) Essay 68, (C) Essay 219, and (D) Essay 124.
Global Explanation: The Summary Plot
It is advantageous to use SHAP to build explanation models because it provides a single framework to discover the writing features that are important to an individual essay (local) or a set of essays (global). While the decision plots list features of local importance, Figure 4’s summary plot ranks writing features by order of global importance (from top to bottom). All testing set’s 314 essays are represented as dots in the scatterplot of each writing feature. The position of a dot on the horizontal axis corresponds to the importance (SHAP value) of the writing feature for a specific essay and its color indicates the magnitude of the feature value in relation to the range of all 314 feature values. For example, large or small numbers of words within an essay generally contribute to increase or decrease rubric scores by up to 1.5 and 1.0, respectively. Decision plots can also be used to find the most important features for a small subset of essays; Figure 5 demonstrates the new ordering of writing indices when aggregating the feature contributions (summing the absolute values of SHAP values) of the four essays in Table 7. Moreover, Figure 5 allows to compare the contributions of a feature to various essays. Note how the orderings in Figures 3−5 can differ from each other, sharing many features of global importance as well as having their own unique features of local importance.
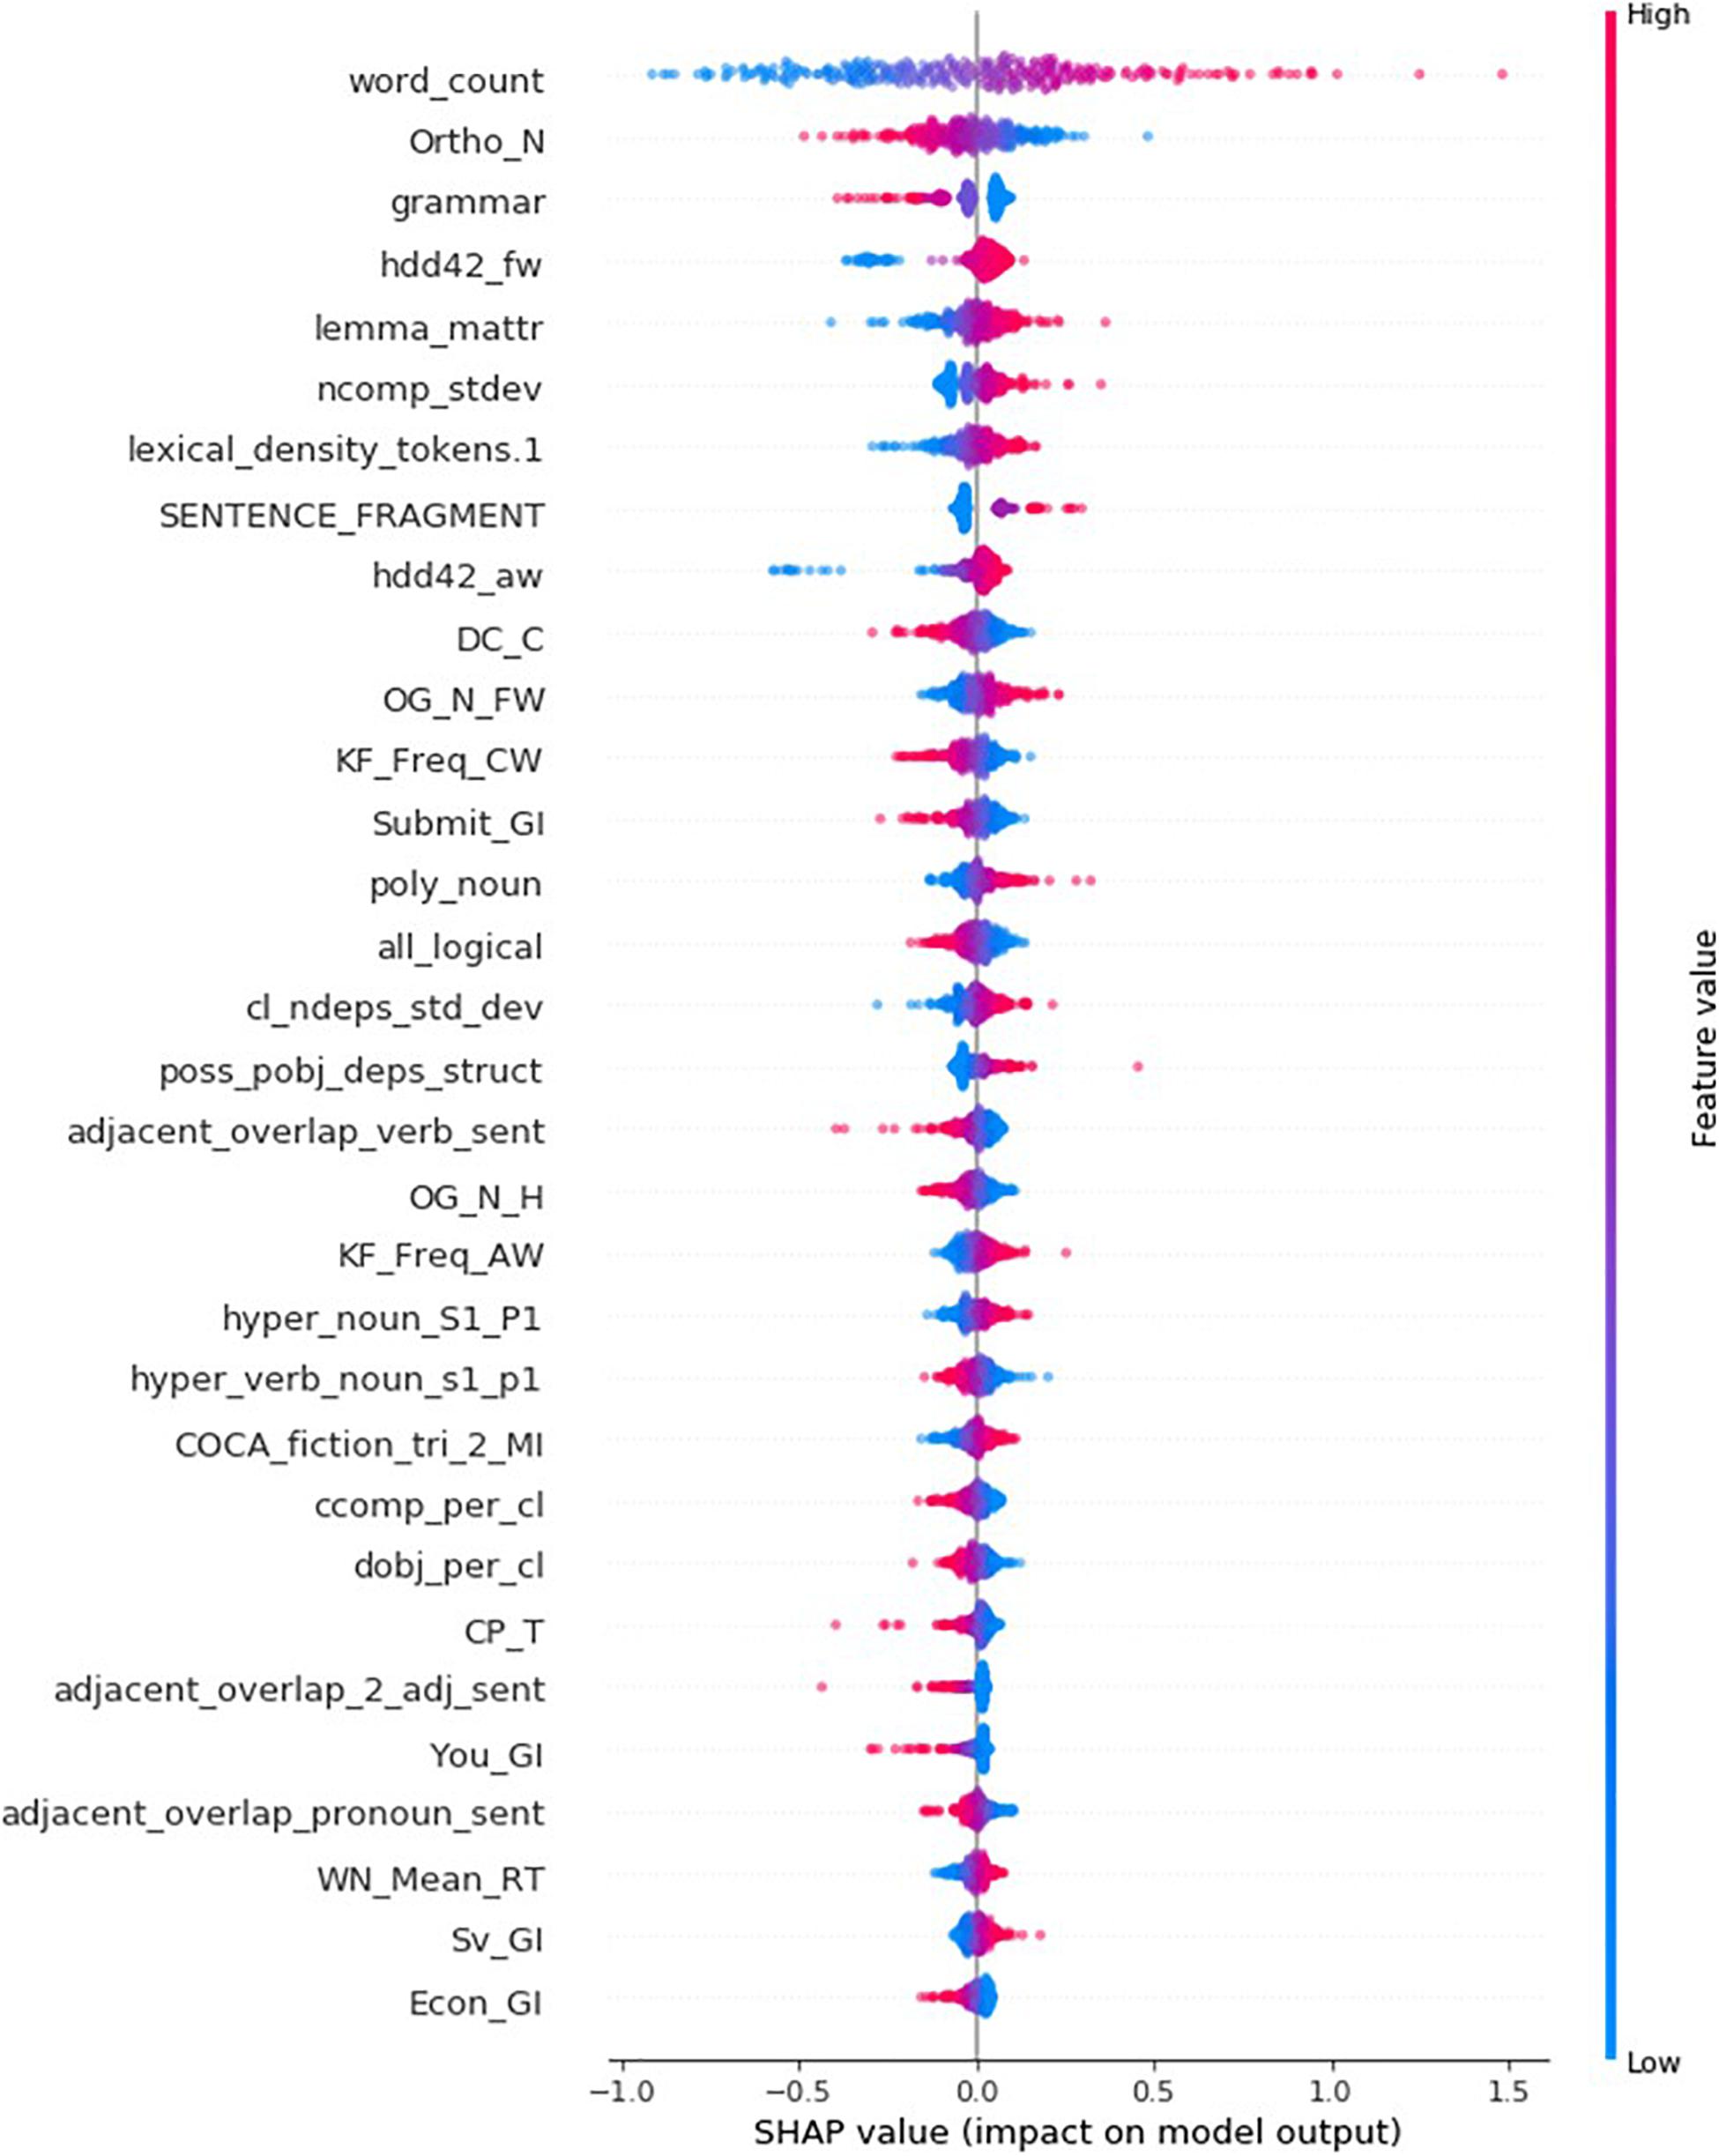
Figure 4. Summary plot listing the 32 most important features globally.
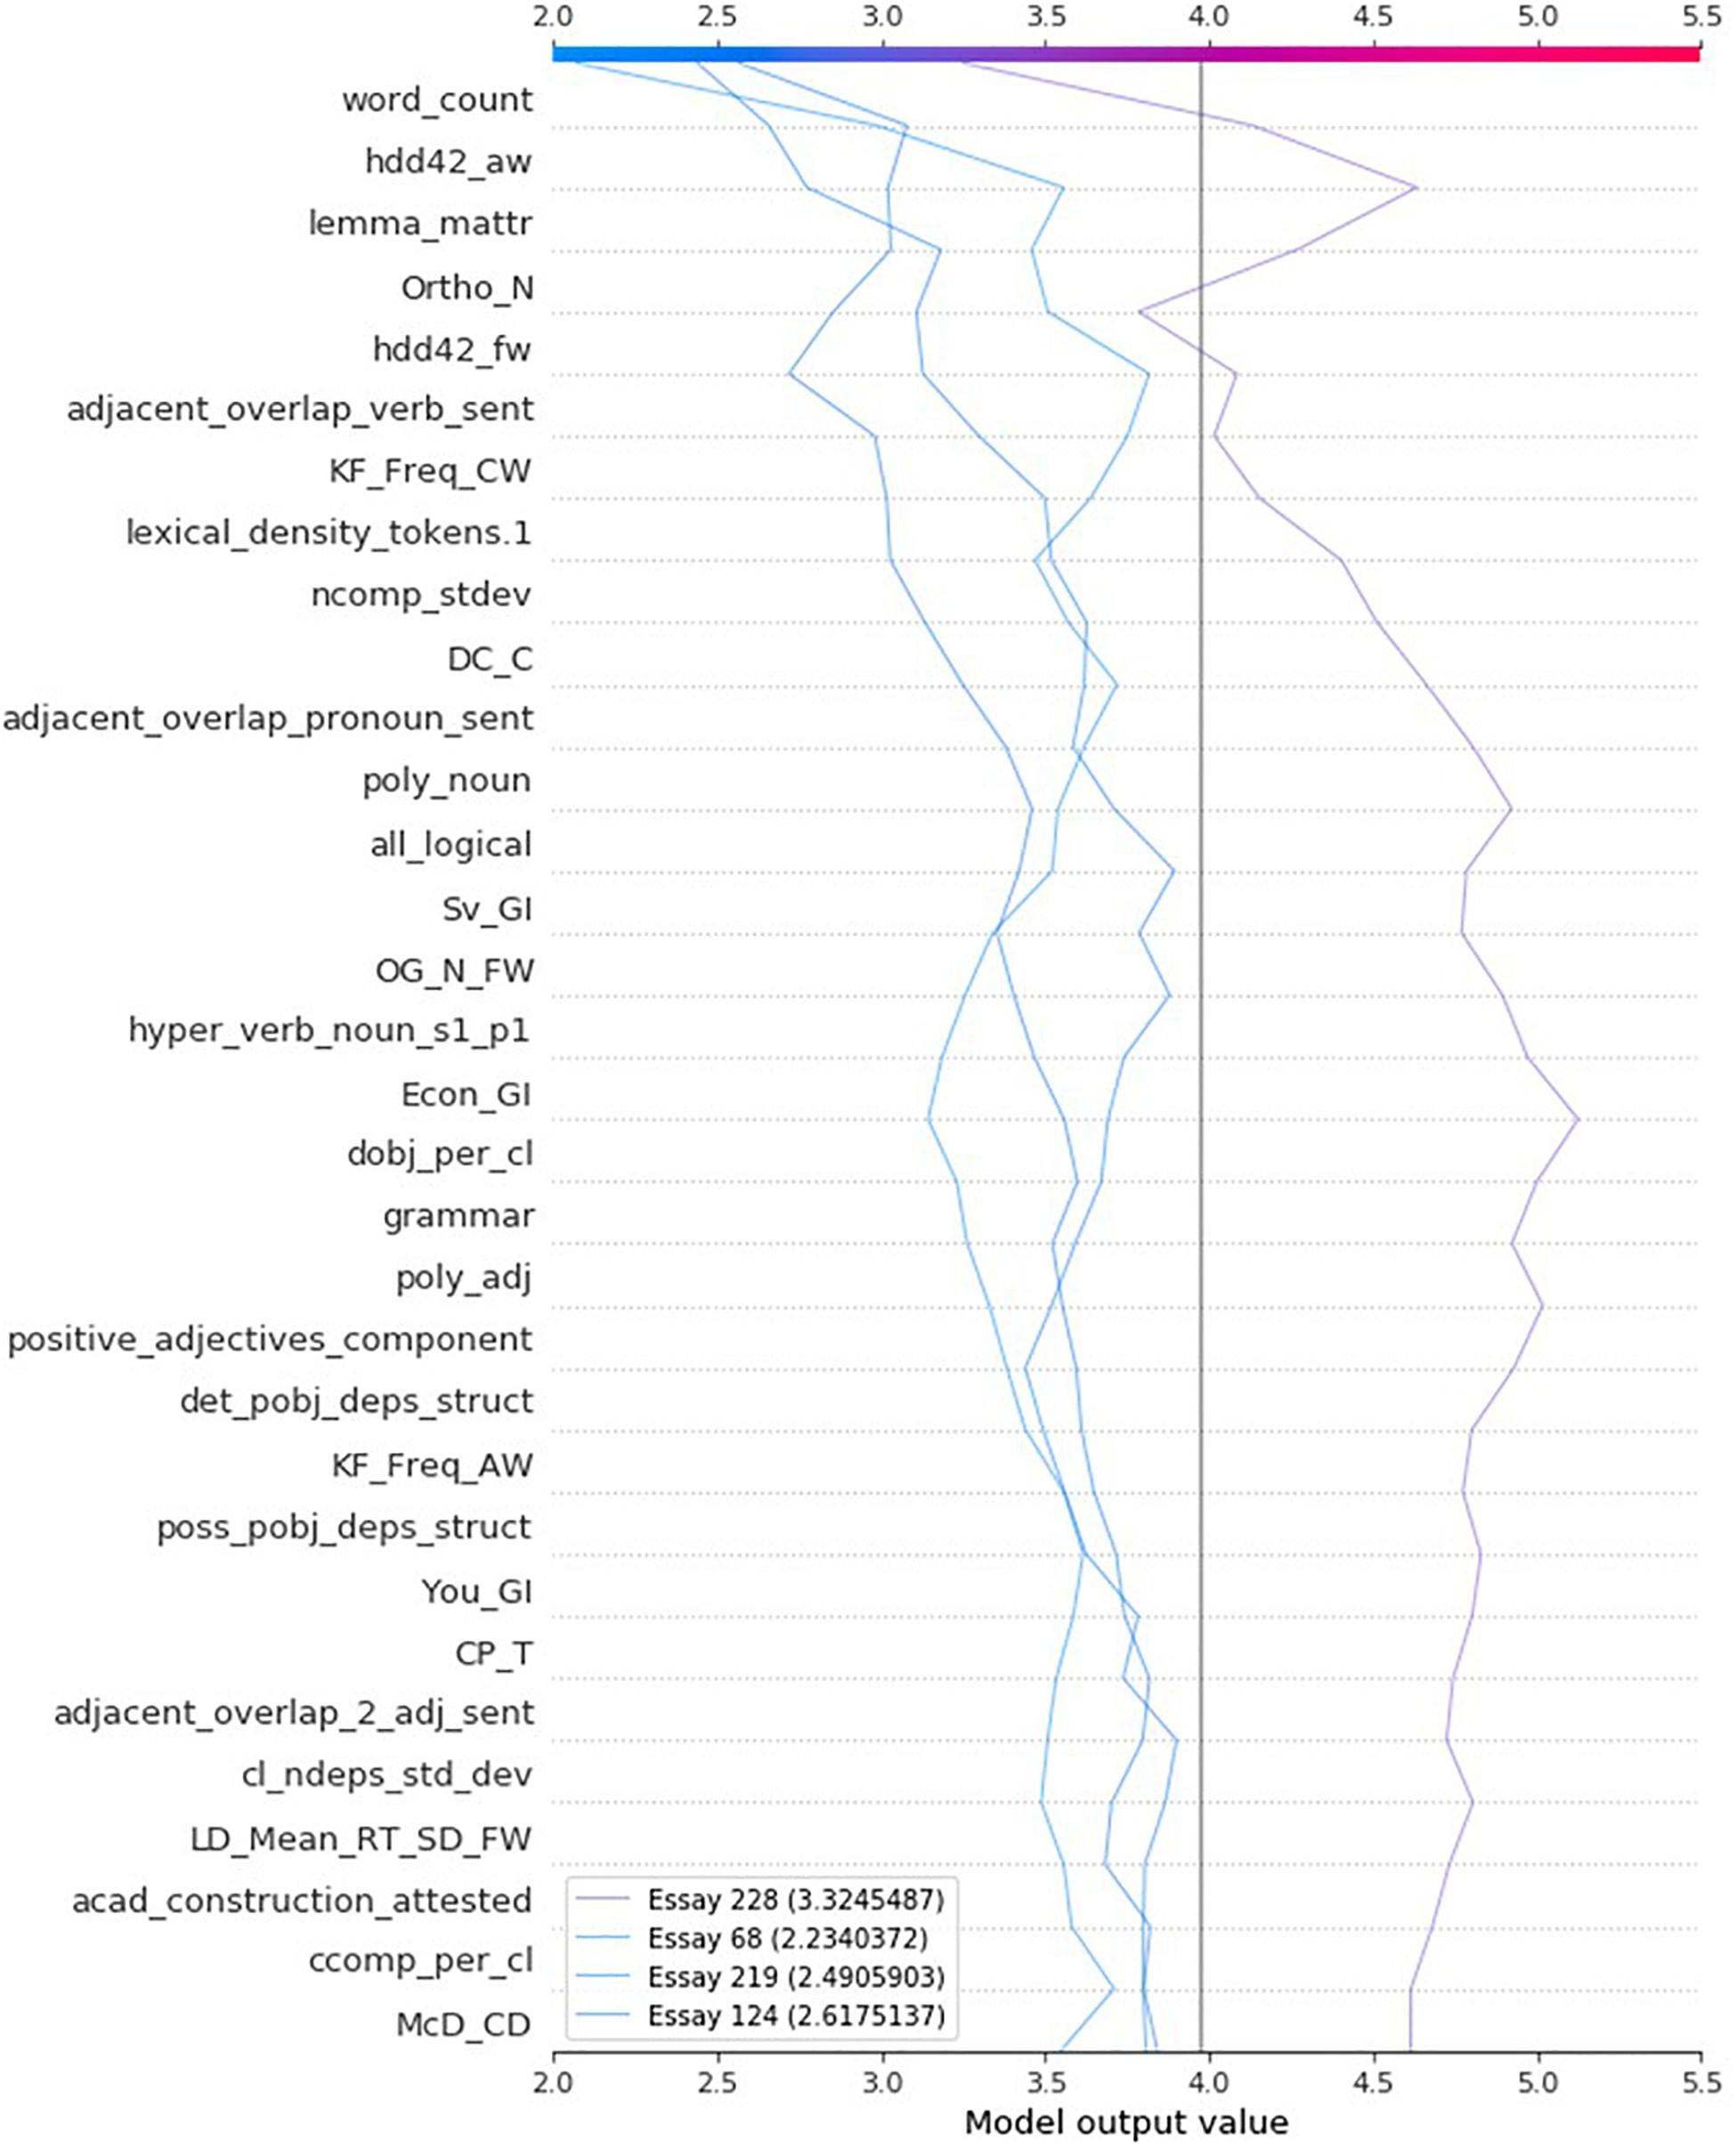
Figure 5. Decision plot delineating the best model’s explanations of Essays 228, 68, 219, and 124 (6-layer ensemble).
Definition of Important Writing Indices
The reader shall understand that it is beyond the scope of this paper to make a thorough description of all writing features. Nevertheless, the summary and decision plots in Figures 4, 5 allow to identify a subset of features that should be examined in order to validate this study’s predictive model. Supplementary Table 1 combines and describes the 38 features in Figures 4, 5.
Dependence Plots
Although the summary plot in Figure 4 is insightful to determine whether small or large feature values are desirable, the dependence plots in Figure 6 prove essential to recommend whether a student should aim at increasing or decreasing the value of a specific writing feature. The dependence plots also reveal whether the student should directly act upon the targeted writing feature or indirectly on other features. The horizontal axis in each of the dependence plots in Figure 6 is the scale of the writing feature and the vertical axis is the scale of the writing feature’s contributions to the predicted rubric scores. Each dot in a dependence plot represents one of the testing set’s 314 essays, that is, the feature value and SHAP value belonging to the essay. The vertical dispersion of the dots on small intervals of the horizontal axis is indicative of interaction with other features (Molnar, 2020). If the vertical dispersion is widespread (e.g., the [50, 100] horizontal-axis interval in the “word_count” dependence plot), then the contribution of the writing feature is most likely at some degree dependent on other writing feature(s).
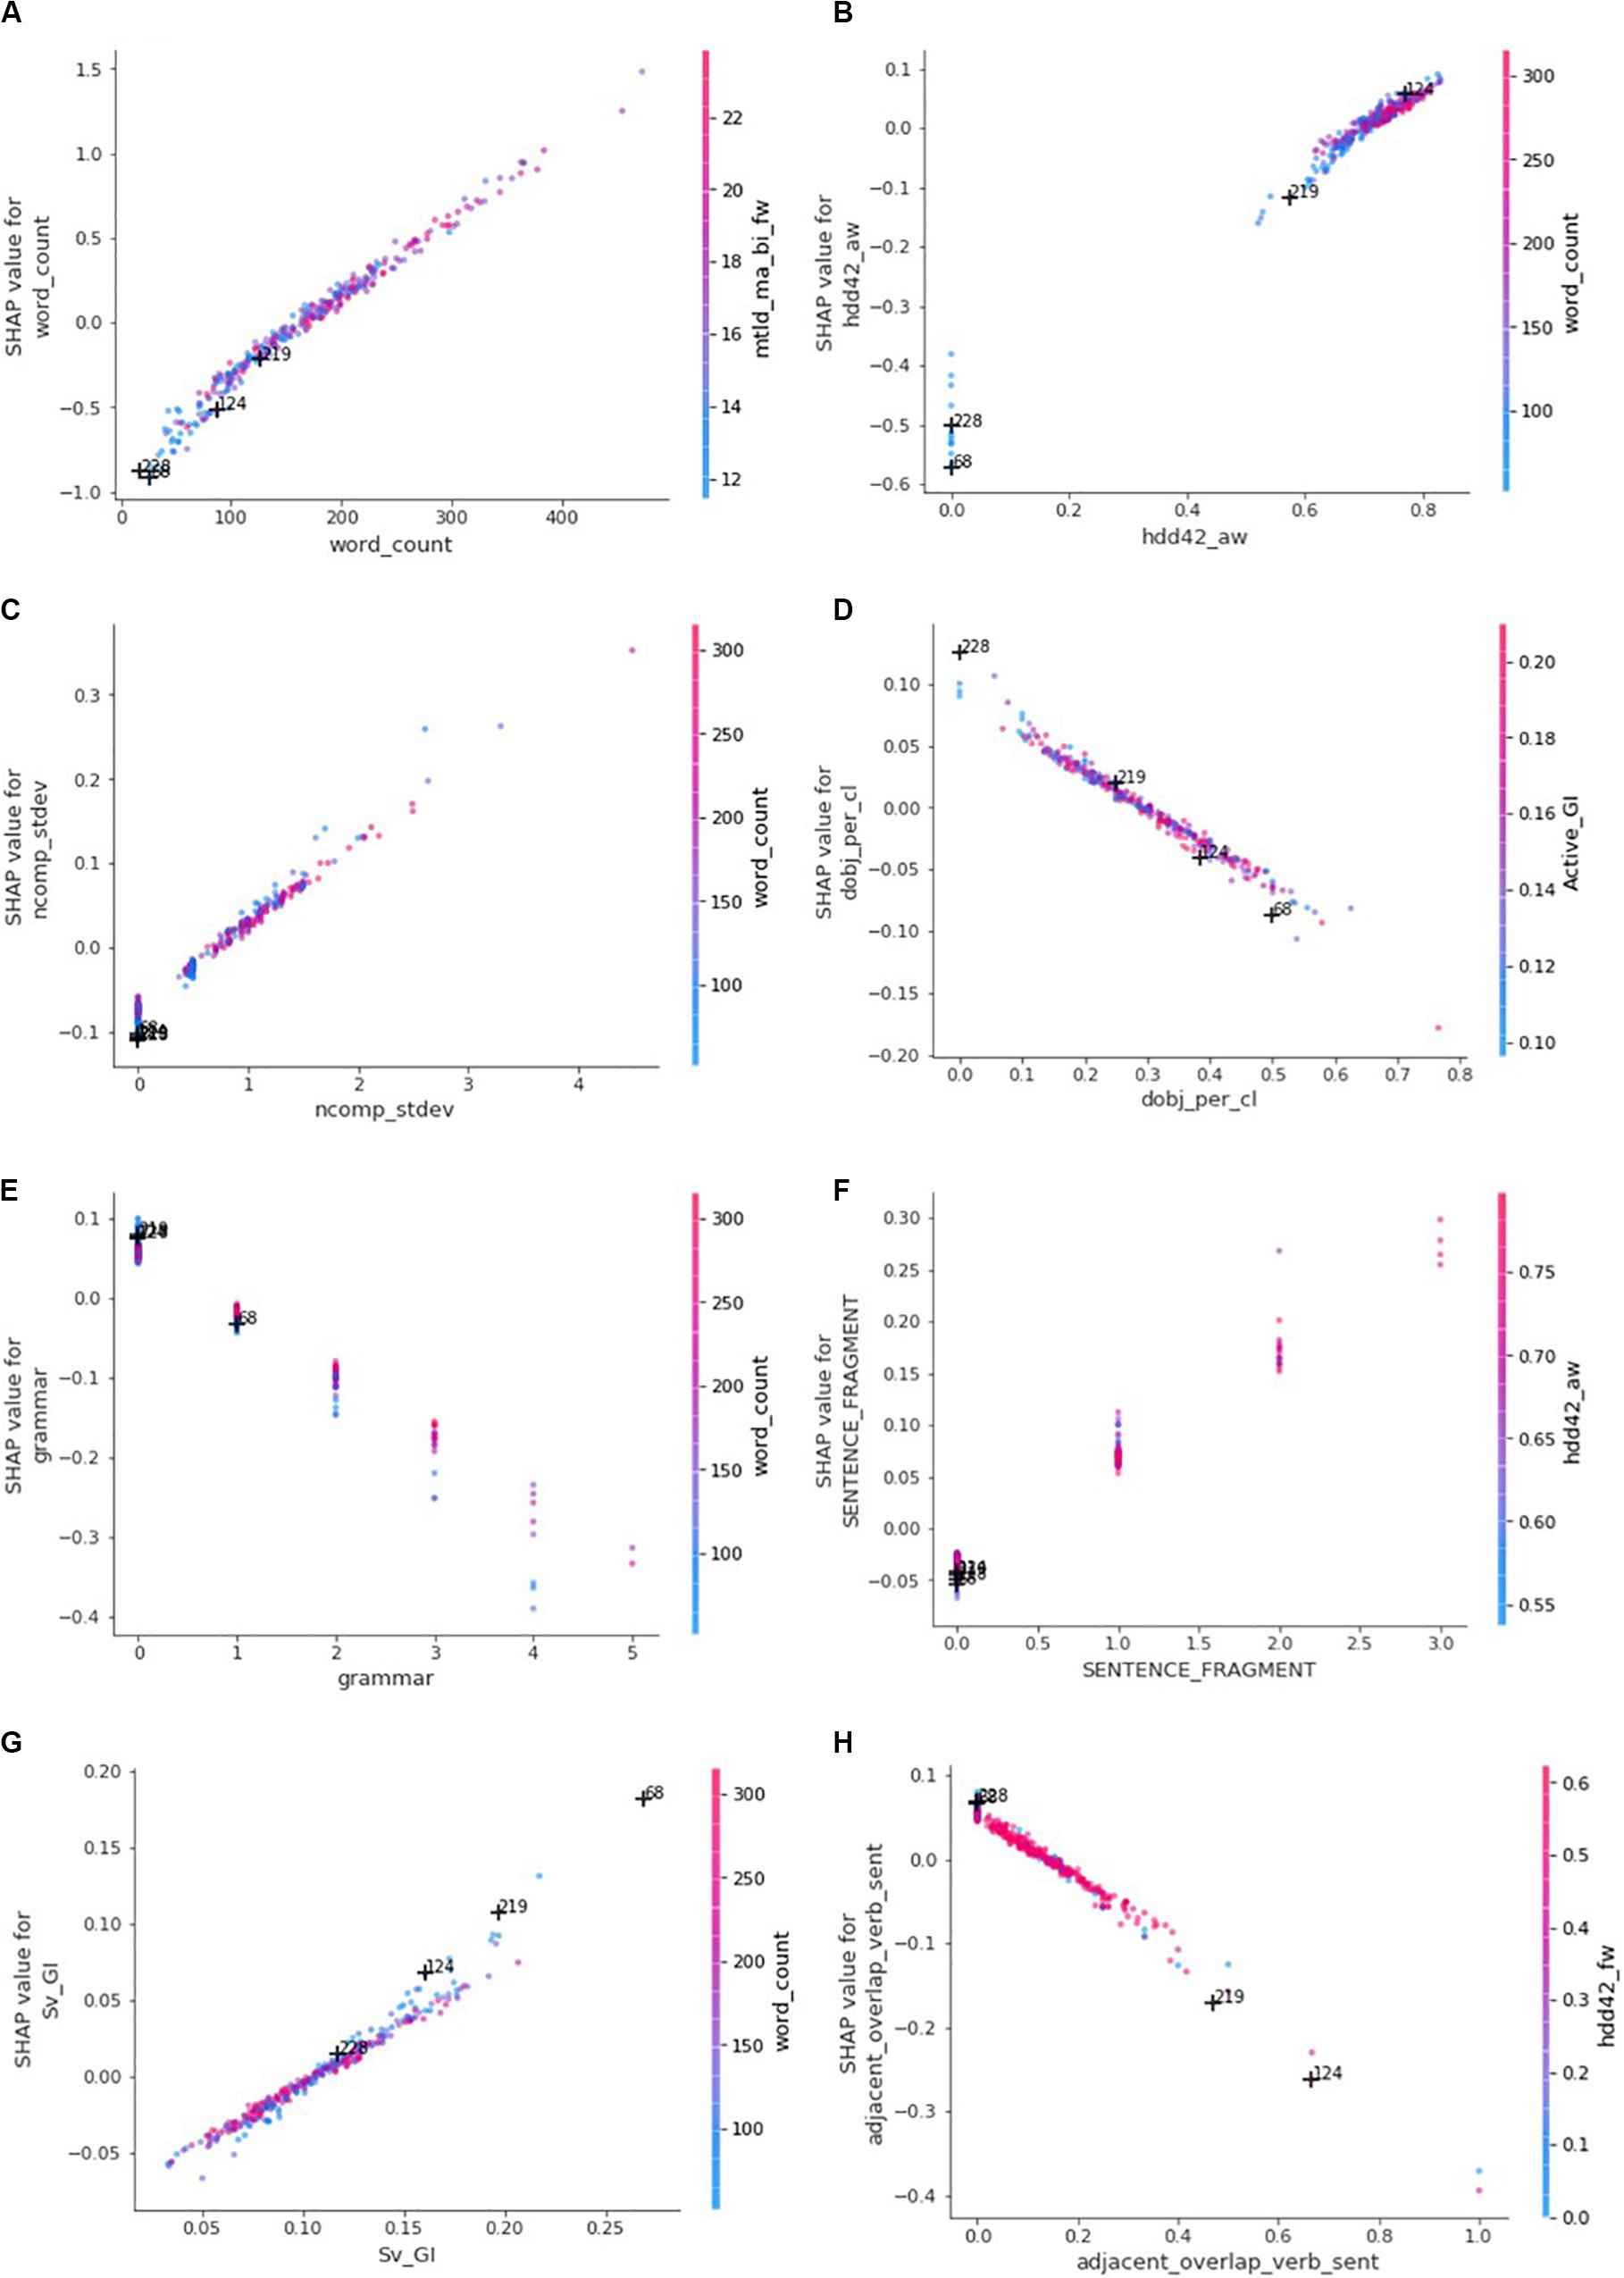
Figure 6. Dependence plots: the horizontal axes represent feature values while vertical axes represent feature contributions (SHAP values). Each dot represents one of the 314 essays of the testing set and is colored according to the value of the feature with which it interacts most strongly. (A) word_count. (B) hdd42_aw. (C) ncomp_stdev. (D) dobj_per_cl. (E) grammar. (F) SENTENCE_FRAGMENT. (G) Sv_GI. (H) adjacent_overlap_verb_sent.
Discussion
The contributions of this paper can be summarized as follows: (1) it proposes a means (SHAP) to explain individual predictions of AES systems and provides flexible guidelines to build powerful predictive models using more complex algorithms such as ensembles and deep learning neural networks; (2) it applies a methodology to quantitatively assess the trustworthiness of explanation models; (3) it tests whether faster SHAP implementations impact the descriptive accuracy of explanation models, giving insight on the applicability of SHAP in real pedagogical contexts such as AES; (4) it offers a toolkit to debug AES models, highlights linguistic intricacies, and underscores the means to offer formative feedback to novice writers; and more importantly, (5) it empowers learning analytics practitioners to make AI pedagogical agents accountable to the human educator, the ultimate problem holder responsible for the decisions and actions of AI (Abbass, 2019). Basically, learning analytics (which encompasses tools such as AES) is characterized as an ethics-bound, semi-autonomous, and trust-enabled human-AI fusion that recurrently measures and proactively advances knowledge boundaries in human learning.
To exemplify this, imagine an AES system that supports instructors in the detection of plagiarism, gaming behaviors, and the marking of writing activities. As previously mentioned, essays are marked according to a grid of scoring rubrics: ideas, organization, style, and conventions. While an abundance of data (e.g., the 1592 writing metrics) can be collected by the AES tool, these data might still be insufficient to automate the scoring process of certain rubrics (e.g., ideas). Nevertheless, some scoring subtasks such as assessing a student’s vocabulary, sentence fluency, and conventions might still be assigned to AI since the data types available through existing automatic linguistic analysis tools prove sufficient to reliably alleviate the human marker’s workload. Interestingly, learning analytics is key for the accountability of AI agents to the human problem holder. As the volume of writing data (through a large student population, high-frequency capture of learning episodes, and variety of big learning data) accumulate in the system, new AI agents (predictive models) may apply for the job of “automarker.” These AI agents can be quite transparent through XAI (Arrieta et al., 2020) explanation models, and a human instructor may assess the suitability of an agent for the job and hire the candidate agent that comes closest to human performance. Explanations derived from these models could serve as formative feedback to the students.
The AI marker can be assigned to assess the writing activities that are similar to those previously scored by the human marker(s) from whom it learns. Dissimilar and unseen essays can be automatically assigned to the human marker for reliable scoring, and the AI agent can learn from this manual scoring. To ensure accountability, students should be allowed to appeal the AI agent’s marking to the human marker. In addition, the human marker should be empowered to monitor and validate the scoring of select writing rubrics scored by the AI marker. If the human marker does not agree with the machine scores, the writing assignments may be flagged as incorrectly scored and re-assigned to a human marker. These flagged assignments may serve to update predictive models. Moreover, among the essays that are assigned to the machine marker, a small subset can be simultaneously assigned to the human marker for continuous quality control; that is, to continue comparing whether the agreement level between human and machine markers remains within an acceptable threshold. The human marker should be at any time able to “fire” an AI marker or “hire” an AI marker from a pool of potential machine markers.
This notion of a human-AI fusion has been observed in previous AES systems where the human marker’s workload has been found to be significantly alleviated, passing from scoring several hundreds of essays to just a few dozen (Dronen et al., 2015; Hellman et al., 2019). As the AES technology matures and as the learning analytics tools continue to penetrate the education market, this alliance of semi-autonomous human and AI agents will lead to better evidence-based/informed pedagogy (Nelson and Campbell, 2017). Such a human-AI alliance can also be guided to autonomously self-regulate its own hypothesis-authoring and data-acquisition processes for purposes of measuring and advancing knowledge boundaries in human learning.
Real-Time Formative Pedagogical Feedback
This paper provides the evidence that deep learning and SHAP can be used not only to score essays automatically but also to offer explanations in real-time. More specifically, the processing time to derive the 314 explanations of the testing set’s essays has been benchmarked for several types of explainers. It was found that the faster DeepSHAP and GradientSHAP implementations, which took only a few seconds of processing, did not produce less accurate explanations than the much slower KernelSHAP. KernelSHAP took approximately 8 h of processing to derive the explanation model of a 2-layer MLP neural network predictive model and 16 h for the 6-layer predictive model.
This finding also holds for various configurations of KernelSHAP, where the number of features (16 vs. 32) shaping the explanation (where all other features are assigned zero contributions) did not produce a statistically significant difference in the reliability of the explanation models. On average, the models had a precision between 63.9 and 64.1% and a recall between 41.0 and 42.9%. This means that after perturbation of the predictive and explanation models, on average 64% of the predictions the explanation model identified as changing were accurate. On the other side, only about 42% of all predictions that changed were detected by the various 2-layer explainers. An explanation was considered as untrustworthy if the sum of its feature contributions, when added to the average prediction (base value), was not within 0.1 from the perturbated prediction. Similarly, the average precision and recall of 2-layer explainers for the 0.25-threshold were about 69% and 62%, respectively.
Impact of Deep Learning on Descriptive Accuracy of Explanations
By analyzing the performance of the various predictive models in Table 4, no clear conclusion can be reached as to which model should be deemed as the most desirable. Despite the fact that the 6-layer models slightly outperform the other models in terms of accuracy (percentage of exact matches between the resolved [human] and predicted [machine] scores), they are not the best when it comes to the percentages of adjacent (within 1 and 2) matches. Nevertheless, if the selection of the “best” model is based on the quadratic weighted kappas, the decision remains a nebulous one to make. Moreover, ensuring that machine learning actually learned something meaningful remains paramount, especially in contexts where the performance of a majority classifier is close to the human and machine performance. For example, a majority classifier model would get 46.3% of predictions accurate (Table 4), while trained predictive models at best produce accurate predictions between 51.9 and 55.1%.
Since the interpretability of a machine learning model should be prioritized over accuracy (Ribeiro et al., 2016; Murdoch et al., 2019) for questions of transparency and trust, this paper investigated whether the impact of the depth of a MLP neural network might be more visible when assessing its interpretability, that is, the trustworthiness of its corresponding SHAP explanation model. The data in Tables 1, 5, 6 effectively support the hypothesis that as the depth of the neural network increases, the precision and recall of the corresponding explanation model improve. Besides, this observation is particularly interesting because the 4-layer (Grad) explainer, which has hardly more parameters than the 2-layer model, is also more accurate than the 2-layer model, suggesting that the 6-layer explainer is most likely superior to other explainers not only because of its greater number of parameters, but also because of its number of hidden layers. By increasing the number of hidden layers, it can be seen that the precision and recall of an explanation model can pass on average from approximately 64 to 73% and from 42 to 52%, respectively, for the 0.10-threshold; and for the 0.25-threshold, from 69 to 79% and from 62 to 75%, respectively.
These results imply that the descriptive accuracy of an explanation model is an evidence of effective machine learning, which may exceed the level of agreement between the human and machine graders. Moreover, given that the superiority of a trained predictive model over a majority classifier is not always obvious, the consistency of its associated explanation model demonstrates this better. Note that theoretically the SHAP explanation model of the majority classifier should assign a zero contribution to each writing feature since the average prediction of such a model is actually the most frequent rubric score given by the human raters; hence, the base value is the explanation.
An interesting fact emerges from Figure 3, that is, all explainers (2-layer to 6-layer) are more or less similar. It appears that they do not contradict each other. More specifically, they all agree on the direction of the contributions of the most important features. In other words, they unanimously determine that a feature should increase or decrease the predicted score. However, they differ from each other on the magnitude of the feature contributions.
To conclude, this study highlights the need to train predictive models that consider the descriptive accuracy of explanations. The idea is that explanation models consider predictions to derive explanations; explanations should be considered when training predictive models. This would not only help train interpretable models the very first time but also potentially break the status quo that may exist among similar explainers to possibly produce more powerful models. In addition, this research calls for a mechanism (e.g., causal diagrams) to allow teachers to guide the training process of predictive models. Put another way, as LA practitioners debug predictive models, their insights should be encoded in a language that will be understood by the machine and that will guide the training process to avoid learning the same errors and to accelerate the training time.
Accountable AES
Now that the superiority of the 6-layer predictive and explanation models has been demonstrated, some aspects of the relevancy of explanations should be examined more deeply, knowing that having an explanation model consistent with its underlying predictive model does not guarantee relevant explanations. Table 7 discloses the set of four essays that optimize the coverage of most globally important features to evaluate the correctness of the best AES model. It is quite intriguing to note that two of the four essays are among the 16 essays that have a major disagreement (off by 2) between the resolved and predicted rubric scores (1 vs. 3 and 4 vs. 2). The AES tool clearly overrated Essay 228, while it underrated Essay 219. Naturally, these two essays offer an opportunity to understand what is wrong with the model and ultimately debug the model to improve its accuracy and interpretability.
In particular, Essay 228 raises suspicion on the positive contributions of features such as “Ortho_N,” “lemma_mattr,” “all_logical,” “det_pobj_deps_struct,” and “dobj_per_cl.” Moreover, notice how the remaining 262 less important features (not visible in the decision plot in Figure 5) have already inflated the rubric score beyond the base value, more than any other essay. Given the very short length and very low quality of the essay, whose meaning is seriously undermined by spelling and grammatical errors, it is of utmost importance to verify how some of these features are computed. For example, is the average number of orthographic neighbors (Ortho_N) per token computed for unmeaningful tokens such as “R” and “whe”? Similarly, are these tokens considered as types in the type-token ratio over lemmas (lemma_mattr)? Given the absence of a meaningful grammatical structure conveying a complete idea through well-articulated words, it becomes obvious that the quality of NLP (natural language processing) parsing may become a source of (measurement) bias impacting both the way some writing features are computed and the predicted rubric score. To remedy this, two solutions are proposed: (1) enhancing the dataset with the part-of-speech sequence or the structure of dependency relationships along with associated confidence levels, or (2) augmenting the essay dataset with essays enclosing various types of non-sensical content to improve the learning of these feature contributions.
Note that all four essays have a text length smaller than the average: 171 words. Notice also how the “hdd42_aw” and “hdd42_fw” play a significant role to decrease the predicted score of Essays 228 and 68. The reader should note that these metrics require a minimum of 42 tokens in order to compute a non-zero D index, a measure of lexical diversity as explained in Supplementary Table 1. Figure 6B also shows how zero “hdd42_aw” values are heavily penalized. This is extra evidence that supports the strong role that the number of words plays in determining these rubric scores, especially for very short essays where it is one of the few observations that can be reliably recorded.
Two other issues with the best trained AES model were identified. First, in the eyes of the model, the lowest the average number of direct objects per clause (dobj_per_cl), as seen in Figure 6D, the best it is. This appears to contradict one of the requirements of the “Style” rubric, which looks for a variety of sentence structures. Remember that direct objects imply the presence of transitive verbs (action verbs) and that the balanced usage of linking verbs and action verbs as well as of transitive and intransitive verbs is key to meet the requirement of variety of sentence structures. Moreover, note that the writing feature is about counting the number of direct objects per clause, not by sentence. Only one direct object is therefore possible per clause. On the other side, a sentence may contain several clauses, which determines if the sentence is a simple, compound, or a complex sentence. This also means that a sentence may have multiple direct objects and that a high ratio of direct objects per clause is indicative of sentence complexity. Too much complexity is also undesirable. Hence, it is fair to conclude that the higher range of feature values has reasonable feature contributions (SHAP values), while the lower range does not capture well the requirements of the rubric. The dependence plot should rather display a positive peak somewhere in the middle. Notice how the poor quality of Essay 228’s single sentence prevented the proper detection of the single direct object, “broke my finger,” and the so-called absence of direct objects was one of the reasons to wrongfully improve the predicted rubric score.
The model’s second issue discussed here is the presence of sentence fragments, a type of grammatical errors. Essentially, a sentence fragment is a clause that misses one of three critical components: a subject, a verb, or a complete idea. Figure 6E shows the contribution model of grammatical errors, all types combined, while Figure 6F shows specifically the contribution model of sentence fragments. It is interesting to see how SHAP further penalizes larger numbers of grammatical errors and that it takes into account the length of the essay (red dots represent essays with larger numbers of words; blue dots represent essays with smaller numbers of words). For example, except for essays with no identified grammatical errors, longer essays are less penalized than shorter ones. This is particularly obvious when there are 2−4 grammatical errors. The model increases the predicted rubric score only when there is no grammatical error. Moreover, the model tolerates longer essays with only one grammatical error, which sounds quite reasonable. On the other side, the model finds desirable high numbers of sentence fragments, a non-trivial type of grammatical errors. Even worse, the model decreases the rubric score of essays having no sentence fragment. Although grammatical issues are beyond the scope of the “Style” rubric, the model has probably included these features because of their impact on the quality of assessment of vocabulary usage and sentence fluency. The reader should observe how the very poor quality of an essay can even prevent the detection of such fundamental grammatical errors such as in the case of Essay 228, where the AES tool did not find any grammatical error or sentence fragment. Therefore, there should be a way for AES systems to detect a minimum level of text quality before attempting to score an essay. Note that the objective of this section was not to undertake thorough debugging of the model, but rather to underscore the effectiveness of SHAP in doing so.
Formative Feedback
Once an AES model is considered reasonably valid, SHAP can be a suitable formalism to empower the machine to provide formative feedback. For instance, the explanation of Essay 124, which has been assigned a rubric score of 3 by both human and machine markers, indicates that the top two factors contributing to decreasing the predicted rubric score are: (1) the essay length being smaller than average, and (2) the average number of verb lemma types occurring at least once in the next sentence (adjacent_overlap_verb_sent). Figures 6A,H give the overall picture in which the realism of the contributions of these two features can be analyzed. More specifically, Essay 124 is one of very few essays (Figure 6H) that makes redundant usage of the same verbs across adjacent sentences. Moreover, the essay displays poor sentence fluency where everything is only expressed in two sentences. To understand more accurately the impact of “adjacent_overlap_verb_sent” on the prediction, a few spelling errors have been corrected and the text has been divided in four sentences instead of two. Revision 1 in Table 8 exhibits the corrections made to the original essay. The decision plot’s dashed line in Figure 3D represents the original explanation of Essay 124, while Figure 7A demonstrates the new explanation of the revised essay. It can be seen that the “adjacent_overlap_verb_sent” feature is still the second most important feature in the new explanation of Essay 124, with a feature value of 0.429, still considered as very poor according to the dependence plot in Figure 6H.
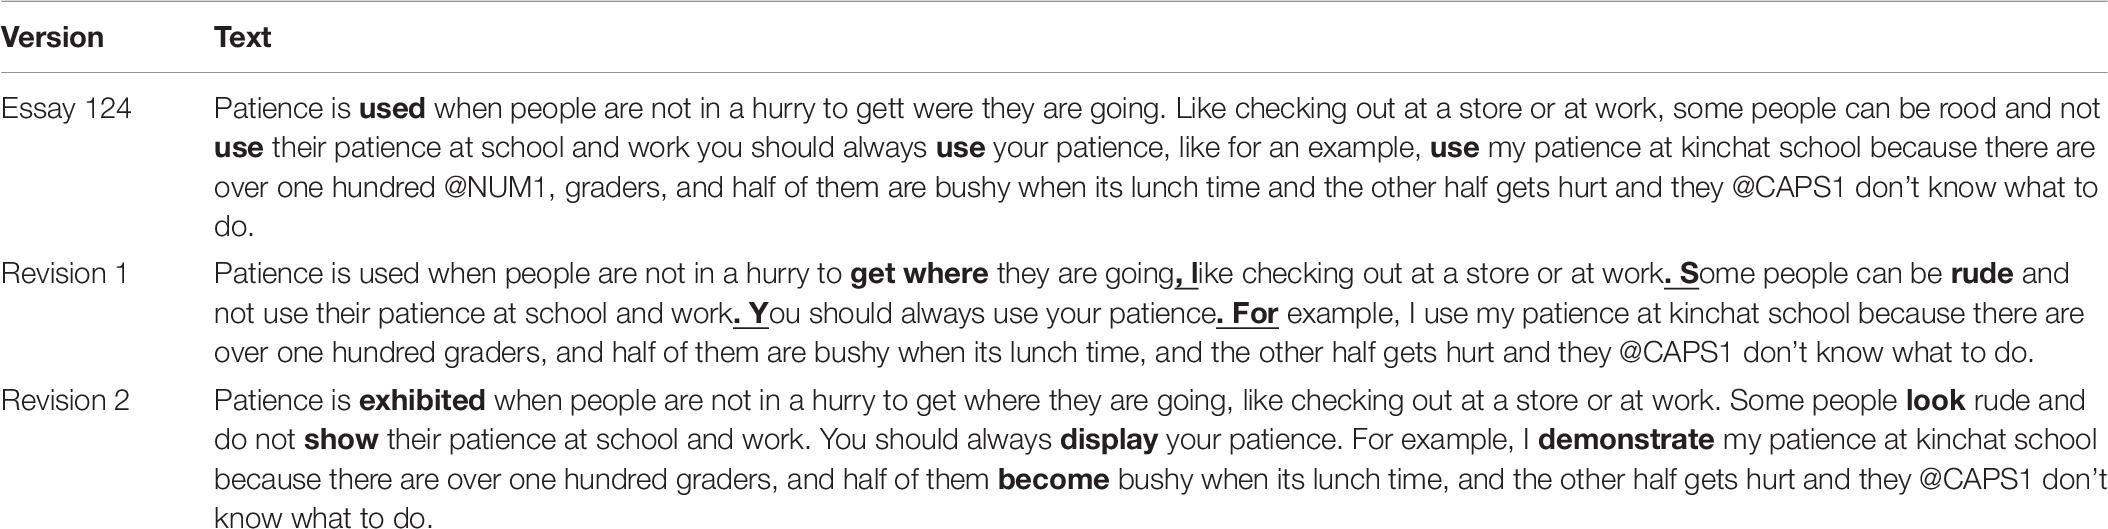
Table 8. Revisions of Essay 124: improvement of sentence splitting, correction of some spelling errors, and elimination of redundant usage of same verbs (bold for emphasis in Essay 124’s original version; corrections in bold for Revisions 1 and 2).
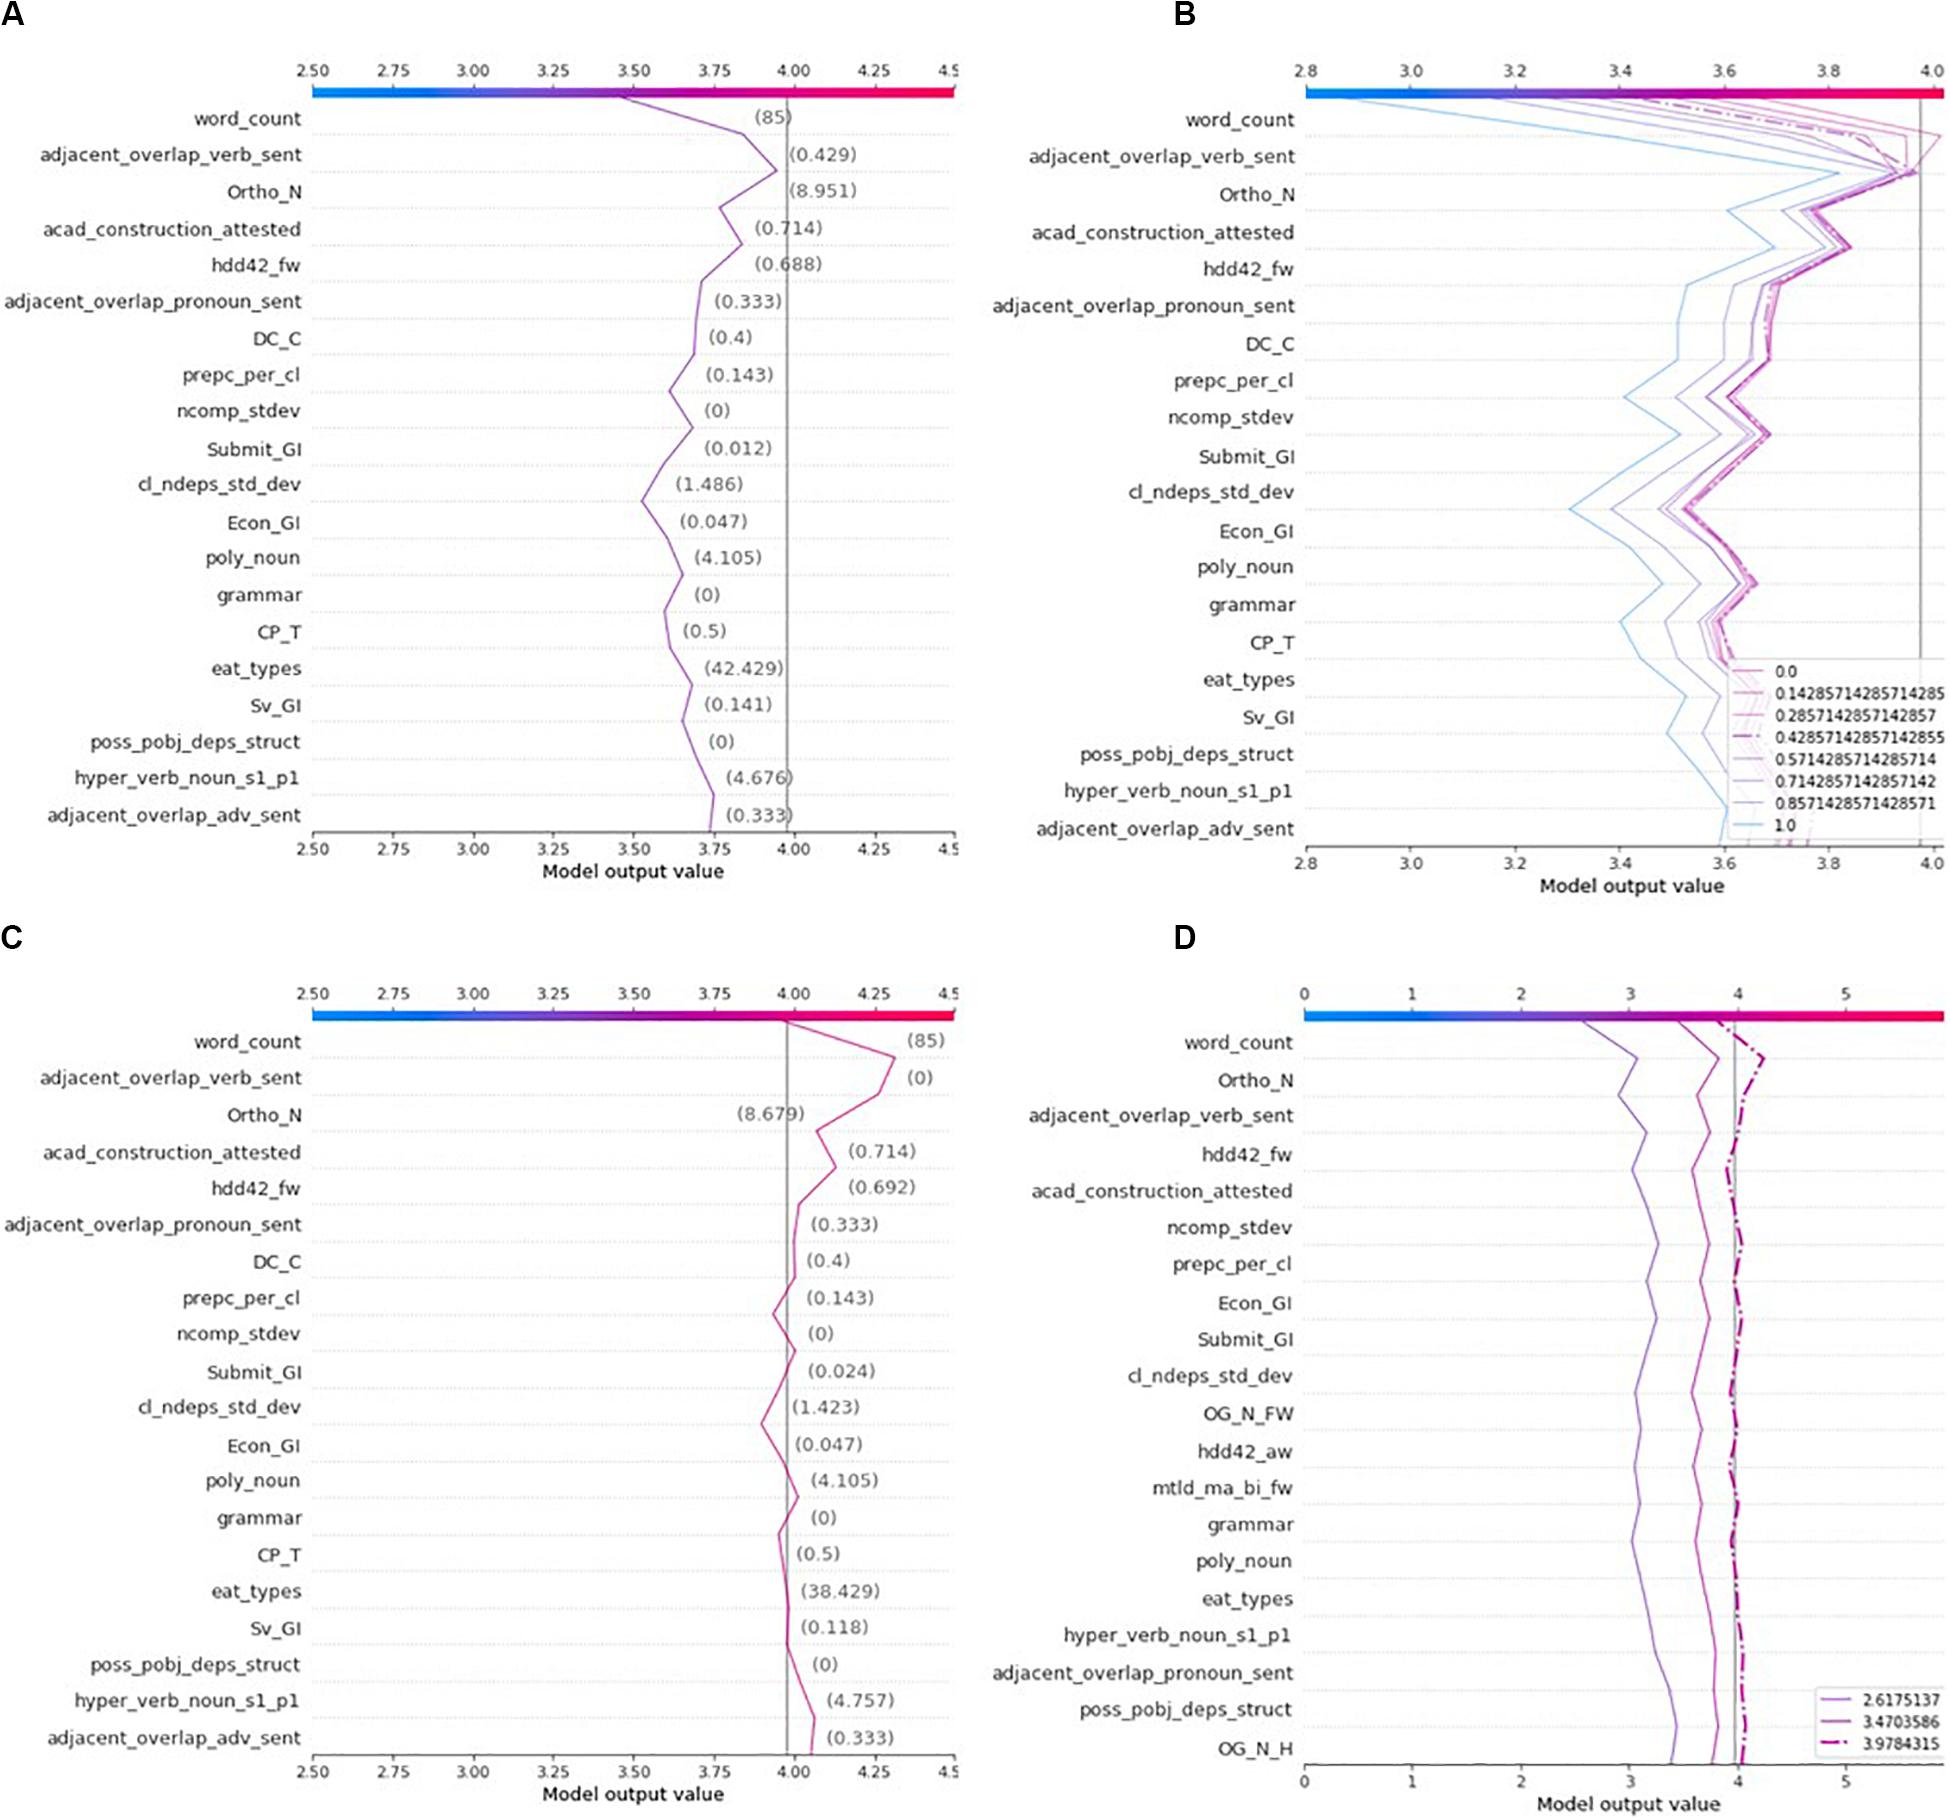
Figure 7. Explanations of the various versions of Essay 124 and evaluation of feature effect for a range of feature values. (A) Explanation of Essay 124’s first revision. (B) Forecasting the effect of changing the ‘adjacent_overlap_verb_sent’ feature on the rubric score. (C) Explanation of Essay 124’s second revision. (D) Comparison of the explanations of all Essay 124’s versions.
To show how SHAP could be leveraged to offer remedial formative feedback, the revised version of Essay 124 will be explained again for eight different values of “adjacent_overlap_verb_sent” (0, 0.143, 0.286, 0.429, 0.571, 0.714, 0.857, 1.0), while keeping the values of all other features constant. The set of these eight essays are explained by a newly trained SHAP explainer (Gradient), producing new SHAP values for each feature and each “revised” essay. Notice how the new model, called the feedback model, allows to foresee by how much a novice writer can hope to improve his/her score according to the “Style” rubric. If the student employs different verbs at every sentence, the feedback model estimates that the rubric score could be improved from 3.47 up to 3.65 (Figure 7B). Notice that the dashed line represents Revision 1, while other lines simulate one of the seven other altered essays. Moreover, it is important to note how changing the value of a single feature may influence the contributions that other features may have on the predicted score. Again, all explanations look similar in terms of direction, but certain features differ in terms of the magnitude of their contributions. However, the reader should observe how the targeted feature varies not only in terms of magnitude, but also of direction, allowing the student to ponder the relevancy of executing the recommended writing strategy.
Thus, upon receiving this feedback, assume that a student sets the goal to improve the effectiveness of his/her verb choice by eliminating any redundant verb, producing Revision 2 in Table 8. The student submits his essay again to the AES system, which finally gives a new rubric score of 3.98, a significant improvement from the previous 3.47, allowing the student to get a 4 instead of a 3. Figure 7C exhibits the decision plot of Revision 2. To better observe how the various revisions of the student’s essay changed over time, their respective explanations have been plotted in the same decision plot (Figure 7D). Notice this time that the ordering of the features has changed to list the features of common importance to all of the essay’s versions. The feature ordering in Figures 7A−C complies with the same ordering as in Figure 3D, the decision plot of the original essay. These figures underscore the importance of tracking the interaction between the various features so that the model understands well the impact that changing one feature has on the others. TreeSHAP, an implementation for tree-based models, offers this capability and its potential on improving the quality of feedback provided to novice writers will be tested in a future version of this AES system.
Conclusion
This paper serves as a proof of concept of the applicability of XAI techniques in automated essay scoring, providing learning analytics practitioners and educators with a methodology on how to “hire” AI markers and make them accountable to their human counterparts. In addition to debug predictive models, SHAP explanation models can serve as some formalism of a broader learning analytics platform, where aspects of prescriptive analytics (provision of remedial formative feedback) can be added on top of the more pervasive predictive analytics.
However, the main weakness of the approach put forward in this paper consists in omitting many types of spatio-temporal data. In other words, it ignores precious information inherent to the writing process, which may prove essential to guess the intent of the student, especially in contexts of poor sentence structures and high grammatical inaccuracy. Hence, this paper calls for adapting current NLP technologies to educational purposes, where the quality of writing may be suboptimal, which is contrary to many utopian scenarios where NLP is used for content analysis, opinion mining, topic modeling, or fact extraction trained on corpora of high-quality texts. By capturing the writing process preceding a submission of an essay to an AES tool, other kinds of explanation models can also be trained to offer feedback not only from a linguistic perspective but also from a behavioral one (e.g., composing vs. revising); that is, the AES system could inform novice writers about suboptimal and optimal writing strategies (e.g., planning a revision phase after bursts of writing).
In addition, associating sections of text with suboptimal writing features, those whose contributions lower the predicted score, would be much more informative. This spatial information would not only allow to point out what is wrong and but also where it is wrong, answering more efficiently the question why an essay is wrong. This problem could be simply approached through a multiple-inputs and mixed-data feature-based (MLP) neural network architecture fed by both linguistic indices and textual data (n-grams), where the SHAP explanation model would assign feature contributions to both types of features and any potential interaction between them. A more complex approach could address the problem through special types of recurrent neural networks such as Ordered-Neurons LSTMs (long short-term memory), which are well adapted to the parsing of natural language, and where the natural sequence of text is not only captured but also its hierarchy of constituents (Shen et al., 2018). After all, this paper highlights the fact that the potential of deep learning can reach beyond the training of powerful predictive models and be better visible in the higher trustworthiness of explanation models. This paper also calls for optimizing the training of predictive models by considering the descriptive accuracy of explanations and the human expert’s qualitative knowledge (e.g., indicating the direction of feature contributions) during the training process.
Data Availability Statement
The datasets and code of this study can be found in these Open Science Framework’s online repositories: https://osf.io/fxvru/.
Author Contributions
VK architected the concept of an ethics-bound, semi-autonomous, and trust-enabled human-AI fusion that measures and advances knowledge boundaries in human learning, which essentially defines the key traits of learning analytics. DB was responsible for its implementation in the area of explainable automated essay scoring and for the training and validation of the predictive and explanation models. Together they offer an XAI-based proof of concept of a prescriptive model that can offer real-time formative remedial feedback to novice writers. Both authors contributed to the article and approved its publication.
Funding
Research reported in this article was supported by the Academic Research Fund (ARF) publication grant of Athabasca University under award number (24087).
Conflict of Interest
The authors declare that the research was conducted in the absence of any commercial or financial relationships that could be construed as a potential conflict of interest.
Supplementary Material
The Supplementary Material for this article can be found online at: https://www.frontiersin.org/articles/10.3389/feduc.2020.572367/full#supplementary-material
Footnotes
References
Abbass, H. A. (2019). Social integration of artificial intelligence: functions, automation allocation logic and human-autonomy trust. Cogn. Comput. 11, 159–171. doi: 10.1007/s12559-018-9619-0
Adadi, A., and Berrada, M. (2018). Peeking inside the black-box: a survey on explainable artificial intelligence (XAI). IEEE Access 6, 52138–52160. doi: 10.1109/ACCESS.2018.2870052
Amorim, E., Cançado, M., and Veloso, A. (2018). “Automated essay scoring in the presence of biased ratings,” in Proceedings of the 2018 Conference of the North American Chapter of the Association for Computational Linguistics: Human Language Technologies, New Orleans, LA, 229–237.
Arrieta, A. B., Díaz-Rodríguez, N., Ser, J., Del Bennetot, A., Tabik, S., Barbado, A., et al. (2020). Explainable Artificial Intelligence (XAI): concepts, taxonomies, opportunities and challenges toward responsible AI. Inform. Fusion 58, 82–115. doi: 10.1016/j.inffus.2019.12.012
Balota, D. A., Yap, M. J., Hutchison, K. A., Cortese, M. J., Kessler, B., Loftis, B., et al. (2007). The English lexicon project. Behav. Res. Methods 39, 445–459. doi: 10.3758/BF03193014
Boulanger, D., and Kumar, V. (2018). “Deep learning in automated essay scoring,” in Proceedings of the International Conference of Intelligent Tutoring Systems, eds R. Nkambou, R. Azevedo, and J. Vassileva (Cham: Springer International Publishing), 294–299. doi: 10.1007/978-3-319-91464-0_30
Boulanger, D., and Kumar, V. (2019). “Shedding light on the automated essay scoring process,” in Proceedings of the International Conference on Educational Data Mining, 512–515.
Boulanger, D., and Kumar, V. (2020). “SHAPed automated essay scoring: explaining writing features’ contributions to English writing organization,” in Intelligent Tutoring Systems, eds V. Kumar and C. Troussas (Cham: Springer International Publishing), 68–78. doi: 10.1007/978-3-030-49663-0_10
Chen, H., Lundberg, S., and Lee, S.-I. (2019). Explaining models by propagating Shapley values of local components. arXiv [Preprint]. Available online at: https://arxiv.org/abs/1911.11888 (accessed September 22, 2020).
Crossley, S. A., Bradfield, F., and Bustamante, A. (2019). Using human judgments to examine the validity of automated grammar, syntax, and mechanical errors in writing. J. Writ. Res. 11, 251–270. doi: 10.17239/jowr-2019.11.02.01
Crossley, S. A., Kyle, K., and McNamara, D. S. (2016). The tool for the automatic analysis of text cohesion (TAACO): automatic assessment of local, global, and text cohesion. Behav. Res. Methods 48, 1227–1237. doi: 10.3758/s13428-015-0651-7
Crossley, S. A., Kyle, K., and McNamara, D. S. (2017). Sentiment analysis and social cognition engine (SEANCE): an automatic tool for sentiment, social cognition, and social-order analysis. Behav. Res. Methods 49, 803–821. doi: 10.3758/s13428-016-0743-z
Dronen, N., Foltz, P. W., and Habermehl, K. (2015). “Effective sampling for large-scale automated writing evaluation systems,” in Proceedings of the Second (2015) ACM Conference on Learning @ Scale, 3–10.
Goldin, I., Narciss, S., Foltz, P., and Bauer, M. (2017). New directions in formative feedback in interactive learning environments. Int. J. Artif. Intellig. Educ. 27, 385–392. doi: 10.1007/s40593-016-0135-7
Hao, Q., and Tsikerdekis, M. (2019). “How automated feedback is delivered matters: formative feedback and knowledge transfer,” in Proceedings of the 2019 IEEE Frontiers in Education Conference (FIE), Covington, KY, 1–6.
Hellman, S., Rosenstein, M., Gorman, A., Murray, W., Becker, L., Baikadi, A., et al. (2019). “Scaling up writing in the curriculum: batch mode active learning for automated essay scoring,” in Proceedings of the Sixth (2019) ACM Conference on Learning @ Scale, (New York, NY: Association for Computing Machinery).
Hussein, M. A., Hassan, H., and Nassef, M. (2019). Automated language essay scoring systems: a literature review. PeerJ Comput. Sci. 5:e208. doi: 10.7717/peerj-cs.208
Kumar, V., and Boulanger, D. (2020). Automated essay scoring and the deep learning black box: how are rubric scores determined? Int. J. Artif. Intellig. Educ. doi: 10.1007/s40593-020-00211-5
Kumar, V., Fraser, S. N., and Boulanger, D. (2017). Discovering the predictive power of five baseline writing competences. J. Writ. Anal. 1, 176–226.
Kyle, K. (2016). Measuring Syntactic Development In L2 Writing: Fine Grained Indices Of Syntactic Complexity And Usage-Based Indices Of Syntactic Sophistication. Dissertation, Georgia State University, Atlanta, GA.
Kyle, K., Crossley, S., and Berger, C. (2018). The tool for the automatic analysis of lexical sophistication (TAALES): version 2.0. Behav. Res. Methods 50, 1030–1046. doi: 10.3758/s13428-017-0924-4
Lundberg, S. M., Erion, G. G., and Lee, S.-I. (2018). Consistent individualized feature attribution for tree ensembles. arXiv [Preprint]. Available online at: https://arxiv.org/abs/1802.03888 (accessed September 22, 2020).
Lundberg, S. M., and Lee, S.-I. (2017). “A unified approach to interpreting model predictions,” in Advances in Neural Information Processing Systems, eds I. Guyon, U. V. Luxburg, S. Bengio, H. Wallach, R. Fergus, S. Vishwanathan, et al. (Red Hook, NY: Curran Associates, Inc), 4765–4774.
Madnani, N., and Cahill, A. (2018). “Automated scoring: beyond natural language processing,” in Proceedings of the 27th International Conference on Computational Linguistics, (Santa Fe: Association for Computational Linguistics), 1099–1109.
Madnani, N., Loukina, A., von Davier, A., Burstein, J., and Cahill, A. (2017). “Building better open-source tools to support fairness in automated scoring,” in Proceedings of the First (ACL) Workshop on Ethics in Natural Language Processing, (Valencia: Association for Computational Linguistics), 41–52.
McCarthy, P. M., and Jarvis, S. (2010). MTLD, vocd-D, and HD-D: a validation study of sophisticated approaches to lexical diversity assessment. Behav. Res. Methods 42, 381–392. doi: 10.3758/brm.42.2.381
Mizumoto, T., Ouchi, H., Isobe, Y., Reisert, P., Nagata, R., Sekine, S., et al. (2019). “Analytic score prediction and justification identification in automated short answer scoring,” in Proceedings of the Fourteenth Workshop on Innovative Use of NLP for Building Educational Applications, Florence, 316–325.
Murdoch, W. J., Singh, C., Kumbier, K., Abbasi-Asl, R., and Yu, B. (2019). Definitions, methods, and applications in interpretable machine learning. Proc. Natl. Acad. Sci. U.S.A. 116, 22071–22080. doi: 10.1073/pnas.1900654116
Nelson, J., and Campbell, C. (2017). Evidence-informed practice in education: meanings and applications. Educ. Res. 59, 127–135. doi: 10.1080/00131881.2017.1314115
Rahimi, Z., Litman, D., Correnti, R., Wang, E., and Matsumura, L. C. (2017). Assessing students’ use of evidence and organization in response-to-text writing: using natural language processing for rubric-based automated scoring. Int. J. Artif. Intellig. Educ. 27, 694–728. doi: 10.1007/s40593-017-0143-2
Reinertsen, N. (2018). Why can’t it mark this one? A qualitative analysis of student writing rejected by an automated essay scoring system. English Austral. 53:52.
Ribeiro, M. T., Singh, S., and Guestrin, C. (2016). “Why should i trust you?”: explaining the predictions of any classifier. CoRR, abs/1602.0. arXiv [Preprint]. Available online at: http://arxiv.org/abs/1602.04938 (accessed September 22, 2020).
Rupp, A. A. (2018). Designing, evaluating, and deploying automated scoring systems with validity in mind: methodological design decisions. Appl. Meas. Educ. 31, 191–214. doi: 10.1080/08957347.2018.1464448
Rupp, A. A., Casabianca, J. M., Krüger, M., Keller, S., and Köller, O. (2019). Automated essay scoring at scale: a case study in Switzerland and Germany. ETS Res. Rep. Ser. 2019, 1–23. doi: 10.1002/ets2.12249
Shen, Y., Tan, S., Sordoni, A., and Courville, A. C. (2018). Ordered Neurons: Integrating Tree Structures into Recurrent Neural Networks. CoRR, abs/1810.0. arXiv [Preprint]. Available online at: http://arxiv.org/abs/1810.09536 (accessed September 22, 2020).
Shermis, M. D. (2014). State-of-the-art automated essay scoring: competition, results, and future directions from a United States demonstration. Assess. Writ. 20, 53–76. doi: 10.1016/j.asw.2013.04.001
Taghipour, K. (2017). Robust Trait-Specific Essay Scoring using Neural Networks and Density Estimators. Dissertation, National University of Singapore, Singapore.
West-Smith, P., Butler, S., and Mayfield, E. (2018). “Trustworthy automated essay scoring without explicit construct validity,” in Proceedings of the 2018 AAAI Spring Symposium Series, (New York, NY: ACM).
Keywords: explainable artificial intelligence, SHAP, automated essay scoring, deep learning, trust, learning analytics, feedback, rubric
Citation: Kumar V and Boulanger D (2020) Explainable Automated Essay Scoring: Deep Learning Really Has Pedagogical Value. Front. Educ. 5:572367. doi: 10.3389/feduc.2020.572367
Received: 14 June 2020; Accepted: 09 September 2020;
Published: 06 October 2020.
Edited by:
Ben Daniel, University of Otago, New ZealandCopyright © 2020 Kumar and Boulanger. This is an open-access article distributed under the terms of the Creative Commons Attribution License (CC BY). The use, distribution or reproduction in other forums is permitted, provided the original author(s) and the copyright owner(s) are credited and that the original publication in this journal is cited, in accordance with accepted academic practice. No use, distribution or reproduction is permitted which does not comply with these terms.
*Correspondence: David Boulanger, ZGJvdWxhbmdlckBhdGhhYmFzY2F1LmNh