 Shima Salehi
 Sehoya Cotner
 Cissy J. Ballen
- 1Stanford Graduate School of Education, Stanford University, Stanford, CA, United States
- 2Department of Biology Teaching and Learning, University of Minnesota, Minneapolis, MN, United States
- 3Department of Biological Sciences, Auburn University, Auburn, AL, United States
Recent efforts to promote diversity in the sciences, technology, engineering and math (STEM) disciplines include widening access to colleges and universities for capable but academically underprepared students. Equally important in these efforts is to provide students with support after acceptance, particularly in large, introductory STEM courses. We found that under-represented minority students and first-generation college attendees underperformed relative to their peers across STEM courses, and incoming preparation was the chief culprit in explaining these academic performance gaps, even after controlling for social psychological factors. We conclude that institutions should reconsider how they provision underprepared students with opportunities to excel in STEM. To address the variation in incoming academic preparation among students, we advocate for institutional resources supporting supplemental instruction, bridge programs, and evidence-based teaching practices.
Introduction
In efforts to make higher education more accessible and inclusive, institutions have implemented policies and agendas aimed at widening access for students who have been historically underrepresented. For example, in 2017 the College Board piloted an admissions tool that assigns students with an ‘adversity score,’ a numerical rating reflecting the challenges they have faced during their pre-college education. The intention of the College Board, as well as similar initiatives [e.g., automatic admission for top-ranking high school students at University of Texas at Austin (Niu and Tienda, 2010)], is to increase the college acceptance rates among students from less privileged high schools and communities.
However, previous work shows that once students have made their way to campus, and are seated in lecture halls, capable learners are still at a disadvantage (Mervis, 2010, 2011). For example, reductive descriptors of student identity – e.g., minority status, first-generation status, socioeconomic status – are still predictive of performance outcomes in introductory courses (Crisp et al., 2009). Underrepresented minority (URM)1 students in the United States—African American, Hispanic, Pacific Islander, and Native American undergraduates—have equal aspirations to pursue a STEM major as majority students (Crisp et al., 2009; Koenig, 2009; Hurtado and Ruiz, 2012). However, according to the few large-scale efforts that track students through higher education, proportionally more URM students leave STEM majors. The National Center for Education Statistics reported that African Americans are the ethnic group with the highest probability of dropping out of college (29%) or leaving STEM in pursuit of a non-STEM degree (36%) (Chen, 2013). Further, parents’ level of education is positively associated with rates of student persistence in college, even when controlling for measures of academic preparation such as college entrance examination scores (Warburton et al., 2001). Therefore, besides URM students, first-generation college attendee students (Fgen) are another demographic group whose participation in STEM is a growing concern.
One barrier to persistence in STEM is the introductory ‘gateway’ courses which students are required to complete before they move on to specialized classes that align with their intellectual interests. Students generally find these courses daunting (Seymour and Hewitt, 1997), and for good reason. During an undergraduate degree, those who perform poorly in introductory STEM courses relative to non-STEM courses have an increased probability of switching majors (Chen, 2013). In fact, all students are at the ‘highest risk’ of leaving STEM at the end of the first year (Seymour and Hewitt, 1997; Mervis, 2010, 2011; Westrick et al., 2015), and throughout their college education the risk of attrition declines (Hilton and Lee, 1988). Most students take gateway STEM courses in their first year, and perform poorly in these courses relative to their non-STEM courses (Koester et al., 2016). This performance challenge in introductory STEM courses has been one of the reasons cited most by students leaving STEM (Seymour and Hewitt, 1997). Thus, underperformance in introductory STEM courses is consequential in the decision of whether or not to pursue a STEM major. Therefore, if we want to increase the retention of under-represented demographic groups such as URM and Fgen students, it is important to study factors that affect their performance in introductory STEM courses; factors such as incoming preparation, student attitudes, pedagogical approaches, or classroom social climate.
What Factors Predict Academic Performance Outcomes in Introductory STEM Courses?
Previous work (Salehi et al., 2019) showed that URM and Fgen students underperformed in introductory calculus-based physics (physics 1), and the gap in incoming preparation explained a large portion of these demographic performance gaps. In the current study, we expand on this work in two ways. First, we examine the demographic performance gaps in introductory courses across different STEM fields, beyond physics. Second, many elements other than incoming preparation may influence student performance on high-stakes assessments in introductory STEM courses. Some examples include student perceptions of their own ability and their local environment, such as the classroom or campus climate (Reid and Radhakrishnan, 2003). These factors are in the social psychological domain of learning (Haertel et al., 1981). Therefore, in this study, we examined the contribution of incoming preparation as well as some well-studied social psychological factors in the context of student performance in STEM courses (Table 1 and Supplementary Table S1) to academic performance of students from different demographic backgrounds. While we focus on two under-represented demographic groups - URM and Fgen students - we acknowledge that these are two of many identities currently underrepresented in STEM.

Table 1. Candidate social psychological factors that impact student performance according to previous research.
The two broad questions of this study are:
1. Demographic performance gaps (R1): to what extent do we observe demographic gaps in academic performance outcomes (exam scores and total course grades) across different introductory STEM courses?
2. Underlying mechanisms for demographic performance gaps (R2): how do incoming preparation, social psychological factors, and the interaction of these factors mediate demographic performance gaps?
Materials and Methods
Data Collection
Class Performance
We obtained administrative data from 5766 students enrolled in upper and lower division courses across two colleges at a large midwestern research-intensive university between 2015 to 2017: the College of Biological Sciences (CBS) and the College of Science and Engineering (CSE). In this work, we will focus on 5269 students in introductory courses of these two colleges (Table 2): 2860 students enrolled in one of 17 introductory biology classes offered by the College of Biological Sciences (CBS) (minimum N = 111, maximum N = 288); and 2409 students enrolled in one of 15 introductory courses in the College of Science and Engineering (CSE) (minimum N = 42, maximum N = 220). CBS houses the departments of genetics and cell biology, neuroscience, plant and microbial biology, biology teaching and learning, and ecology, evolution and behavior. CSE houses the departments of chemistry, physics and astronomy, chemical engineering and materials science, computer science and engineering, and the school of mathematics. The introductory courses in both colleges enroll students from a range of STEM and non-STEM majors, but the majority of introductory biology courses that are the focus of this work enroll predominantly students that do not intend to major in biology specifically. Given this difference and the different teaching cultures of the two colleges, we split the analyses by college.
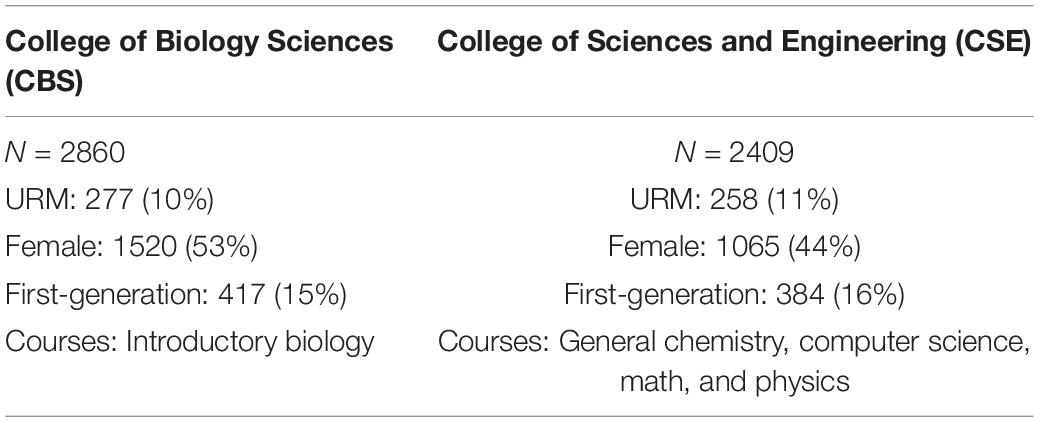
Table 2. A descriptive demographic summary of students sampled from across the College of Biological Sciences (CBS) and the College of Science and Engineering (CSE).
For ease of interpretation during analyses, we normalized all raw scores. We normalized exam and total grade by class section; and ACT score and social psychological constructs for the entire sample. The normalized scores are a measure of how many standard deviations a value is from the sample mean score. This means that measures reflect how students performed relative to their peers in a single classroom section, and how social psychological measures compared to all other students in our sample across the two colleges.
Incoming Academic Preparation
In this study, we only had access to ACT composite score as a measure for student academic incoming preparation. This is not the best measure, but a measure to which most departments and instructors have access. ACT composite score can be considered a proxy of an overall education quality that students have received before entering college. However, ACT composite falls short in measuring the gaps in incoming preparation of students in a given domain. To measure these gaps, we acknowledge the importance of concept inventory tests.
Social Psychological Factors
A sub-set of courses also allowed us to survey students to obtain social psychological information at the end of the semester (Table 3). During the last week of classes, we entered classrooms and distributed paper surveys to students. The survey items for each social psychological factor were chosen from validated survey. We confirmed that the social psychological measures from the survey represented five intended constructs through confirmatory factor analysis (Supplementary Figure S1 and Supplementary Tables S1, S2).
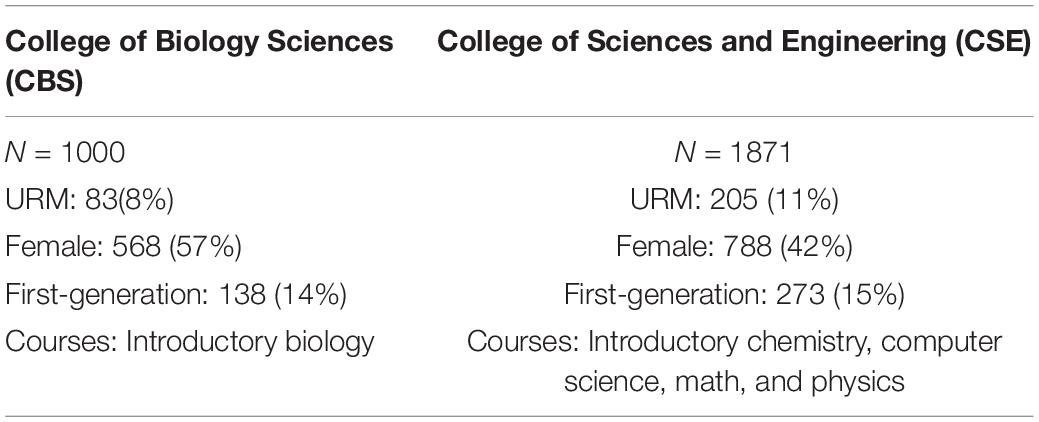
Table 3. A descriptive demographic summary of the student sub-sample of who were surveyed for social psychological factors across the College of Biological Sciences (CBS) and the College of Science and Engineering (CSE).
Statistical Analyses
Regression Analysis of Demographic Performance Gaps (R1)
We used mixed-model regression analyses to examine the demographic performance gaps across the two colleges and for two performance outcome measures, average exam score and total grade assigned at the end of the semester. We chose these two performance measures because exam scores account for a large portion of students’ grades in introductory STEM courses and grades in these courses are consequential in the decision of pursuing STEM. In this analysis, we controlled for the random effects of different courses and sections, if applicable, as well as the nested structure of the data (the sections are nested within courses). We first examined actual performance gaps, without controlling for other variables, because this is what students see on their transcripts or submit to graduate school.
SEM Analysis of Underlying Mechanisms for Demographic Performance Gaps in Exams and Total Grades (R2)
We used lavaan R package (Rosseel, 2012) to conduct mediation analyses to examine these five social psychological factors and incoming preparation, as potential mediators between student demographic status and performance outcomes. We also hypothesized that student incoming preparation may influence the measured social psychological factors, and so we included in the models the mediation path between demographic status, incoming preparation, social psychological factors, and performance outcomes. Through SEM approach, we were able to explore the most significant variable(s) mediating the relationship between demographic status and performance outcomes in introductory STEM courses.
Hypothesized Mediation Models
For the two measures of student performance, we explored (1) partial mediation SEM models (Figure 1), and (2) full mediation SEM models to explore the relationships between variables (Figure 2); and test which model was the simplest best-fitting model for the data.
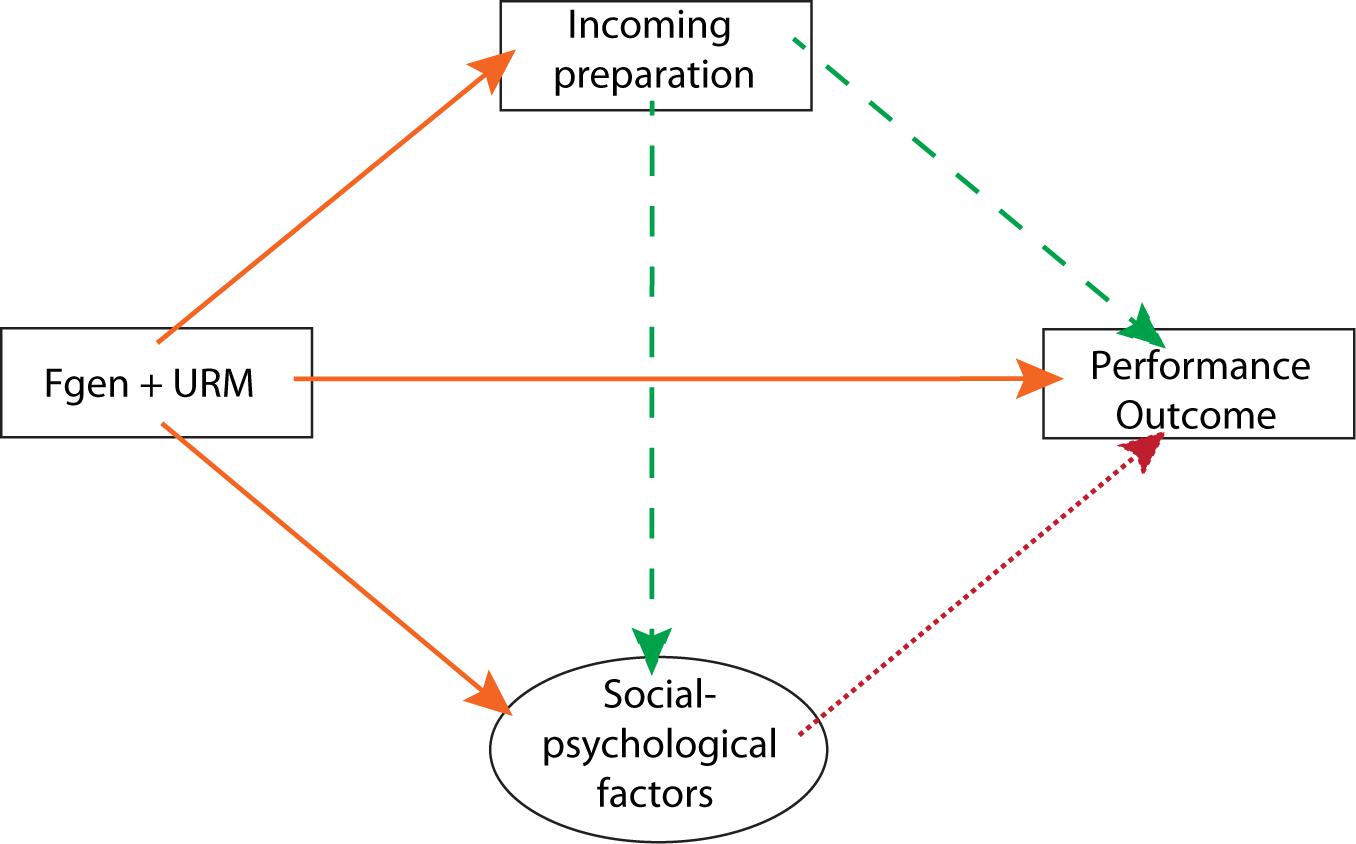
Figure 1. A hypothesized partial. mediation model. This model depicts the structural relationship predicting student performance in introductory STEM courses. The three orange solid arrows from student demographic status (“URM + Fgen”) indicate that these traits predict incoming preparation, student social psychological factors, and performance (either exam or total grade). The two green medium-dashed arrows from incoming preparation reflect how preparation might predict student course performance, and social psychological factors. The red small-dashed arrow from social psychological factors shows how one or more factors we surveyed may influence student performance. In this partial mediation model, student demographic status affects performance both directly as well as indirectly through incoming preparation and/or social psychological factors. Note that in this model we controlled for student gender due to its demonstrable impact on performance, but do not depict that relationship here because it is not the focus of the current study.

Figure 2. A full mediation model predicting student performance in introductory STEM courses. The relationship between demographic status (first-generation status, or Fgen, and underrepresented minority status, or URM) and academic outcomes can be explained through three mediation paths: 1) direct mediation of incoming preparation (top, blue arrows) 2) direct mediation of social psychological factors (middle, red arrows) and 3) indirect mediation of incoming preparation through social psychological factors (bottom, green arrows).
1. Partial mediation SEM model
A partial mediation model hypothesizes that incoming preparation and social psychological factors only partially mediate the effect of demographic status on student performance outcome. Therefore, the model includes the direct effect of demographic status on student performance as well as its indirect effect mediated through incoming preparation and social psychological factors (Figure 1). We describe these indirect effects in more detail when describing the full mediation model. The direct effect of demographic status captures mechanisms other than incoming preparation and social psychological factors that affect the performance of URM and Fgen students.
2. Full mediation SEM model
In this approach, there is no direct effect of demographic status on student performance, only indirect effects mediated through incoming preparation and social psychological factors. In this full mediation model, there are three mediation effects: (1) direct mediation of incoming preparation; (2) direct mediation of social psychological factors; and (3) indirect mediation of incoming preparation through social psychological factors (Figure 2).
Direct mediation of incoming preparation
If URM and Fgen students enter higher education with significantly different incoming preparation compared to their peers, and this incoming preparation in turn affects student performance, then incoming preparation would be considered a mediator for the effect of URM and Fgen status on student performance.
Direct mediation of social psychological factors
If URM and Fgen students report significantly different survey responses for some or all of the social psychological factors compared to their peers, and these social psychological factors affect student performance, then these social psychological factors would be another mediator for the effect of URM and Fgen status on student performance. In the SEM models, each of the five social psychological factors was examined as a separate mediator between student demographic status and their performance (Figure 3).
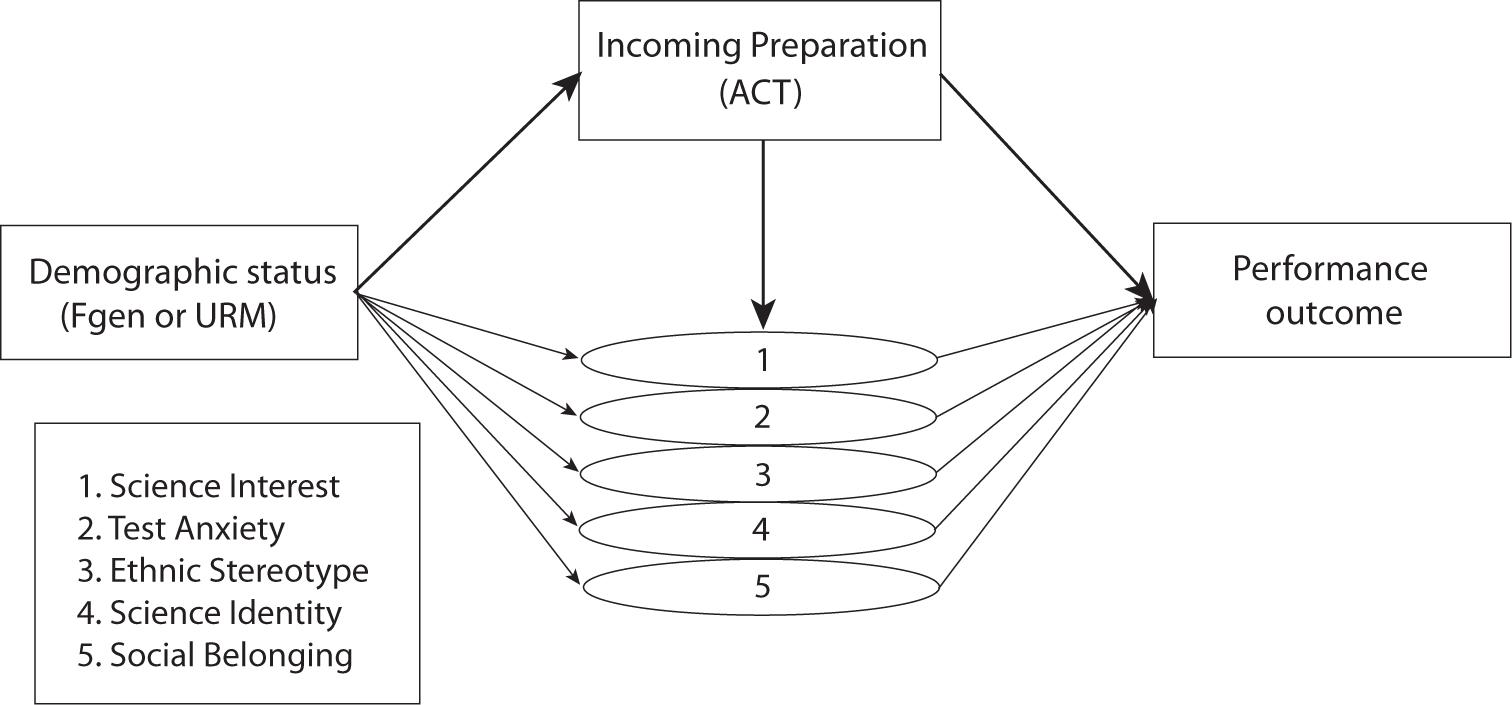
Figure 3. Mediation structure for the effect of demographic status on student performance. In this structure, incoming preparation as measured by ACT composite and each of the five social psychological factors are tested as separate mediators for the effect of student demographic status (first-generation status, or Fgen, and underrepresented minority status, or URM) on performance on exams or total grade.
Indirect mediation of incoming preparation through social psychological factors
Social psychological factors might be affected by student incoming preparation. Therefore, another mediation path in this model is that URM and Fgen student might have different levels of incoming preparation, which in turn might affect some of their social psychological factors, which impact performance. For example, URM students might have, on average, lower incoming preparation. This lower incoming preparation might lead to higher test anxiety, and higher test anxiety might negatively affect exam performance. This example illustrates the mediating effect of incoming preparation for the effect of demographic status on performance, through its influence on test anxiety.
SEM Model Selection
We used Chi-square statistics of the models, as well as common fit indices such as comparative fit index (CFI), root mean square error (RMSEA), and standardized root mean square residual (SRMR) to evaluate model fits. The Chi-square statistics of the model should be non-significant, suggesting that estimated covariances by the models are not significantly different from the observed covariances in the data. The acceptable ranges for other common fit indices are: CFI acceptable range: above 0.95; RMSEA acceptable range: 0 - 0.08; SRMR acceptable range: 0 - 0.1.
The fit of the partial mediation model was acceptable for average exam performance (χ2(4) = 4.4, p = 0.36, RMSEA = 0.02, CFI = 1.00, SRMR = 0.009). However, for both colleges, the direct effect of URM and Fgen status on exam performance was not significant (URM: pcbs = 0.73, pcse = 0.87; Fgen: pcbs = 0.21, pcse = 0.22), and excluding the direct effect of demographic status on exam performance did not change the model fit significantly (χ2 (4) = 3.15, p = 0.53). Therefore, the simplest best-fitting model for exam performance was the full mediation model, in which demographic status only influences exam performance through incoming preparation and social psychological factors (Figure 2).
Similarly, for total grade, while the partial mediation analysis had acceptable fit, the direct effect of demographic status on the outcome was not significant for both colleges, except for Fgen status in CSE which was marginally significant (URM: pcbs = 0.76, pcse = 0.57; Fgen: pcbs = 0.15, pcse = 0.07). Excluding the direct effect of demographic status on total grade did not change the model fit significantly (χ2 (4) = 5.67, p = 0.22). Therefore, we used the full mediation model as the simplest best-fitting model for total grade, in which the impact of student demographic status (i.e., URM status and Fgen status) on total grades is fully mediated by incoming preparation and social psychological factors.
Results
Regression Analysis of Demographic Performance Gaps (R1)
First, similar to previous studies (Crisp et al., 2009; Ballen and Mason, 2017; Salehi et al., 2019), the mixed-model regression analyses showed significant demographic performance gaps across both colleges (College of Biological Sciences, CBS; College of Science and Engineering, CSE) and for both exam score and total grade (Tables 4 and 5), with URM and Fgen students scoring lower than their non-URM and continuing-generation peers (Figure 4). For example, in CBS introductory courses, on average, URM students scored 0.40 standard deviations lower on exams than non-URM students (Table 4).
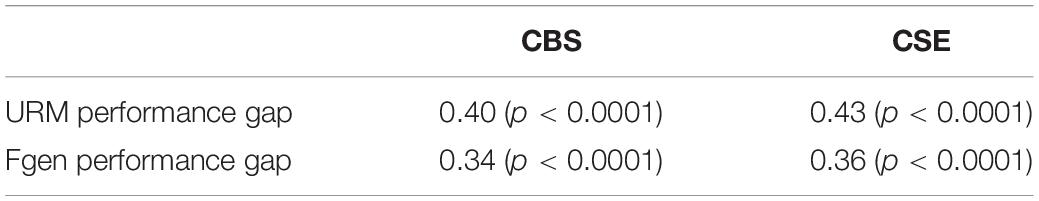
Table 4. URM and first-generation (Fgen) performance gaps in exam performance across the College of Biological Sciences (CBS) and the College of Science & Engineering (CSE) measured by standard deviations from class means.
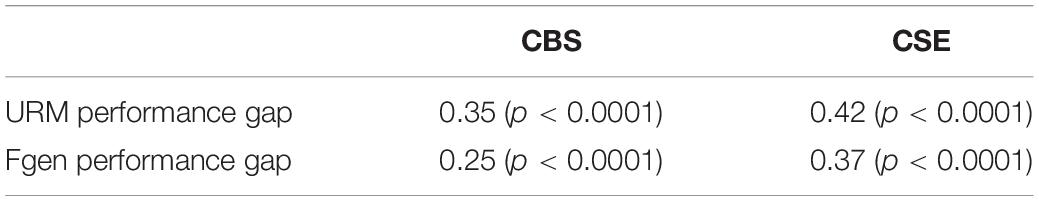
Table 5. URM and first-generation (Fgen) performance gaps in total grade across the College of Biological Sciences (CBS) and the College of Science & Engineering (CSE) measured by standard deviations from class means.
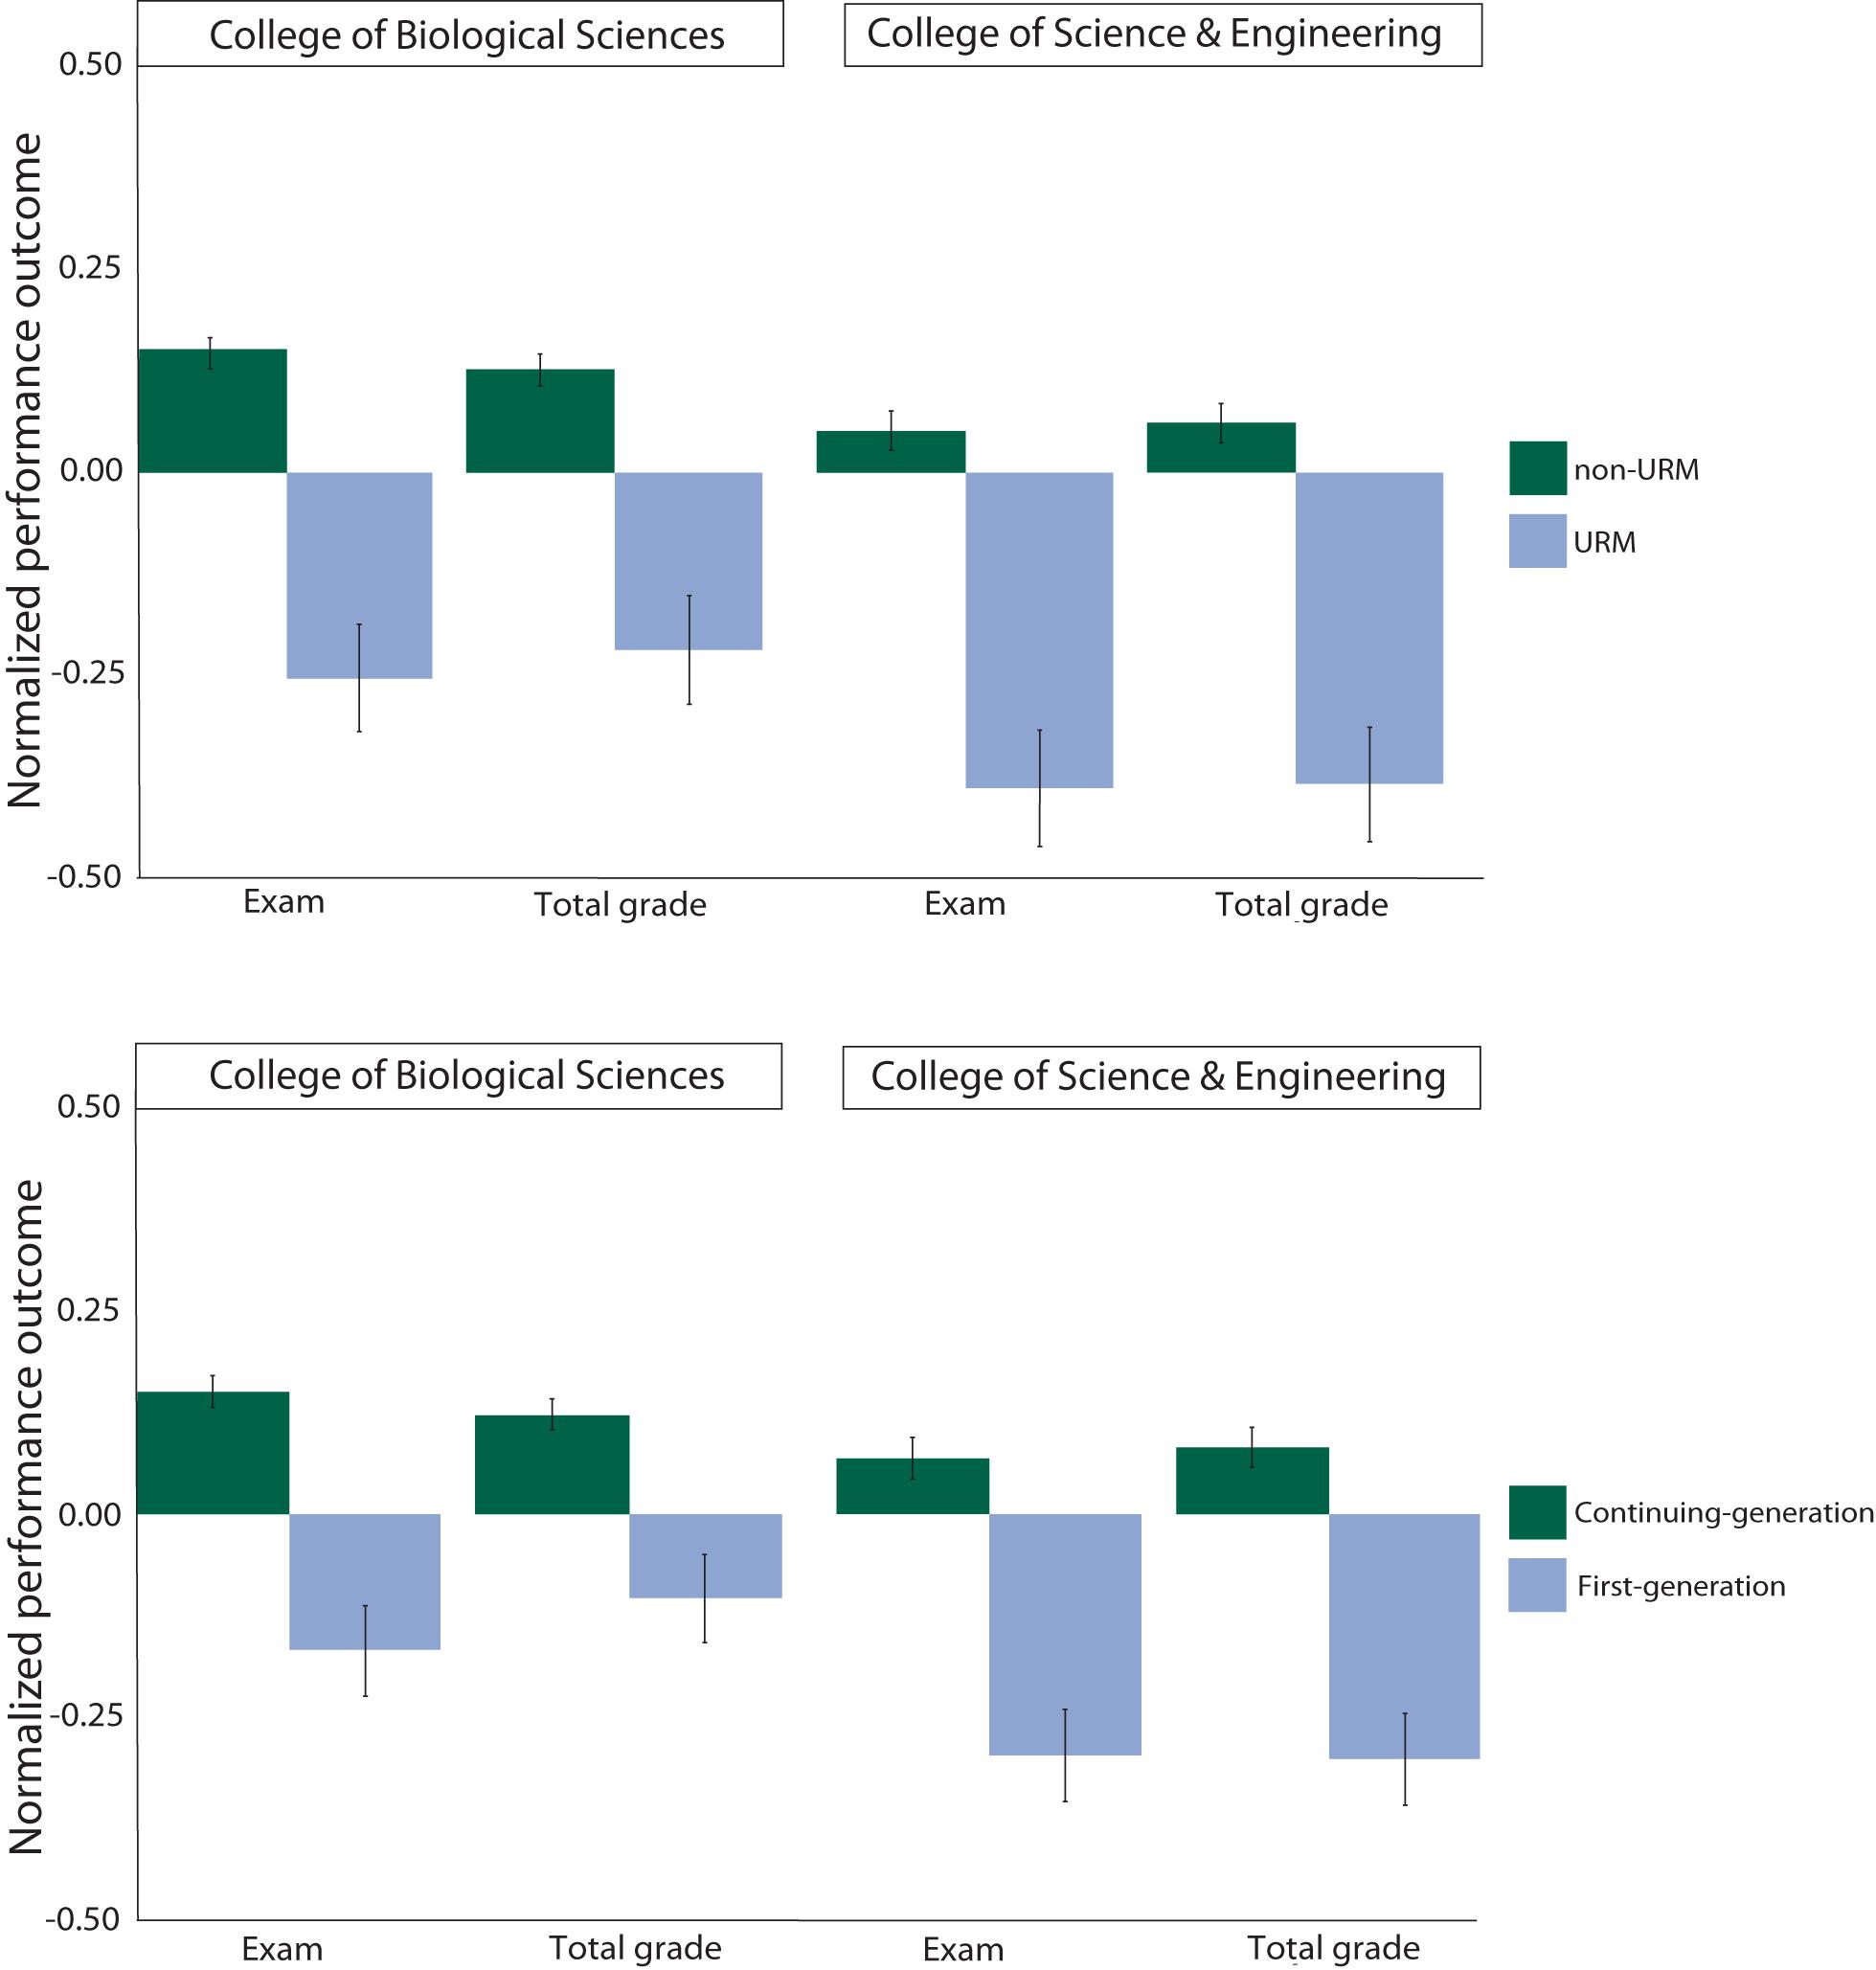
Figure 4. Average normalized exam scores and total grades. Students across the College of Biological Sciences and the College of Science & Engineering include majority (non-URM; green), underrepresented minority students (URM; light blue) (top panel); and continuing generation (green) versus first-generation (light blue) college attendees (bottom panel).
SEM Analysis of Underlying Mechanisms for Demographic Performance Gaps in Exams and Total Grades (R2)
Second, we used full mediation models to examine the relationship between student demographic status (URM, Fgen status), their incoming preparation (as measured by ACT composite score), the surveyed social psychological factors (details in Table 1), and the two measures of performance.
Exams: The Underlying Mechanisms for Demographic Performance Gaps
Overall, incoming preparation was the major mediator for demographic gaps in exam performance across both colleges (Table 6). URM students and Fgen students entered introductory coursework less academically prepared, i.e., with lower ACT composite score, and this lower academic preparation impacted student performance on exams.
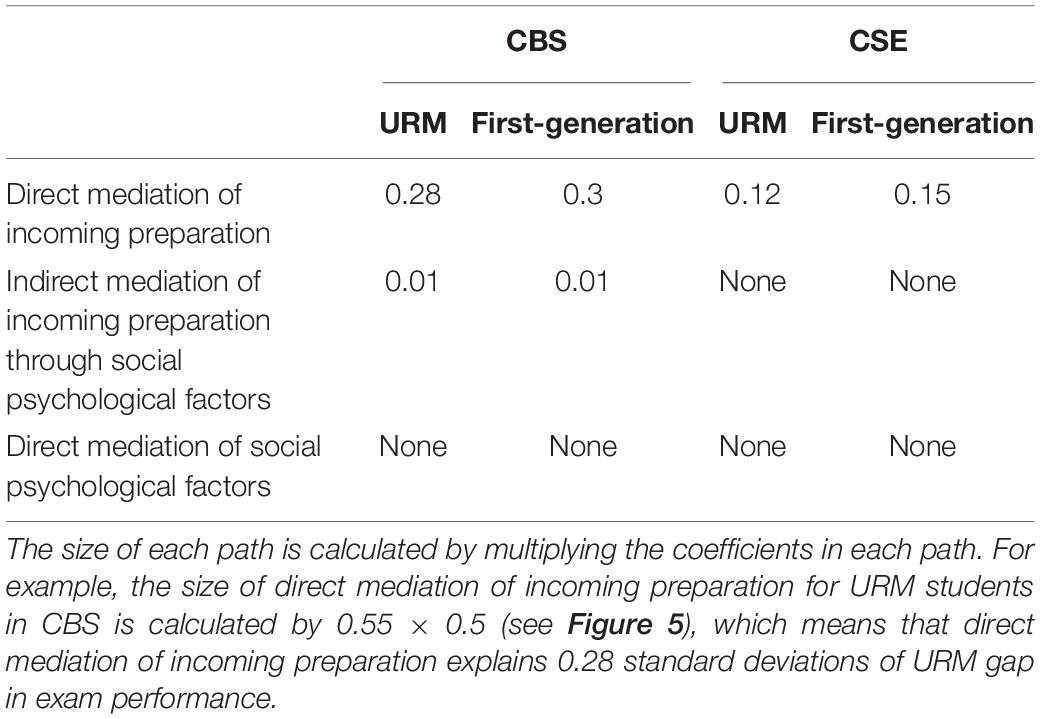
Table 6. The size of different mediation paths for URM and first-generation (Fgen) students in exam performance across the College of Biological Sciences (CBS) and the College of Science & Engineering (CSE) in standard deviation units.
Mediation Paths in CBS
Direct mediation of incoming preparation
In CBS, we observed a significant direct mediating effect of incoming preparation for both URM and Fgen students. URM and Fgen students entered college with significantly lower ACT scores. In Figure 5, the sizes of these gaps are presented in units of standard deviation on the corresponding arrows, e.g., URM students scored 0.55 standard deviations lower on their ACT compared to non-URM students; Fgen students scored 0.6 standard deviations lower compared to continuing-generation students. For all students, ACT score positively correlated with exam score: one standard deviation increase in ACT score increased exam score by 0.50 standard deviations. Therefore, the lower ACT scores for URM and Fgen students led to lower exam scores. Given the size of the ACT gaps for URM and Fgen students, and the size of the correlation between ACT and exam scores, the size of direct mediation of incoming preparation was 0.28 standard deviations for URM students, and 0.3 for Fgen students. In other words, the direct mediation of incoming preparation explains 0.28 standard deviations of the URM underperformance in exam scores, and 0.30 standard deviations of the Fgen underperformance (Table 6, Figure 5, and Supplementary Table S3).
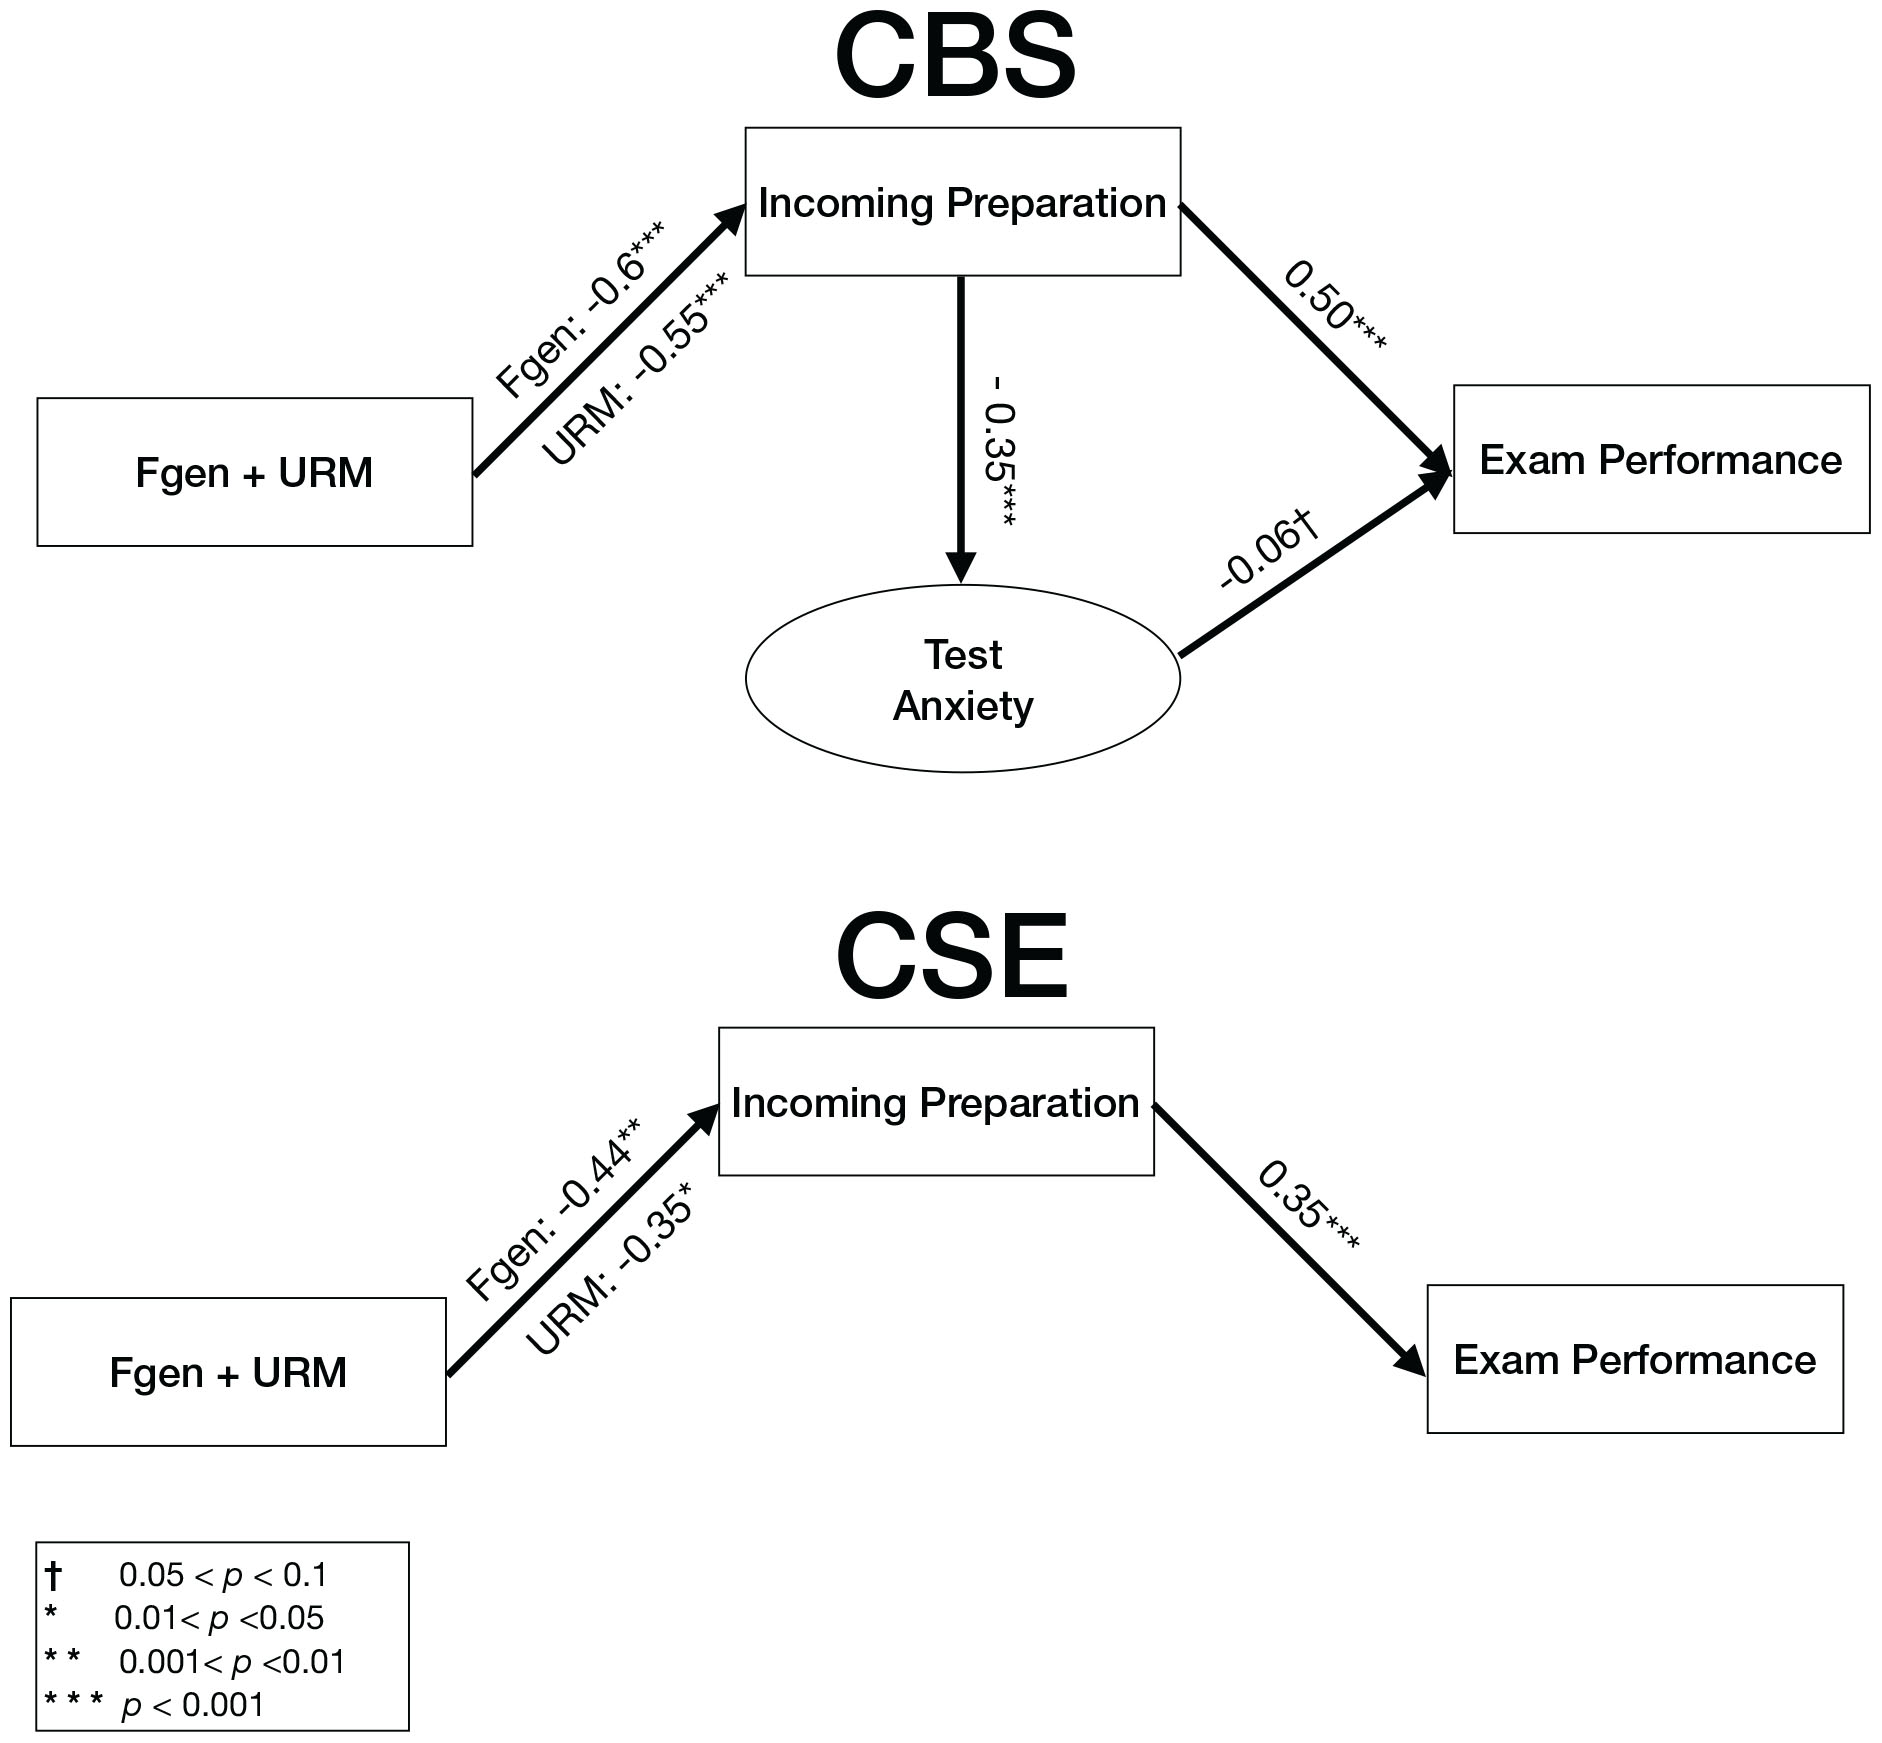
Figure 5. Paths represent relationships between demographic status, incoming preparation, social psychological factors, and student exam performance for students enrolled in courses in the College of Biological Sciences (CBS) and the College of Science & Engineering (CSE). The numbers represent coefficients in standard deviation units.
Indirect mediation of incoming preparation through test anxiety
In CBS, ACT score not only influenced student exam score directly, but also indirectly through test anxiety. Lower ACT scores led to higher anxiety scores, and higher anxiety led to lower exam scores. One standard deviation decrease in ACT score increased anxiety score by 0.35 standard deviations, and one standard deviation increase in test anxiety decreased exam score by 0.06 standard deviations (Table 6, Figure 5, and Supplementary Table S3).
Direct mediation of social psychological factors
Overall, none of the social psychological factors served as direct mediators for the URM and Fgen gap in exam scores (see Supplementary Table S3 for complete SEM results). While science identity did correlate with exam performance, we did not observe demographic differences in this factor. Therefore, science identity was not a mediator for demographic gaps in exam scores.
Mediation Paths in CSE
Direct mediation of incoming preparation
In CSE, similar to CBS, URM and Fgen students entered the college with significantly lower ACT scores, and ACT score was positively correlated with exam performance. The direct mediation of incoming preparation explained 0.12 standard deviations of the URM underperformance, and 0.15 standard deviations of the Fgen underperformance (Table 6, Figure 5, and Supplementary Table S3).
Indirect mediation of incoming preparation through social psychological factors
In CSE, incoming preparation did not impact exam performance through a significant relationship with any social psychological factors (Supplementary Table S3 for complete SEM results).
Direct mediation of social psychological factors
Overall, none of the social psychological factors served as mediators for the URM and Fgen gap in exam scores. While student sense of social belonging did correlate with exam performance, we did not observe demographic differences in this factor (Supplementary Table S3).
Total Grades: The Underlying Mechanisms for Demographic Performance Gaps
As timed examinations accounted for a large proportion of student course grades, we - not surprisingly - observed relatively similar outcomes from the mediation analyses of total course grades (Table 7, Figure 6, and Supplementary Table S4). Similar to the mediation analyses of exams, direct mediation of incoming preparation was the main mediator of the effect of demographic status on total grade.
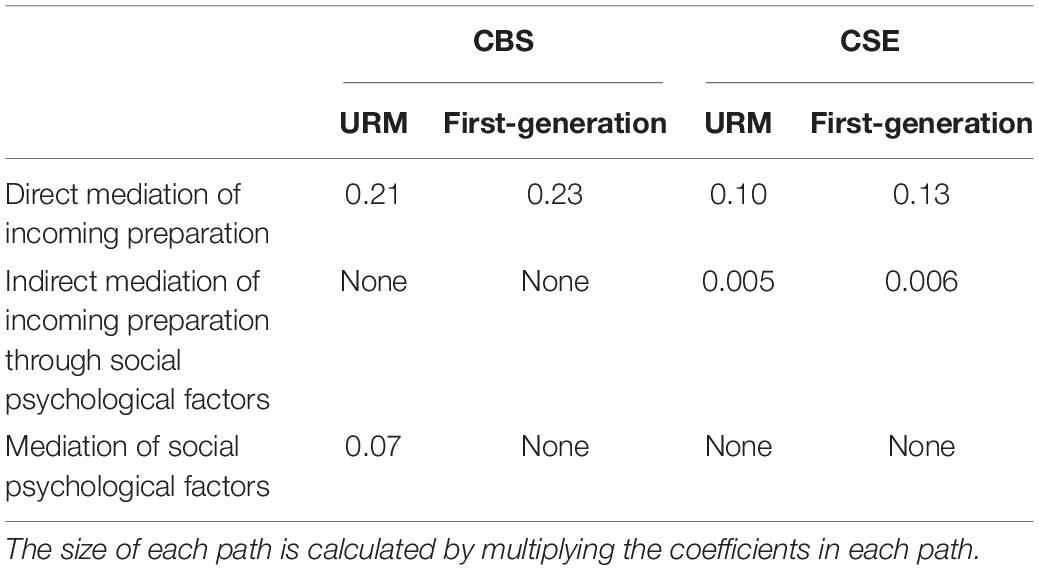
Table 7. The size of different mediation paths for URM and first-generation (Fgen) in total grade across the College of Biological Sciences (CBS) and the College of Science & Engineering (CSE) in standard deviation units.
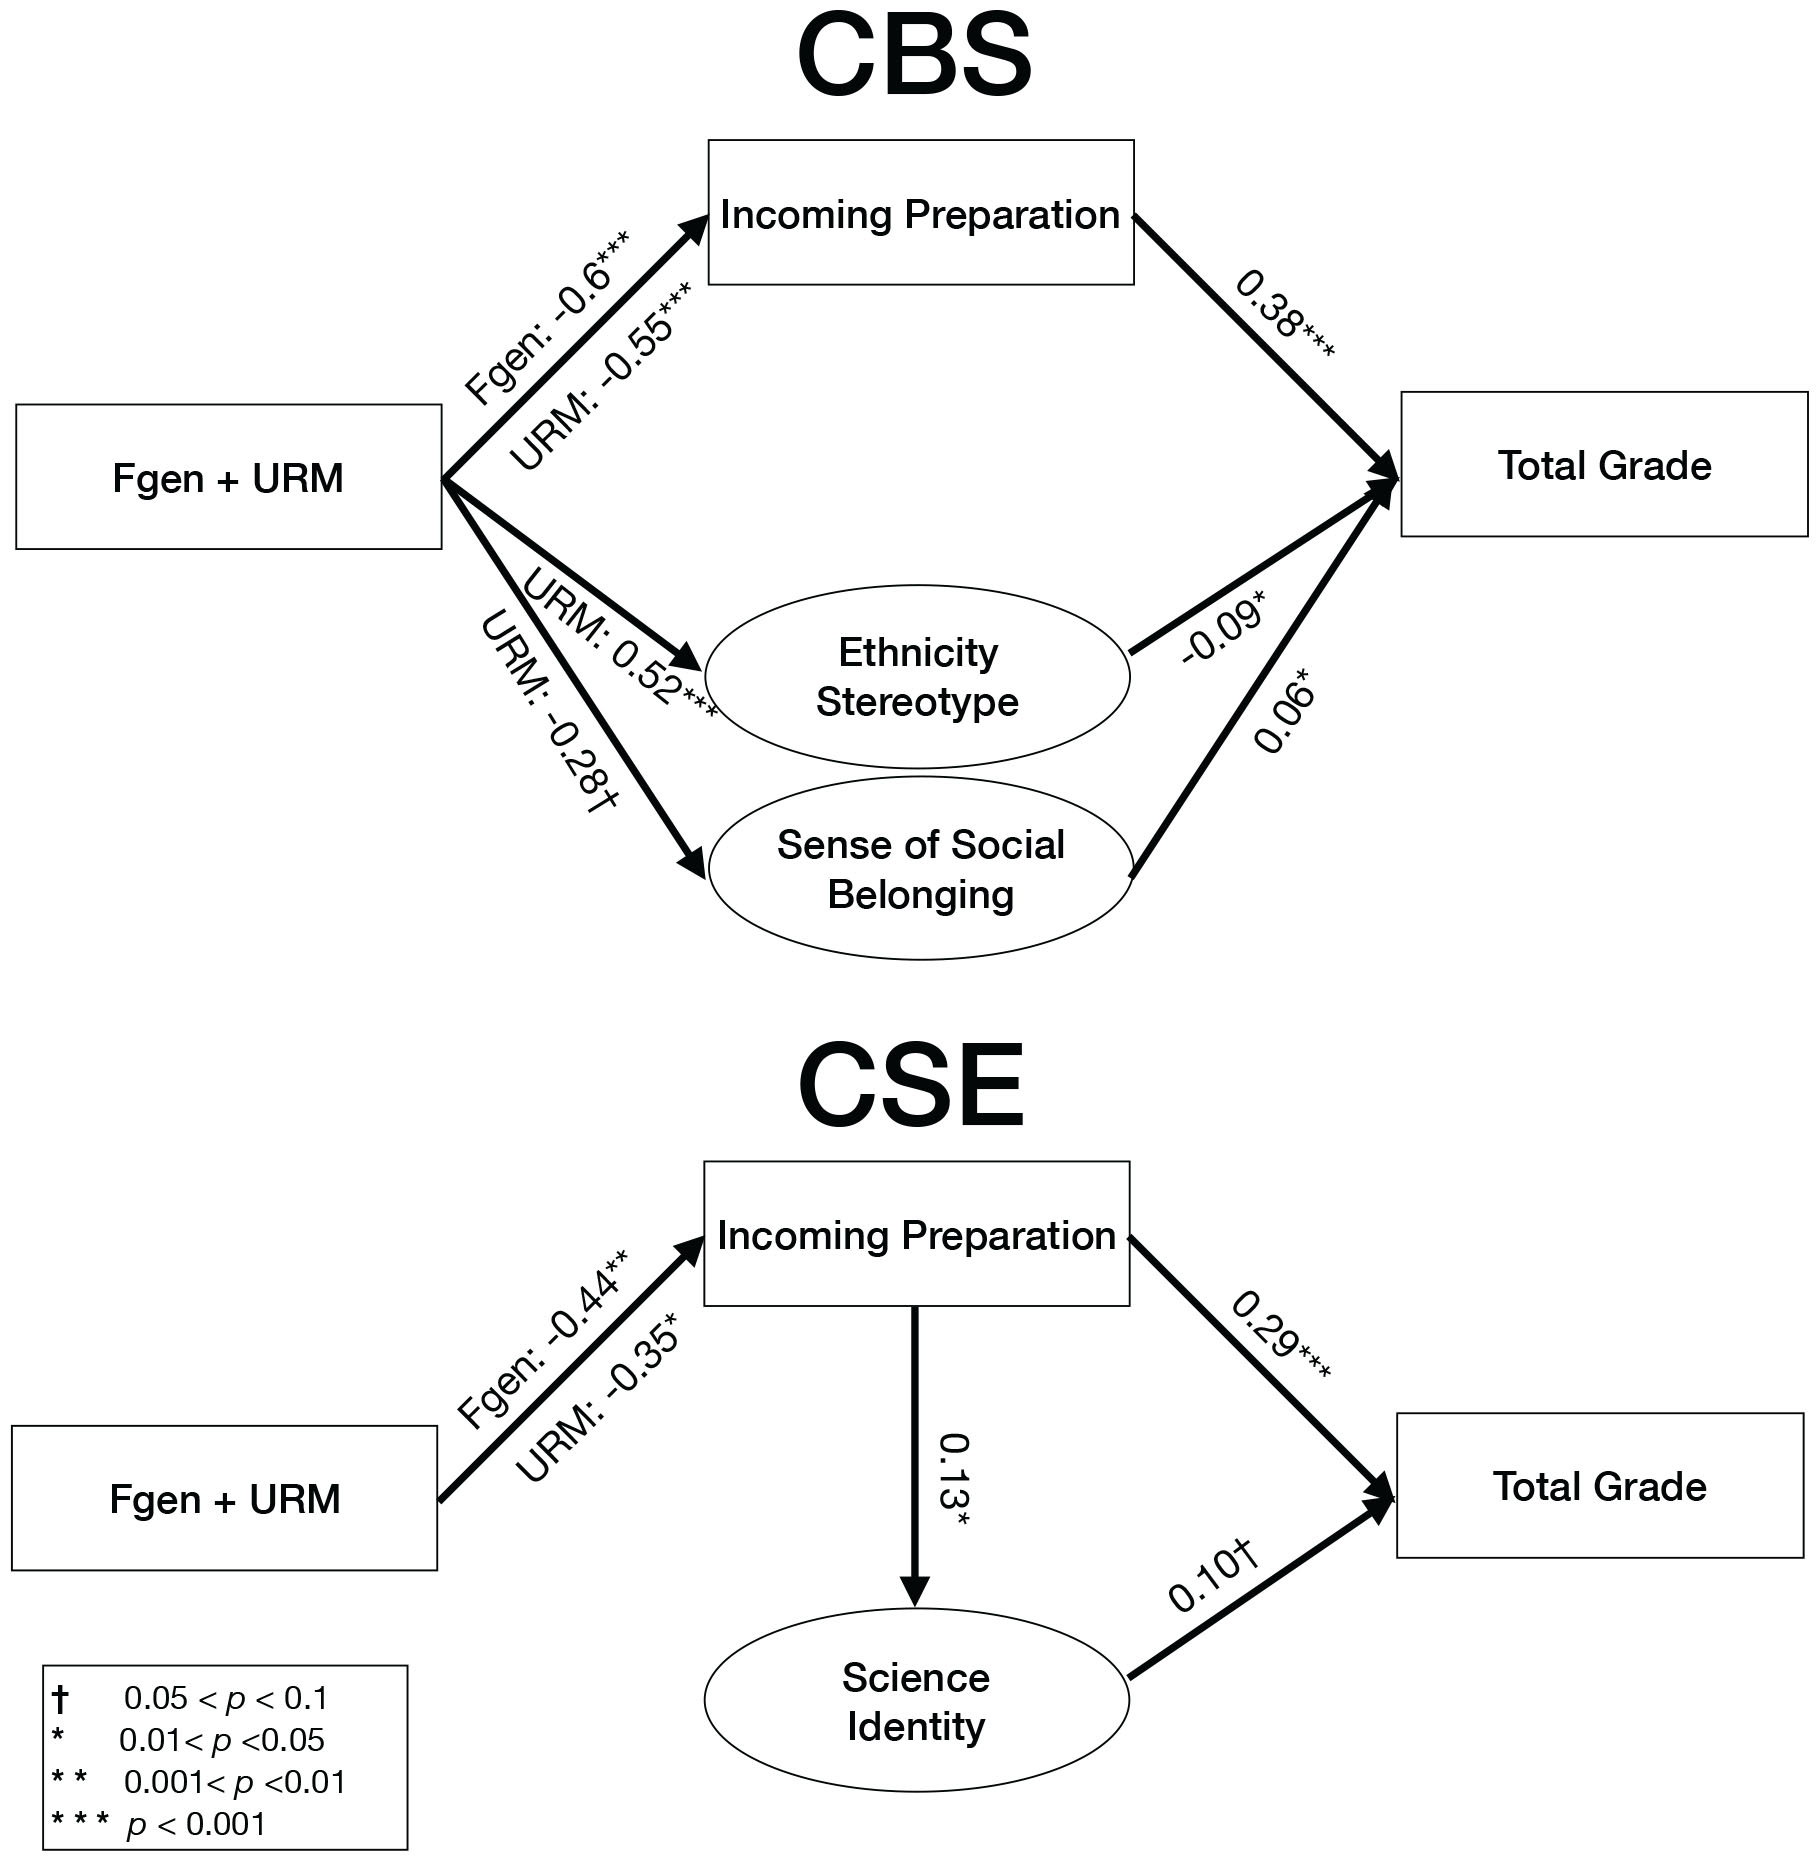
Figure 6. Significant mediation paths between demographic status, incoming preparation, social psychological factors, and student total grades in multiple introductory science classes across the College of Biological Sciences (CBS) and the College of Science & Engineering (CSE). The numbers represent coefficients in standard deviation units.
Mediation Paths in CBS
Direct mediation of incoming preparation
In CBS, we observed a significant direct mediating effect of incoming preparation for both URM and Fgen students. For all students, ACT score positively correlated with total grade: one standard deviation increase in ACT score increased total grade by 0.38 standard deviations. Therefore, the lower ACT scores for URM and Fgen students led to lower total grades (Table 7 and Figure 6).
Indirect mediation of incoming preparation through social psychological factors
We did not observe the indirect mediation of incoming preparation through social psychological factors for total grade (Supplementary Table S4).
Direct mediation of social psychological factors
For URM students in CBS, we report a significant direct mediation of ethnicity stereotype as well as a marginally significant direct mediation of sense of social belonging. Ethnicity stereotype is a construct which measures the extent to which students identify with their ethnicity, and the extent to which they believe others judge them on that basis. URM students in CBS reported experiencing 0.52 standard deviations higher levels of this measure in the context of STEM classrooms. Ethnicity stereotype was negatively correlated with exam score; one standard deviation increase in this factor decreased the total grade by 0.09 standard deviations. While this is a significant effect, ethnicity stereotype was a small mediator for the URM performance gap in total grade compared to incoming academic preparation: the direct mediation effect for the ethnicity stereotype path explained 0.05 standard deviations of the overall URM underperformance (Figure 6).
URM students also reported 0.28 standard deviations lower sense of social belonging (p = 0.06), and sense of social belonging was positively correlated with total grade: one standard deviation increase in this factor increased total grade by 0.06 standard deviations. Therefore, sense of social belonging was a marginal mediator for the URM performance gap in total grade, and the size of this mediation effect was 0.02 standard deviations (i.e., 0.28∗0.06). Together, the size of direct mediation of ethnicity stereotype and sense of social belonging was 0.07 standard deviations for URM students (i.e., this path explained 0.07 standard deviations of the overall URM underperformance) - wich is one third of the size of the direct mediation of incoming preparation [0.21 standard deviations (Figure 6)]. These variables can be investigated for deliberate interventions to promote URM students’ performance.
Mediation Paths in CSE
Direct mediation of incoming preparation
In CSE, similar to CBS, ACT score was positively correlated with total grade. Given the size of the ACT gaps for URM and Fgen students, and the size of the correlation between ACT and total grade, the size of direct mediation of incoming preparation was 0.10 standard deviations for URM students, and 0.13 for Fgen students (Table 7 and Figure 6).
Indirect mediation of incoming preparation through social psychological factors
In CSE, science identity mediated the relationship between ACT and total grade. ACT was positively correlated with science identity, which was positively correlated with total grade (Figure 6). This mediation effect was small but significant (Table 7).
Direct mediation of social psychological factors
Overall, none of the social psychological factors served as mediators for the URM and Fgen gaps in total grades in CSE (Supplementary Table S4). Similar to CBS, student sense of social belonging was correlated with total grade. However, unlike CBS, there was no demographic difference in the sense of social belonging, and as a result this factor did not mediate the effect of demographic status on total grade.
Discussion
We set out to understand underlying mechanisms that explain demographic performance gaps in different introductory STEM courses in two colleges at one institution: the College of Biological Sciences and the College of Science and Engineering. Across both colleges, we observed that URM and Fgen students obtained significantly lower exam scores and total grades. We explored three possible mechanisms for these demographic gaps: incoming preparation, social psychological factors, and the interaction of the two. We measured incoming preparation using college entrance exam scores (ACT composite), and measured five social psychological factors with survey scales. The factors were: science interest, test anxiety, ethnicity stereotype, science identity, and sense of social belonging. We tested the mediation effect of: these factors, student incoming preparation, and the interaction of the two for demographic performance gaps. Despite the differences between the colleges, we found the overall trends were similar, and lower incoming preparation largely explained why URM and Fgen students underperformed on both exams and total grades in introductory courses across both colleges. These results are aligned with Salehi et al. (2019) results that show lower incoming preparation of URM and Fgen students largely explained the demographic performance gaps in physics 1 courses across three different institutions.
Students who attend high schools with few educational resources are less academically prepared for a college education than their peers from well-resourced backgrounds (Ferguson et al., 2007; Aikens and Barbarin, 2008), and less likely to enter higher education altogether (Sewell and Shah, 1967). For those who do pursue a higher degree, lower incoming preparation significantly hampers academic performance (Huang et al., 2000). As colleges and universities continue efforts that expand access to higher education, they must also acknowledge that learners are arriving from different backgrounds. In order to fulfill their potential, less academically prepared students must be provided with supportive learning environments, rather than classrooms that reward those who are already poised for success.
This work stresses the importance of adequate academic preparation for incoming students, due to its overwhelming impact on academic performance in introductory STEM courses. While the data we present here used a single crude metric (ACT composite) for incoming preparation to explain a large part of the demographic gap in performance, content-specific measures of incoming preparation that align with the content of a given course would more accurately capture the extent of incoming preparation gaps and their impact on course performance (Salehi et al., 2019). A better characterization of incoming preparation will also help clarify the next steps that should be taken by instructors and/or institutions to eliminate demographic performance gaps.
To promote diversity in STEM education, instructors and institutions must address demographic performance gaps in introductory courses and recognize these courses as critical gateways to STEM fields. While the ultimate remedy for these discrepancies would be equal distribution of resources throughout the educational spectrum, the pre-college environment is beyond the scope of this work. Yet drawing on the results of this study, we can point to three concrete recommendations. First, higher education institutions can provide students with opportunities to compensate for lower incoming preparation. Remedy or bridge programs are common on college campuses and are offered before students start college. One successful example of a bridge program is offered through the Meyerhoff Scholarship Program (MSP) at the University of Maryland - Baltimore County (Maton et al., 2009). During the mandatory pre-college six-week summer course, students take classes in STEM and the humanities, and gain exposure to the typical classroom environments in which learning happens. Summer bridge programs such as MSP double the odds that students intend to pursue STEM careers (Kitchen et al., 2018). Other examples that ‘lift’ both prepared and unprepared (high versus low ACT/SAT) URM students include Norfolk State University’s Dozoretz National Institute for Mathematics and Applied Sciences (DNIMAS) Scholars program, Louisiana Science, Technology, Engineering, & Mathematics (LA-STEM) Scholars, the Society for Advancement of Chicanos and Native Americans in Science/Supporting Young Native Americans to Pursue Science Education (SACNAS/Synapse), and the Research Intensive Senior Experience (RISE) (Estrada et al., 2016).
Second, supplementary instructional strategies can raise achievement and improve affect for students who are underrepresented in STEM (Hall et al., 2013; Stanich et al., 2018). For example, at the University of Washington, STEM-Dawgs Workshops use Peer-led Team Learning strategies to train students in effective study skills, and promote positive emotional support, which has resulted in a narrowing of achievement gaps between underrepresented students and their peers (Stanich et al., 2018).
Third, changing instructional practices used in the introductory courses themselves can mitigate demographic performance gaps. Many STEM introductory courses are heavily lecture-based (Stains et al., 2018). However, studies have shown that changing the instructional practices of courses from traditional instructor-led lectures to active learning practices – characterized by small group discussions and frequent formative assessments - can reduce or close demographic performance gaps (Freeman et al., 2007; Ballen et al., 2017b; Theobald et al., 2020).
In one study, researchers used historical data before and after implementing active learning in a large biology class to demonstrate that students who were at the highest risk of failing disproportionately benefitted from a highly structured lecture environment, including daily practice with problem-solving, data analysis, and other higher-order cognitive skills (Haak et al., 2011). Another study demonstrated the same results: a large evolutionary biology course was offered in traditional lecture format and active learning format in subsequent semesters. Despite similar incoming characteristics, the performance outcomes for URM and non-URM students were different across the two offerings. URM performance gaps that were apparent in the lecture semester disappeared in the active learning semester, and URM students performed equally well as their non-URM peers (Ballen et al., 2017b). Such results suggest that by improving instructional practices, higher education can better serve students with different levels of incoming preparation and mitigate or even close demographic performance gaps. An obvious challenge to successful implementation of these reformed, evidence-based introductory courses is the demand for skilled and knowledgeable instructors.
Conclusion
In the current paper, we show that across several introductory STEM courses, under-represented students underperformed, and the main cause for this was lower incoming academic preparation. These large-scale results underline that introductory STEM courses often fail to address the inevitable variation in incoming academic preparation among capable students, and therefore fail to provide equal opportunity to excel for students from different backgrounds. If higher education fails to serve students with lower incoming preparation, then it cannot be an “engine for social mobility”, but rather a continuation of the status quo. Even when hard-working students from less privileged backgrounds pave their way to higher education, their performance and prospects of success are hampered due to systemic educational structures of universities that favor their better prepared peers.
Educators who value diversity in STEM should reconsider some of their longstanding teaching practices in order to better serve all students, not just the best-prepared ones, and to fulfill the promise of higher education as a remedy for societal inequality. We advocate for institutional resources supporting supplemental instruction, bridge programs, and evidence-based teaching practices. These services will become increasingly important as institutions strive to serve a more diverse body of students.
Data Availability Statement
Values needed to evaluate the conclusions in the paper are present in the paper and/or the Supplementary Materials. Additional data related to this paper may be requested from the authors.
Ethics Statement
The studies involving human participants were reviewed and approved by University of Minnesota, IRB 00000800. The patients/participants provided their written informed consent to participate in this study.
Author Contributions
SS, SC, and CB performed the conceptualization and reviewed and edited the manuscript. CB performed the data curation. SS performed the formal analysis. SS and CB performed the visualization and co-wrote the manuscript.
Funding
Preparation of this manuscript was supported in part by the National Science Foundation (Research Coordination Network in Undergraduate Biology Education Grant No. RCN-UBE-1919462).
Conflict of Interest
The authors declare that the research was conducted in the absence of any commercial or financial relationships that could be construed as a potential conflict of interest.
Acknowledgments
We thank Daniel Baltz for help with data organization. Additionally, we thank the following faculty across CSE and CBS, without whom this work would not be possible: S. Azarin, E. Carlson, D. Challou, M. Decker, M. Driessen, V. E. Ferry, E. E. Goldberg, W. Harcombe, S. Jensen, S. McGaugh, C. Scott, D. Wassenberg, and A. Wynveen.
Supplementary Material
The Supplementary Material for this article can be found online at: https://www.frontiersin.org/articles/10.3389/feduc.2020.552364/full#supplementary-material
Report and interpretation of Confirmatory Factor Analysis (CFA) output.
FIGURE S1 | Results from the final five-factor CFA model.
TABLE S1 | Social psychological factor loadings.
TABLE S2 | Latent social psychological factor correlations.
TABLE S3 | SEM full mediation analysis of exam performance.
TABLE S4 | SEM full mediation analysis of total grade.
Footnotes
- ^ We acknowledge that our use of the term “underrepresented minority” here is itself reductive and potentially problematic, given that this term ignores natural variation within and among groups. Further, because “URM” status is often established by non-minoritized persons in positions of power, many individuals reject this term altogether. Absent a better alternative currently, here we use the term ‘underrepresented minority’ (URM) to describe students who identify as American Indian/Alaska Native, Black/African American, Latinx/Hispanic/Hispanic American, and Native Hawaiian or Other Pacific Islander individuals.
References
Aikens, N. L., and Barbarin, O. (2008). Socioeconomic differences in reading trajectories: the contribution of family, neighborhood, and school contexts. J. Educ. Psychol. 100:235. doi: 10.1037/0022-0663.100.2.235
Ballen, C. J., and Mason, N. A. (2017). Longitudinal analysis of a diversity support program in biology: a national call for further assessment. Bioscience 67, 367–373. doi: 10.1093/biosci/biw187
Ballen, C. J., Salehi, S., and Cotner, S. (2017a). Exams disadvantage women in introductory biology. PLoS One 12:e0186419. doi: 10.1371/journal.pone.0186419
Ballen, C. J., Wieman, C., Salehi, S., Searle, J. B., and Zamudio, K. R. (2017b). Enhancing diversity in undergraduate science: self-efficacy drives performance gains with active learning. CBE Life Sci. Educ. 16:ar56. doi: 10.1187/cbe.16-12-0344
Chen, X. (2013). STEM Attrition: College Students’ Paths into and out of STEM Fields. Statistical Analysis Report. NCES 2014-001. Washington, DC: National Center for Education Statistics.
Cohen, G. L., and Garcia, J. (2008). Identity, belonging, and achievement a model, interventions, implications. Curr. Direct. Psychol. Sci. 17, 365–369. doi: 10.1111/j.1467-8721.2008.00607.x
Crisp, G., Nora, A., and Taggart, A. (2009). Student characteristics, pre-college, college, and environmental factors as predictors of majoring in and earning a STEM degree: an analysis of students attending a Hispanic serving institution. Am. Educ. Res. J. 46, 924–942. doi: 10.3102/0002831209349460
Cundiff, J. L., Vescio, T. K., Loken, E., and Lo, L. (2013). Do gender-science stereotypes predict science identification and science career aspirations among undergraduate science majors? Soc. Psychol. Educ. 16, 541–554. doi: 10.1007/s11218-013-9232-8
Diekman, A. B., Clark, E. K., Johnston, A. M., Brown, E. R., and Steinberg, M. (2011). Malleability in communal goals and beliefs influences attraction to stem careers: evidence for a goal congruity perspective. J. Pers. Soc. Psychol. 101:902. doi: 10.1037/a0025199
Eddy, S. L., and Hogan, K. A. (2014). Getting under the hood: how and for whom does increasing course structure work? CBE Life Sci. Educ. 13, 453–468. doi: 10.1187/cbe.14-03-0050
Estrada, M., Burnett, M., Campbell, A. G., Campbell, P. B., Denetclaw, W. F., Gutiérrez, C. G., et al. (2016). Improving underrepresented minority student persistence in STEM. CBE Life Sci. Educ. 15:es5. doi: 10.1187/cbe.16-01-0038
Ferguson, H. B., Bovaird, S., and Mueller, M. P. (2007). The impact of poverty on educational outcomes for children. Paediatr. Child Health 12, 701–706. doi: 10.1093/pch/12.8.701
Freeman, S., O’Connor, E., Parks, J. W., Cunningham, M., Hurley, D., Haak, D., et al. (2007). Prescribed active learning increases performance in introductory biology. CBE Life Sci. Educ. 6, 132–139. doi: 10.1187/cbe.06-09-0194
Haak, D. C., HilleRisLambers, J., Pitre, E., and Freeman, S. (2011). Increased structure and active learning reduce the achievement gap in introductory biology. Science 332, 1213–1216. doi: 10.1126/science.1204820
Haertel, G. D., Walberg, H. J., and Haertel, E. H. (1981). Socio-psychological environments and learning: a quantitative synthesis. Br. Educ. Res. J. 7, 27–36. doi: 10.1080/0141192810070103
Hall, D. M., Curtin-Soydan, A. J., and Canelas, D. A. (2013). The science advancement through group engagement program: leveling the playing field and increasing retention in science. J. Chem. Educ. 91, 37–47. doi: 10.1021/ed400075n
Hausmann, L. R. M., Schofield, J. W., and Woods, R. L. (2007). Sense of belonging as a predictor of intentions to persist among African American and White first-year college students. Res. High. Educ. 48, 803–839. doi: 10.1007/s11162-007-9052-9
Hazari, Z., Sadler, P. M., and Sonnert, G. (2013). The science identity of college students: exploring the intersection of gender, race, and ethnicity. J. Coll. Sci. Teach. 42, 82–91. doi: 10.2307/43631586
Hilton, T. L., and Lee, V. E. (1988). Student interest and persistence in science: changes in the educational pipeline in the last decade. J. High. Educ. 59, 510–526. doi: 10.2307/1981701
Huang, G., Taddese, N., and Walter, E. (2000). Entry and Persistence of Women and Minorities in College Science and Engineering Education. Research and Development Report. NCES 2000-601. Washington, DC: National Center for Education Statistics.
Hulleman, C. S., and Harackiewicz, J. M. (2009). Promoting interest and performance in high school science classes. Science 326, 1410–1412. doi: 10.1126/science.1177067
Hurtado, S., and Ruiz, A. (2012). The climate for underrepresented groups and diversity on campus. Am. Acad. Polit. Soc. Sci. 634, 190–206.
Jones, M. G., Howe, A., and Rua, M. J. (2000). Gender differences in students’ experiences, interests, and attitudes toward science and scientists. Sci. Educ. 84, 180–192. doi: 10.1002/(sici)1098-237x(200003)84:2<180::aid-sce3>3.0.co;2-x
Kitchen, J. A., Sadler, P., and Sonnert, G. (2018). The impact of summer bridge programs on college students’ STEM career aspirations. J. Coll. Stud. Dev. 59, 698–715. doi: 10.1353/csd.2018.0066
Koenig, R. (2009). Minority retention rates in science are sore spot for most universities. Am. Assoc. Adv. Sci. 324, 1386–1387. doi: 10.1126/science.324_1386a
Koester, B. P., Grom, G., and McKay, T. A. (2016). Patterns of gendered performance difference in introductory STEM courses. arXiv [Preprint]. Available online at: https://arxiv.org/abs/1608.07565 (accessed May 8, 2019).
Maloney, E. A., Sattizahn, J. R., and Beilock, S. L. (2014). Anxiety and cognition. Wiley Interdiscipl. Rev. Cogn. Sci. 5, 403–411. doi: 10.1002/wcs.1299
Maton, K. I., Domingo, M. R. S., Stolle-McAllister, K. E., Zimmerman, J. L., and Hrabowski, F. A. III (2009). Enhancing the number of African-Americans who pursue STEM PhDs: meyerhoff scholarship program outcomes, processes, and individual predictors. J. Women Minor. Sci. Eng. 15, 15–37. doi: 10.1615/jwomenminorscieneng.v15.i1.20
Mervis, J. (2010). Better intro courses seen as key to reducing attrition of STEM majors. Science 330:306. doi: 10.1126/science.330.6002.306
Mervis, J. (2011). Weed-out courses hamper diversity. Science 334:1333. doi: 10.1126/science.334.6061.1333
Nguyen, H.-H. D., and Ryan, A. M. (2008). Does stereotype threat affect test performance of minorities and women? A meta-analysis of experimental evidence. J. Appl. Psychol. 93:1314. doi: 10.1037/a0012702
Niu, S. X., and Tienda, M. (2010). Minority student academic performance under the uniform admission law: evidence from the University of Texas at Austin. Educ. Eval. Policy Anal. 32, 44–69. doi: 10.3102/0162373709360063
Owens, M., Stevenson, J., Hadwin, J. A., and Norgate, R. (2014). When does anxiety help or hinder cognitive test performance? The role of working memory capacity. Br. J. Psychol. 105, 92–101. doi: 10.1111/bjop.12009
Picho, K., and Brown, S. W. (2011). Can stereotype threat be measured? A validation of the Social Identities and attitudes scale (SIAS). J. Adv. Acad. 22, 374–411. doi: 10.1177/1932202x1102200302
Pintrich, P. R. (1991). A Manual for the Use of the Motivated Strategies for Learning Questionnaire (MSLQ). Washington, DC: ERIC.
Reid, L. D., and Radhakrishnan, P. (2003). Race matters: the relation between race and general campus climate. Cult. Diver. Ethnic Minor. Psychol. 9:263. doi: 10.1037/1099-9809.9.3.263
Robnett, R. D., Chemers, M. M., and Zurbriggen, E. L. (2015). Longitudinal associations among undergraduates’ research experience, self-efficacy, and identity. J. Res. Sci. Teach. 52, 847–867. doi: 10.1002/tea.21221
Rosseel, Y. (2012). Lavaan: An R Package for Structural Equation Modeling And More. Version 0.5-12 (BETA). Ghent: Ghent University.
Salehi, S., Burkholder, E., LePage, G. P., Pollock, S., and Wieman, C. (2019). The impact of incoming preparation and demographics on performance in Physics I: a multi-institution comparison. arXiv [Preprint]. Available online at: https://arxiv.org/abs/1905.00389 (accessed May 8, 2019).
Schmader, T., and Johns, M. (2003). Converging evidence that stereotype threat reduces working memory capacity. J. Pers. Soc. Psychol. 85:440. doi: 10.1037/0022-3514.85.3.440
Schmader, T., Johns, M., and Forbes, C. (2008). An integrated process model of stereotype threat effects on performance. Psychol. Rev. 115:336. doi: 10.1037/0033-295x.115.2.336
Sewell, W. H., and Shah, V. P. (1967). Socioeconomic status, intelligence, and the attainment of higher education. Sociol. Educ. 40, 1–23. doi: 10.2307/2112184
Stains, M., Harshman, J., Barker, M. K., Chasteen, S. V., Cole, R., DeChenne-Peters, S. E., et al. (2018). Anatomy of STEM teaching in North American universities. Science 359, 1468–1469. doi: 10.1126/science.aap8892
Stanich, C. A., Pelch, M. A., Theobald, E. J., and Freeman, S. (2018). A new approach to supplementary instruction narrows achievement and affect gaps for underrepresented minorities, first-generation students, and women. Chem. Educ. Res. Pract. 19, 846–866. doi: 10.1039/c8rp00044a
Steele, C. M. (1997). A threat in the air. How stereotypes shape intellectual identity and performance. Am. Psychol. 52, 613–629. doi: 10.1037/0003-066x.52.6.613
Steele, C. M., and Aronson, J. (1995). Stereotype threat and the intellectual test performance of African Americans. J. Pers. Soc. Psychol. 69, 797–811. doi: 10.1037/0022-3514.69.5.797
Stout, J. G., Ito, T. A., Finkelstein, N. D., and Pollock, S. J. (2013). “How a gender gap in belonging contributes to the gender gap in physics participation,” in Proceedings of the AIP Conference, Boulder, CO.
Theobald, E. J., Hill, M. J., Tran, E., Agrawal, S., Arroyo, E. N., Behling, S., et al. (2020). Active learning narrows achievement gaps for underrepresented students in undergraduate science, technology, engineering, and math. Proc. Natl. Acad. Sci. 117, 6476–6483. doi: 10.1073/pnas.1916903117
Walton, G. M., and Cohen, G. L. (2011). A brief social-belonging intervention improves academic and health outcomes of minority students. Science 331, 1447–1451. doi: 10.1126/science.1198364
Warburton, E. C., Bugarin, R., and Nunez, A.-M. (2001). Bridging the Gap: Academic Preparation and Postsecondary Success of First-Generation Students. Statistical Analysis Report. Postsecondary Education Descriptive Analysis Reports. Washington, DC: NCES.
Keywords: academic preparation, STEM equity, first-generation, introductory STEM courses, diversity and inclusion
Citation: Salehi S, Cotner S and Ballen CJ (2020) Variation in Incoming Academic Preparation: Consequences for Minority and First-Generation Students. Front. Educ. 5:552364. doi: 10.3389/feduc.2020.552364
Received: 15 April 2020; Accepted: 25 August 2020;
Published: 01 October 2020.
Edited by:
Ida Ah Chee MOK, The University of Hong Kong, Hong KongReviewed by:
Julio Ciro Benegas, National University of San Luis, ArgentinaWang Ruilin, Capital Normal University, China
Copyright © 2020 Salehi, Cotner and Ballen. This is an open-access article distributed under the terms of the Creative Commons Attribution License (CC BY). The use, distribution or reproduction in other forums is permitted, provided the original author(s) and the copyright owner(s) are credited and that the original publication in this journal is cited, in accordance with accepted academic practice. No use, distribution or reproduction is permitted which does not comply with these terms.
*Correspondence: Shima Salehi, c2FsZWhpQHN0YW5mb3JkLmVkdQ==