 Christoph Till
 Ute Sproesser
95% of researchers rate our articles as excellent or good
Learn more about the work of our research integrity team to safeguard the quality of each article we publish.
Find out more
ORIGINAL RESEARCH article
Front. Educ. , 30 June 2020
Sec. Educational Psychology
Volume 5 - 2020 | https://doi.org/10.3389/feduc.2020.00073
This article is part of the Research Topic Psychology and Mathematics Education View all 40 articles
Cognitive psychology has shown that understanding numerical information is deeply related to the format in which this information is presented; percentages are difficult to grasp whereas frequency formats are intuitively accessible. This plays a vital role in the medical domain where difficult risk-related probability judgments have to be made both by professionals and their patients. In this article, we demonstrate that the idea of representing statistical information in terms of frequency formats is not only helpful for communicating risks, but can be applied to primary school stochastics when percentages and fractions are not available. For this purpose, we report on an intervention study conducted in grade 4 in primary school. The results show, on the one hand, that primary school students could already solve Bayesian reasoning tasks in the pretest when natural frequencies were used. On the other hand, the students profited from the intervention where they used different representations, namely colored tinker cubes and natural frequencies in order to describe and quantify frequencies and probabilities. These results go along with findings from cognitive psychology that activities with hands-on material as well as pointing out to the underlying nested-sets structure can foster Bayesian reasoning. The results are discussed in particular with regard to teaching stochastics in (primary) school.
Why do people find probability and statistics unintuitive and difficult? I've been working in this area for around 35 years, and after all this time have finally arrived at an answer. Because probability and statistics are unintuitive and difficult.
–Spiegelhalter and Gage (2014)
The core idea of this paper is to provide empirical evidence from an intervention study in primary school that demonstrates that probability and statistics are not—per se—unintuitive and difficult. It appears that the way stochastic concepts and contents are communicated and represented is often unintuitive and difficult but, can be—at least partly—made accessible already to primary students by using natural frequencies in combination with enactive, hands-on material and activities. In our study, we focus on Bayesian reasoning in the sense of inferring or adjusting probabilities for hypotheses “upon receiving new evidence” (Vallée-Tourangeau et al., 2015, p. 4). First of all, there is an a-priori probability P(H) for a certain hypothesis to be true. When receiving new information (data = D), this probability might be adjusted. In many stochastic situations the conditional probability P(D|H) can be determined from the context. However, what is often of interest is the inversion of this conditional probability, namely P(H|D). In these cases, the Bayes' theorem that can be applied in order to calculate the inversion of such a conditional probability what can be considered as an update of the a-priori probability. Research clearly shows that it is very difficult for many people to understand conditional probabilities and in particular the Bayes' theorem (Gigerenzer and Hoffrage, 1995; Sedlmeier, 2001; Sedlmeier and Gigerenzer, 2001; Hoffrage et al., 2002; Wassner, 2004). With regard to our sample, we won't focus on the Bayes' theorem in this study. However—as we will show in this paper—primary school students can already understand the core idea of Bayesian reasoning in the sense of updating probabilities, if the used representation format is adequate, e.g., if natural frequencies are used. In the following, we will describe how natural frequencies can support human understanding in specific situations.
The way statistical or numerical information is communicated is deeply related to the processes of the human mind and its mechanisms (Gigerenzer and Hoffrage, 1995; Sedlmeier, 2001; Hoffrage et al., 2002; Spiegelhalter et al., 2011). During the last 50 years, there have been disputes between advocates of the heuristics-and-biases tradition and evolutionary psychologists about humans' reasoning and judgment capabilities under uncertainty (Samuels et al., 2002). The hot-button issue is the question of whether human beings lack a sense for probability (Piattelli-Palmarini, 1994) or whether they do indeed have a form of instinct for it (Pinker, 1997). The scholars with a pessimistic mindset come primarily from the ranks of the heuristics-and-biases program. Piattelli-Palmarini (1994), Bazerman and Neale (1986) as well as Gould (1992) state that humans are somewhat probability-blind when reasoning and judging under uncertainty. From their perspective, humans are not capable of making probability-related judgments because of one main reason: The human mind is “not built to work by the rules of probability” (Gould, 1992, p. 469). As a result, human choice behavior will always deviate from normatively appropriate judgments (Samuels et al., 2002). One of the most popular proponents and founder of the heuristics-and-biases program is Daniel Kahneman. In his opinion, there is little hope of eliminating wrong intuitions and biases in probabilistic thinking through instruction (Kahneman, 2011). In contrast, several evolutionary psychologists argue that probabilistic phenomena are too pervasive in nature for humans to lack a sense of them (Pinker, 1997). Almost every incident in everyday life can be described as a probabilistic phenomenon. As a result, the human mind must be capable of dealing with randomness. Moreover, the reasons for the difficulties mentioned above hark back to counterintuitive formats in which probabilities are communicated (Gigerenzer, 1991). Information should be presented in the way people naturally think (Pinker, 1997). As a consequence, cognitive illusions such as the base-rate fallacy or the conjunction fallacy may just disappear (Gigerenzer, 1991). We will now introduce the concept of natural frequencies, a format that might support understanding probabilities.
The concept of natural frequencies was first put forward by Gigerenzer and Hoffrage (1995). It can be vividly illustrated as a natural movement people perform when they, e.g., extract two apples from a basket with 10 apples, or certain tokens from a larger set of tokens (see Figure 1). The relations between those subsets can be interpreted as “nested sets.” The so-called “nested-sets theory” is based on the idea that Bayesian reasoning is deeply intertwined with the understanding of the relation within sets and their subsets (McDowell and Jacobs, 2017; see also Section Possible Explanations for the Advantages of Natural Frequencies: The Nested-Sets Theory and the Ecological Rationality Framework).
Figure 1. Sampling using frequencies: cover image of a German schoolbook for upper-secondary level mathematics (source: Diepgen et al., 1993).
In order to show the specific and intuitive nature of natural frequencies, we contrast them to numerical expressions of percentages. For instance, when describing the proportion of colored tokens from the image in Figure 1, we can either say 7 out of 40 are colored (natural frequencies) or we can say 17.5% tokens are colored (relative frequency as percentage).
Both expressions are mathematically equivalent; however, one appears to be adapted to the human mind because of the natural movement we associate with this expression. We can directly obverse and count the numbers involved in the natural frequency of colored tokens (Hoffrage et al., 2002). Expressions in terms of percentages are more difficult to grasp because of the normalization to 100. This might be explained by the following: the base rate describes the frequency of a certain feature (seven colored tokens) in relation to the population (a total of 40 tokens). Normalization means dividing this absolute frequency by the total number in the population (and multiplying it with 100). As a result of this normalization, the information about the absolute numbers within the population disappear. On the one hand, this procedure facilitates comparing populations of different sizes. On the other hand, this process increases the level of abstraction, since there are no absolute, countable entities in the standardized frequencies, i.e., the percentages.
People might say that natural frequencies are not mathematically valid. Whereas, 7 out of 40 might be considered as only one arbitrary numerical example of the underlying proportion, the percentage 17.5% is the commonly used and most generally accepted representation of this proportion. And it is true that dealing with natural frequencies might not be easy when comparing or computing proportions since sizes of the underlying populations might be different—in contrast to percentages. However, an argument for using natural frequencies is that 7 out of 40 can indeed be considered as a representative of the underlying proportion if we think of it as an expected value. For instance, this expected value can easily be interpreted as the mean proportion of the following: 5 out of 40; 9 out of 40; 6 out of 40 and 8 out of 40. Another argument for using natural frequencies is that they are suitable for describing conditional probabilities. Referring to the example in Figure 1, the conditional probability P (green token | colored tokens) can be described as 2 green out of 7 colored tokens, which is more easy to interpret than the percentage 29% (rounded value of 2/7). Again, a natural movement can be associated, i.e., extracting the colored tokens out of the large set of all tokens and taking the two green tokens out of the small subset of colored tokens.
Within the pioneering edition Judgment under uncertainty—Heuristics and Biases by Kahneman et al. (1982, p. 253), Eddy stressed that medical doctors do not follow the Bayes' formula when solving the following task:
The probability that a woman aged 40 has breast cancer (B) is 1% (P(B) = prevalence = 1%). According to the literature, the probability that the disease is detected by a mammography (M) is 80% (P(M+|B) = sensitivity = 80%). The probability that the test mis-detects the disease, although the patient does not have it is 9.6% (P(M+|B) = 1 - specificity = 9.6%). If a woman aged 40 is tested as positive, what is the probability that she indeed has breast cancer P(B|M+)?
Application of the Bayes' formula yields the following result:
Thus, although having a positive mammography, the probability of breast cancer is only 7.8%, while Eddy (1982) reports that 95 out of 100 doctors wrongly estimated this probability to be between 70 and 80% in his empirical study.
In order to support the estimation of such conditional probabilities, Gigerenzer and Hoffrage (1995) investigated the corresponding representation of uncertainty. In Eddy's task from above, quantitative information was represented as probabilities. Gigerenzer and Hoffrage presented an adaption of Eddy's task to medical doctors: The original probabilities were replaced by a different representation of uncertainty, namely natural frequencies. The adapted task was as follows (ibid., p. 688):
Hundred out of every 10,000 women aged 40 who participate in routine screening have breast cancer. 80 of every 100 women with breast cancer will be detected as positive by a mammography. 950 out of every 9 900 women without breast cancer will also be detected as positive by a mammography. Here is a new representative sample of women aged 40 who have been detected as positive by a mammography in routine screening. How many of these women do you expect to actually have breast cancer?
Putting the numbers into Bayes' formula yields the following result:
Gigerenzer and Hoffrage (1995) reported that nearly half (46%) of all doctors gave the correct answer to this adapted task. This study was one of the first of several studies that empirically confirmed the positive effects of representing information in terms of natural frequencies instead of percentages (Gigerenzer and Hoffrage, 1995; see also Macchi, 1995; Girotto and Gonzalez, 2001). In the following section, we will present further empirical studies comparing natural frequencies with other probability formats such as percentages in order to get a more profound view of their potential benefit.
The frequency-probability-effect, i.e., the fact that using natural frequencies produces higher solution rates than using probabilities, is a very robust phenomenon. It has been replicated in many studies (see, e.g., the meta-analysis of McDowell and Jacobs, 2017). Nevertheless, the correctness of judgments concerning the medical test problem is far from being accurate—even if natural frequencies are used (Pighin et al., 2018). In some cases, single-event probabilities have indeed shown some advantages over natural frequencies. In this sense, Pighin et al. (2018) found that the communication of test results in terms of chances compared to natural frequencies better helped patients to interpret their personal situation. Moreover, Ayal and Beyth-Marom (2014) found evidence that tasks using a natural frequency format were only solved better if not more than one mental step was required. There is evidence that in more complex tasks with several mental steps, probability formats outperform natural frequencies. This might be due to the normalization of the frequencies that is characteristic for probabilities and percentages and that helps to compare and compute different values (Ayal and Beyth-Marom, 2014).
These findings relativize the frequency-probability-effect and, hence, have to be accounted for in this research field. Nevertheless, they play only a minor role for our study conducted in primary school. If any, quantifications of probabilities in primary school are restricted to frequency formats in the sense of “The probability to get a red cube is, e.g., 3 out of 10.”
Two opposite theories, the Nested-Sets Theory and the Ecological Rationality Framework, have been established that provide explanations for the frequency-probability-effect. We will briefly present and contrast them in the following section.
McDowell and Jacobs (2017) state a long-lasting controversy with regard to possible explanations of the frequency-probability-effect. Proponents of the Ecological Rationality Framework ERF (e.g., Gigerenzer and Hoffrage, 1995; Cosmides and Tooby, 1996) assume that there is a specialized module in the human mind that automatically processes natural frequencies. According to ERF, this module has developed through evolution based on an appropriate matching between the human mind and the structure of the environment (McDowell and Jacobs, 2017). As a consequence, the presentation of a Bayesian reasoning task in terms of natural frequencies increases solution rates as these natural frequencies correspond to people's natural environment for millions of years. In particular, the advantages of using natural frequencies are independent from the individual's cognitive resources (Lesage et al., 2013).
A contrary view is expressed by the Nested-Sets Theory (NST) that explains the frequency-probability-effect as a result of emphasizing the nested-sets structure of the Bayesian problem when probabilities are translated into frequency format (Girotto and Gonzalez, 2001; Barbey and Sloman, 2007). By using natural frequencies, this nested-sets structure becomes more prominent and visible. As a result, the analytical system of human mind is triggered and executive resources get available that can be used for calculating a correct answer. Lesage et al. (2013) examined the relationship between cognitive capacity and performance on Bayesian reasoning tasks. Participants with rather low cognitive capacity did not benefit much from facilitating the tasks via using natural frequencies. This finding is in line with NST that states that people with rather low cognitive resources profit less from the nested-sets structure visible in natural frequencies. In contrast, ERF claims that the benefits of using natural frequencies should rather equally apply for people with different levels of cognitive capacity since everyone has such a specialized module that automatically processes natural frequencies.
With regard to the focus of this study, we will not go into further details concerning the presented theories. However, they both emphasize that natural frequencies can help the understanding of, e.g., conditional probabilities or Bayesian reasoning tasks. Moreover, NST provides an analytical explanation for the benefit of using natural frequencies: When people get aware of the nested-sets structure of a Bayesian reasoning task (i.e., by natural frequencies), they will perform better on these tasks. Although this theory can serve as a theoretical basis for our study, as primary school students are able to work on such nested-sets, it has to be noted that there are different factors that mediate people's performance on Bayesian tasks. Such factors will be presented in the following.
The meta-analysis of McDowell and Jacobs (2017) reveals important factors that account for different performances in Bayesian reasoning tasks. Two of the strongest factors concern the characteristics of the tasks and they apply for both natural frequencies and probabilities. First, task performance increases substantially if task complexity is reduced (see in particular Ayal and Beyth-Marom, 2014). This means for instance that less irrelevant information is given in a task or that less mental steps in the mathematical computations are required. Second, if participants are given visual aids, they perform much better since these external representations can clarify the underlying nested-sets structure (McDowell and Jacobs, 2017).
Concerning individual factors, cognitive abilities and thinking dispositions (Sirota et al., 2014), text comprehension (Johnson and Tubau, 2015), as well as numeracy and cognitive reflection (Sirota and Juanchich, 2011) predict Bayesian reasoning performance in both natural frequencies and probability formats. As the meta-study of McDowell and Jacobs (2017) indicates that a high level of numeracy leads to better Bayesian reasoning, Johnson and Tubau (2013) focused their study on this concrete individual characteristic. They found that short and clear natural frequency problems lead to less differences between people with low and high numeracy skills. Hence, both high and low numerate participants were able to adequately solve short Bayesian reasoning tasks using natural frequencies. The solution rates became smaller when the problems were presented in the form of longer word problems both in the natural frequencies and the probability format.
Whereas there are several studies focusing on such individual factors mediating the ability to solve Bayesian reasoning problems, there is only little research on how for example interactivity-based intervention improves performances on Bayesian reasoning tasks. Vallée-Tourangeau et al. (2015) conclude that enabling an enactive, physical manipulation of the problem information leads to substantially better statistical reasoning, without a specific training or instruction. In their study, participants benefited by working with malleable physical representations of a problem, namely playing cards. The participants who solved the problems with playing cards performed better than their peers without.
Although the mentioned studies reveal important findings about mediating factors on people's performance in Bayesian reasoning tasks, there is still the need to explore how this performance can be fostered. In particular, it stands to reason if and how young students with limited experiences in stochastics can be supported in this perspective. Therefore, the next section will present to what extent stochastics and Bayesian reasoning are taught at primary school.
Teaching stochastics in primary school is required by the German curricular standards but restricted to descriptive statistics (e.g., gathering, representing, and analyzing data in the context of tasks related to the students' everyday lives such as “How do you get to school?”) and basic random experiments (e.g., performing experiments with dice and spinners and discussing whether an event is “impossible”, “certain” or “likely” (KMK, 2004)). There is a strong focus on qualitative probability judgments and basic quantitative probability (e.g., “Are you more likely to get a number on the dice between 1 and 2 or a number between 3 and 6?”). Nevertheless, young students' potential does not appear to be fully exploited, as several studies suggest that primary school students are able to do more profound stochastics.
Lindmeier and Reiss (2014), for example, show that children aged from 9 to 12 years can acquire elementary competencies regarding inferential statistics. In their experiment, the students took random samples out of a box with an unknown amount of red and blue cubes. After several trials, they had to estimate the amount and proportion of red and blue cubes in the box.
Other studies indicate that students in primary school are able to grasp an elementary form of conditional probabilities and Bayesian reasoning if these concepts are introduced using natural frequencies (Martignon and Kurz-Milcke, 2006; Martignon and Krauss, 2009; Latten et al., 2011; Till, 2015). Due to the students' young age, these studies focus on their ability to capture the statistical or probabilistic phenomena instead of on their ability to work out the Bayes' formula. Promoting such a propaedeutic understanding of (conditional) probabilities also appears to be an important basis for further learning as, for instance, Diaz and Fuente (2007) show that students often approach probabilities in an algorithmic way: They master the techniques but do not catch the underlying phenomenon.
The study of Zhu and Gigerenzer (2006) used specific tasks promoting (an elementary form of) Bayesian reasoning by means of natural frequencies. Before presenting such student tasks, we will introduce a task by Kahneman (2011, p. 6–7) that served as a model for Zhu and Gigerenzer. In Kahneman's task, which often results in wrong judgments, an individual is described by a neighbor as follows:
Steve is very shy and withdrawn, invariably helpful but with very little interest in people or in the world of reality. A meek and tidy soul, he has a need for order and structure, and a passion for detail. Is Steve more likely to be a librarian or a farmer?
According to Kahneman's (2011) research, most people answered that Steve is probably a librarian. However, as there are five times as many farmers as librarians in the United States, the absolute number of shy and helpful farmers is larger than the absolute number of shy and helpful librarians. Hence, the right answer to Kahneman's task is that it is more likely that Steve is a farmer. The most common mistake in this kind of task is that people neglect the base rate. Gigerenzer and Hoffrage (1995) claim that this typical fallacy—as well as some others—disappears when using natural representation formats.
In order to use such tasks that focus on Bayesian reasoning already in primary school, Kahneman's task was adapted to this age group by Zhu and Gigerenzer (2006). Latten et al. (2011) implemented these ideas several years later in a short learning environment (the cited learning environment originates from Multmeier, see, e.g., Multmeier, 2012). In this adaption, librarians became princesses; farmers became mermaids, and the attribute shy became wearing a crown:
5 out of 60 fairytale characters are princesses, and 4 of these 5 princesses wear a crown. The other 55 out of 60 fairytale characters are mermaids, and 12 of these 55 mermaids wear a crown.
The corresponding question in this task is as follows: “Imagine you see a fairytale character wearing a crown. Would she be more likely to be a princess or a mermaid?”
When solving this task, the students have to concentrate only on the people wearing a crown and mask out all people without crown. Then they can compare the given natural frequencies of fairytale characters with crowns: 4 out of 16 characters with crowns are princesses, whereas 12 out of 16 characters with crowns are mermaids. Therefore, if they were to see a character with the attribute wearing a crown, it would be more likely to be a mermaid! By comparing the concrete numbers, students can realize that although almost every princess wears a crown (4 out of 5), there are altogether more mermaids with a crown. Hence, the attribute wearing a crown applies to more mermaids, which is why it is more likely for a character with a crown to be a mermaid. Understanding these nested-sets structure is essential for Bayesian reasoning.
The presented typical Bayesian reasoning task can be made even more accessible by combining the use of natural frequencies with iconic representations, such as icon arrays (Kurz-Milcke et al., 2011). Several studies have shown the positive effects of visual representations for (probabilistic) problem-solving (Corter and Zahner, 2007; Brase, 2008; Garcia-Retamero et al., 2010; Gaissmaier et al., 2012; McDowell and Jacobs, 2017). As a result of representing statistical information by means of visual representations, subset structures become visible, which is particularly conducive to understanding Bayesian reasoning problems. The big advantage of such visually perceived representations is that all proportions of the relevant features are visible what might help students to intuitively grasp all proportions (Scholz and Waschescio, 1986). Figure 2 displays an iconic representation related to the above-described student task. This representation helps students to realize that there are so-called symptomatic characteristics for certain fairytale characters such as crowns for princesses. In the above-presented task, it helps the students to get aware that the symptomatic characteristic crown does not automatically lead to a higher probability for princesses. As, in this example, the absolute number of mermaids wearing a crown is higher than that of the princesses, the correct answer for the task above is “mermaid.”
Figure 2. Iconic representation of a typical Bayesian task: Icon array. See Till (2015, p. 91).
Of course, there are also other representations that could help students to work on the described Bayesian task. For instance, it can alternatively be modeled using hands-on material in the form of colored tinker cubes. Figure 3 displays such an example. In this simplified version, there are 2 princesses (red) and 8 mermaids (blue). 1 of the 2 princesses and 2 of the 8 mermaids wear a crown (marked in yellow). The other fairytale characters wear no crowns (marked in green). The base rate of princesses is 2 out of 10 (prior probability). Looking for princesses in the sample of the characters with crowns yields a base rate of 1 out of 3 (posterior probability).
Figure 3. Enactive representation of a typical Bayesian task: Tinker cubes. See Till (2015, p. 91).
The previous section shows that there are possibilities of introducing conditional probabilities and Bayesian reasoning already in primary school. In the following, we will sketch empirical results related to using natural frequencies in Bayesian reasoning tasks—in secondary but also in primary school.
In an intervention study, Wassner (2004) compared two ways of teaching the Bayes' formula in a sample of 15- to 17-year-old students: one with probabilities and one with natural frequencies. The students who worked with natural frequencies performed significantly better in the posttest than the students who worked with probabilities. Wassner also reported on long-term effects of the intervention.
In the experimental study “The dog ate my homework!,” Spiegelhalter and Gage (2014) asked 14- to 16-year-old students to model the following Bayesian task: Within a school class, several students were accused of lying about the reasons why they had forgotten their homework. Hence, the study participants had to find out how likely it was that the accused or non-accused students were lying or telling the truth. In order to encode the binary variables (lying/telling the truth; accused/non-accused), the students worked with colored tinker cubes; moreover, all students created 2 × 2 tables and empirical frequency trees. All of these representations were based on natural frequencies, the concrete numbers of students' attributes (lying/telling the truth and accused/non-accused) were assigned randomly. This class experiment indicated that students could easily do probability calculations based on natural frequencies. However, due to the study design, it was not possible to determine the representation format that led to the highest growth in learning.
Zhu and Gigerenzer (2006) showed that children aged from 9 to 11 years can already work successfully on typical Bayesian tasks when the relevant information is presented as natural frequencies. The researchers used a set of ten tasks presented in two different ways: The information was given as probabilities in percentage form to one group of children and as natural frequencies to the other group. The students working with probabilities could not find any right solution at all. In contrast, even the youngest students (aged 9 years) from the group working with natural frequencies solved 14% of the tasks. The 10-year-olds in this group solved 42% and the 11-year-olds 47% of the tasks. These findings indicate that also very young students can deal with conditional probabilities when natural frequencies are used.
In an experiment, Martignon and Kurz-Milcke (2006) asked students aged from 8 to 10 years to construct stochastic situations using tinker cubes and stochastic urns. One of their aims was to foster the development of dynamic mental imagery to represent stochastic situations. The experiment consisted of a so-called “urn arithmetic” in which first elements of expanding proportions were fostered. The students had to compare proportions by constructing equivalent urns in the following manner: We have two urns, namely U1 (1 red: 2 all) and U2 (2 red: 5 all). Which urn is more convenient if we want a red tinker cube? (Martignon and Kurz-Milcke, 2006). Without knowing about fractions the students discussed how to enlarge an urn without changing the odds (1 out of 2 = 2 out of 4). The authors consider “this first confrontation with comparison of proportions and similarity of proportions [as] a fundamental previous step before fractions are introduced” (Martignon and Kurz-Milcke, 2006, p. 3). In their experiment Martignon and Kurz-Milcke also used Kahneman's Bayesian task related to girls' and boys' mathematical enthusiasm and modeled the situation with a big urn in the involved classes. All students in the corresponding class were represented by tinker towers, i.e., a combination of two colored tinker cubes (red/blue for the students' gender, yellow/green for their math enthusiasm). After having gathered the relevant information about the whole class, the towers were categorized in a tree diagram. Based on this tree diagram, students formulated questions such as: “I have a blue cube (boy) behind my back. Do you think I am likely to be a math enthusiast?” Although there was no formal testing in this experiment, the authors stated that representing conditional probabilities via tinker towers in combination with tree-like layouts on the classroom floor helped students to work on Bayesian tasks.
Martignon and Krauss (2009) conducted a study in which they introduced a tool box for decision-making and reckoning with risk. This study was conducted in six grade 4 primary school classes. The students aged 9 to 10 were confronted with a sequence of tasks and playful activities involving, e.g., elementary Bayesian reasoning [“princess/mermaid task” presented in chapter Stochastics and Bayesian Reasoning in Primary School—Status Quo and Potential (Latten et al., 2011)] as well as the comparison of proportions and risks. One focus of the training was dealing with the Wason selection task, a logic puzzle about deductive reasoning. By following logical principles, students needed to figure out which cards to flip over to figure out certain rules. Hence, this game bridges between logical thinking and conditional probabilities. Furthermore, the primary school students played the game “Ludo” and were asked to compare different moves and the associated risks. The authors stated that these playful tasks and activities were fruitful. Again, this study confirmed that primary school students can successfully work on Bayesian tasks.
The study RIKO-STAT (e.g., Kuntze et al., 2010) assessed different competencies in the area of statistical literacy in a sample of primary school, secondary school, and university students. The tasks for the primary school students required them to apply, e.g., an elementary approach to expected values, risk reduction, and comparing proportions. The students were also confronted with the above-described Bayesian reasoning task addressing mermaids and princesses (chapter Stochastics and Bayesian Reasoning in Primary School—Status Quo and Potential). All in all, the students' performance showed considerable weaknesses, and hence, the authors argued in favor of encouraging statistical and probabilistic thinking earlier and more deeply at school. Furthermore, the authors reported that the primary school students performed well on the Bayesian tasks. Analyzing the primary students' strategies showed that many intuitively used an approach focusing on natural frequencies which led to satisfying solution rates, whereas the secondary school students mostly used percentages and did not perform well. The authors assumed that they would have performed better if these secondary school students had applied natural frequencies instead of percentages.
Based on the results from RIKO-STAT, researchers from Ludwigsburg University of Education and cognitive psychologists from the Harding Center for Risk Literacy in Berlin investigated in a sample of primary school students aged 9 to 10 their competencies related to risk (Latten et al., 2011). In this intervention study consisting of six lessons, the students were confronted with first elements of expected values, risk reduction, conditional probabilities, and comparisons of proportions. The authors reported of significantly improved competencies due to the intervention.
The above-mentioned findings show that natural frequencies can be used to foster students' Bayesian reasoning. In the next section, we will outline the corresponding research desideratum of our study.
Since several decades, there is vast empirical evidence that many people have difficulties with Bayesian reasoning—even if they dispose of high cognitive capacity and high numeracy (e.g., Kahneman et al., 1982; Sirota and Juanchich, 2011; McDowell and Jacobs, 2017). One idea to foster Bayesian reasoning, is to confront already young children with corresponding situations and tasks in order to develop valid intuitions. This idea is based and supported by considerations of the previous sections that outlined (a) theoretically-driven explanations for the intuitive character of natural frequencies, (b) empirical findings confirming their advantages compared to probabilities represented as percentages and, in particular, (c) empirical results indicating that natural frequencies can successfully be used at primary school, where percentages, ratios, and fractions are not explicitly addressed—at least not in Germany. In this perspective, the first research question of this study investigates how successful primary school students are with specific Bayesian reasoning tasks represented in natural frequencies. The corresponding research question is:
• To what extent are students in grade 4 able to solve Bayesian reasoning tasks when the information is given in terms of natural frequencies?
Considering empirical evidence from prior research leads to the hypothesis that already young students can handle with such tasks. This study aims at confirming these prior studies and to enlarge them by quantitative evidence—as most of the cited study do not provide quantitative results.
Moreover, and based on the idea that primary school students can successfully work on Bayesian reasoning tasks via natural frequencies, it stands to reason if and how primary school students can be supported in this regard. For this age group, a play- and activity-based approach appears to be adequate that could prepare a valid basis for the further learning about Bayesian reasoning (Martignon and Kurz-Milcke, 2006; Martignon and Krauss, 2009; see also Johnson and Tubau, 2015). The intervention of this study was conceived in this sense as it involves playful learning with enactive representations like tinker cubes. The intervention will be described in the Methods Section in more detail. The corresponding research question focuses on evaluating the effectiveness of this intervention:
• How does a specific intervention affect primary students' performance in tasks related to conditional probabilities and Bayesian reasoning?
As numeracy has proven to be a predictor of Bayesian reasoning in prior research (Johnson and Tubau, 2013), we will control for this covariate when investigating research question 2.
Previous studies have indicated that young students' Bayesian reasoning can be fostered through activities such as in our intervention, but often, a statistical effect has not been proven empirically. In particular, most of the cited studies do not provide an experimental design enabling to quantitatively evaluate an intervention effect of using natural representations. This study closes this research gap and seeks to support the above-mentioned findings using a pretest-posttest design including a control group. In the following, we will describe the method used in this study.
In this study, 244 grade 4 students (131 girls) aged between 8 and 12 years (M = 9.5, SD = 0.61) took part. The students came from 12 classes from six different schools in the surroundings of a medium-sized city in the south of Germany. Eight classes including 152 students were part of the treatment group and four classes including 92 students served as control group (baseline). The classes were not assigned randomly to the different test conditions due to pragmatic reasons (see Limitations Section). In each of the classes, there were around 20 students. As conditional probabilities and Bayesian reasoning are usually taught in grade 10 or 11 at the earliest, the students had no previous school experience with these topics.
In order to determine particular intervention effects, a pre-, post-, follow-up test design with a treatment and control group was chosen. All students from the treatment and control group completed the tests; however, only the students from the treatment group attended stochastics-specific lessons, whereas the students from the control classes attended general and non-stochastics-specific math lessons in the time between the testings. The pre- and posttests were administered directly before and after the intervention; the follow-up test was conducted 3 months after the posttest. These temporal distances were comparable in the treatment and control group.
The intervention effects were analyzed via a multiple regression in SPSS 25. Covariates, such as students' age, gender, and their grades were collected. In this study, we control for the covariate “grades in Mathematics” as a safeguard against possible biases of the intervention effect due to general mathematical competency represented by these grades. This appears to be important as numeracy has shown to be an influencing factor of Bayesian reasoning performances (Sirota and Juanchich, 2011; Johnson and Tubau, 2013).
The intervention included elements of several classroom experiments and studies which had been conducted before at the University of Education in Ludwigsburg as well as at the Max-Planck Institute in Berlin (Martignon and Kurz-Milcke, 2006; Martignon and Krauss, 2009; Latten et al., 2011). In particular, the intervention comprised tasks and activities related to risk and decisions under uncertainty that were intended also to foster first intuitions of expected values. In the first lesson, the students were confronted with a play-based simulation of the following trade-off: “Either you choose one candybar for sure or you can toss a coin. If you get heads, you win four candybars. Otherwise you go empty-handed.” In the second and third lesson the focus was on proportional reasoning as well as on relative and absolute risks (see e.g., Till, 2014, 2015). In the fourth lesson, the students were confronted with a typical Bayesian task during an ordinary 45-min lesson. Because of the focus of this article, we will present the content of this lesson in more detail. The following task, which was adapted from the medical test problem (see chapter Stochastics and Bayesian Reasoning in Primary School—Status Quo and Potential), was discussed in this lesson:
“In a school yard, there are two girls—one with long hair and one with short hair. There are also eight boys—two with long hair and six with short hair. If I told you that I talked with one of these children with long hair. Would you bet it was a girl?”
At the beginning of the lesson, the students were asked several questions about the distribution of different characteristics within their own class such as “How many girls are in this class?” “How many students play soccer in a sports club?” By doing so, the class was introduced to represent the considered population. Afterwards, the initial question relating to countable entities was turned into a probabilistic question: “Imagine someone picks one student out of your class. What is the probability that this person is a girl or a boy?” After some qualitative judgments addressing for instance terms such as “more likely,” the class made quantitative judgments formulated as frequencies (“8 out of 21”). In the sense of Bayesian reasoning, these statements can be understood as a-priori probabilities. After these preparative activities, the task described above was introduced. In order to really understand this Bayesian task and to clarify the nested-sets structure of the problem, a little role play was performed: 10 students (two girls and eight boys) representing the characteristics described in the task were asked to line up in front of the class. The other students described the distribution of the characteristics in the two groups (girls and boys). By doing so, they were unknowingly introduced to natural frequencies: “2 out of 10 children are girls; 1 out of 2 girls has long hair, whereas 2 out of 8 boys have long hair.” Therefore, the characteristic long hair is more typical for a girl. The teacher then asked “I talked with one of these children with long hair. Would you bet it was a girl?” The class discussed about the right answer. In order to make this situation more accessible, the teacher asked the students with long hair to make a step forward. Now all students gave the right answer because they realized the nested-sets structure related to the characteristic “long hair.” Afterwards, the students used colored tinker cubes to encode the features boy, girl, long hair, and short hair in order to model the situation. By putting two cubes together, students were able to represent related characteristics (i.e., a long-haired boy).
According to Diaz and Fuente (2007), there are no standardized tests of (young) students' understanding of conditional probabilities and Bayesian reasoning. Therefore, test items were used that are comparable to the items of Zhu and Gigerenzer (2006). They were structured in the same way as the medical test problem (Eddy, 1982; Cosmides and Tooby, 1996). However, different cover stories were created for the pre-, post-, and follow-up test.
In order to illustrate the test in more detail, we will present and describe two items in the following. The Item FEU (see Figure 4 on the left) is characterized by the fact that students first are asked by a sub-item (a) to determine the a-priori probability of the hypothesis that a student of a certain school comes from the city [P(H)]. Afterwards, they are asked in sub-item (b) to update this probability when new information is given, namely the fact that the observed child has a mobile phone [P(H|D)]. Sub-item (a) draws the students' attention to the frequencies of children coming from the city and the village within the whole set. Sub-item (b) draws their attention to children from the city and village within the subset of children having a mobile phone. As the sub-item (a) might be considered as a trigger to think about the nested-sets structure given in the task—what might help students to answer also sub-item (b)—we label such items as “guided tasks.” In addition to such “guided” tasks, there are “non-guided” task (LaH) that are mathematically equivalent to the presented type-(b) sub-item of the “guided” tasks (see Figure 4 on the right). However, students‘ attention here is not drawn to the nested-sets structure by a preceding type-(a) sub-item. The students are asked about the a-posteriori probability relating to the number of princesses in the subset of individuals wearing a crown [P(H|D)] without being triggered to the frequency of princesses in the whole set.
Figure 4. On the left: “Guided” task (FEU); on the right: “Non-guided” task (LaH).
As mentioned above, we consider the “guided task” as easier to solve because students are triggered to think about and determine the a-priori probability of a hypothesis and then update this probability into an a-posteriori probability when new information is gathered. This consideration is in line with the nested-sets theory (Girotto and Gonzalez, 2001; Barbey and Sloman, 2007) as students' attention is drawn to the nested-sets structure of the given situation. As the sample items illustrate, the tasks were written in a short and comprehensible language to make sure that students of both groups (treatment and control group) exactly understood what they were required to do. The pre-, post-, and follow-up tests all included items where the students (a) had to mark the right answer (single-choice format), (b) fill in the blanks with their answer, or (c) give an explanation for their answer. Hence, altogether there were six items yielding to a maximum score of six points. Tasks with missing values were coded as zero because the students had enough time to complete the tests.
Beyond tasks referring to Bayesian reasoning such as the presented ones, the test included also tasks involving, e.g., elementary comparisons of probabilities, proportions and frequencies, trade-offs as first elements for expected values, and risk reductions. As these tasks are not addressed in this article, we do not report on them in more detail. More information about the test instrument can be found in Till (2015). For ease of reading, in the following we will label the test scores referring to the Bayesian reasoning items only as pre-, post-, and follow-up test scores.
In the following, we present the results of this study in two subsections: First, we report and analyze students' overall performance on the Bayesian reasoning tasks (both treatment and control group) at the different times of testing (see research question 1 und 2). Second and in order to investigate the intervention effects (research question 2) in more detail, we will present solution frequencies of the two items FEU and LaH that were already introduced in the Methods Section.
The overall average of the Bayesian pretest score was 2.96 (SD = 1.48) out of 6 points. The students from the control group had significantly higher pretest scores compared to the students from the treatment group (Mtreatment = 2.81, SD = 1.48; Mcontrol = 3.22, SD = 1.44; t(242) = 2.11, p = 0.036, Cohen's d = 0.28). After the intervention, the students from the treatment group outperformed the students from the control group with a marginally significant p-value [Mtreatment = 4.20, SD = 1.86; Mcontrol = 3.75, SD = 1.74; t(225) = 2.24, p = 0.071, Cohen's d = 0.26]. The increase from pre- to posttest was significant both in treatment [t(143) = −8.39, p < 0.001, Cohen's d = 0.83] and control group [t(82) = 2.74, p = 0.008, Cohen's d = 0.33]. After 3 months, the follow-up test scores of the treatment group were still higher (Mtreatment = 3.84, SD = 1.86; Mcontrol = 3.64, SD = 1.88), though this difference was not significant [t(226) = 0.7595, p = 0.448]. Table 1 displays an overview of these results.
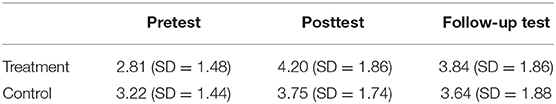
Table 1. Average test scores of the treatment and control group.
In order to get more insight into the intervention effects, a multiple regression was performed including also the covariate grades in Mathematics (considered as a representative of students‘ numeracy). Two models were compared (see Table 2): In the first model, the predictors pretest Bayes score and grades in Mathematics explained 17% of the variance of the posttest Bayes score (pretest predicting follow-up test: 23%). Both predictors proved to be significant, which means that, on average, students with good grades in Mathematics (considered as numeracy) and students with high pretest scores also achieved high posttest scores.
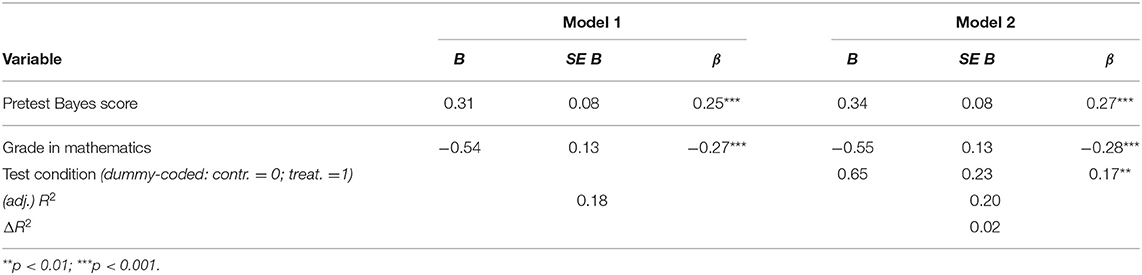
Table 2. Prediction of the posttest results of the Bayesian tasks.
For the second model, the third predictor test condition (dummy-coded with 0 for the control group and 1 for the treatment group) additionally explained 2% of variance. Hence, 19% of the posttest results can be explained by the three predictors pretest score, grade in Mathematics, and test condition. The fact that the predictor test condition had a significant regression weight of 0.18 (p < 0.01) indicates that the short treatment had a significant effect. Determining the effect size for pretest-posttest-designs with treatment and control group (corrected in the sense of Morris, 2008) indicated a medium effect size of d = 0.59. The findings related to the prediction of the 3-months-delayed follow-up test result were similar (see Table 3), whereas in this case the test condition was not significant.
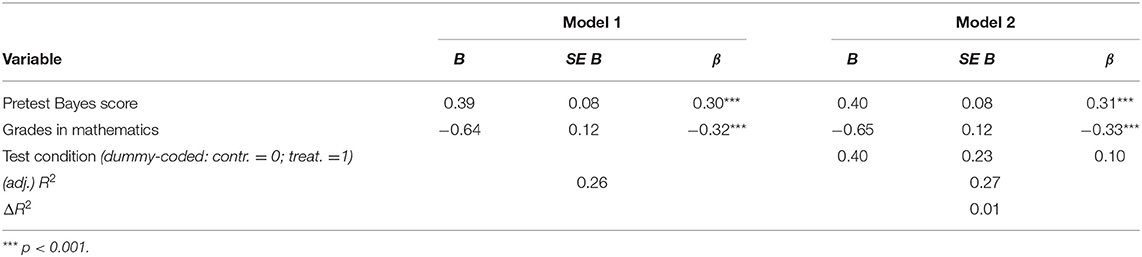
Table 3. Prediction of the follow-up test results of the Bayesian tasks.
As mentioned above and in order to get insight into the intervention effect in more detail, we will now present solution frequencies of two concrete items. As we only consider two items, we do not use t-tests or other inferential statistics. The item FEU represents a so-called “guided task” whereas the item LaH is a “non-guided” task (see Methods Section).
Figures 5, 6 show the different solution frequencies of the treatment and the control group on the two tasks. In the pretest, the majority of the students (68% both in control and treatment group) were able to complete the “guided task” FEU. Only about 23% of the students from the treatment group and 36% of the control group solved the “non-guided” task.
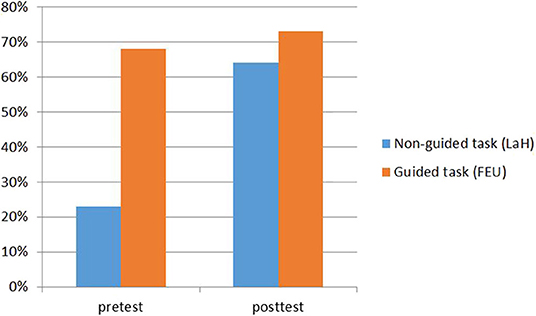
Figure 5. Comparison of solution rates related to two different items (treatment group).
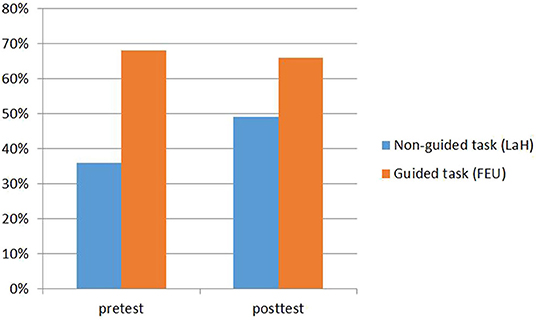
Figure 6. Comparison of solution rates related to two different items (control group).
After the treatment, 64% of the students from the treatment group solved the “non-guided task”, the solution frequency in the control group was 49%. The solution rates of the posttest concerning the “guided task” were still high in both groups (treatment group 73%; control group 66%).
The first—and perhaps the most important—result of this study is the relatively high average pretest score of all students. Even without prior confrontation with Bayesian text problems, the students on average achieved half of the maximum test score. This is even more meaningful when we consider the difficulties that adults (medical doctors, lawyers) have with such tasks (Gigerenzer et al., 2008; Gaissmaier et al., 2012). One explanation of this finding might be the task's representation format, namely natural frequencies. Existing literature (e.g., Gigerenzer and Hoffrage, 1995; Sedlmeier and Gigerenzer, 2001; Hoffrage et al., 2002; Wassner, 2004; Zhu and Gigerenzer, 2006) shows that people benefit from working with natural frequencies when they have to solve probability-related tasks. This applies in particular for a special kind of probability task, the medical test problem, as difficult conditional probabilities and their inversions become easier to understand if they are presented in terms of natural frequencies. Barbey and Sloman (2007) explain that natural frequencies lead to a clear representation of the subset relationships (see also NST, e.g., Girotto and Gonzalez, 2001) and to a simplification of numerical calculations (Sedlmeier, 2001; Sedlmeier and Gigerenzer, 2001; Wassner, 2004). Therefore, we assumed that this format might be also suitable for primary school. This assumption could be confirmed by the present study.
Beyond the representation format of natural frequencies, another explanation of the rather strong average pretest scores might be the short and simple question format of our test instrument that was obviously easy to understand for the children. In particular, this question format made visible the nested-sets structures underlying the tasks. In each task, a given set of individuals with certain attributes had to be considered and absolute numbers had to be compared. As the study shows, many students managed to solve the inversion of the conditional probability task even without the support of the intervention. These results go along with findings from McDowell and Jacobs (2017) according to which short and simple text formats as well as the communication in terms of natural frequencies facilitate Bayesian reasoning tasks. Moreover, the comparison between the “guided” and “non-guided” tasks shows that the students of both groups had less problems with the “guided” task. This is even more impressive when we consider that the “guided task” was arithmetically more demanding than the “non-guided” one (“guided task”: A small school with 60 children; “non-guided task”: A castle with 10 women). In line with the Nested-Sets Theory (Girotto and Gonzalez, 2001; Barbey and Sloman, 2007), this finding was to be expected as the type-(a) sub-item of the “guided” task draw the students' attention to the nested-sets structure and hence makes it more visible. However, as these type-(a) sub-items do not draw the students' attention directly to the structure focused in the type-(b) sub-items, this expectation had to be empirically confirmed. The higher solution rates (pretest) of both groups for the “guided task” confirm that making the nested-sets structure visible helps the students to solve the task.
In the following, we will discuss the intervention effects. A comparison of the results after the intervention reveals that there was a significant difference in students' performance in the test condition. Directly after the intervention and even 3 months later, the students of the treatment group achieved higher test scores than their peers in the control group. Although the absolute differences between the two groups in their average scores in the posttests were not large (Table 1; similar also in the follow-up tests), the scores of the children in the treatment group showed a significantly larger increase from pre- to posttest with a medium effect size (Table 2). These results empirically confirm that young students' Bayesian reasoning could be fostered by the short intervention providing a first experience with natural frequencies and modeling stochastic situations using tinker cubes. Hence, using natural frequencies once again showed up to be appropriate already in primary school. Moreover, the playful and hands-on intervention including a role-play and modeling nested-sets structures with tinker cubes proved to be supporting for the students. This is in line with Vallée-Tourangeau et al. (2015) who claim that making all sets and subsets explicit by enabling enactive activities related to the problem information substantially improves statistical reasoning. One reason for the rather moderate absolute differences between treatment and control group in the post- and follow-up test scores (see Table 1) might be that the maximum score was limited to 6 what means – together with the relatively high pretest scores—that there wasn't much improvement potential for the students. Another reason might be the short duration of the intervention of only one lesson. In such a short period, large improvements cannot to be expected. However, the medium effect sizes allow us to be optimistic about the potential of this approach.
Comparing the intervention effects related to the “guided” and “non-guided” tasks shows that the solutions rates of the “guided” task were relatively stable over time in both groups. However, within the treatment group, the solution rate of the “non-guided” task considerably increased, and even in the control group, higher posttest scores were recorded. We interpret this as follows: For the “guided” tasks, there was a kind of ceiling effect leading to no substantial differences from pre- to posttest. Moreover, the intervention effect appears to be moderate on tasks where the nested-sets structure is already triggered by the task itself. In contrast, the intervention appears to support students' ability to recognize the nested-sets structure particularly in tasks where it is not triggered automatically. The fact that also the students in the control group increased their solution frequency in this task indicates that already the repeated dealing with (“guided” and “non-guided”) Bayesian reasoning tasks supports students' corresponding performance. Hence, experiences with nested-sets structures appear to help students in developing their Bayesian reasoning. In our study, they could particularly be supported by a corresponding training using hands-on activities (and natural frequencies) but also the individual dealing with such tasks can (moderately) improve their corresponding abilities. The slight improvement of the children in the control group is not limited to the “non-guided” tasks but can also be seen in the overall Bayesian reasoning score. This might be explained by familiarity with the test items or (subconscious) learning effects of working on them (including possibly also the informal exchange of the participants between pre- and posttest). It also highlights once again the importance of using an appropriate representation format—which was also used in the test items.
The idea of this article was to evaluate the effect of a representation format that facilitates probabilistic reasoning, namely natural frequencies, in a sample of young students. In contrast to other studies, the focus was not on comparing different factors (e.g., representation format, task-complexity, numeracy) and their influence on Bayesian reasoning performances. In the present study the intention was to empirically prove that an activity-based and playful training can lead to better performances on Bayesian reasoning tasks. Our results show, that already this short intervention had a medium effect, that might be strengthened by a longer duration of the intervention. However, this expectation of a more substantial effect by a longer intervention should be empirically proven. Moreover, the used test instrument should be enlarged by more Bayesian reasoning tasks in order to get a more detailed insight into the effects of such a longer intervention.
Although this study confirmed that students can be fostered in their Bayesian reasoning by an activity-based and playful training it also raises issues for further research. For instance, we support the claim of research that focuses on the following questions: “What strategies are the participants pursuing when solving Bayesian reasoning problems? Which aids are helpful for recognizing the nested-sets structure?” (e.g., playing cards/modeling the subset-relationships via tinker cubes). With this demand we join the research desideratum of McDowell and Jacobs (2017) as well as Vallée-Tourangeau et al. (2015). This desideratum could be approached by qualitative studies in which students communicate their thoughts via interviews or open-ended questions when solving Bayesian reasoning problems.
What are the consequences for teaching probability and statistics (in primary school)? Should we refrain from working with percentages and use only natural frequencies from now on? Of course not. In primary school where fractions and percentages are not available yet, natural frequencies seem to be a suitable way to quantify probabilities at an early stage. In this perspective, our study shows that it is possible to teach already primary school students in Bayesian reasoning when using natural frequencies. We consider such early and playful experiences with Bayesian reasoning as important in order to establish a basis for more abstract contexts (e.g., the formal calculation of probabilities in general or the Bayes‘ theorem). Although our study shows that the early fostering of Bayesian reasoning can be successful, we see two obstacles for its implementation at school: First, time is limited and therefore teachers might put more emphasis, e.g., on arithmetic skills than on statistics. Second, in German primary schools, a considerable number of teachers did not study Mathematics as a main subject. Particularly these teachers cannot draw on solid prerequisites to teach Bayesian reasoning. Developing and implementing primary school teacher trainings could help to overcome both of these obstacles. In particular, teachers here could learn about the importance and benefit of using natural frequencies in primary and secondary school: They allow the quantification of probabilities without using fractions and percentages. Furthermore, they also contribute to strengthen the concept of ratios and fractions at an early stage. Additionally and as our study shows, teachers can use them to introduce Bayesian reasoning at an early stage. For this purpose, also hands-on activities such as using the described tinker cubes can be introduced what illustrates the playful character and the appropriateness of a teaching unit based on the ideas of our intervention for young students. Such teacher trainings might at least lead to overcome the prejudice that statistics and Bayesian reasoning are per se too difficult for primary school. In a longterm perspective, such teacher trainings and implementations of Bayesian reasoning in primary school might have the potential to increase the number of people making reasonable decisions under uncertainty. We are absolutely convinced that enhancing good decisions under uncertainty goes along with an appropriate statistics education at school.
Even though the intervention had an effect on the students' understanding of conditional probabilities and Bayesian problems, there are some limitations that relate to the design of the study. First, students who participated in a training were compared to students who had no training at all (baseline control group). Although no different treatments were tested against each other, comparing the treatment group to a baseline control group appears to be appropriate in order to evaluate the effectiveness of new ideas and learning approaches. Second, in this study, the classes were not assigned randomly to the different test conditions. This is caused by the fact that in Germany, school interventions hinge on the willingness of the teachers. Some teachers wanted their class to be part of the intervention. Others only wanted to be part of the control group. In order not to refuse participation in this study to any of the teachers, their corresponding requests were satisfied. Therefore, and as we consider a large number of students in the treatment group as more important than in the control group, their ratio is not perfectly balanced. In order to account for the different pretest scores in the treatment and control group, this variable was controlled for in the multiple regression analysis. A multilevel analysis due to the hierarchical structured sample (classes/schools) has not been carried out as the sample of this study was not large enough. Further studies with bigger samples could take into account this hierarchical structure.
The dataset used for the analyses presented in this article are available in the Supplementary Material.
Ethical review and approval was not required for the study on human participants in accordance with the local legislation and institutional requirements. Written informed consent to participate in this study was provided by the participants' legal guardian/next of kin.
CT and US are accountable for the content of this article.
The authors were members of the Cooperative Research Training Group of the University of Education, Ludwigsburg, and the University of Tübingen, which was supported by the Ministry of Science, Research, and the Arts in Baden-Württemberg. A former version of this article was published in the context of the Ph.D. thesis of CT under the supervision of L. Martignon. The publication of this paper was funded by the Open Access Fund of the University of Koblenz-Landau.
The authors declare that the research was conducted in the absence of any commercial or financial relationships that could be construed as a potential conflict of interest.
The Supplementary Material for this article can be found online at: https://www.frontiersin.org/articles/10.3389/feduc.2020.00073/full#supplementary-material
Ayal, S., and Beyth-Marom, R. (2014). The effects of mental steps and compatibility on Bayesian reasoning. Judgment Decision Making 9, 226–242.
Barbey, A. K., and Sloman, S. A. (2007). Base-rate respect: from statistical formats to cognitive structures. Behav. Brain Sci. 30, 287–292. doi: 10.1017/S0140525X07001963
Bazerman, M., and Neale, M. (1986). “Heuristics and negotiation,” in Judgment and Decision Making: an Interdisciplinary Reader, eds H. Arkes, and K. Hammond (Cambridge: Cambridge University Press), 311–321.
Brase, G. L. (2008). Pictorial Representations in Statistical Reasoning. Retrieved from Available online at: http://www.k-state.edu/psych/research/documents/2009ACP.pdf (accessed February 13, 2020).
Corter, J. E., and Zahner, D. C. (2007). Use of external visual representations in probability problem solving. Stat. Educ. Res. J. 6, 22–50.
Cosmides, L., and Tooby, J. (1996). Are humans good intuitive statisticians after all? Rethinking some conclusions from the literature on judgment under uncertainty. Cognition 58, 1–73. doi: 10.1016/0010-0277(95)00664-8
Diaz, C., and Fuente, D. (2007). Assessing students' difficulties with conditional probability. Int. Electron. J. Math. Educ. 2, 128–148.
Diepgen, R., Kuypers, W., and Karlheinz, R. (1993). Mathematik Gymnasiale Oberstufe. Allgemeine Ausgabe/Stochastik: Grund- und Leistungskurs. Berlin: Cornelsen Verlag.
Eddy, D. M. (1982). “Probabilistic reasoning in clinical medicine: problems and opportunities,” in Judgment under Uncertainty: Heuristics and Biases, eds D. Kahneman, P. Slovic, and A. Tversky (Cambridge: Cambridge University Press), 335–347.
Gaissmaier, W., Wegwarth, O., Skopec, D., Müller, A.-S., Broschinski, S., and Politi, M. C. (2012). Numbers can be worth a thousand pictures: individual differences in understanding graphical and numerical representations of health-related information. Health Psychol. 31, 286–296. doi: 10.1037/a0024850
Garcia-Retamero, R., Galesic, M., and Gigerenzer, G. (2010). Do icon arrays help reduce denominator neglect? Med. Decision Making 30, 672–684. doi: 10.1177/0272989X10369000
Gigerenzer, G. (1991). How to make cognitive illusions disappear. Beyond “heuristics and biases”. Eur. Rev. Soc. Psychol. 2, 83–115. doi: 10.1080/14792779143000033
Gigerenzer, G., Gaissmaier, W., Kurz-Milcke, E., Schwartz, L. M., and Woloshin, S. (2008). Helping doctors and patients make sense of health statistics. Assoc. Psychol. Sci. 8, 53–96. doi: 10.1111/j.1539-6053.2008.00033.x
Gigerenzer, G., and Hoffrage, U. (1995). How to improve bayesian reasoning without instruction: frequency formats. Psychol. Rev. 102, 684–704. doi: 10.1037/0033-295X.102.4.684
Girotto, V., and Gonzalez, M. (2001). Solving probabilistic and statistical problems: a matter of information structure and question form. Cognition 78, 247–276. doi: 10.1016/S0010-0277(00)00133-5
Gould, S. (1992). Bully for Brontosaurus. Further Reflections in Natural History. London, UK: Penguin Books.
Hoffrage, U., Gigerenzer, G., Krauss, S., and Martignon, L. (2002). Representation facilitates reasoning: what natural frequencies are and what they are not. Cognition 84, 343–352. doi: 10.1016/S0010-0277(02)00050-1
Johnson, E. D., and Tubau, E. (2013). Words, numbers, and numeracy: diminishing individual differences in Bayesian reasoning. Learn. Individual Differ. 28, 34–40. doi: 10.1016/j.lindif.2013.09.004
Johnson, E. D., and Tubau, E. (2015). Comprehension and computation in Bayesian problem solving. Front. Psychol. 6:938. doi: 10.3389/fpsyg.2015.00938
Kahneman, D., Slovic, P., and Tversky, A. (1982). Judgment under uncertainty: Heuristics and biases. Cambridge: Cambridge University Press.
KMK (2004). Bildungsstandards im Fach Mathematik für den Primarbereich. Retrieved from Available online at: https://www.kmk.org/fileadmin/Dateien/veroeffentlichungen_beschluesse/2004/2004_10_15-Bildungsstandards-Mathe-Primar.pdf (accessed Febuary 13, 2020).
Kuntze, S., Gundlach, M., Engel, J., and Martignon, L. (2010). “Aspects of statistical literacy between competency measures and indicators for conceptual knowledge – empirical research in the project ‘RIKO-STAT’,” in Proceedings of the 8th International Conference on Teaching Statistics (ICOTS8) (Ljubljana).
Kurz-Milcke, E., Gigerenzer, G., and Martignon, L. (2011). Risiken durchschauen: grafische und analoge Werkzeuge. Stochastik in der Schule 31, 8–16.
Latten, S., Martignon, L., Monti, M., and Multmeier, J. (2011). Die Förderung erster Kompetenzen für den Umgang mit Risiken bereits in der Grundschule. Ein Projekt von RIKO-STAT und dem Harding Center. Stochastik in der Schule, 31, 17–25.
Lesage, E., Navarrete, G., and De Neys, W. (2013). Evolutionary modules and Bayesian facilitation: The role of general cognitive resources. Think. Reason. 19, 27–53. doi: 10.1080/13546783.2012.713177
Lindmeier, A., and Reiss, L. (2014). Wahrscheinlichkeitsvergleich und inferenzstatistisches Schließen. Fähigkeiten von Kindern des 4. und 6. Schuljahres bei Basisproblemen aus dem Bereich Daten und Zufall. Math. Didactica, 37, 30–60.
Macchi, L. (1995). Pragmatic aspects of the base rate fallacy. Q J. Exp. Psychol. 48, 188–207. doi: 10.1080/14640749508401384
Martignon, L., and Krauss, S. (2009). Hands-on activities for fourth graders: a tool box for decision-making and reckoning with risk. Int. Electron. J. Math. Educ. 4, 227–258.
Martignon, L., and Kurz-Milcke, E. (2006). “Educating children in stochastic modeling: games with stochastic urns and colored tinker-cubes,” in: Proceedings of the 7th International Conference on Teaching Statistics (ICOTS7) (Salvador).
McDowell, M., and Jacobs, P. (2017). Meta-analysis of the effect of natural frequencies on Bayesian reasoning. Psychol. Bull. 143, 1273–1312. doi: 10.1037/bul0000126
Morris, S. B. (2008). Estimating effect sizes from pretest-posttest-control group designs. Organ. Res. Methods 11, 364–386. doi: 10.1177/1094428106291059
Multmeier, J. (2012). Representations Facilitate Bayesian Reasoning: Omputational Facilitation and Ecological Design Revisited. Berlin: Freie Universität Berlin, 2012 (unveröffentlichte Dissertation).
Piattelli-Palmarini, M. (1994). InevitableIillusions: How Mistakes of Reasons Rule our Minds. New York, NY: John Wiley.
Pighin, S., Tentori, K., Savadori, L., and Girotto, V. (2018). Fostering the understanding of positive test results. Ann. Behav. Med. 52, 909–919. doi: 10.1093/abm/kax065
Samuels, R., Stich, S., and Bishop, M. (2002). Ending the rationality wars: how to make disputes about human reasoning disappear. In R. Elio (Ed.), Common sense, reasoning and rationality (pp. 311–321). New York: New York: OUP. doi: 10.1093/0195147669.003.0011
Scholz, R. W., and Waschescio, R. (1986). Kognitive Strategien von Kindern bei Zwei-Scheiben Rouletteaufgaben. In Beiträge zum Mathematikunterricht. Hannover: Franzbecker.
Sedlmeier, P. (2001). “Statistik ohne Formeln,” in Anregungen zum Stochastikunterricht: die NCTM-Standards 2000; Klassische und Bayessche Sichtweise im Vergleich, eds M. Borovcnik, J. Engel, and D. Wickmann (Berlin: Verlag Franzbecker), 83–95.
Sedlmeier, P., and Gigerenzer, G. (2001). Teaching bayesian reasoning in less than two hours. Exp. Psychol. General 130, 380–400. doi: 10.1037/0096-3445.130.3.380
Sirota, M., and Juanchich, M. (2011). Role of numeracy and cognitive reflection in Bayesian reasoning with natural frequencies. Studia Psychologica, 53, 151–161.
Sirota, M., Juanchich, M., and Hagmayer, Y. (2014). Ecological rationality or nested sets? Individual differences in cognitive processing predict Bayesian reasoning. Psychonomic Bull. Rev. 21, 198–204. doi: 10.3758/s13423-013-0464-6
Spiegelhalter, D., and Gage, J. (2014). “What can education learn from real-world communication of risk and uncertainty,” in Proceedings of the 8th International Conference on Teaching Statistics (ICOTS9) (Flagstaff), 1–7.
Spiegelhalter, D., Pearson, M., and Short, I. (2011). Visualizing uncertainty about the future. Science 333, 1393–1400. doi: 10.1126/science.1191181
Till, C. (2014). Fostering risk literacy in elementary school. Int. Electron. J. Math. Educ. 9, 85–98.
Till, C. (2015). Entwicklung der Vorstellungen von Grundschülerinnen und Grundschülern zu Risiko und Entscheidungen unter Unsicherheit (Dissertationsschrift). Retrieved from Available online at: https://phbl-opus.phlb.de/frontdoor/deliver/index/docId/70/file/Dissertation+TILL+-+Risiko.pdf (accessed on Febraury 13, 2020).
Vallée-Tourangeau, G., Abadie, M., and Vallée-Tourangeau, F. (2015). Interactivity fosters Bayesian reasoning without instruction. J. Exp. Psychol. 144, 581–603. doi: 10.1037/a0039161
Wassner, C. (2004). Förderung Bayesianischen Denkens. Kognitionspsychologische Grundlagen und didaktische Analysen (Dissertationsschrift, Hildesheim). doi: 10.1007/BF03339021
Keywords: natural frequencies, Bayesian reasoning, representations, empirical study, primary school
Citation: Till C and Sproesser U (2020) Frequency Formats: How Primary School Stochastics Profits From Cognitive Psychology. Front. Educ. 5:73. doi: 10.3389/feduc.2020.00073
Received: 31 October 2019; Accepted: 07 May 2020;
Published: 30 June 2020.
Edited by:
Karin Binder, University of Regensburg, GermanyReviewed by:
Daniel Frischemeier, University of Paderborn, GermanyCopyright © 2020 Till and Sproesser. This is an open-access article distributed under the terms of the Creative Commons Attribution License (CC BY). The use, distribution or reproduction in other forums is permitted, provided the original author(s) and the copyright owner(s) are credited and that the original publication in this journal is cited, in accordance with accepted academic practice. No use, distribution or reproduction is permitted which does not comply with these terms.
*Correspondence: Ute Sproesser, dXRlc3Byb2Vzc2VyQHVuaS1rb2JsZW56LmRl
Disclaimer: All claims expressed in this article are solely those of the authors and do not necessarily represent those of their affiliated organizations, or those of the publisher, the editors and the reviewers. Any product that may be evaluated in this article or claim that may be made by its manufacturer is not guaranteed or endorsed by the publisher.
Research integrity at Frontiers
Learn more about the work of our research integrity team to safeguard the quality of each article we publish.