 Andrea Horbach
 Torsten Zesch
- Language Technology Lab, University Duisburg-Essen, Duisburg, Germany
Automatic content scoring is an important application in the area of automatic educational assessment. Short texts written by learners are scored based on their content while spelling and grammar mistakes are usually ignored. The difficulty of automatically scoring such texts varies according to the variance within the learner answers. In this paper, we first discuss factors that influence variance in learner answers, so that practitioners can better estimate if automatic scoring might be applicable to their usage scenario. We then compare the two main paradigms in content scoring: (i) similarity-based and (ii) instance-based methods, and discuss how well they can deal with each of the variance-inducing factors described before.
1. Introduction
Automatic content scoring is a task from the field of educational natural language processing (NLP). In this task, a free-text answer written by students should be automatically assigned a score or correctness label in the same way as a human teacher would do. Content scoring tasks have been a popular exercise type for a variety of subjects and educational scenarios, such as listening or reading comprehension (in language learning) or definition questions (in science education). In a traditional classroom-setting, answers to such exercises are manually scored by a teacher, but in recent years, their automatic scoring has received growing attention as well (for an overview, see e.g., Ziai et al., 2012 and Burrows et al. (2014)). Automatic content scoring may decrease the manual scoring workload (Burstein et al., 2001) as well as offer more consistency in scoring (Haley et al., 2007). Additionally, automatic scoring provides the advantage that evaluation can happen in the absence of a teacher so that students may receive feedback immediately without having to wait for human scoring. With the increasing popularity of MOOCS and other online learning platforms, automatic scoring has become a topic of growing importance for educators in general.
In this paper, we restrict ourselves to short-answer questions as one instance of free-form assessment. While other test types, such as multiple choice items, are much easier to score, free-text items have an advantage from a testing perspective. They require active formulation instead of just selecting the correct answer from a set of alternatives, i.e., they test production instead of recognition.
Answers to short-answer questions have a typical length between a single phrase and two to three sentences. This places them in length between gap-filling exercises, which often ask for single words, and essays, where learners write longer texts. We do not cover automatic essay scoring in this article, even if it is related to short-answer scoring, and to some extent even the same methods might be applied. The main reason is that scoring essays usually takes into consideration the form of the essay (style, grammar, spelling, etc.) in addition to content (Burstein et al., 2013), which introduces many additional factors of influence that are beyond our scope.
Figure 1 shows examples from three different content scoring datasets (ASAP, POWERGRADING and SEMEVAL) and highlights the main components of a content scoring scenario: a prompt, a set of learner answers with scoring labels, and (one or several) reference answers.
• A prompt consists of a particular question and optionally some textual or graphical material the question is about (this additional material is omitted in Table 1 for space reasons).
• A set of learner answers that are given in response to that prompt. The learner answers in our example have different length ranging from short phrasal answers in POWERGRADING to short paragraphs in ASAP. They may also contain spelling or grammatical errors. As discussed above, these errors should not be taken into consideration when scoring an answer.
• The task of automatic scoring is to assign a scoring label to a learner answer. If we want to learn such an assignment mechanism, we typically need some scored examples, i.e., learner answers with a gold-standard scoring label assigned by a human. As we can see in the example, the kind of label varies between datasets and can be either numeric or categorial, depending on the nature of the task and also of the purpose of the automatic scoring.
Numeric or binary scoring labels, as we see in ASAP and POWERGRADING, can be easily summed up and compared. They are thus often used in summative feedback, where the goal is to inform teachers, e.g., about the performance of students in a homework assignment. For formative feedback, which is directed toward the learner, in contrast, a more informative categorical label might be preferable, e.g., to inform a student of their learning progress. The SEMEVAL data is an example for scoring labels aiming into that direction.
• In addition to learner answers, datasets often include teacher-specified reference answers for each label. A reference answer showcases a representative answer for a given score and can be used for (human or automatic) comparison with a learner answer. Alternatively, scoring guidelines describing properties of answers with a certain score can be provided. This is often the case when answers are so complex that just providing a small number of reference answers does not nearly cover the conceptual range of possible correct answers and misconceptions. This is for example the case for the ASAP dataset. When reference answers are given, many datasets only provide reference answers for correct answers and not for incorrect ones, e.g., POWERGRADING and SEMEVAL.
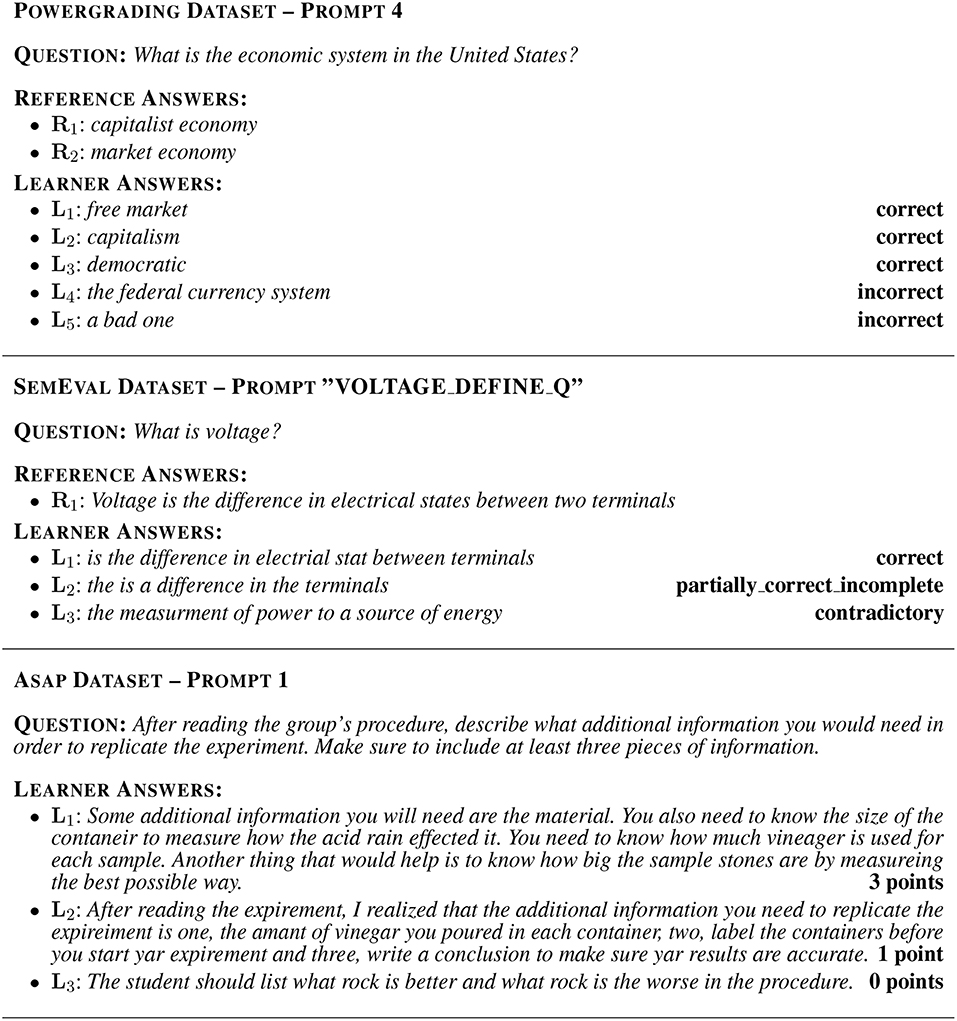
Figure 1. Exemplary content scoring prompts from three different datasets with reference answers (if available) as well as several learner answers with their scoring labels.

Table 1. Dataset statistics.
The content scoring scenario with its interrelated textual components – a prompt, learner answers, and a reference answer – render automatic content scoring a challenging application of Natural Language Processing which bears strong resemblances to various core NLP fields like paraphrasing (Bhagat and Hovy, 2013), textual entailment (Dagan et al., 2013), and textual similarity (Bär et al., 2012). In all those fields, the semantic relation between two texts is assessed, a method that directly transfers to the comparison between learner and reference answers, as we will see later.
During recent years, many approaches for automatic content scoring have been published on various datasets (see Burrows et al. (2014) for an overview). A practitioner who is considering using automatic scoring for their own educational data might easily feel overwhelmed. They might find it hard to compare approaches and draw conclusions for their applicability on their specific scoring scenario. In particular, approaches often apply various machine learning methods with a variety of features and are trained and evaluated using different datasets. Thus, comparing any two approaches from the literature can be difficult.
This paper aims to shed light on the individual factors influencing automatic content scoring and identifies the variance in the answers as one key factor that makes scoring difficult. We start in section 2 by discussing the nature of this variance, followed by a discussion of datasets and their parameters that influence variance. We discuss in section 3 properties of automatic scoring methods and review existing approaches, especially with respect to whether they score answers based on features extracted from the answers themselves or based on a comparison with a reference answer. We then discuss in section 4 how these factors can be isolated in scoring experiments. We either provide own experiments, discuss relevant studies from the literature, or formulate requirements for datasets that would make currently infeasible experiments possible.
2. Variance in Learner Answers
Variance is the reasons why automatic scoring has to go beyond simply matching learner answers to reference answers. The more variance we find in the learner answers, the more complex the scoring model has to be and therefore the harder is the content scoring task (Padó, 2016). Thus, in this section, we discuss why variance increases the difficulty of automatic scoring and analyze publicly available datasets with respect to the variance-inducing properties.
2.1. Sources of Variance
From an NLP perspective, automating content scoring of free-text prompts is a challenging task, mainly due to the textual variance of answers given by the learner. Variance can occur on several levels, as highlighted in Figure 2. It can occur both on the conceptual level as well as on the realization level, whereas variance in realization can mean variance of the linguistic expression as well as orthographic variance.
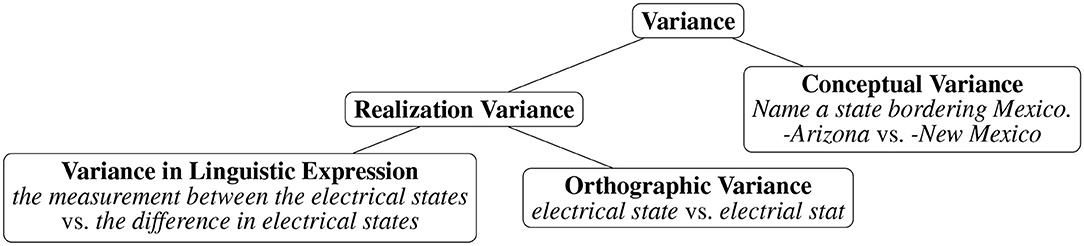
Figure 2. Sources of variance in content scoring.
2.1.1. Conceptual Variance
Conceptual variance occurs when a prompt asks for multiple aspects or has more than one correct solution. For example, in the prompt Name one state that borders Mexico from the POWERGRADING dataset, there are four different correct solutions: California, Arizona, New Mexico, and Texas. A scoring method needs to take all of them into account. However, conceptually different correct solutions are not the main problem, as their number is usually rather small. The much bigger problem is variance within incorrect answers, as there are usually many ways for a learner to get an answer wrong so that incorrect answers often correspond to several misconceptions. For the Powergrading example prompt in Table 1 (asking What is the economic system in the United States?), frequent misconceptions center around democracy or US dollar, but there also is a long tail of infrequent other misconceptions.
2.1.2. Variance in Realization
In contrast to the conceptual variance we have just discussed, which covers different ways of conceptually answering a question, variance in realization means different ways of formulating the same conceptual answer. We consider variance in linguistic expression as well as variance on the orthographic level.
2.1.2.1. Variance of Linguistic Expression
This refers to the fact that natural language provides many possibilities to express roughly the same meaning (Meecham and Rees-Miller, 2005; Bhagat and Hovy, 2013). This variance of expression makes it in most cases impossible to preemptively enumerate all correct solutions to a prompt and score new learner answers by string comparison alone. For example consider the following three sentences. They all come from the SEMEVAL prompt in Figure 1. The first is a reference answer, while the other two are learner answers.
• R Voltage is the difference in electrical states between two terminals
• L1 [Voltage] is the difference in electrial stat between terminals
• L2 [Voltage is] the measurement between the electrical states of the positive and negative terminals of a battery.
While the first learner answer in the example above shares many words with the reference answer, the second learner answer has much lower overlap. The term difference is replaced by the related term measurement. For such cases of lexical variance, we need some form of external knowledge to decide that difference and measurement are similar.
2.1.2.2. Orthographic Variance
A property of (especially non-native) learner data that also contributes toward high realization variance in the data is the orthographic variability and occurrence of linguistic deviations from the standard (Ellis and Barkhuizen, 2005), which can also make it hard for humans to understand what was intended (Reznicek et al., 2013). For example in the learner answer L1 above, the learner misspelled electrical state as electrial stat. The number of spelling errors – and thus how pronounced this deviation is – depends on a number of factors, such as whether answers have been written by language learners or native speakers or whether answers refer to a text visually available to the learner at the time of writing the answer or not.
2.2. Content Scoring Datasets
In the following, we introduce publicly available datasets for content scoring. Afterwards, we categorize all datasets in Tables 1, 2 according to various factors that influence variance. The datasets come from different research contexts, we present them here in alphabetical order:
• The ASAP dataset2 has been released for the purpose of a scoring competition and contains answers collected at US high schools for 10 different ppts from various subjects. The main distinguishing features for this dataset are the large number of answers per individual prompt as well as relative high length of answers. A German version of the dataset, ASAP-DE, addressing three of the science prompts, has been collected by Horbach et al. (2018).
• The CREE dataset (Bailey and Meurers, 2008) contains answers given by learners of English as a foreign language for reading comprehension questions. The number of answers per prompt as well as the overall number of learner answers in this dataset is comparably low.
• The CREG dataset (Meurers et al., 2011a) is similar to CREE in that it targets reading comprehension questions for foreign language learners, but here the data is in German, so it is an instance of a non-English dataset. Answers were given by beginning and intermediate German-as-a-foreign-language learners at two US universities and respond to reading comprehension questions.
• The CS dataset (Mohler and Mihalcea, 2009) contains answers to computer science questions given by participants of a university course. In this dataset, the questions stand alone and do not address additional material, such as reading texts or experiment descriptions.
• The CSSAG dataset (Pado and Kiefer, 2015) contains computer science questions collected from participants of a university-level computer-science class in German.
• The Powergrading dataset (Basu et al., 2013) addresses questions from US immigration exams and learner answers have been crowd-sourced. It is unclear what the language proficiency of the writers is, including whether they are native speakers or not. The dataset contains the shortest learner answers of all datasets.
• The Portuguese PT_ASAG dataset (Galhardi et al., 2018) contains learner answers collected in biology classes at schools in Brazil using a web system. Apart from reference answers for each question, the dataset also contains keywords specifying aspects of a good question.
• The Student Response Analysis (SRA) dataset (Dzikovska et al., 2013) was used in SemEval-2013 shared task. It consists of two subsets, both dealing with science questions: The Beetle subset covers student interactions with a tutoring system, while the SciEntsBank subset contains answers to assessment questions. A special feature of this dataset is that learner answers are annotated with three different types of labels: (i) binary correct/incorrect decisions, (ii) with categories used for recognizing textual entailment such as whether an answer entails or contradicts the reference answer), as well as (iii) formative assessment labels, informing students, e.g., that an answer is partially correct, but incomplete.
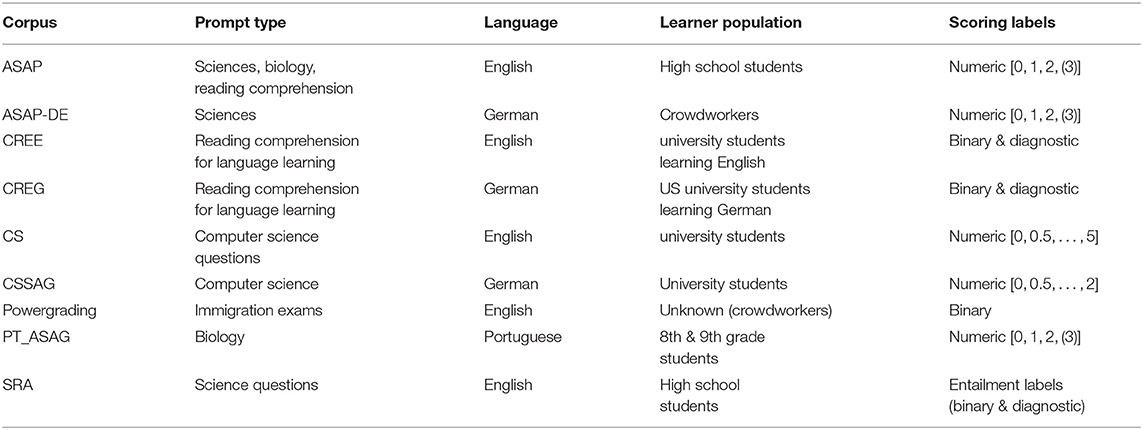
Table 2. Overview of content scoring datasets.
2.3. Dataset Properties Influencing Variance
We now discuss dataset-inherent properties that can help us to estimate the amount of variance to be expected in data.
2.3.1. Prompt Type
The type of prompt has a strong influence on the expected answer variance. Imagine, for example, a factual question like Where was Mozart born? and a reading comprehension question such as What conclusion can you draw from the text? For the first question, there is no variance in the correct answers (Salzburg) and probably only little variance in the misconceptions (Vienna). For the second question, a very high variance is to be expected. In general, the more open-ended a question is, the harder it will be to automatize its scoring.
Different answer taxonomies have been proposed to classify questions in the classroom according to the cognitive processes involved for the student and they provide also clues about ease of automatic scoring. Anderson et al. (2001) provide a classification scheme according to the cognitive skills that are involved in solving an exercise: remembering, understanding, applying, analyzing, evaluating, and creating in ascending order of difficulty for the student. This taxonomy could of course also be applied to content scoring prompts. Padó (2017) annotates questions in the CSSAG dataset according to this taxonomy and finds that questions from the lower categories are not only easier for students, but produce also less variance and need less elaborate methods for automatic scoring. She also finds that the instructional context of a question needs to be considered when assigning a level (e.g., to differentiate between a real analyzing question and one that is actually a remembering question because the analysis has been explicitly made in the course). Therefore it is hard to apply such a taxonomy to a dataset where the instructional context is unknown.
A taxonomy specifically for reading comprehension questions has been developed by Day and Park (2005). It classifies questions by comprehension as literal, reorganization, inference, prediction, evaluation, and personal response (again ordered from easy to hard). Literal questions are the easiest because their answers can be found verbatim in the text. Such questions tend to have lower variance, especially when given to low-proficiency learners, as they often lift their answers from the text. Also for this taxonomy, it has been found that reading comprehension prompts for language learners focus on the lower comprehension types (Meurers et al., 2011b) and that among these literal questions are easier to score than reorganization and inference questions. We argue that questions with comprehension types higher in the taxonomy contain so much variance that they are difficult to handle automatically. An example for a personal response question from Day and Park (2005) is What do you like or dislike about this article? We argue that answers to such questions go beyond content-based evaluation and rather touch the area of essay scoring, as how an opinion is expressed it might be more important than its actual content.
The modality of a prompt also plays a role. By modality, we mean whether a question refers to a written or a spoken text. Especially for non-native speakers, listening comprehension exercises will yield a much higher variance as learners cannot copy material from the text based on the written form, but mostly write what they think they understood auditorily. This leads especially to a high orthographic variance and makes scoring harder compared to a similar prompt administered as reading comprehension exercise.
Table 2 shows that existing datasets cover very diverse prompts from reading comprehension for language learning over science question to biology and literature questions, but that they do not nearly cover all possible prompt types.
2.3.2. Answer Length
Answer length of course is strongly related to the type of question asked. Where or when questions usually require only a phrasal answer, whereas why questions are often answered with complete sentences. Shorter answers consisting of only a few words often correspond only to a single concept mentioned in the answer (see the example from the POWERGRADING dataset in Table 1), whereas longer answers (as we saw in the ASAP example) tend to be also conceptually more complex. It seems intuitive that this conceptual complexity is accompanied by a higher variance in the data. In a longer answer, there are more options how to phrase and order ideas in different ways.
Answer length is a measure that can be easily determined for a new dataset once the learner answers are collected, so it can serve as a quick indicator for the ease of scoring. In general, shorter answers can be scored better than longer answers. Of course, also datasets with answers of the same length can display different types of complexity and variance. Nevertheless, we consider answer length as a good and at the same time cheap indicator.
Table 1 presents some core answer length statistics for each dataset. A dataset usually consists of several individual prompts and different prompts in a dataset might differ more or less from each other. To characterize the variance between prompts in a dataset better we give the average answer length in tokens, as well as the minimum, median, and maximum value across the different prompts. Figure 3 visualizes for each dataset the distribution of the average answer length per prompt. We see that the individual datasets span a wide range of lengths from very short phrasal answers in POWERGRADING to long answers almost resembling short essays in ASAP. We also see that the number of different prompts and individual learner answers and thus also the number of learner answers for each prompt varies considerably, from datasets with only a very restricted number of answers for each question, such as in CREE and CREG, to several thousand answers per prompt in ASAP.
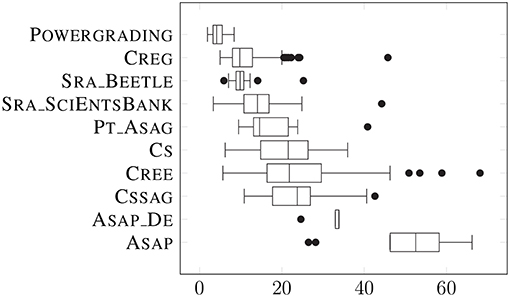
Figure 3. Average lengths of answers per dataset.
2.3.3. Language
The language that is used to answer a prompt, such as English, German, or Chinese, is also an important factor influencing the answer variance. Methods that work well for one language may not be directly transferable to other languages. This is due both to the linguistic properties of individual languages as well as to the availability of language-specific NLP resources used for scoring. By linguistic properties we mean especially the morphological richness of a language and the restrictiveness of word order. If an answer given in English talks about a red apple, it might be sufficient to look for the term red apple, while in German, depending on the grammatical context, terms such as (ein) roter Apfel, (der) rote Apfel, (einen) roten Apfel, or (des) roten Apfels might occur. Thus, a scoring approach based on token n-grams usually needs fewer training instances in English compared to German, as an English n-gram often corresponds to several German n-grams. For morphologically-richer languages such as Finnish or Turkish, approaches developed for English might completely fail.
Freeness of word order is related to morphological richness. Highly inflected languages, such as German, have usually a less restricted word order than English. Thus, n-gram models work well for the mainly linear grammatical structures in English, but less so for German with freer word-order and more long-distance dependencies (Andresen and Zinsmeister, 2017).
As for language resources used in content scoring methods, there are two main areas which have to be considered: linguistic processing tools as well as external resources. Many scoring methods rely on some sort of linguistic processing. The automatic detection of word and sentence boundaries (tokenization) is a minimal requirement necessary for almost all approaches, while some methods additionally use for example lemmatization (detecting the base form of a word), part-of-speech-tagging (labeling words as nouns, verbs or adjectives), or parsing sentences into syntax trees, which represent the internal linguistic structure of a sentence. External resources can be, for example, dictionaries used for spellchecking, but also resources providing information about the similarity between words in a language. Coming back to the example above, to know that measurement and difference are related, one would either need an ontology crafted by an expert, such as WordNet (Fellbaum, 1998), or would need similarity information derived from large corpora, based on the core observation in distributional semantics that words are similar if they often appear in similar contexts (Firth, 1957). The availability of such tools and resources has to be taken into consideration when planning automatic scoring for a new language.
2.3.4. Learner Population and Language Proficiency
The learner population is another important factor to consider, as it defines the language proficiency of the learners, i.e., whether they are beginning foreign language learners or highly proficient native speakers. Language proficiency can have two, at first glance contradicting, effects: A low language proficiency might lead to a high variance in terms of orthography, because beginners are more likely to make spelling or grammatical errors. At the same time, being a low-proficiency learner, can equally reduce variance, but on the lexical and syntactic level. This is because such a learner will have a more restricted vocabulary and has acquired fewer grammatical constructions than a native speaker. Moreover, low-proficiency learners might stay closer to the formulations in the prompt, especially when dealing with reading comprehension exercises, where the process of re-using material from the text for an answer is known as “lifting.”
Beginning language learners and fully proficient students are of course only the far points of the scale, while students from different grades in school would rank somewhere in between. Table 2 shows that the discussed datasets indeed cover a wide range of language proficiencies.
Also the homogeneity of the learner population plays a role: Learners from a homogeneous population can be expected to produce more homogeneous answers. It has, for example, been shown that the native language of a language learner influences the errors a learner makes (Ringbom and Jarvis, 2009). A German learner of English might be more inclined to misspell the word marmalade as marmelade because of the German cognate Marmelade (Beinborn et al., 2016). An automatic scoring engine trained on learner answers given by German learners might thus encounter the misspelling marmelade often enough to learn that an answer containing this word is as good as an answer containing the right spelling. However, a model trained on answers by learners from many different countries might not be able to learn (partially overlapping) error patterns for each individual first language of the learners. In a slightly different way, this also applies to native speakers. Consider e.g., answers by students from one university which all attended the same lecture and used the same slides and textbooks for studying (low variance) vs. answers by students from different universities using different learning materials (high variance).
2.3.5. Other Factors
The following factors do not directly influence the variance found in the data, but are other data-inherent factors that influence the difficulty of automatic scoring.
2.3.5.1. Dataset Size
When using machine learning models to perform content scoring, as do all the approaches we discuss in this article, the availability of already-scored answers from which the scoring method can learn is an important parameter (Heilman and Madnani, 2015). The more answers there are to learn from, the better we can usually model what a correct or incorrect answer looks like. The range of available answers covered varies between less than 10 answers for a prompt (as for example in the CREG dataset where a model across individual questions is learnt by most approaches dealing with this dataset) and over 3,000 answers per prompt in the ASAP dataset.
In many practical settings, only a small part of the available data is manually scored and used for training. It has been shown that the choice of training data heavily influences scoring performance and that the variance within the instances selected for training is a major influencing factor (Zesch et al., 2015a; Horbach and Palmer, 2016).
2.3.5.2. Label Set
Different label sets have been proposed for different content scoring datasets. The educational purpose of the scoring scenario is the main determining factor for this choice. Some datasets such as CREG and SRA have even more than one label set so that different usage scenarios can be addressed. This purpose can either be to generate summative or formative feedback (Scriven, 1967). The recipient of summative feedback is the teacher who wants to get an overview of the performance of a number of learners, for example in a placement test or exam situation. In this case, it is important that scores are comparable and can be aggregated so that there is an overall result for a test consisting of several prompts. Binary or numeric scores fit this purpose well. Formative feedback in contrast, as given through the categorical labels in SRA, CREG, and CREE, is directed toward the learner and meant to inform learners about their progress and the problems they might have had with answering a question. This type of feedback in content scoring is, for example, used in automatic tutoring systems. For a learner, the information that she scored 3.5 out of 5 points might be not as informative as a more meaningful feedback message stating that she missed an important concept required in a correct answer. Thus, datasets meant for formative feedback often use categorical labels rather than numeric ones.
The kind of label that is to be predicted obviously influences the scoring difficulty. In general, the more fine-grained the labels, the harder they are to predict given the same overall amount of training data. Also the conceptual spread covered by the labels can make the task more or less difficult. If the labels intend to make very subtle distinctions between similar concepts, the task is more complex than a scoring scheme that differentiates between coarser categories and considers everything as correct that is somewhat related to the correct answer.
2.3.5.3. Difficulty of the Scoring Task for Humans
All machine learning algorithms learn from a gold-standard produced by having human experts (such as teachers) label the data. If the scoring task is difficult, humans will make errors and label data inconsistently. This noise in the data impedes performance of a machine learning algorithm. If the gold-standard dataset is constructed from two trained human annotators, the inter-annotator-agreement between these two is considered to be an upper bound of the performance that can be expected from a machine. If two teachers agree only in 90% of the scores they assign for the same task, 90% agreement with the gold-standard is also considered the best possible result obtainable by automatic scoring (Gale et al., 1992; Resnik and Lin, 2010). The same argument can be applied for self-consistency. If a teacher labels the same data twice and can reproduce his own cores only for 90% of all answers, we can consider this 90% an upper bound for machine learning. This influence parameter obviously depends on most of the others and cannot be considered in isolation, but it helps to estimate which level of performance is to be expected for a particular prompt.
2.4. Summary
In this section, we have discussed several factors that are influencing the variance to be found in learner answers: the prompt type, answer length, language and learner population. We also introduced dataset size, the label set and the scoring difficulty for human scorers as additional parameters that influence the suitability of a dataset for human scoring. In the next section, we first give an overview of content scoring methods and then present a set of experiments that show the influence of some of the discussed factors on content scoring.
3. Automatic Content Scoring
As explained in the introduction, the overall aim of content scoring is to mimic a teacher's scoring behavior by assigning labels to a learner answers indicating how good the answer is content-wise.
A very large number of automatic content scoring methods have been proposed (see Burrows et al., 2014 for an overview), but we argue that most existing methods can be categorized into two main paradigms: similarity-based and instance-based scoring. Hence, instead of analyzing the properties of single scoring methods, we can draw interesting conclusions by comparing the two paradigms.
3.1. Similarity-Based Approaches
Figure 4 gives a schematic overview of similarity-based scoring. The learner answer is compared with a reference answer (or a high-scoring learner answer) based on a similarity metric. If the similarity surpasses a certain threshold (exemplified by 0.7 in Figure 4), the learner answer is considered as correct. Note that reference answers are always examples for correct answers. In the datasets discussed in section 2.2, there are no samples for incorrect answers, although we have seen earlier that also incorrect answers might form groups of answers expressing the same content.
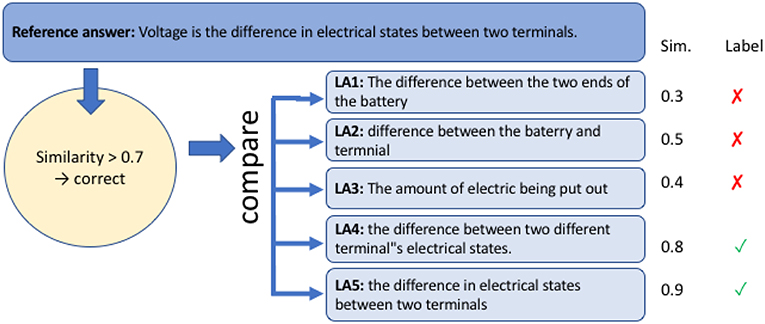
Figure 4. Schematic overview of similarity-based scoring.
An important factor in the performance of such similarity-based approaches is how the similarity between answers is computed. In the simplest form, it can be computed based on surface overlap, such as token overlap, where the amount of words or characters shared between answers is measured or edit distance, where the number of editing steps necessary to transform one answer into another is counted. These methods work well when different correct answers can be expected to mainly employ the same lexical material. However, when paraphrases are expected to be lexically diverse, surface-based methods might not be optimal. Consider the hypothetical sentence pair Paul presented his mother with a book - Mary received a novel from her son as a gift. In such a case the overlap between the two sentences on the surface is low, while it is clear to human readers that the two sentences convey a very similar meaning. To retrieve the information that present and gift from the above example are highly similar, semantic similarity methods make use of ontologies like WordNet Fellbaum (1998) or large background corpora [e.g., latent semantic analysis (Landauer and Dumais, 1997)].
In the content scoring literature, all these kinds of similarities are used. While Meurers et al. (2011c) mainly rely on similarity on the surface level for different linguistic units (tokens, chunks, dependency triples), methods such as Mohler and Mihalcea (2009) rely on external knowledge about semantic similarity between words.
3.2. Instance-Based Approaches
In instance-based approaches, lexical properties of correct answers (words, phrases, or even parts of words) are learned from other learner answers labeled as correct, while commonalities between incorrect answers inform the classifier about common misconceptions in learner answers. One would, for example, as depicted in Figure 5, learn that certain n-grams, such as electrical states, are indicators for correct answers while others, such as battery, are indicators for incorrect answers. For the scoring process, learner answers are then represented as feature vectors where each feature represents the occurrence of one such n-gram. The information about good n-grams is prompt-specific. For a different prompt, such as one asking for the power source in a certain experiment, battery might indicate a good answer, while answers containing the bigram electrical states would likely be wrong.
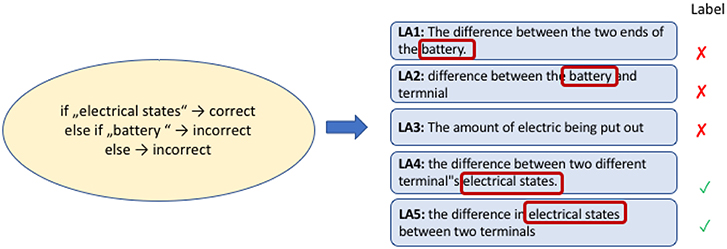
Figure 5. Schematic overview of instance-based scoring.
As the knowledge used for classification usually comes from the dataset itself and, in many approaches, no external knowledge is used in the scoring process (in contrast to similarity-based scoring), instance-based methods tend to need more training data and do not generalize as well across prompts. Instance-based methods have been used, for example, for various work on the ASAP dataset (Higgins et al., 2014; Zesch et al., 2015b), including all the top-performing systems from the ASAP scoring competition (Conort, 2012; Jesensky, 2012; Tandalla, 2012; Zbontar, 2012), as well as in commercially used systems.
3.3. Comparison
We presented two conceptually different ways of content scoring, one relying on the similarity with a reference answer (similarity-based) and the other on information about lexical material in the learner answers (instance-based). While we have presented the paradigmatic case for each side, there are of course less clear-cut cases. For example, an instance-based k-nearest-neighbor classifier scores new unlabeled answers by assigning them the label of the closest labeled learner answer. By doing so the classier inherently exploits similarities between answers.
3.3.1. Associated Machine Learning Approaches
Classical supervised machine learning approaches have been associated with both types of scoring paradigms. Instance-based approaches often work on feature vectors representing lexical items, while similarity-based approaches (Meurers et al., 2011c; Mohler et al., 2011) use various overlap measures as features or rely on just one similarity metric (Mohler and Mihalcea, 2009). Deep learning methods have been applied for instance-based scoring Riordan et al. (2017) as well as similarity-based scoring Patil and Agrawal (2018). As content scoring datasets are often rather small, the performance gain by using deep learning methods has far not been as in other NLP areas, if there was a reported gain at all.
3.3.2. Source of Knowledge
In general, instance-based approaches mainly use lexical material present in the answers while similarity-based methods often leverage external knowledge resources like WordNet or distributional semantics to bridge the vocabulary gap between differently phrased answers. Deep learning approaches usually also make use of external knowledge in the form of embeddings that also encode similarity between words.
3.3.3. Prompt Transfer
Another aspect to consider when comparing scoring paradigms is the transferability of models to new prompts. As similarity-methods learn about a relation between two texts rather than the occurrence of certain words or word combinations, such a model can also be transferred to new prompts for which it has not been trained. For instance-based approaches, a particular word combination indicating a good answer for one prompt might not have the same importance for another prompt. We can therefore generally expect that similarity-based models transfer more easily to new prompts.
4. Experiments and Discussion
In the previous sections, we have introduced (i) the factors influencing the variance of learner answers and the overall difficulty of the scoring task, and (ii) the two major paradigms in automatic content scoring: similarity-based and instance-based scoring. In this section, we bring both together. In the few cases where empirical evidence already exists, we direct the reader to experiments in the literature that address these influences. We design and conduct a set of experiments to explore those sources of variance that have been experimentally examined yet. However, for some dimensions of variance we have no empirical basis as evaluation datasets are sparse and do not cover the full range of necessary properties. In these cases, we instead describe desiderata for datasets that would be needed to investigate such influences. The discussion in this section is aimed at providing guidance for matching paradigms with use-cases in order to allow a practitioner to choose a setup according to the needs of their automatic scoring scenario.
4.1. Experimental Setup
Our experiments (instance-based as well as similarity-based) build on the Escrito scoring toolkit (Zesch and Horbach, 2018) (in version 0.0.1) that is implemented based on DKPro TC (Daxenberger et al., 2014) (in version 1.0.1). For preprocessing, we use DKPro Core.3 We apply sentence splitting, tokenization, POS-tagging and lemmatization. We did not spellcheck the data, as Horbach et al. (2017) found that the amount of spelling errors in the ASAP data did not impede scoring performance in an experimental setup similar to ours.
We use a standard machine learning setup, variants of which have been used widely. We extract token and lemma n-gram features, using uni- to trigrams for tokens and bi- to four-grams for characters. We train a support vector machine using the Weka SVM classifier with SMO optimization in its standard configuration, i.e., without standard parameter tuning.
4.1.1. Datasets
We select datasets from those discussed above (see section 2.2). The main selection criterion is, that a dataset contains a high number of learner answers per prompt, so that we can investigate the influence of training data size in prompt-specific models. To meet this criterion we use POWERGRADING, ASAP, and SEMEVAL.
4.1.2. Evaluation Metric
One common type of evaluation measure applicable for all label sets in short answer scoring is accuracy, i.e., the percentage of correctly classified items. This often goes together with a per-class evaluation of precision, recall, and F-score. Kappa values, taking into account the chance agreement between the machine learning outcome and the gold standard also are quite popular. This holds especially for Quadratically Weighted Kappa (QWK) for numeric scores, as it not only considers whether an answer is correctly classified or not, but also how far of an incorrect answer is. As QWK became a quasi-standard through its usage in the Kaggle ASAP challenge, we use it for our experiments as well.
4.1.3. Learning Curves
We listed the amount of available training data as one important influence factor for scoring performance. We can simulate datasets of different sizes by using random subsamples of a dataset. By doing this iteratively several times and for several amounts of training data, we obtain a learning curve. If a classifier learns from more data results usually improve until the learning curve approximates a flat line. When we provide learning curve experiments, we always sample 100 times for each amount of training data and average over the results.
4.2. Answer Length
As to our knowledge answer length has not been examined as an influencing factor so far, we test the hypothesis that shorter answers are easier to score, as they should have less variance in general. For this purpose, we conduct experiments with increasing amounts of training data and plot the resulting learning curves. Prompts from datasets with shorter answers should converge faster and at a higher kappa than prompts with longer answers. Note that we restrict ourselves to instance-based experiments here, as there is an insufficient number of datasets providing the necessary reference answers. However, we expect the general results to also hold similarity-based methods, as the similarity of longer answers is harder to compute than for shorter answers.
Figure 6 shows the results for instance-based scoring for a number of prompts covering a wide variety of different average lengths, selected from POWERGRADING (short answers), SRA (medium length answers), and ASAP (long answers, split in two prompts with on-average about 25 tokens per answer as well as eight prompts with more than 45 tokens per answer). We observe that (as expected) shorter prompts are easier to score, but the results between individual prompts (thin lines) within a dataset vary considerably. Thus, we also present the average over all prompts from the dataset (thick line), that clearly support the hypothesis.
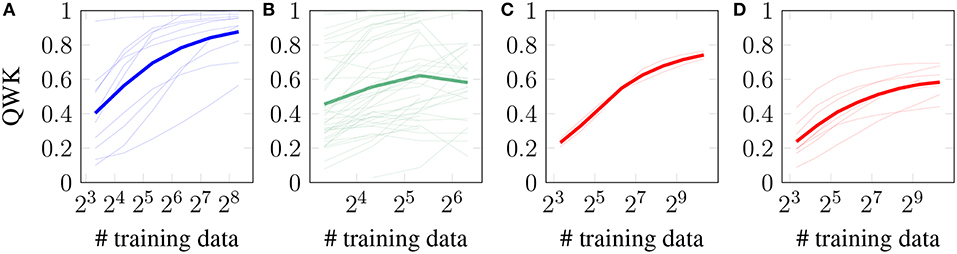
Figure 6. Instance-based learning curves for datasets with different average lengths. Thin lines are individual prompts, while the thick line is the average for this dataset. (A) very short (POWERGRADING). (B) short (SRA). (C) medium (ASAP short). (D) long (ASAP long).
These experiments also tell us something about the influence of the number of training data. An obvious finding is that more data yields, for most prompts, better results. A more interesting observation is that the curves for the SRA answers level off earlier than for the ASAP and POWERGRADING datasets. This means we could not learn much more given the current machine learning algorithm, parameter settings and feature set even if we had more training data. The ASAP and POWERGRADING curves, in contrast, are still raising: if we had more training data available, we could expect a better scoring performance.
4.3. Prompt Type
In our experiments regarding answer length, we cannot fully isolate effects originating from the length of the answers from other effects like the prompt type (as some prompts require longer answers than others) and learner population (as certain prompts are suitable only for a certain learner population). Therefore, we now try to isolate the effect of the prompt type by choosing prompts with answers of the same length and coming from the same dataset, thus from the same learner population and language.
We select four different prompts from POWERGRADING with a mean length between 3.3 and 4.8 tokens per answers and three different prompts from the ASAP dataset with an average length between 45 and 53 tokens and show the resulting learning curves for an instance-based setup in Figure 7. We observe that these prompts behave very differently despite a comparable length of the answers. Especially for the POWERGRADING data, performance with very few training data instances varies considerably showing other factors than length contribute to the performance. We assume that for these prompts (with often repetitive answers) the label distribution plays a role, as performance with few training instances suffers because chances are high that only members of the majority class are selected for scoring. For the ASAP prompts, those differences are less pronounced.

Figure 7. Instance-based learning curves for POWERGRADING and ASAP prompts with comparable lengths.
With the currently available data, we cannot make any claims about the influence of the prompt type itself, e.g., regarding domain (like biology prompts are easier than literature prompts) or modality of the prompt (as this would require having comparable prompts for example as listening and reading comprehension).
4.4. Language
In order to compare approaches solely based on the language involved, one would need the same prompts administered to comparable learner population but in different languages. The only such available datasets we know about are ASAP and ASAP-DE. ASAP-DE uses a subset of the prompts of ASAP translated to German and provides answers from German-speaking crowdworkers (Horbach et al., 2018). These answers were annotated according to the same annotation guidelines. So, while trying to be as comparable as possible, the datasets still differ in the learner population, in addition to the language. Horbach et al. (2018) compared instance-based automatic scoring on the two datasets and found results to be in a similar range with a slight performance benefit for the German data. However, they also reported differences in the nature of the data – resulting potentially from the different learner populations –, such as a different label distribution and considerably shorter answers for German, which they attribute to crowdworkers being potentially less motivated then school students in an assessment situation. Therefore, it is unclear whether any of those differences can be blamed on the language difference or the difference in learner population. More controlled data collections would be possible to get results that are specific to the language difference only. One such data collection with answers from students from different countries and thus various language backgrounds is the data from the PISA studies.4 Such data would be an ideal testbed to compare learner populations with different native languages on the same prompt administered in various languages.
4.5. Learner Population
The results mentioned above for the different languages might equally be used as a potential example for the influence of different learner populations. In order to fully isolate the effect of learner population, one would need to collect the same dataset from two different learner groups such as native speakers vs. language learners or high-school vs. university students. To the best of our knowledge, such data is currently not available.
However, one aspect of different learner population is their tendency to make spelling errors. In experiments on the ASAP dataset, Horbach et al. (2017) found that the amount of spelling errors present in the data did not negatively influence content scoring performance. Only if the amount of spelling errors per answer was artificially increased, scoring performance decreased, especially, if errors followed a random pattern (unlikely to occur in real data) and if scoring methods relied on the occurrence of certain words and ignored sub-word information (i.e., certain character combinations).
4.6. Label Set
When discussion influence factors, we assumed that a dataset with more individual labels is harder to score than a dataset with binary labels. The influence of different label sets was already tested in previous work, especially in the SemEval Shared Task “The Joint Student Response Analysis and 8th Recognizing Textual Entailment Challenge” (Dzikovska et al., 2013). The SRA dataset used for this challenge is annotated with three label sets of different granularity: two, three or five labels providing increasing levels of feedback to the learner. The two-way task just informs learners whether their answer was correct or not. The 3-way task additionally distinguishes between contradictory answers (contradicting the learner answers) and other incorrect answers. In the 5-way task, answers classified as incorrect in the 3-way task are classified in an even more fine-grained manner as “partially correct, but incomplete,” “irrelevant for the question,” or “not in the domain” (such as I don't know.).
Seven out of nine systems participating the SemEval Shared Task reported results for each of these label sets. For all of them performance was best for the 2-way task (with a mean weighted F-Score of .720 for the best performing system) and worst for the 5-way task (0.547 mean weighted F-Score, again for the best performing system, which was a different one then for the 2-way result). This clearly shows that the expected effect of more fine-grained label sets being more difficult to score automatically.
5. Conclusion and Future Work
In this paper, we discussed the different influence factors that determine how much variance we see in the learner answers toward a specific prompt and how this variance influences automatic scoring performance. These factors include the type of prompt, the language in the data, the average length of answers as well as the number of training instances that are available. Of course, these factors are interdependent and influence each other. It is thus hard to decide based on purely theoretical speculations whether, for example, medium length answers to a factoid question given by German native speakers annotated with binary scoring labels and with a large number of training instances are easier or harder to score than shorter answers in non-native English with numeric labels and a smaller set of training instances. Such questions can only be answered empirically, but the available datasets do not nearly cover the available parameter space exhaustively, so that such experiments are not possible in a straightforward manner. That makes it hard to compare different approaches in the literature and it is also a challenge to estimate the performance on new data. Therefore, we presented experiments that show the influence of some of the discussed factors on content scoring.
Our findings give researchers as well as educational practitioners hints about whether content scoring might work for a certain new dataset. At the same time, our paper also highlights the demand for more systematic research, both in terms of dataset creation and automatic scoring. For a number of influence factors, we were not able to clearly assess their influence because data that would allow to investigate a single influence parameter in isolation does not exist. It would thus be desirable for the automatic scoring community to systematically collect new datasets varying only in specific dimensions, such as to ask the same prompt to different learner populations and in different languages in order to further broaden our knowledge about the full contribution of these factors.
Data Availability
Publicly available datasets were analyzed in this study. This data can be found here: https:www.kaggle.com/c/asap-sas, https://www.microsoft.com/en-us/download/details.aspx?id=52397 and https://www.cs.york.ac.uk/semeval-2013/task7/index.php%3Fid=data.html.
Author Contributions
All authors listed have made a substantial, direct and intellectual contribution to the work, and approved it for publication.
Funding
This work has been funded by the German Federal Ministry of Education and Research under grant no. FKZ 01PL16075.
Conflict of Interest Statement
The authors declare that the research was conducted in the absence of any commercial or financial relationships that could be construed as a potential conflict of interest.
Footnotes
1. ^For the median, we report the lower median if there is an even number of items, so that the value corresponds to the average number of tokens per answer of a specific prompt.
2. ^https://www.kaggle.com/c/asap-sas
References
Anderson, L., Krathwohl, D., and Bloom, B. (2001). A Taxonomy for Learning, Teaching, and Assessing: A Revision of Bloom's Taxonomy of Educational Objectives. Longman.
Andresen, M., and Zinsmeister, H. (2017). “The benefit of syntactic vs. linear n-grams for linguistic description,” in Proceedings of the Fourth International Conference on Dependency Linguistics (Depling 2017), 4–14.
Bailey, S., and Meurers, D. (2008). “Diagnosing meaning errors in short answers to reading comprehension questions,” in Proceedings of the Third Workshop on Innovative Use of NLP for Building Educational Applications (Columbus), 107–115.
Bär, D., Biemann, C., Gurevych, I., and Zesch, T. (2012). “UKP: computing semantic textual similarity by combining multiple content similarity measures,” in Proceedings of the 6th International Workshop on Semantic Evaluation, Held in Conjunction With the 1st Joint Conference on Lexical and Computational Semantics (Montreal, QC), 435–440.
Basu, S., Jacobs, C., and Vanderwende, L. (2013). Powergrading: a clustering approach to amplify human effort for short answer grading. Trans. Assoc. Comput. Linguist. 1, 391–402. doi: 10.1162/tacla00236
Beinborn, L., Zesch, T., and Gurevych, I. (2016). “Predicting the spelling difficulty of words for language learners,” in Proceedings of the Building Educational Applications Workshop at NAACL (San Diego, CA: ACL), 73–83.
Bhagat, R., and Hovy, E. (2013). What is a paraphrase? Comput. Linguist. 39, 463–472. doi: 10.1162/COLI_a_00166
Burrows, S., Gurevych, I., and Stein, B. (2014). The eras and trends of automatic short answer grading. Int. J. Art. Intell. Educ. 25, 60–117. doi: 10.1007/s40593-014-0026-8
Burstein, J., Leacock, C., and Swartz, R. (2001). Automated evaluation of essays and short answers. Abingdon-on-Thames: Taylor & Francis Group.
Burstein, J., Tetreault, J., and Madnani, N. (2013). The e-rater automated essay scoring system. Handbook of Automated Essay Evaluation: Current Applications and New Directions, eds M. D. Shermis and J. Burstein (Routledge), 55–67.
Conort, X. (2012). “Short answer scoring: explanation of Gxav solution,” in ASAP Short Answer Scoring Competition System Description.
Dagan, I., Roth, D., Sammons, M., and Zanzotto, F. M. (2013). Recognizing Textual Entail-ment: Models and Applications. Morgan & Claypool Publishers.
Daxenberger, J., Ferschke, O., Gurevych, I., and Zesch, T. (2014). “Dkpro tc: a java-based framework for supervised learning experiments on textual data,” in Proceedings of 52nd Annual Meeting of the Association for Computational Linguistics: System Demonstrations (Baltimore, MD: Association for Computational Linguistics), 61–66.
Day, R. R., and Park, J. S. (2005). Developing reading comprehension questions. Reading Foreign Lang. 17, 60–73.
Dzikovska, M. O., Nielsen, R., Brew, C., Leacock, C., Giampiccolo, D., Bentivogli, L., et al. (2013). “Semeval-2013 task 7: The joint student response analysis and 8th recognizing textual entailment challenge,” *SEM 2013: The First Joint Conference on Lexical and Computational Semantics.
Ellis, R., and Barkhuizen, G. P. (2005). Analysing Learner Language. Oxford University Press Oxford.
Fellbaum, C. (ed.). (1998). WordNet: An Electronic Lexical Database. Cambridge, MA: Language, Speech, and Communication. MIT Press.
Gale, W., Church, K. W., and Yarowsky, D. (1992). “Estimating upper and lower bounds on the performance of word-sense disambiguation programs,” in Proceedings of the 30th Annual Meeting on Association for Computational Linguistics (Association for Computational Linguistics), 249–256.
Galhardi, L., Barbosa, C. R., de Souza, R. C. T., and Brancher, J. D. (2018). “Portuguese automatic short answer grading,” in Brazilian Symposium on Computers in Education (Simpósio Brasileiro de Informática na Educação-SBIE), 1373.
Haley, D. T., Thomas, P., De Roeck, A., and Petre, M. (2007). “Measuring improvement in latent semantic analysis-based marking systems: using a computer to mark questions about html,” in Proceedings of the Ninth Australasian Conference on Computing Education - Volume 66, ACE '07 (Darlinghurst, NSW: Australian Computer Society, Inc.), 35–42
Heilman, M., and Madnani, N. (2015). “The impact of training data on automated short answer scoring performance,” in Proceedings of the Tenth Workshop on Innovative Use of NLP for Building Educational Applications, 81–85.
Higgins, D., Brew, C., Heilman, M., Ziai, R., Chen, L., Cahill, A., et al. (2014). Is getting the right answer just about choosing the right words? the role of syntactically-informed features in short answer scoring. arXiv [preprint]. arXiv:1403.0801.
Horbach, A., Ding, Y., and Zesch, T. (2017). “The influence of spelling error on content scoring performance,” in Proceedings of the 4th Workshop on Natural Language Processing Techniques for Educational Applications (Taipei: AFNLP), 45–53.
Horbach, A., and Palmer, A. (2016). “Investigating active learning for short-answer scoring,” in Proceedings of the 11th Workshop on Innovative Use of NLP for Building Educational Applications, 301–311.
Horbach, A., Stennmanns, S., and Zesch, T. (2018). “Cross-lingual content scoring,” in Proceedings of the Thirteenth Workshop on Innovative Use of NLP for Building Educational Applications (New Orleans, LA: Association for Computational Linguistics), 410–419.
Jesensky, J. (2012). “Team JJJ technical methods paper,” in ASAP Short Answer Scoring Competition System Description.
Landauer, T. K., and Dumais, S. T. (1997). A solution to plato's problem: the latent semantic analysis theory of acquisition, induction, and representation of knowledge. Psychol. Rev. 104:211.
Meecham, M., and Rees-Miller, J. (2005). Language in social contexts. Contemporary Linguistics (Boston, MA: Bedford/St. Martin's), 537–590.
Meurers, D., Ziai, R., Ott, N., and Kopp, J. (2011a). Corpus of reading comprehension exercises in German. CREG-1032, SFB 833: Bedeutungskonstitution - Dynamik und Adaptivität sprachlicher Strukturen, Project A4, Universität Tübingen.
Meurers, D., Ziai, R., Ott, N., and Kopp, J. (2011b). “Evaluating answers to reading comprehension questions in context: results for german and the role of information structure,” in Proceedings of the TextInfer 2011 Workshop on Textual Entailment, TIWTE '11 (Stroudsburg, PA: Association for Computational Linguistics), 1–9.
Meurers, D., Ziai, R., Ott, N., and Kopp, J. (2011c). “Evaluating answers to reading comprehension questions in context: results for german and the role of information structure,” in Proceedings of the TextInfer 2011 Workshop on Textual Entailment (Edinburgh: Association for Computational Linguistics), 1–9.
Mohler, M., Bunescu, R. C., and Mihalcea, R. (2011). “Learning to grade short answer questions using semantic similarity measures and dependency graph alignments,” in ACL, 752–762.
Mohler, M., and Mihalcea, R. (2009). “Text-to-text semantic similarity for automatic short answer grading,” in Proceedings of the 12th Conference of the European Chapter of the Association for Computational Linguistics (Association for Computational Linguistics), 567–575.
Padó, U. (2016). “Get semantic with me! the usefulness of different feature types for short-answer grading,” in Proceedings of COLING 2016, the 26th International Conference on Computational Linguistics: Technical Papers, 2186–2195.
Padó, U. (2017). “Question difficulty–how to estimate without norming, how to use for automated grading,” in Proceedings of the 12th Workshop on Innovative Use of NLP for Building Educational Applications, 1–10.
Pado, U., and Kiefer, C. (2015). “Short answer grading: when sorting helps and when it doesn't,” in Proceedings of the 4th workshop on NLP for Computer Assisted Language Learning at NODALIDA 2015, Vilnius, 11th May, 2015 (Linköping University Electronic Press), 42–50.
Patil, P., and Agrawal, A. (2018). Auto Grader for Short Answer Questions. Stanford University, CS229.
Resnik, P., and Lin, J. (2010). “Evaluation of nlp systems,” in The Handbook of Computational Linguistics and Natural Language Processing.
Reznicek, M., Ludeling, A., and Hirschmann, H. (2013). “Competing target hypotheses in the falko corpus,” in Automatic Treatment and Analysis of Learner Corpus Data, Vol 59, eds A. Díaz-Negrillo, N. Ballier, and P. Thompson (John Benjamins Publishing Company), 101–123.
Ringbom, H., and Jarvis, S. (2009). Chapter 7: The Importance of Cross-Linguistic Similarity in Foreign Language Learning. John Wiley & Sons, Ltd.
Riordan, B., Horbach, A., Cahill, A., Zesch, T., and Lee, C. M. (2017). “Investigating neural architectures for short answer scoring,” in Proceedings of the Building Educational Applications Workshop at EMNLP (Copenhagen), 159–168.
Scriven, M. (1967). “The methodology of evaluation,” in Perspectives of Curriculum Evaluation, AERA Monograph Series on Curriculum Evaluation, Volume 1, eds R. Tyler, R. Gagné, and M. Scriven (Chicago, IL: Rand McNally), 39–83.
Tandalla, L. (2012). Scoring short answer essays. ASAP Short Answer Scoring Competition System Description. The Hewlett Foundation.
Zbontar, J. (2012). Short answer scoring by stacking. ASAP Short Answer Scoring Competition System Description. Retrieved July.
Zesch, T., Heilman, M., and Cahill, A. (2015a). “Reducing annotation efforts in supervised short answer scoring,” in Proceedings of the Tenth Workshop on Innovative Use of NLP for Building Educational Applications, 124–132.
Zesch, T., Heilman, M., and Cahill, A. (2015b). “Reducing annotation efforts in supervised short answer scoring,” in Proceedings of the Building Educational Applications Workshop at NAACL (Denver, CO), 124–132.
Zesch, T., and Horbach, A. (2018). “ESCRITO - An NLP-Enhanced Educational Scoring Toolkit,” in Proceedings of the Language Resources and Evaluation Conference (LREC) (Miyazaki: European Language Resources Association (ELRA)).
Keywords: automatic content scoring, short-answer questions, natural language processing, linguistic variance, machine learning
Citation: Horbach A and Zesch T (2019) The Influence of Variance in Learner Answers on Automatic Content Scoring. Front. Educ. 4:28. doi: 10.3389/feduc.2019.00028
Received: 07 December 2018; Accepted: 12 March 2019;
Published: 04 April 2019.
Edited by:
Ronny Scherer, Department of Teacher Education and School Research, Faculty of Educational Sciences, University of Oslo, NorwayReviewed by:
Mark Gierl, University of Alberta, CanadaDirk Ifenthaler, Universität Mannheim, Germany
Copyright © 2019 Horbach and Zesch. This is an open-access article distributed under the terms of the Creative Commons Attribution License (CC BY). The use, distribution or reproduction in other forums is permitted, provided the original author(s) and the copyright owner(s) are credited and that the original publication in this journal is cited, in accordance with accepted academic practice. No use, distribution or reproduction is permitted which does not comply with these terms.
*Correspondence: Andrea Horbach, YW5kcmVhLmhvcmJhY2hAdW5pLWR1ZS5kZQ==