 Kimberley Lek
 Rens Van De Schoot
94% of researchers rate our articles as excellent or good
Learn more about the work of our research integrity team to safeguard the quality of each article we publish.
Find out more
METHODS article
Front. Educ., 27 September 2018
Sec. Teacher Education
Volume 3 - 2018 | https://doi.org/10.3389/feduc.2018.00082
Expert elicitation—an approach to systematically consult experts and quantify their insights—has been succesfully applied in fields as risk assessment, health and environmental research. Unfortunately, it has never been used within the Educational sciences, while it offers ample opportunities for educational practice, especially when used to foster the accuracy of teacher judgments; generally referred to as their “diagnostic competence.” The current paper is the first to explore expert elicitation in an educational context and has two major goals. The first goal is to develop a digital expert elicitation method suitable to be used by elementary school teachers for self-reflection purposes. The second goal is to extensively test the expert elicitation method, using a test panel of 24 primary school teachers for 503 pupils in total. Results regarding the development of the elicitation method and its reliability, construct validity, face validity and feasibility are discussed as well as ideas how this elicitation method can be a valuable self-reflection instrument for teachers. The results are promising: all measures of reliability, feasibility, face validity and construct validity show positive results and teachers are enthusiastic about the possibilities of the method.
Sometimes, experts1 possess unique knowledge, that is impossible or impractical to attain using traditional data collection methods. In those instances, expert elicitation can be used to “obtain” this knowledge. Specifically, the purpose of expert elicitation is to “construct a probability distribution that properly represents expert's knowledge/uncertainty” (O'Hagan et al., 2006, p. 9), such that this expert knowledge can be used in—for instance—research, engineering projects and decision-making (O'Hagan et al., 2006; Goossens et al., 2008). The resulting probability distribution can be analyzed on its own or can be combined with data. Regarding the latter option, Bayesian statistics can be applied (see Kruschke, 2011; Kaplan and Depaoli, 2013; van de Schoot et al., 2013). The expert knowledge distribution—called a “prior” in Bayesian terminology—is then joined with data (“likelihood”) in a “posterior,” which is an optimal compromise of the expert's knowledge and the data.
Expert elicitation has gained a lot of attention in for instance risk assessment (e.g., Clemen and Winkler, 1999; Edlmann et al., 2016), health (e.g., Havelaar et al., 2008; Knol et al., 2010; Kirk et al., 2015; Hald et al., 2016), and environmental research (e.g., Siegel et al., 2017; Singh et al., 2017). But, as König and Van De Schoot (2017) show in their systematic review, although Bayesian statistics is slowly gaining attention in the Educational sciences, expert elicitation is not. This is unfortunate, since we belief expert elicitation offers many opportunities for educational practice. Using expert elicitation, we could elicit teachers' judgments with regard to the ability of the pupils they teach. Since teachers spend much time with their pupils, they have a unique perspective on their development, educational needs, et cetera. Or, as Machts et al. (2016) put it: “because of this broad exposure, teachers are often expected to be able to provide differential diagnostic information on their students that go far beyond the measure of their performance on academic tasks in specific domains” (p. 85). Expert elicitation can make the intangible, implicit judgments of teachers explicit.
An advantage of making these judgments explicit is that the elicitation tool can function as a feedback instrument for the teacher. When used on multiple occasions, for instance, the teacher can see how his view on the child's development has changed and he can evaluate what (rational and/or irrational) events have led to this change. Another advantage: when multiple teachers teach the same class, it is possible to quantitatively compare the judgments of these teachers, making differences in judgments directly apparent and open for discussion. Furthermore, the process of completing the elicitation tool can provide useful feedback as well. For example, when a teacher finds the elicitation difficult for a certain pupil, he knows that his view on this pupil's development is still a bit vague. Another advantage for the teacher is that—using the Bayesian toolbox—it is possible to combine the elicited teacher expertise with other data on the development of the pupil (i.e., observational and test data). Doing so will lead to a posterior that reflects all the information available on the pupil's development. The ultimate goal of making teachers aware of their implicit judgments, how these judgments change over time and how they compare to those of colleagues or to other data sources is to foster the accuracy with which teachers judge their pupils on a daily basis, referred to as “teachers' diagnostic competence” (Artelt and Rausch, 2014; Pit-Ten Cate et al., 2014).
The above ideas of making teacher insights explicit fit within the increasing focus on data-driven decision making (Espin et al., 2017; Van Den Bosch et al., 2017) and evidence-based practice (Boudett et al., 2013) within education. Instead of basing classroom decisions on “[…] anecdotes, gut feelings, or opinions” (Mandinach, 2012, p. 71), teacher insights can be formally assessed and evaluated and be combined with other data, such as data from tests or classroom observations, to drive educational practice. In this way, expert elicitation can assist teachers that typically “[…] process information in their heads” (Mandinach, 2012, p. 72). The increasing focus on rational data collection is in marked constrast to the long held belief that “informed intuition” should be accepted as the primary basis of teacher judgments (see Creighton, 2007; Vanlommel et al., 2018).
The present paper is the first to explore expert elicitation in an educational context and has two major goals. The first goal is to present an expert elicitation method that is specifically tailored to elementary school teachers. This tailoring was necessary since elementary school teachers differ from experts in fields as Risk assessment and Health in three important ways: (1) elementary school teachers typically have little knowledge of statistics, (2) teachers have to elicit many priors (one for every pupil) instead of one or a few, (3) the elicitation procedure has to be self-explanatory and time efficient to be of practical value. The second goal—following recommendations of Johnson et al. (2010a)—is to assess measurement properties of this elicitation tool (i.e., face validity, feasibility, intra-rater reliability, and construct validity).
The remainder of this paper is ordered as follows. First, we provide a theoretical background on the developed elicitation method and procedure. After pilot-testing, this elicitation method/procedure was applied and evaluated with 24 primary school teachers in an expert meeting. Background characteristics of the primary school teachers and specifics of the expert meeting are discussed in the section “methods.” Thereafter, the elicited priors are illustrated and the measurement properties of our elicitation method/procedure are discussed. The paper ends with a general discussion of the usability of our elicitation method/procedure. This study received ethical approval from our internal Ethics Committee of the Faculty of Social and Behavioral Sciences of Utrecht University (nr. FETC17-046; the letter of approval can be found on the Open Science Framework page https://osf.io/hws4m/).
The general goal of expert elicitation is to capture and quantify experts' implicit and intagible judgments. Applied to the context of elementary school teaching, our purpose is to make explicit teachers' implicit judgments of their pupils ability. These judgments are a reflection of the teacher's diagnostic competence; his or her ability to judge achievement characteristics of his or her pupils correctly (Artelt and Rausch, 2014). In this article, we focus specifically on the “math ability” of pupils. Although judgments with regard to other areas such as language development can also be elicited, the advantage of mathematics is that it is a relatively unambiguous area. As Artelt and Rausch (2014) put it: “Given that mathematical skill is mainly acquired in school and that the curriculum is well-defined according to age, teachers quite likely have a shared understanding of what constitutes mathematical proficiency” (p. 35).
Within the literature, there is a broad concensus that diagnostic competence is a central aspect of teachers' professional competence (Artelt and Rausch, 2014; Pit-Ten Cate et al., 2014), since many decisions are based on teachers' judgments such as school placement, tracking decisions, grade allocation, adaptive teaching, ability grouping, instructional decision-making and the creation of tests in the classroom (Baumert and Kunter, 2013; Gabriele and Park, 2016). Despite its importance, previous literature shows that teacher judgments are often quite subjective and do not always meet reliability and validity criteria (see, for instance, Südkamp et al., 2012; Kaiser et al., 2013). One reason for this is that teacher judgments are not always based on a systematic and deliberate collection, weighing and integration of informational cues. Rather, teachers often switch from such a complex judgment process (called “attribute-based judgment”; Krolak-Schwerdt et al., 2012) to a quicker and more efficient judgment process based on a minimum of information cues and stereotypical information [called “category-based judgment”; (Krolak-Schwerdt et al., 2012); a similar distinction can be found in Kahneman (2011) and Evans (2008)]. The danger of this latter processing strategy is that judgments can be flawed because of well-documented expectancy effects, Pygmalion effects, halo effects, fundamental attribution errors, and any other errors that are the result of selective information processing (Kahneman and Frederick, 2005; Artelt and Rausch, 2014; also see Meissel et al., 2017 and Kaiser et al., 2017). In the expert elicitation method (see next section), we simply ask teachers to express their judgments, without guiding their judgment process. The elicited judgments can therefore be the result of a resource-intense, rational strategy, a strategy that is based on mere impressions and intuition or a combination of both.
Next to eliciting experts' judgments, expert elicitation also focusses on the confidence of these experts in their judgments. Only recently, teacher judgment confidence has gained attention in the literature (see, for instance, Gabriele and Park, 2016). A promising theory suggests that when teachers are confident in making accurate judgments and not confident when they make inaccurate judgments, they are “effectively monitoring their judgment accuracy and are making calibrated judgments about their students” (Gabriele and Park, 2016, p. 51; also see Dunlosky and Metcalfe, 2009). Because of this meta-cognitive monitoring, the calibrated teacher knows when he/she needs to collect more information on certain pupils, increasing their judgment accuracy and hence improving their diagnostic competence.
The idea of expert elicitation is to express experts' judgments and their confidence in these judgments in a so-called prior distribution. Applied to the context of elementary school teachers, this means that we obtain a prior distribution for the judgment of “math ability” for every pupil in a teacher's class. One of the first choices to make in the development of an elicitation method is the scale to be used. Since “math ability” is not something that can be observed directly, it does not have an inherent, natural scale. Consequently, to keep track of the mathematical abilities of their pupils, schools use different tests and observational systems that (may) differ in the scale on which math ability is expressed. One of the challenges was thus to create a universal, intuitive scale that could be used by every teacher and school. We have tackled this challenge by creating a scale that is based on percentile scores (Crawford and Garthwaite, 2009). The advantage of percentile scores is that they are relatively simple to interpret and that every scale can easily be converted into percentile scores (Lezak et al., 2004). To make it even more simple and intuitive, we use a scale with either 5 (Figure 1A), 10 (Figure 1B), 25 (Figure 1C), or 50 (Figure 1D) “puppets.” Depending on the number of “puppets,” every “puppet” represents a certain percentage of pupils (e.g., percentile score). When 5 “puppets” are used, for instance, the first puppet on the scale represents the 20% pupils with the lowest math ability in the age range of the pupil, the last puppet on the scale the 20% pupils with the highest math ability, etc.
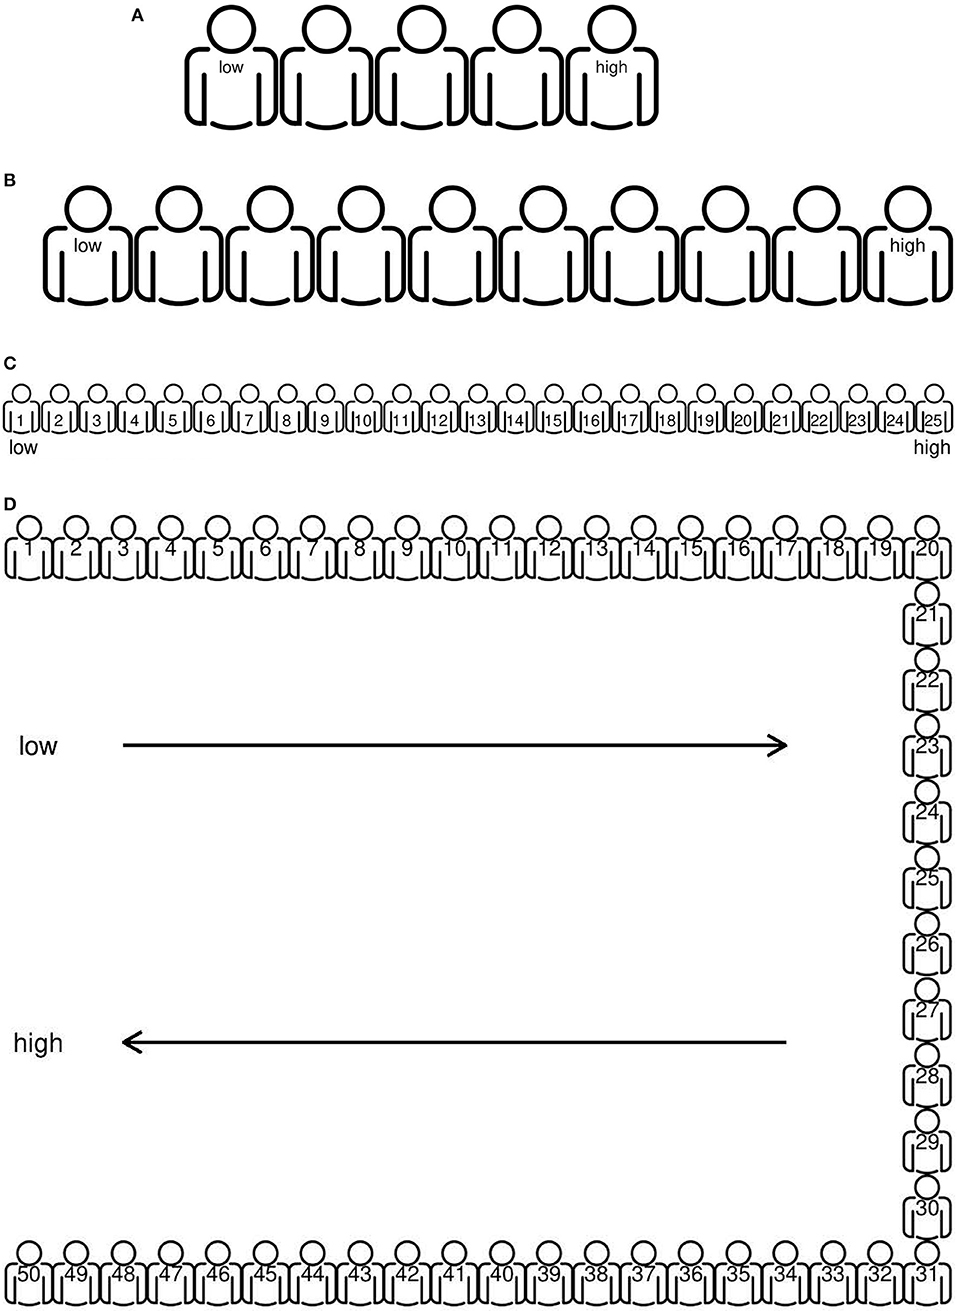
Figure 1. Scales used for elicitation, with varying number of “puppets” between 5 (A), 10 (B), 25 (C), and 50 (D). Icon created by Tommy Lau from the Noun Project (https://thenounproject.com/).
The idea is that teachers position their pupils using 1–5, 1–10, 1–25, and/or 1–50 “puppets.” Thus, if a teacher believes a pupil to be part of the 20% best math students of his or her age, the teacher places this pupil at puppet 5 on the 1–5 scale. Using the scale(s) in this way, teachers can easily express their judgments regarding the math ability of their pupils at once, maintaining the relative differences between their pupils.
In order to obtain a distribution for every pupil, we also need to have an indication of the uncertainty of the teacher with regards to the positions chosen (i.e., the teachers' judgment confidence). Obtaining such an estimate of uncertainty is a delicate matter, since people are known to generally underestimate their uncertainty (Lichtenstein et al., 1982; see also Bier, 2004; Speirs-Bridge et al., 2010). Additionally, most elicitation procedures ask the experts to state their uncertainty using precise probabilities (e.g., “90% certain”), something that is hard for people who are layman with respect to statistics. With the scales in Figure 1, however, obtaining an indication of uncertainty is rather intuitive and simple. Teachers simply choose the scale (Figures 1A–D) at which they feel certain enough to position their pupil(s). The scale with 5 “puppets,” for instance, is coarser than the scale with 25 “puppets,” and thus the teacher who chooses the latter scale is inherently more certain than the teacher who chooses the 1–5 scale. By using this approach to eliciting the teachers' uncertainty, we avoid the necessity to ask for precise probabilities.
The idea of letting the number of “puppets” decide the uncertainty of the teacher is related to the Equivalent Prior Sample (EPS)-method of the classical, often cited work of Winkler (1967). In the EPS-method, an expert gives an estimate of a proportion and an estimate of the sample size he is basing the proportion on O'Hagan et al. (2006). Like the number of “puppets,” the larger the sample size, the more certain the expert is about his proportion. An important difference between our elicitation procedure with “puppets” and the EPS, however, is that the “puppets” are visualized. By visualizing the “puppets,” the teacher can experience what it means to choose a position with 5 or 50 “puppets.” This will help avoiding that teachers choose too many “puppets” (i.e., in the EPS-method experts tend to select relatively large sample sizes) and, thus, avoids that the teachers underestimate their uncertainty.
A parametric distribution that naturally fits the idea of the scales with “puppets” is the Beta distribution, with parameters alpha and beta. Linked to the scales in Figure 1, alpha is the chosen position and beta the total number of “puppets” minus the chosen position. Figure 2A shows the translation of a few chosen positions into Beta distributions. Indeed, when keeping the position consistent while moving from scale 1–5, to 1–10, 1–25, and 1–50, the Beta prior becomes smaller and smaller, taking into account the increasing certainty of the teachers. Figure 2B also shows how the Beta prior is rather flexible; it is highly skewed when teachers choose a low position while reassembling a normal distribution around the middle positions.
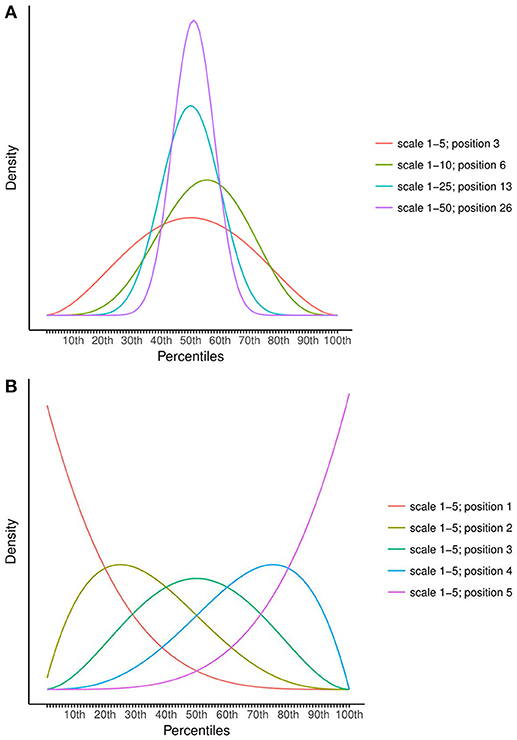
Figure 2. Examples of the translation of chosen positions on the scales (Figure 1) to Beta distributions. (A) shows the Beta distributions belonging to comparable positions on the 1–5 to the 1–50 scale; (B) shows the Beta distributions for all possible positions of the 1–5 scale.
Taken together, teachers only need to position each of their pupils on a chosen scale to define a prior distribution. This positioning takes little time, is intuitive, asks for little statistical knowledge and can be done for their whole class at once.
We developed a digital elicitation instrument that walks through the elicitation method in six steps. This digital instrument was developed in Dutch and can be found on https://osf.io/hws4m/. We programmed the digital version using R (R Core Team, 2017) and the Shiny package (Chang et al., 2017). The digital elicitation instrument was developed to be self-explanatory; teachers' judgements can be elicited without the intervention of a researcher. Since the digital version in its current form requires a (stable) internet connection, we also developed a paper-based elicitation instrument that mimics the digital instrument as closely as possible, for when such an internet connection is not available.
Step 1. Both the digital (start screen) and paper-based version (first page) start with a motivational text about the purpose of the expert elicitation. The goal of this motivational text is to engender the experts enthusiasm for the project (Clemen and Reilly, 2001) and to make sure they take the elicitation procedure seriously.
Step 2. In both the digital and paper-based version, teachers were asked to divide their pupils in groups, based on their math ability. This step was included to ease step 5; the step in which the teachers position their pupils. Without the groups, teachers would have to position their pupils all at once. Now, teachers had the possibility to do the positioning for groups of pupils separately. Since most teachers work with math subgroups in their class, this was anticipated to be a relatively easy step to start with.
Step 3. To maintain pupils' anonymity, in the digital version teachers needed to download a document with codes (a random combination of one letter and 2–3 numbers)2. This document contained as much random codes as pupils in the teachers' class, for each of the defined groups separately. In the document, there was a blank space after every random code such that the teachers could fill in pupil names for their own administration and use this document as key. Teachers were instructed to keep the key private. In the paper-based version, teachers received the same document on paper, although they had to select the appropriate number of random codes themselves.
Step 4. In the fourth step—both in the digital and the paper-based version–teachers could read all necessary information to continue to the actual elicitation. This is what O'Hagan et al. (2006) calls a “probability training.” Since (1) the elicitation instrument needed to be as time efficient as possible and (2) the elicitation method is deliberately kept as non-technical as possible, the probability training entailed only the basics that teachers needed to comprehend. Specifically, the meaning of percentile scores and representation by the “puppets” was explained and the Beta distribution was illustrated.
Step 5. In the fifth step, teachers were asked to position their pupils using the scales in Figure 1. This positioning was done for each of the defined groups separately, using the random codes of Step 3. Teachers started with 5 positions (Figure 1A). After they completed the positioning they were presented with 2 options: either continue to a more fine-grained scale (in this case, 10 positions; Figure 1B) or state that they did not feel certain enough to move to a more fine-grained scale and stop the positioning for this pupil/this group of pupils. Every time a teacher chose the option to move to a more fine-grained scale, it was presented with the next scale until the scale with 50 “puppets” was reached. In the digital version, teachers could position their pupils by first selecting one of the student codes and then right-clicking on the “puppet” of choice (Figure 3A). By doing so, the random student label appeared above the selected puppet and the corresponding Beta distribution was printed below the scale as feedback (Figure 3B). Based on this feedback, the teachers could except this representation of their beliefs or change the positioning of the selected pupil, by simply right-clicking on another “puppet.” When moving from one scale to the next, an orange box was shown for the selected pupil around the “puppets” that would lead to a consistent positioning with respect to the previous choice of position (Figure 3C). In the paper version, teachers could simply write the pupil code above the puppet of choice. The interactive elements of the digital version (i.e., the Beta distribution and orange box) were absent in the paper-based version. Note that after completion of step 5, all the ingredients are present for the construction of a prior.
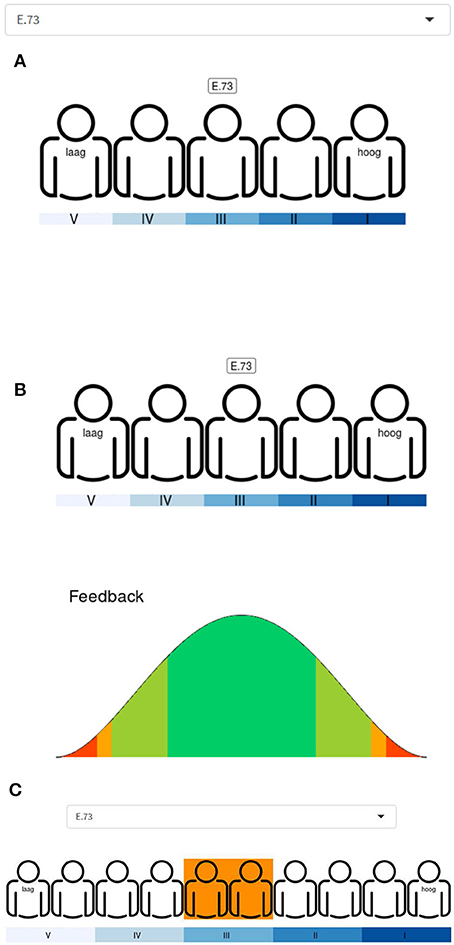
Figure 3. Screenshots of the digital elicitation instrument. (A) illustrates the positioning of the pupil code “E.73” on a 1–5 scale; (B) shows the digital feedback for the chosen position of “E.73” and (C) shows which positions on the 1–10 scale would be consistent with the chosen position for “E.73” in (A). Icon created by Tommy Lau from the Noun Project (https://thenounproject.com/).
Step 6. After the teacher positioned all of his pupils, he/she moved on to the final step: answering “check” questions. In this step, teachers either selected (digital version) or wrote down (paper version) two student codes that were, according to the teachers, closest and furthests apart in terms of math ability. The answers to these questions are later on used to assess construct validity.
After completing all steps of the elicitation procedure described above, the result of the elicitation can be visualized as in Figure 4A. In one glance, the teacher can see his or her judgments (the peak of the distributions), how confident he/she is in these judgments (the width of the distribution) and how his/her judgments and judgment confidence differ over pupils. Now that it is visualized, these judgments can easily be shared with others, such as colleague teachers, the headmaster, parents, etc.
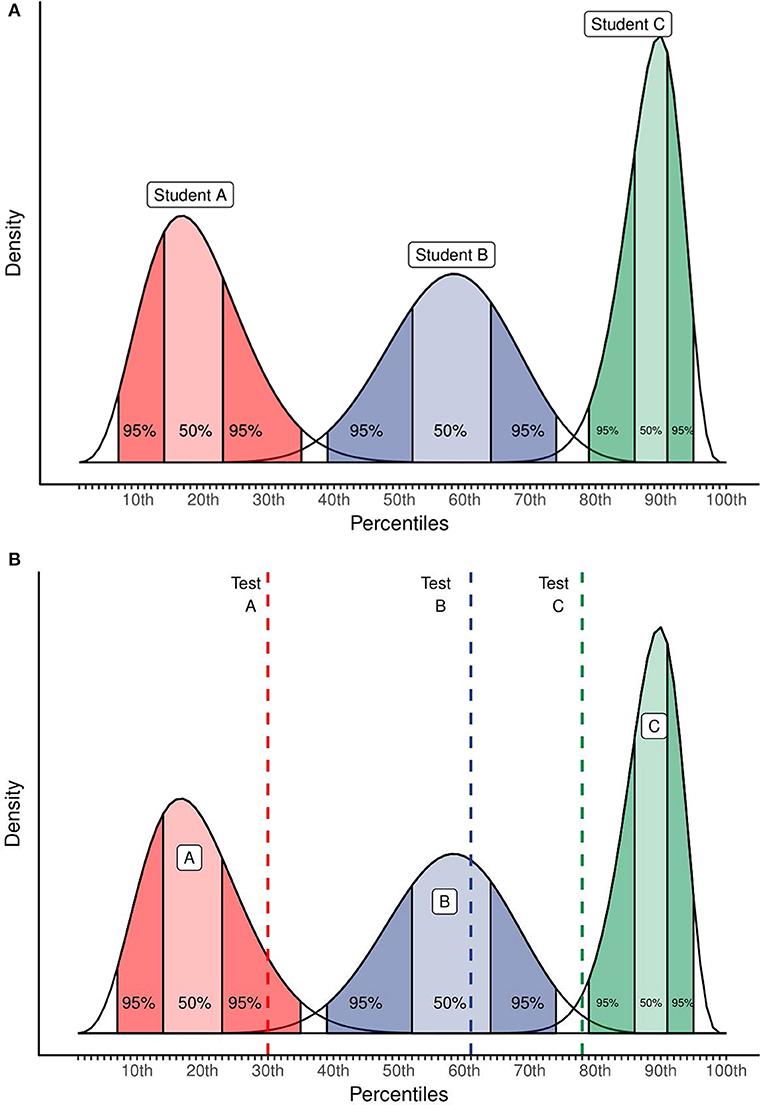
Figure 4. Hypothetical example of the result of the expert elicitation. In (A) and (B), Each distribution is for one specific pupil. (B) Adds the result of a test as reference, visualized by the dotted lines.
According to Pit-Ten Cate et al. (2014), two promising ways of improving teachers' judgment accuracy and hence their diagnostic competence are to raise awareness of their judgments and to increase accountability. As explained in Pit-Ten Cate et al. (2014), raising awareness and accountability boost teachers' motivation to be highly accurate. Research has shown that teachers are likely to shift from a generally less-accurate category-based judgment process to the generally more-accurate attribute-based judgment process when their motivation to be accurate is high (see, for instance, Pit-Ten Cate et al., 2014 and Kunda and Spencer, 2003). The idea is that when teachers look at the result of the elicitation and share this result with others, both their awareness of their implicit judgments is raised and their accountability is increased since they (feel the) need to justify their result to others.
Pit-Ten Cate et al. (2014) (also see Wahl et al., 2007) also stress the importance of comparing teachers' judgments with actual student achievement and showing possible discrepancies to the teachers as feedback. The result of the elicitation makes it fairly easy to make such a comparison, as visualized in Figure 4B. The discrepancy between judgment and actual achievement can be used, for instance, to find sources of errors and to test implicit hypotheses and judgments teachers have.
To test the usability of our elicitation method/procedure in practice, we first conducted a pilot test with two primary school teachers from the personal network of the first author, using the digital version of the elicitation instrument. Thereafter, we organized two expert meetings in which primary school teachers were invited to apply the elicitation method to the pupils of their own class(es). The primary school teachers participating in these expert meetings were asked to complete the elicitation procedure once more at home. In this section, specifics of the expert meetings are given. In the next sections, results of these endeavors are discussed, with a focus on measurement properties of the elicitation method/procedure.
Primary school teachers were recruited via social media (i.e., twitter and Facebook). Note that the focus on math ability was not mentioned in the call, to prevent a bias toward teachers with a specific interest in math. Participation of teachers was based on one expert meeting and one home assignment, which were rewarded with 100 euro. Two expert meetings were held (April the 14th and 19th, 2017) to accommodate different agendas.
Twenty-Four primary school teachers elicited prior distributions during both of these expert meetings, for 503 pupils in total. Most of the teachers were female (20 of the 24) and the average age was 30.38 (sd = 8.18; min = 20, max = 55) with an average of 7.88 years of experience (sd = 8.14; min = 0/first year of teaching, max = 34). The teachers taught a variety of classes.
Each of the expert meetings lasted for approximately 2.5 h. During these 2.5 h, teachers received an introduction into the goal of our research. Furthermore, they received a document with instructions for the home assignment, which simply entailed following the steps of the elicitation instrument once more, 2–5 weeks later in order to assess reliability. The most important instruction on this document was to keep the key and use the same student codes for the home assignment. After the introduction, the first author showed the teachers the digital version of the elicitation instrument, step by step. Then, teachers were invited to use the digital elicitation instrument. They were encouraged to follow the steps of the elicitation instrument independently. However, if questions did emerge, the first author was there for assistance. Unfortunately, due to issues with the server, not all teachers could complete the elicitation instrument digitally and had to switch to the paper version. Specifically, during the expert meetings 3 of the 24 teachers used the digital version whereas for the home assignment all teachers were able to complete the digital version. Upon completion of the elicitation instrument, teachers were asked to fill in an evaluation form. These questions were used to assess face validity and feasibility. During the expert meeting, written informed consent was obtained from all participating teachers. Parent(s)/caretaker(s) of pupils were not asked to sign an informed consent form, since no data of the pupil were collected except for the opinion of teachers.
The result of the expert elicitation is an expert knowledge distribution for every of the 503 pupils, in 24 classes. Here, we discuss the distributions for three of our teachers' classes as an example, using Figure 5. Results of the other classes can be found on the OSF page https://osf.io/hws4m/. In Figure 5A, the distributions are shown for 11 pupils rated by one of our teachers. This teacher made four groups in step 2 of the elicitation procedure: a low math ability group (with pupils “E73” and “U24”), an average math ability group (with “M39,” “R42,” “Q39,” “H35,” and “Z18”), a high math ability group (“Y42” and “B88”) and a group with relatively high math ability pupils (“V56” and “L17”). For this teacher, his (or her) division of pupils in groups corresponds with his elicited distributions as we see a clear separation of the four groups. Interestingly, the teacher is less certain about pupil “V56” and “L17” than about his other pupils. Figure 5B shows the distributions of a teacher with a less clear separation between groups. Possibly, this teacher experienced some difficulty with dividing his pupils into ability groups (in which case the elicitation instrument helps to practice this) or the groups are based on something different than solely math ability. Finally, whereas in Figure 5A,B there is some overlap between all probability distributions, in Figure 5C pupil “Y42” stands completely on its own, indicating that this pupil's math ability is not comparable to any other pupil in this class, at least according to his/her teacher.
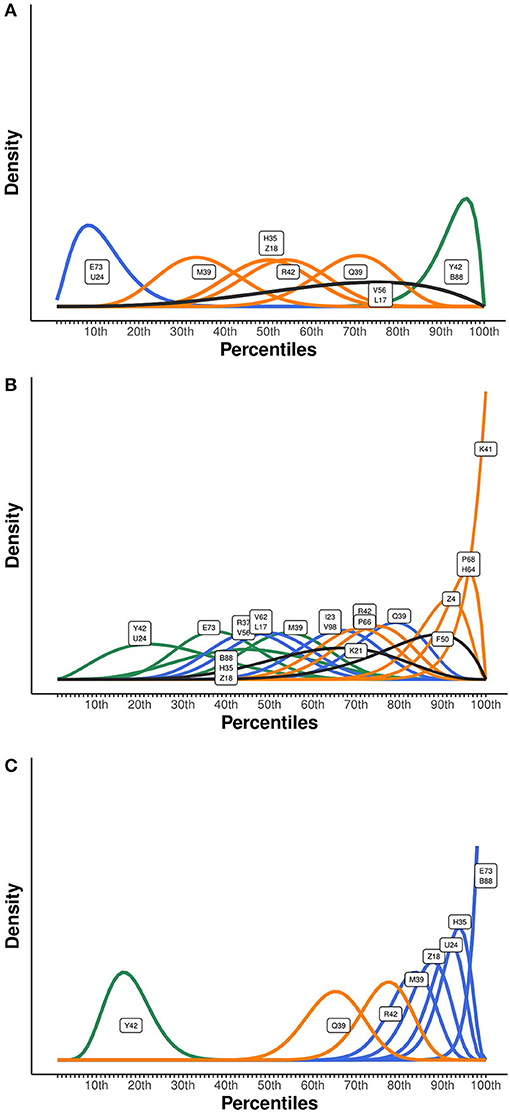
Figure 5. (A–C) show three example classes with elicited probability distributions.
Intra-rater, test-retest reliability of the elicited probability distributions was assessed based on the results of the expert meeting and the home assignment. Twenty-Three out of the Twenty-Four primary school teachers succeeded in completing the home assignment, for 470 out of the 503 pupils. In the assessment of reliability, there were a few unique characteristics of our elicitation method we needed to take into account. First, different teachers can choose different scales to rate their pupils on and it is possible that teachers use a different scale for a certain pupil at the expert meeting and at the home assignment (see Table 1). Second, for our elicitation method, an estimate of reliability for every teacher or even every pupil separately would be most informative, rather than a single reliability coefficient. Third, in the assessment of reliability we need to keep in mind that the result of the elicitation is a distribution instead of a single value.
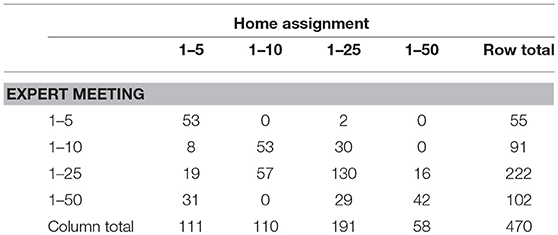
Table 1. Scale chosen during the expert meeting and the home assignment.
To take all these characteristics into account, we decided to use two ways of assessing reliability. First, we estimated a Cohen's Kappa adjusted for the interval/ordinal nature of the positions chosen by the teachers (κA; formula 22 in Gwet, 2008; also see Janson and Olsson, 2001). The advantages of this Cohen's Kappa are that it can be calculated for every teacher separately and that it has known cut-off values that aid interpretation. A disadvantage is that it, like other common measures of reliability, ignores the fact that the elicited positions describe distributions (Johnson et al., 2010a). Another disadvantage is that it is unsuited for the scenario of different scales for the pupils of one teacher and discrepancies in scale chosen at the expert meeting and the home assignment. To deal with the latter disadvantage, the κA estimate is based on the highest scale on which all of the teacher's pupils were rated.
Second, we calculated the overlap between the resulting Beta distribution at the expert meeting and the resulting Beta distribution at home for every pupil, using the Hellinger Distance (HD; see Nikulin, 2001), which takes into account that the result of the elicitation is a distribution. This HD can be estimated for every teacher and for every pupil separately. Furthermore, the HD can be estimated even when teachers choose a different scale at the expert meeting and home assignment. A downfall is that there are no guidelines for the HD as an indicator of reliability. To ease interpretation, part I of the Supplementary Material visualizes the size of the HD for different chosen positions at the expert meeting and home assignment.
Overall, the Kappa coefficients and the Hellinger distances indicate satisfactory reliability. The resulting Kappa coefficients are high for 20 of the teachers (minimum = 0.75, maximum = 1.00, mean = 0.89) but low for 3 of them (i.e., 0.26, 0.54, 0.50). It is likely that the latter three teachers have not used the pupil coding consistently. Figure 6 illustrates the resulting HD for all pupils. The lower plot shows the HD when the highest scale is used on which a particular pupil is rated at both the expert meeting and at the home assignment. The upper plot shows the HD when different scales at the expert meeting and at the home assignment are taken into account. Here, the distances are generally bigger than at the lower part (mean difference = 0.11) since differences in the variance of the distributions are now taken into account as well. Generally, the HDs are indicative of a reasonable match between the Beta distributions for most of the pupils (in the upper part of Figure 6, 78% of the HDs are above the midpoint of the HD-scale; in the lower part this percentage is 86%).
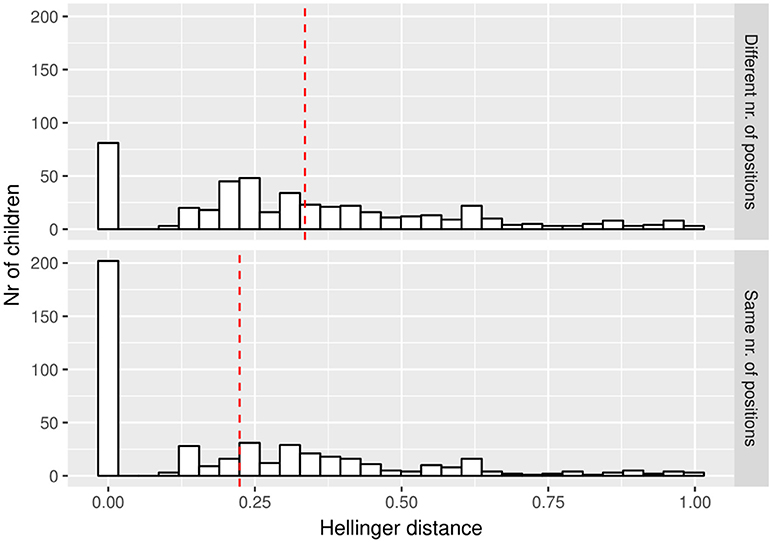
Figure 6. Hellinger distances (HD) for all pupils, when allowing different rating scales (upper part) or not (lower part). The red dashed line indicates the mean HD.
To get an indication of face validity–i.e., the appropriateness, sensibility and relevance of the expert elicitation for teachers (Holden, 2010)—we asked the teachers to rate two statements (in Dutch; statement 1 and 2 in Table 2) and asked to answer two questions (in Dutch; question 3 and 4 in Table 2). The teachers had the following answering options: (1) not at all, (2) not, (3) a little bit, (4) affirmative, (5) totally affirmative. Teachers could provide an explanation for the latter two questions as well. Generally, the answers of the teachers are indicative of a high face validity (all averages above 4; see Table 2). In the explanations, the teachers merely stated that they believed their positions to be an accurate representation of their class (question 3) and that combining these chosen positions with for instance test or observational data would be valuable, in their opinion (question 4). Some examples (translated from Dutch):
“I believe I have mapped my pupils in an accurate way.”
“The image (of my class) is clear and insightful.”
“I believe that another teacher who is unfamiliar with my class, can get a good overview of my class by looking at my positioning.”
“[these steps] make you aware of the choices you make as a teacher about the level of the pupils.”
“ […] the distributions show clearly the position of the pupil without focusing too much on one single position.”
“ this stimulates teachers to think very carefully about the abilities of their pupils without blind trust in test results.”
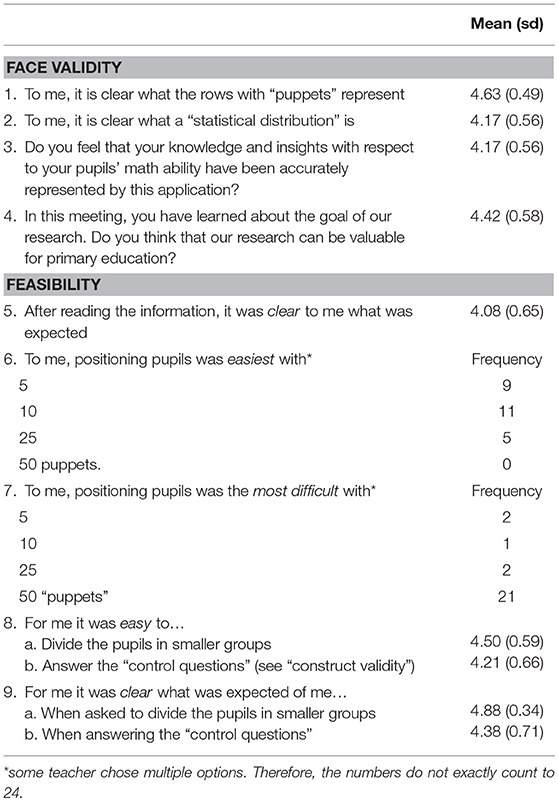
Table 2. Average scores (sd) for face validity and feasibility (n = 24).
To obtain an indication of feasibility or ease of usage (Johnson et al., 2010b), we asked the teachers to rate the ease and clearness of the steps in the application (see questions/statements 5–9, Table 2). With the exception of the sixth and the seventh question, the answering options were again (1) not at all, (2) not, (3) a little bit, (4) affirmative, (5) totally affirmative. Again, feasibility is generally highly rated (all above 4 on average; see Table 2).
To evaluate the construct validity of the elicitation instrument (see Cronbach and Meehl, 1955), at each elicitation occasion, teachers were asked two “check” questions:
• Which two pupils are closest to each other with respect to their mathematical ability?
• Which two pupils are furthest from each other with respect to their mathematical ability?
When the answers on these check questions and the ratings on the position scales did not contradict, this was used as an indication of construct validity. At the expert elicitation meeting, both for question 1 and 2 there was a 95.8% match between the teacher's answers on the control questions and their ratings. This percentage was lower for the elicitation at home: 69.6% (question 1) and 82.6% (question 2; note that for one teacher, scores for this elicitation occasion were missing).
When the control questions and the ratings on the position scales did contradict, this usually indicated a minor contradiction. For question 1, usually two pupils were found who were placed slightly further apart on the position scale(s); see part I of the Supplementary Material, Figures 1 and 2. There were a few exceptions, see Figures 3 and 4 of part II of the Supplementary Material. These larger contradictions are again probably due to inconsistent usage of the anonymous pupil codes.
In addition to the “check” questions, we compared our elicitation method with the trial roulette method (Gore, 1987; also see Goldstein et al., 2008; Johnson et al., 2010b; Goldstein and Rothschild, 2014; Zondervan-Zwijnenburg et al., 2017); a commonly used elicitation method. In our version of this method, teachers were asked to place digital coins on the scale with 25 “puppets,” for two of their pupils. These coins were presented in a hypothetical gamble situation: if you would earn money for correctly estimating the position of a pupil, on which positions would you bet (i.e., place a coin)? The teachers were instructed to place coins on at least 3 positions and were told that they could use as many coins as they liked, knowing that the total value of the coins was 1,000 euros. Thus, with 10 coins the value of one coin would be 100 and their hypothetical profit would be the total value of the 100-coins placed on the correct position. Other than in our elicitation method, for the trial roulette method there is not a one-to-one correspondence between the elicitation and the parametric prior distribution. Instead, the R-package “SHELF” (Oakley, 2017) was used to fit a parametric beta distribution that would reassemble the placed coins as precisely as possible. After completing the trial roulette method, teachers were asked to state whether they thought our elicitation method was easier to comprehend or the trial roulette method.
Eighteen teachers successfully completed the trial roulette method, yielding 36 elicited priors with this method. To compare these priors with the priors resulting from our elicitation method, we again used the Hellinger Distance. As Figure 7 shows, 29 of the Hellinger Distances were at or below the midpoint of the HD-scale, indicating a reasonable agreement between our elicitation method and the trial roulette method. This Figure also showcases a few examples of small, reasonable and exceptional Hellinger Distances (for all distributions see https://osf.io/hws4m/). Seventeen of the Twenty-Four teachers stated to prefer our elicitation method, based on ease of usage. According to these teachers, our elicitation method provided a clearer overview, made it easier to rank order pupils and was easier to complete with a single mouse click. Given this preference and the fact that the trial roulette method would be time consuming to complete for every pupil, our elicitation method seems a feasible alternative.
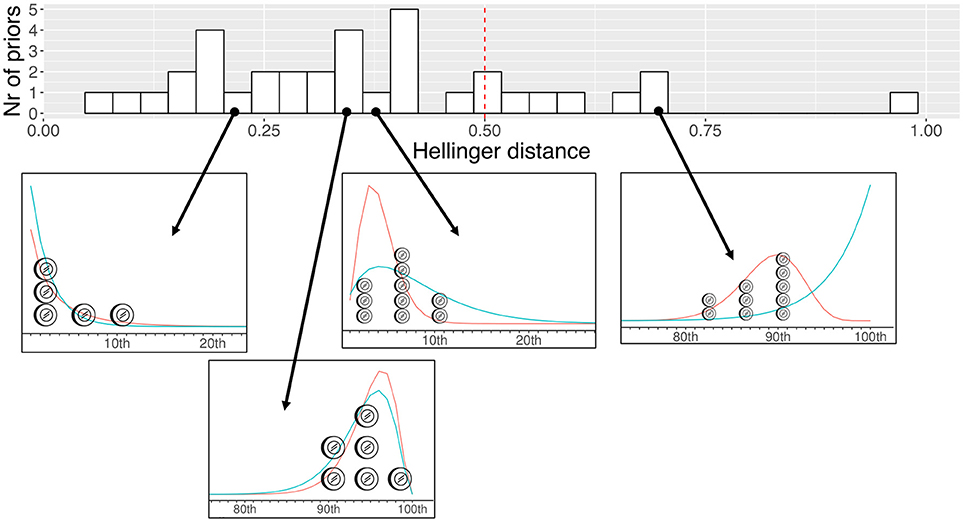
Figure 7. Histogram with Hellinger Distances (n = 36; on top) and four examples of differences between the trial roulette method (coins + in red) and our elicitation method (in blue; bottom). Coin created by Samuel Schoenberg from the Noun Project (https://thenounproject.com/).
In this paper, an easy and intuitive expert elicitation method is discussed which is suitable to be used by elementary school teachers. Specifically, this expert elicitation method can be used by teachers to quantify their insights regarding the math ability (or any other ability) of their pupils. In essence, the elicitation method entails the placement of pupils on a scale with “puppets” (see Figure 1), representing a proportion of pupils. The scale the teachers choose determines the width of the resulting Beta prior. The position of the pupil on this scale determines the prior's mean.
Following the recommendations of Johnson et al. (2010a), we extensively evaluated the reliability and validity of the expert elicitation method. The results are promising: all measures of reliability, feasibility, face validity, and construct validity show positive results. One of the additional challenges of this paper was to create an elicitation instrument that could be applied reliably in educational practice without the assistance/presence of a researcher. Generally, the elicitation tool discussed in the current paper meets this challenge. We did, however, notice some differences between the results of the expert meeting (with assistance of a researcher) and the results of the home assignment (without assistance of a researcher). For example, the percentages correspondence between the check questions and the ratings (see section Construct Validity) were lower for the home assignment than at the expert meeting, which might indicate sloppiness. Additionally, teachers tended to choose more detailed scales in the expert meeting than at home (see Table 1), which might indicate sloppiness or decreased motivation. Whatever the reason may be, when teachers stop at a relatively coarse scale, the resulting prior has less of an influence. In this way, the step-by-step procedure protects the teachers from allocating too much confidence to elicited positions that they have invested relatively little time in.
There are some limitations that should be taken into account when using the expert elicitation method. First, the simplicity and ease of usage of the elicitation instrument come at the expense of some flexibility. Since there are only four scales to choose from (Figure 1), the resulting Beta distribution can only take a limited set of variances/widths. In this study, we however found no indication that teachers wanted to use a coarser or more fine-grained scale which was not available. During a discussion at the end of the expert meeting, the teachers stated that they felt at least certain enough to place their pupils on a 1-5 scale, indicating that a coarser scale was not necessary. Additionally, when asked whether teachers would consider a scale from 1 to 100, only 3 of the 24 teachers said “yes,” indicating that the given scale options were generally sufficient.
Another way in which flexibility is limited is the type of distribution. With our elicitation instrument, only a Beta distribution can be elicited. The advantage of the Beta distribution is that it is a standard distribution that is well-understood, convenient and relatively easy to work with (O'Hagan et al., 2006), with a rather flexible form and an intuitive interpretation with respect to the scales in Figure 1. A downfall may be that a Beta distribution always has a peak, meaning that a teacher cannot express that two or more positions are equally likely for a certain pupil. But, as a partial justification of the Beta distribution, O'Hagan et al. (2006) state: “[…] experience indicates that people's knowledge about uncertain quantities is usually well represented by smooth unimodal densities.”
As mentioned under “Design,” not all teachers could complete the elicitation procedure using the digital version of the elicitation instrument. Although we tried to make the paper and pencil and digital version as comparable as possible (see “Elicitation procedure”), there is one important difference between the two: the paper and pencil version lacks the interactive elements of the digital one. This difference might affect the chosen positions and scale (see Figure 1). Unfortunately, we were not able to assess whether the use of the digital vs. the paper and pencil version has influenced the elicitation results. Since all teachers used the digital version for the home assignment and the majority of the teachers used the paper and pencil version at the expert meeting, any difference between the expert meeting and home assignment could be caused by the different modes (digital vs. paper and pencil) or different settings. Future research is needed to assess the consequences of the interactive elements of the digital version for the elicitation results.
The limitations notwithstanding, our elicitation method can have some clear advantages when applied in elementary school setting, both with and without (test) data. Without (test) data, the elicitation method can be interesting for feedback- and communication purposes. Figure 5 illustrated this argument. Looking at Figures 5A–C, the rank ordering of the pupils according to the teachers becomes immediately clear. We can also easily see how comparable pupils are—according to the teachers—with regard to math ability by looking at the degree of overlap between the distributions. Additionally, the uncertainty a teacher has regarding the math ability of his/her pupils becomes apparent, looking at the width and height of the distributions. On the evaluation form, one of the questions was whether teachers found the elicitation procedure useful (and why). Teachers were generally very enthusiastic about the elicitation procedure (see Table 1, question 4) and for instance stated that the procedure helps to put their insights and observations on paper in an insightful way. As described before under “Elicitation result,” having these insights on paper helps to raise awareness of teachers' implicit judgments (Pit-Ten Cate et al., 2014). Being aware of their implicit judgments, teachers generally become more motivated to collect data and form judgments in a systematic, deliberate way, especially when their elicitation result shows low confidence (Gabriele and Park, 2016). Having them on paper, some of the teachers also predicted their insights would be taken more seriously (by parents, colleagues, et cetera) instead of being perceived as “gutfeelings.” Others saw possibilities to use the elicitation method for instance when discussing a pupil with a remedial teacher. Another possibility is when multiple teachers teach the same class. In that case, both teachers can elicit a prior for the same pupil and compare the results quantitatively. The elicitation method then provides an easy and time efficient way to detect differences in insights and ideas about pupils. In all these examples, the elicitation result helps to increase (perceived) accountability, since teachers defend their judgments to others (Pit-Ten Cate et al., 2014). Just as raising awareness, raising accountability can lead to a higher motivation to be accurate, leading to generally more accurate teacher judgments (see Kunda and Spencer, 2003).
The elicited distributions can also be compared with collected data, such as observations or test results. Figure 4B illustrated this possibility, for three hypothetical pupils. The hypothetical test results of these pupils are visualized with a dashed line and the dark and lighter colored areas respectively show the 95% and the 50% credible interval (i.e., the Bayesian version of a confidence interval, see van de Schoot et al., 2013) of the hypothetical probability distributions as formulated by the teacher(s). In this hypothetical example, the teacher insights and the test result correspond for the pupil in the middle (i.e., the test result falls nicely within the 50% area). This correspondence confirms the insights of the teacher and he or she might want to specify a more peaked probability distribution next time, indicating his or her increased certainty. For the pupil at the right side, the test result is notably lower than what the teacher would expect. This discrepancy might indicate that the teacher overestimates this pupil's math ability or that the test underestimates the pupil (or a combination of both). Figure 4B can in this case be used as a starting point to formally assess what caused the discrepancy between teacher and test. Finally, for the pupil at the left side of Figure 7, there is somewhat correspondence between the teacher and the test (i.e., the test result falls within the 95% area). Based on Figure 7, the teacher can start to investigate whether the relatively high test result is a random, to be expected flucutation or that this pupil might be capable of more than the teacher expects. According to Pit-Ten Cate et al. (2014), this deliberate comparison of teacher judgments with test results is another promising way of improving teacher judgment accuracy.
Now that we have created an elicitation procedure that is intuitive, easy to work with, reliable and valid, future research can start to explore all of the stated possibilities above. An interesting question, for instance, is how exactly the expert elicitation method can foster teachers' diagnostic competence. In order to answer this question, we need to understand which cognitive processes underlie teachers' ability to form accurate judgments. Promising work in this area is done by Herppich et al. (2017). From a statistical perspective, we want to investigate further how ideas of the teachers can be combined and contrasted with test data, using Bayesian statistics. Furthermore, we think it is interesting to find characteristics of the pupil(s), class, teacher(s) and/or school that influence the discrepancies found between the test data and the teacher judgments. This can be done in a quantitative way—using Bayesian multilevel analysis (see for instance Praetorius et al., 2017)—but also qualitatively, asking the teachers to comment on any discrepancies found. All in all, we believe the elicitation procedure opens up many opportunities to investigate tacit differences between “subjective” teacher judgments and “objective” data such as test results and to raise the diagnostic competence of teachers.
KL was responsible for writing the manuscript, in close collaboration with RVDS. RVDS provided feedback on every version of the manuscript. Weekly meetings/discussions between KL and RVDS led to the method described in the manuscript. The expert meetings were held and organized by KL; she was also responsible for the communication (via mail, mostly) with teachers.
The first author is supported by a NWO-talent grant (406-15-062); the last author with a NWO-VIDI grant (452-14-006).
The authors declare that the research was conducted in the absence of any commercial or financial relationships that could be construed as a potential conflict of interest.
The Supplementary Material for this article can be found online at: https://www.frontiersin.org/articles/10.3389/feduc.2018.00082/full#supplementary-material
1. ^Expert' here simply refers to the “person whose knowledge is to be elicited” (O'Hagan et al., 2006, p. 9).
2. ^Specifically, we created a list of random student codes. Every teacher got as many of these codes as they had pupils in their class, starting with the first student code of the list, then the second, et cetera. The student codes of different teachers thus overlapped, avoiding a link between certain student codes and specific teachers.
Artelt, C., and Rausch, T. (2014). “Accuracy of teacher judgment,” in Teachers' Professional Development, eds S. Krolak-Schwerdt, S. Glock, and M. Böhmer (Rotterdam: Sense Publishers), 27–43.
Baumert, J., and Kunter, M. (2013). “The COACTIV model of teachers' professional competence,” in Cognitive Activation in the Mathematics Classroom and Professional Competence of Teachers: Results From the COACTIV Project, eds M. Kunter, J. Baumert, W. Blum, U. Klusmann, S. Kruss, M. Neubrand, et al. (New York, NY: Springer), 25–48.
Bier, V. (2004). Implications of the research on expert overconfidence and dependence. Reliability Eng. Syst. Safety 85, 321–329. doi: 10.1016/j.ress.2004.03.020
Boudett, K. P., City, E. A., and Murnane, R. J. (2013). Data Wise: A Step by Step Guide to Using Assessment Results to Improve Teaching and Learning. Cambridge, MA: Harvard Education Press.
Chang, W., Cheng, J., Allaire, J. J., Xie, Y., and McPherson, J. (2017). Shiny: Web Application Framework for R. R package Version 1.0.5. Available online at: https://CRAN.R-project.org/package=shiny
Clemen, R. T., and Reilly, T. (2001). Making Hard Decisions With Decision Tools. Pacific Grove, CA: Duxbury Press.
Clemen, R. T., and Winkler, R. L. (1999). Combining probability distributions from experts in risk analysis. Risk Analysis 19, 187–203. doi: 10.1111/j.1539-6924.1999.tb00399.x
Crawford, J. R., and Garthwaite, P. H. (2009). Percentiles please: the case for expressing neuropsychological test scores and accompanying confidence limits as percentile ranks. Clin. Neuropsychol. 23, 193–204. doi: 10.1080/13854040801968450
Creighton, T. B. (2007). School and Data: The Educator's Guide for Using Data to Improve Decision Making. London: Sage.
Cronbach, L. J., and Meehl, P. E. (1955). Construct validity in psychological tests. Psychol. Bull. 52, 281–302. doi: 10.1037/h0040957
Edlmann, K., Bensabat, J., Niemi, A., Haszeldine, R. S., and McDermott, C. I. (2016). Lessons learned from using expert elicitation to identify, assess and rank the potential leakage scenarios at the Heletz pilot CO2 injection site. Int. J. Greenhouse Gas Control 49, 473–487. doi: 10.1016/j.ijggc.2016.02.018
Espin, C. A., Wayman, M. M., Deno, S. L., McMaster, K. L., and de Rooij, M. (2017). Data-based decision making: developing a method for capturing teachers' understanding of CBM graphs. Learn. Disabil. Res. Prac. 32, 8–21. doi: 10.1111/ldrp.12123
Evans, J. S. (2008). Dual-processing accounts for reasoning, judgment, and social cognition. Ann. Rev. Psychol. 59, 255–278. doi: 10.1146/annurev.psych.59.103006.093629
Gabriele, A. J., and Park, K. H. (2016). Elementary mathematics teachers' judgment accuracy and calibration accuracy: do they predict students' mathematics achievement outcomes? Learn. Instruct. 45, 49–60. doi: 10.1016/j.learninstruc.2016.06.008
Goldstein, D. G., Johnson, E. J., and Sharpe, W. F. (2008). Choosing outcomes versus choosing products: consumer-focused retirement investment advice. J. Consum. Res. 35, 440–456. doi: 10.1086/589562
Goldstein, D. G., and Rothschild, D. (2014). Lay understanding of probability distributions. Judgm. Decis. Mak. 9, 1–14.
Goossens, L. H. J., Cooke, R. M., Hale, A. R., and Rodić-Wiersma, L. (2008). Fifteen years of expert judgement at TUDelft. Safety Sci. 46, 234–244. doi: 10.1016/j.ssci.2007.03.002
Gwet, K. L. (ed.). (2008). “Intrarater reliability,”in Wiley Encyclopedia Clinlical Trials. (New York, NY: John Wiley & Sons), 1–14.
Hald, T., Aspinall, W., Devleesschauwer, B., Cooke, R. M., Corrigan, T., Havelaar, A. H., et al. (2016). World health organization estimates of the relative contributions of food to the burden of disease due to selected foodborne hazards: a structured expert elicitation. PLOS Med. 11:e0145839. doi: 10.1371/journal.pone.0145839
Havelaar, A. H., Galindo, A. V., Kurowicka, D., and Cooke, R. M. (2008). Attribution of foodborne pathogens using structured expert elicitation. Foodborne Pathog. Dis. 5, 649–659. doi: 10.1089/fpd.2008.0115
Herppich, S., Praetorius, A.-K., Förster, N., Glogger-Frey, I., Karst, K., Leutner, D., et al. (2017). Teachers' assessment competence: integrating knowledge-, process- and product-oriented approaches into a competence-oriented conceptual model. J. Teach. Teacher Edu. doi: 10.1016/j.tate.2017.12.001
Holden, R. R. (2010). “Face validity,” in Corsini Encyclopedia of Psychology, eds I. B. Weiner and W. E. Craighead (New York, NY: Wiley), 637–638.
Janson, H., and Olsson, U. (2001). A measure of agreement for interval or nominal multivariate observations. Educ. Psychol. Measure. 61, 277–289. doi: 10.1177/00131640121971239
Johnson, S. R., Tomlinson, G. A., Hawker, G. A., Granton, J. T., and Feldman, B. M. (2010a). Methods to elicit beliefs for Bayesian priors: a systematic review. J. Clin. Epidemiol. 63, 355–369. doi: 10.1016/j.jclinepi.2009.06.003
Johnson, S. R., Tomlinson, G. A., Hawker, G. A., Granton, J. T., Grosbein, H. A., and Feldman, B. M. (2010b). A valid and reliable belief elicitation method for Bayesian priors. J. Clin. Epidemiol. 63, 370–383. doi: 10.1016/j.jclinepi.2009.08.005
Kahneman, D., and Frederick, S. (2005). “A model of heuristic judgment,” in Cambridge Handbook Of Thinking And Reasoning, eds J. H. Keith and R. G. Morrison (Cambridge: Cambridge University Press), 267–293.
Kaiser, J., Retelsdorf, J., Südkamp, A., and Möller, J. (2013). Achievement and engagement: how student characteristics influence teacher judgments. Learn. Instruct. 28, 73–84. doi: 10.1016/j.learninstruc.2013.06.001
Kaiser, J., Südkamp, A., and Möller, J. (2017). The effects of student characteristics on teachers' judgment accuracy: disentangling ethnicity, minority status, and achievement. J. Edu. Psychol. 109, 871–888. doi: 10.1037/edu0000156
Kaplan, D., and Depaoli, S. (2013). “Bayesian statistical methods,” in Oxford Handbook of Quantitative Methods, ed T. D. Little (Oxford: Oxford University Press), 407–437.
Kirk, M. D., Pires, S. M., Black, R. E., Caipo, M., Crump, J. A., Devleesschauwer, B., et al. (2015). World health organization estimates of the global and regional disease burden of 22 foodborne bacterial, protozoal and viral diseases 2010: a data synthesis. PLOS Med. 12:e1001921. doi: 10.1371/journal.pmed.1001921
Knol, A. B., Slottje, P., van der Sluijs, J. P., and Lebret, E. (2010). The use of expert elicitation in environmental health impact assessment: a seven step procedure. Environ. Health 9, 1–16. doi: 10.1186/1476-069X-9-19
König, C., and Van De Schoot, R. (2017). Bayesian statistics in educational research–a look at the current state of affairs. Educ. Rev. 70, 486–509. doi: 10.1080/00131911.2017.1350636
Krolak-Schwerdt, S., Böhmer, M., and Gräsel, C. (2012). Leistungsbeurteilung von Schulkindern: welche rolle spielen ziele und expertise der lehrkraft? [Students' achievement judgments: the role of teachers' goals and expertise]. Zeitschrift Entwicklungspsychologie Pädagogische Psychologie 44, 111–122. doi: 10.1026/0049-8637/a000062
Kruschke, J. (2011). Doing Bayesian Data Analysis: A Tutorial Introduction With R. San Diego, CA: Academic Press.
Kunda, Z., and Spencer, S. J. (2003). When do stereotypes come to mind and when do they color judgments? A goal-based theoretical framework for stereotype activation and application. Psychol. Bull. 129, 522–544. doi: 10.1037/0033-2909.129.4.522
Lezak, M. D., Howieson, D. B., Loring, D. W., Hannay, H. J., and Fisher, J. S. (2004). Neuropsychological Assessment, 4th Edn. New York, NY: Oxford University Press.
Lichtenstein, S., Fischhoff, B., and Philips, L. D. (1982). “Calibration of probabilities: the state of the art to 1980,” in Judgment Under Uncertainty: Heuristics and Biases, eds D. Kahneman, P. Slovic, and A. Tversky (Cambridge: Cambridge University Press), 306–334.
Machts, N., Kaiser, J., Schmidt, F. T. C., and Möller, J. (2016). Accuracy of teachers' judgments of students' cognitive abilities: a meta-analysis. Edu. Res. Rev. 19, 85–103. doi: 10.1016/j.edurev.2016.06.003
Mandinach, E. B. (2012). A perfect time for data use: using data-driven decision making to inform practice. Educ. Psychol. 47, 71–85. doi: 10.1080/00461520.2012.667064
Meissel, K., Meyer, F., Yao, E. S., and Rubie-Davies, C. M. (2017). Subjectivity of teacher judgments: exploring student characteristics that influence teacher judgments of student ability. Teach. Teacher Educ. 65, 48–60. doi: 10.1016/j.tate.2017.02.021
Nikulin, M. S. (2001). “Hellinger distance,” in Encyclopedia of Mathematics, ed M. C. U. P. Hazewinkel (Norwell, MA: Kluwer Academic Publishers), 78.
Oakley, J. (2017). SHELF: Tools to Support the Sheffield Elicitation Framework. R Package Version 1.2.3. Available online at: https://CRAN.R-project.org/package=SHELF.
O'Hagan, A., Buck, C. E., Daneshkhah, J. R., Eiser, R., Garthwaite, P. H., Jenkinson, D. J., et al. (2006). Uncertain Judgements: Eliciting Experts' Probabilities. Chichester: Wiley.
Pit-Ten Cate, I., Krolak-Schwerdt, S., Glock, S., and Markova, M. (2014). “Improving teachers' judgments: obtaining change through cognitive processes,” in Teachers' Professional Development, eds S. Krolak-Schwerdt S. Glock, and M. Böhmer (Rotterdam: Sense Publishers), 27–43.
Praetorius, A.-K., Koch, T., Scheunpflug, A., Zeinz, H., and Dresel, M. (2017). Identifying determinants of teachers' judgment (in)accuracy regarding students' school-related motivations using a Bayesian cross-classified multi-level model. Learn. Instruct. 52, 148–160. doi: 10.1016/j.learninstruc.2017.06.003
R Core Team (2017). R: A Language And Environment For Statistical Computing. Vienna: R Foundation for Statistical Computing. Available online at: https://www.R-project.org/
Siegel, J., Gilmore, E. A., Gallagher, N., and Fetter, S. (2017). An expert elicitation of the proliferation resistance of using small modular reactors (SMR) for the expansion of civilian nuclear systems. Risk Anal. 38, 242–254. doi: 10.1111/risa.12861
Singh, G., Sinner, J., Ellis, J., Kandlikar, M., and Halpern, B. S., Satterfield, T. (2017). Mechanisms and risk of cumulative impacts to coastal ecosystem services: an expert elicitation approach. J. Environ. Manag. 199, 229–241. doi: 10.1016/j.jenvman.2017.05.032
Speirs-Bridge, A., Fidler, F., McBride, M., Flander, L., Cumming, G., and Brugman, M. (2010). Reducing overconfidence in the interval judgments of experts. Risk Analysis 30, 512–523. doi: 10.1111/j.1539-6924.2009.01337.x
Südkamp, A., Kaiser, J., and Möller, J. (2012). Accuracy of teachers' judgments of students' academic achievement: a meta-analysis. J. Educ. Psychol. 104, 743–762. doi: 10.1037/a0027627
van de Schoot, R., Kaplan, D., Denissen, J., Asendorpf, J. B., Neyer, F. J., and van Aken, M. A. G. (2013). A gentle introduction to Bayesian analysis: applications to developmental research. Child Dev. 85, 842–860. doi: 10.1111/cdev.12169
Van Den Bosch, R. M., Espin, C. A., Chung, S., and Saab, N. (2017). Data-based decision making: teachers' comprehension of curriculum-based measurement progress-monitoring graphs. Learn. Disabil. Res. Prac. 32, 46–60. doi: 10.1111/ldrp.12122
Vanlommel, K., Van Gasse, R., Vanhoof, J., and Van Petegem, P. (2018). Teachers' high-stakes decision making. How teaching approaches affect rational and intuitive data collection. Teach. Teacher Educ. 71, 108–119. doi: 10.1016/j.tate.2017.12.011
Wahl, D., Weinert, F. E., and Huber, G. L. (2007). Psychologie für Die Schulpraxis [Psychology in School], 2nd Edn. Belm-Vehrte: Sozio-Publishing.
Winkler, R. L. (1967). The assessment of prior distributions in Bayesian analysis. J. Am. Statist. Assoc. 62, 776–880. doi: 10.1080/01621459.1967.10500894
Keywords: expert elicitation, Bayesian statistics, educational practice, prior, Bayesian updating, teacher's diagnostic competence
Citation: Lek K and Van De Schoot R (2018) Development and Evaluation of a Digital Expert Elicitation Method Aimed at Fostering Elementary School Teachers' Diagnostic Competence. Front. Educ. 3:82. doi: 10.3389/feduc.2018.00082
Received: 05 June 2018; Accepted: 04 September 2018;
Published: 27 September 2018.
Edited by:
Luiz Sanches Neto, Universidade Federal do Ceará, BrazilReviewed by:
Elisabete Dos Santos Freire, Universidade São Judas Tadeu, BrazilCopyright © 2018 Lek and Van De Schoot. This is an open-access article distributed under the terms of the Creative Commons Attribution License (CC BY). The use, distribution or reproduction in other forums is permitted, provided the original author(s) and the copyright owner(s) are credited and that the original publication in this journal is cited, in accordance with accepted academic practice. No use, distribution or reproduction is permitted which does not comply with these terms.
*Correspondence: Kimberley Lek, ay5tLmxla0B1dS5ubA==
Disclaimer: All claims expressed in this article are solely those of the authors and do not necessarily represent those of their affiliated organizations, or those of the publisher, the editors and the reviewers. Any product that may be evaluated in this article or claim that may be made by its manufacturer is not guaranteed or endorsed by the publisher.
Research integrity at Frontiers
Learn more about the work of our research integrity team to safeguard the quality of each article we publish.