 Yoav Cohen
94% of researchers rate our articles as excellent or good
Learn more about the work of our research integrity team to safeguard the quality of each article we publish.
Find out more
ORIGINAL RESEARCH article
Front. Educ., 22 September 2017
Sec. Assessment, Testing and Applied Measurement
Volume 2 - 2017 | https://doi.org/10.3389/feduc.2017.00049
The intra-rater reliability in rating essays is usually indexed by the inter-rater correlation. We suggest an alternative method for estimating intra-rater reliability, in the framework of classical test theory, by using the dis-attenuation formula for inter-test correlations. The validity of the method is demonstrated by extensive simulations, and by applying it to an empirical dataset. It is recommended to use this estimation method whenever the emphasis is not on the average intra-reliability of a group of raters, but when the intra-rater reliability of a specific rater is of interest, e.g., when the error-variance component of the scores is of interest in order to estimate true scores.
The rating of essays written as a response to a given prompt is a complex cognitive task that encompasses many subtasks. Reading is of course the main task but also understanding and interpreting the written essay; relating to its assessment context; relating to its cultural context; constructing a theory-of-mind of the writer; conducting comparison processes—with other essays and other writers; and engaging in numerical estimation and decision processes. Each of the subtasks is a source of variability between raters, either due to genuine differences between the raters or to the error inherent in each of the subtasks.
Hence, the great diversity among raters, even after they have undergone a long training period; a diversity that is reflected in the final numerical ratings. Raters differ in their leniency/strictness, in their tendency to use (or not) the full range of the rating scale, and in the consistency in which they rate the essays (e.g., as captured by the Hierarchical Rater Model, Patz et al., 2002).
In this paper, I concentrate on the question of the consistency of ratings within each rater–known as intra-rater reliability. Ideally, intra-rater reliability is estimated by having the rater read and evaluate each paper more than once. In practice, however, this is seldom implemented, both because of its cost and because the two readings of the same essay by the same rater cannot be considered as genuinely independent. The approach taken in this work is based on the conception of reliability in classical test theory. The discussion of rating reliability is cast in the context of essays in an admissions test for higher education, but it is, of course, not limited to this situation. It applies in every situation that calls for human rating, be it in the context of K-12 writing, or in the context of open-ended questions, for which there are agreed-upon scoring rubrics. The purpose of this paper is to suggest a simple way to estimate intra-rater reliability and to test its adequacy using both simulated and real data.
I will first present a short discussion of essays as parallel and equivalent tests, and then suggest a way to estimate the intra-rater reliability. This is done by basing it on the long-standing formula for dis-attenuating inter-test correlations, rather than basing it on inter-rater correlations. I will then discuss the numerical relation between two ways of estimating intra-rater reliability and demonstrate the validity of the suggested method by (1) conducting a series of simulations and (2) by applying it to an empirical dataset.
In high-stakes testing programs that include writing essays among the various tasks that are measured, a standard procedure is to have two or more raters read and evaluate each of the essays. Thus, each rater can be considered as a parallel form on which the examinee is measured.
The correlation between ratings given by any two raters who read the same group of essays is usually considered as one type of inter-rater reliability estimate [called the standardized inter-rater coefficient by Brennan (2001)].
Most studies of rating behavior report inter-rater reliability. The following, however, is a discussion of intra-rater reliability. This type of reliability can be thought of as the test–retest reliability of a single test-form. It is most commonly reported in the medical literature but is seldom reported in the context of psychological or educational research. Jonsson and Svingby (2007), for example, note that in their data base of 75 studies, only 7 studies report intra-rater reliability (consistency of the ratings), while the majority of the studies report measures of inter-rater (consensus) reliability.
Intra-rater reliability can be reported as a single index for a whole assessment project or for each of the raters in isolation. In the latter case, it is usually reported using Cohen’s kappa statistic, or as a correlation coefficient between two readings of the same set of essays [cf. Shohamy et al. (1992) for an example of a study of individual measures of intra-rater reliability]. In descriptions of an assessment programs, the intra-rater reliability is indexed by an average of the individual rater reliabilities, by an intra-class-correlation (ICC) or by an index of generalizability of the retesting facet that refer to the whole group of raters but not to individual raters.
Note that in classical test theory, if two forms are considered genuinely parallel, i.e., the correlation between the true scores obtained on the forms is perfect, then their observed intercorrelation is a good estimate of their reliability. In the absence of additional information, this estimate is symmetric, meaning that the two parallel forms have the same reliability. In fact, when defining genuinely parallel forms the requirement is that the two forms have the same first and second moments for both the true scores and the observed scores. Hence, genuinely parallel forms have the same error variance, which implies that they also are equally reliable.
This equivalence of reliabilities, however, cannot be assumed when considering raters. Raters differ in the consistency, accuracy, and precision with which they execute their work (Blok, 1985). A plausible assumption is that some raters are more reliable than others. The raters can, therefore, be considered as essentially tau-equivalent (Lord and Novick, 1968) and may differ in their mean rating and reliability, or even considered as congeneric forms (Joreskog, 1971), in which case they can also differ in terms of their true-score variance.
One way to examine the quality of raters is by looking at their correlations with other raters. Raters who are less consistent or reliable would produce lower correlations with their peers than would those who are more reliable, much like the reduced concurrent validity of a test with low internal reliability. But note that, in analogy with the two-form situation, the estimate is symmetric; i.e., the same estimate of reliability is given to the two raters, even if one of them is, in fact, more reliable than the other. Similarly, the mean inter-rater correlation of a specific rater with her peers is an estimate both of the reliability of the specific rater and that of a hypothetical “mean rater” who represents the peers. Thus, the reliability coefficient of a non-reliable rater estimated in this way will be biased upwards, while the reliability of a “good” rater will be biased downwards, exhibiting a regression to the mean. This kind of reliability can be used to rank-order the raters for purpose of quality control, e.g., in order to exclude or replace the scores given by the lowest ranking raters, but it is not an accurate and direct estimate of the intra-rater reliabilities, and cannot be used for estimating the measurement error of a single rater. Thus, whenever the emphasis is on the measurement error of a single rater in other words, when confidence in the rating is of interest—then a more accurate estimate of intra-rater reliability is required. In situations like this, using the inter-rater reliability may bias the estimate of measurement error upwards or downwards.
The issue of rater errors has been given excellent treatment in the framework of Generalizability Theory (Brennan, 2001), where the effects of multiple sources of rating errors are simultaneously investigated. In this work, we limit the investigation only to one source of measurement error, that which is caused by the inconsistency of each rater by him/herself. The error components of essay topic, genre or prompt, and the inconsistency of the examinee (and not of the rater) in producing responses, are not investigated in this work. Thus, the study is limited to assessment designs in which a collection of essays, all in response to a single prompt, are rated by a group of raters who share the same concept of a “good” essay. In the following discussion, it is assumed that all raters share the same concept of what is a good essay. (This assumption can be tested by factor-analyzing the inter-rater correlation matrix, or by cluster analysis of the proximity matrix among raters; but this is beyond the scope of this paper.) We use classical test theory to estimate the intra-rater reliability, by looking at the inter-rater correlations. Note, that the inter-rater correlations are insensitive to variation of scales among the raters as long as the raters use scales that are linearly related.
We accomplish the estimation by using the method for correcting for attenuation. As stated in almost every book dealing with classical test theory (e.g., Guilford, 1954 Eq. 14.35; Lord and Novick, 1968, Eq. 3.9.6; Haertel, 2006, Eq. 42), the correlation between true scores on two measures can be estimated by dividing the observed correlation between these two measures by the square root of the product of the reliabilities of these two measures; following the notation and formulation of Lord and Novick (1968):
where Tx and Ty are the true scores of x and y, ρ is the correlation coefficient, ρxy is the correlation between the observed scores x and y, and are the reliabilities of x and y.
There are various ways in which a true score can be defined (cf. Lord and Novick, 1968). For the following discussion, we will follow Haertel (2006) in defining a true score of an essay as “the rating dictated by the rubric,” and thus assume that the correlation between the true ratings given by any two raters (who share the same concept) is perfect [i.e., ρ (Tx, Ty) = 1.0]. Then Eq. 1 can be rewritten as
In practice, we observe only ρxy, so the equation involves two unknowns and cannot be solved. But if we look at three correlations: r12, r13, and r23 (adopting from now on a notation of r′s instead of ρ′s) we can write a system of three equations with three unknowns (rxx denotes the reliability of measure x, while rxy denotes the correlation between x and y):
The positive-valued solutions for the three unknowns are
or, in general, for any i ≠ j ≠ k:
This is actually the estimate of the communality of variable i in the factor analysis of the corresponding 3 × 3 unidimensional correlation matrix (cf. Harman, 1976, Eq. 5.7). As mentioned earlier, we assumed here that the correlation between the true scores of two raters is perfect. We could also assume that each rater has a unique and specific component in his/her rating, akin to the specific factors in Guilford’s theory of intelligence. But had we assumed a lower correlation v, among the raters, the estimates of the intra-rater reliabilities, spelled out in Eq. 4, would have been higher. For example instead of r11 = r12r13/r23, it would equal r12r13/(v r23) where v is smaller than 1. So assuming that the true intercorrelation between raters is 1.0, leads to conservative estimates of the intra-rater reliability.
The next section discusses the relation between two types of intra-reliability estimates. The first type is based on the dis-attenuation formula as described above, termed “dis-attenuation formula,” DAF for short; the second is the traditional reliability estimate—based on the “mean inter-rater correlation,” or MIC for short. While the inter-rater correlation indexes the consensus between raters, it is sometimes used indirectly to index the intra-rater reliability, since its magnitude is influenced by the intra-rater reliability. The relation between these two estimates, DAF and MIC, is shown with two goals in mind: first, to demonstrate the bias inherent in MIC estimates and, second, to provide a quick and easy numerical formula for estimating DAF reliabilities on the basis of MIC estimates when the original inter-rater correlation matrix is not available.
Then, a section is presented which describes the simulations that were conducted in order to test the feasibility of the DAF solution for estimating the intra-rater reliabilities of a group of raters, and in order to evaluate the accuracy of the method in the presence of sampling errors.
Lastly, the application of the DAF estimation method to empirical data will be demonstrated.
Given a set of n rater reliabilities {r11, r22, …, rnn} and assuming that the true inter-rater correlations are 1.0, we can generate the nXn matrix of the expected observed inter-rater correlations C with entries:
Note that the entries in the main diagonal of this matrix are the true reliabilities. The mean of the i'th row entries—excluding the diagonal entry is an MIC estimate of the intra-rater reliability of rater i.
To study the relation between the MIC reliabilities and the true reliabilities, several sets of reliabilities are generated; sets that differ in the number (“set size” or the number of simulated raters) and spread of the reliabilities. The reliabilities in each set are equally spaced, thus representing reliabilities from a uniform distribution. Each set of true reliabilities is a basis for generating a unique inter-rater correlations matrix, which in turn is used for the calculation of the corresponding MIC estimates.
The relation between the true reliabilities and the MIC estimated reliabilities are displayed in Figures 1A,B. In Figure 1A, three sets of rater reliabilities that differ by size (number of raters) are presented. As can be clearly seen, more extreme estimates are also more biased. Reliabilities below the mean of the set are overestimated while those above the mean are underestimated. The bias is larger for smaller sets of reliabilities, but increasing the set-size cannot eliminate the bias. In Figure 1B, three sets of rater reliabilities (each based on three raters) that differ in their range are presented. As is shown, as the range of the true reliabilities becomes narrower, the MIC estimates get higher.
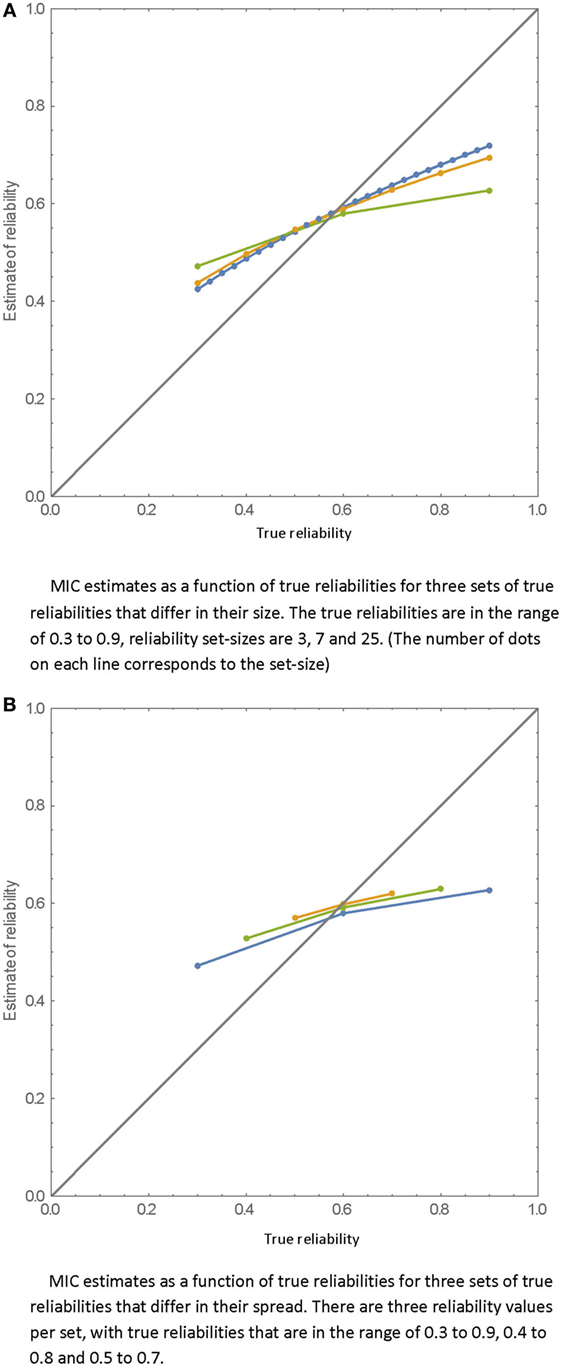
Figure 1. MIC estimates as a function of true reliabilities. (A) MIC estimates as a function of true reliabilities for three sets of true reliabilities that differ in their size. The true reliabilities are in the range of 0.3–0.9, reliability set-sizes are 3, 7, and 25. (The number of dots on each line corresponds to the set-size.) (B) MIC estimates as a function of true reliabilities for three sets of true reliabilities that differ in their spread. There are three reliability values per set, with true reliabilities that are in the range of 0.3–0.9, 0.4–0.8, and 0.5–0.7.
Note that the bias of the estimates is inherent to the definition of the MIC estimates; it is not a result of sampling error since the demonstrated relations are calculated as expectations of the true and the estimated reliabilities.
Suppose that there are n MIC estimates denoted mi (where i = 1, …, n) for a corresponding number of raters, where each MIC estimate is the mean correlation of a specific rater with the other raters, and the researcher is interested in estimating their DAF reliabilities. It is possible to calculate the DAF estimates. In the case of n = 3 raters, when the pairwise correlations are not available, and where mi = (rij + rik)/2, the pairwise correlation (rij) can be found by the identity rij = mi + mj − mk. Then, plugging this expression into Eq. 4 gives
where d1 is the DAF estimate of rater number 1, and the m′s are the three MIC estimates of the three raters. The estimates of d2 and of d3 would be identical except for a change of indices.
If n is greater than 3, then the algebra is not that simple, but a corresponding set of equations can be solved numerically. When n > 3, the following formula can give acceptable estimates of the DAF reliability estimate (d) given the set of n MIC estimates.
where m is the MIC estimate, mean is the mean of the set of MIC estimates, and range is the difference between the minimal and maximal MIC estimates in the set. This regression equation was found by simulation of a wide range of MIC sets, differing in size (5, 7, 9, 11, and 15), location (mean MIC from 0.4 to 0.7), and range (from 0.1 to 0.4). Using this prediction formula, the adjusted R2 between the predicted DAF estimates and the true DAF reliabilities is 0.998. Ninety-six percent of the predicted DAFs fall within ±0.01 of the true value.
The first question to investigate is whether the suggested procedure indeed recovers the intra-rater reliabilities of a group of 15 raters who jointly rated 500 essays. This assessment design deviates markedly from standard rating procedures that seldom employ more than two ratings per essay. The design, however, is not initially meant to emulate reality, but to investigate the soundness of the MIC and DAF estimates in noisy data.
The “true scores” of the 500 essays were generated from a standard (0, 1) normal distribution. Fifteen raters were simulated, assuming different intra-rater reliabilities ranging from 0.55 to 0.97 in increments of 0.03. For each rater, a set of 500 ratings were generated by adding 500 “error” components to the set of 500 essay true scores. The error components were generated from a normal distribution with a mean of 0.0 and a SD denoted by sei of:
where rii is the intra-rater reliability of rater i. Equation 7 is derived from the standard definition of reliability as the ratio of the true score variance to the variance of the total (observed) scores; cf. Eq. 7 in Haertel (2006), with a true-score variance of 1.0.
Thus, we have a set of 500 essay true scores (in response to a single prompt), 15 reliabilities of the raters, and—for each rater—a set of 500 ratings. Note that the expectation of the ratings per rater is 0 and the expectation of the variance of the ratings of rater i is
The 15 × 15 matrix of inter-rater correlations among the 15 raters is presented in Table 1, and is used to recover the original intra-rater reliabilities according to the following procedure: from the set of 15 raters, we can create 455 triads [15!/(12! 3!)]. Each triad is a combination of three different raters, where each rater appears in 91 (14*13/2) of them. So for each rater we can solve the system of equations (Eq. 4) 91 times, and then average the results to get a DAF estimate (and the SD) of the reliabilities.
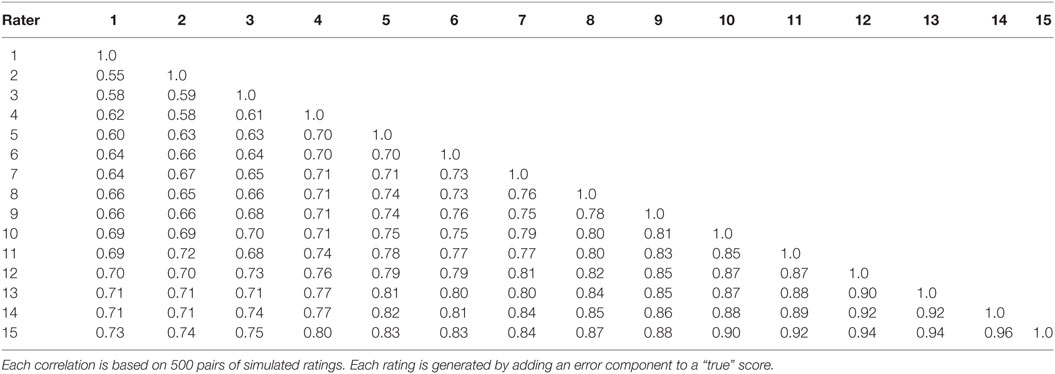
Table 1. Inter-rater correlations for 15 simulated raters.
The true reliabilities and the statistics of the DAF estimates are listed in Table 2. The relation between true reliabilities and the DAF estimates is displayed in Figure 2. The statistics of the DAF estimates need some explanation. Each DAF estimate is based on 91 triads as was explained above; the statistics of the DAF estimates are based on these 91 triads: the mean of the 91 values, their median, SD, minimum and maximum values, and lastly, the skewness of the distribution of the estimates.
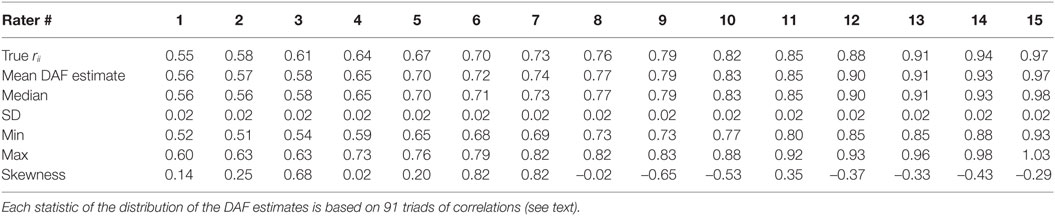
Table 2. True reliabilities and DAF reliability statistics of 15 raters based on 500 ratings per rater.
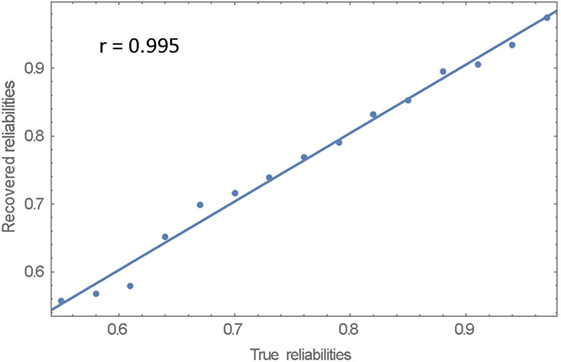
Figure 2. True reliabilities and DAF estimates.
The correlation between the true reliabilities and the DAF estimates is 0.995. The regression line of DAF estimates on true reliabilities and the 15 data points are plotted in Figure 2. The exact equation of the regression line is: −0.002 + 1.009 X, showing that the regression line almost coincides with the identity line. As is evident from Table 2, the SDs of the 91 estimates per rater are 0.02 for all raters; the distributions of the 91 estimates are not symmetric; and there is slight skewness–for low-reliability raters the distributions are positively skewed, while for the high reliability raters they tend to be negatively skewed. The amount of skewness, however, is not marked, as can be seen by comparing the mean and median for each rater.
So the answer to the first question that was posed above is that the intra-rater reliabilities can be recovered successfully and accurately.
A second question is: what is the relation between the true reliabilities and the MIC estimates of reliability? These data are displayed in Table 3; although each MIC estimate is based on 14 values per rater, for purposes of comparison with the DAF estimate statistics, the same 91 triads of raters associated with each rater, are used to calculate local MIC estimates that are the average of the intercorrelations of each specific rater with the two other raters in the triad. These statistics are also presented in Table 3.
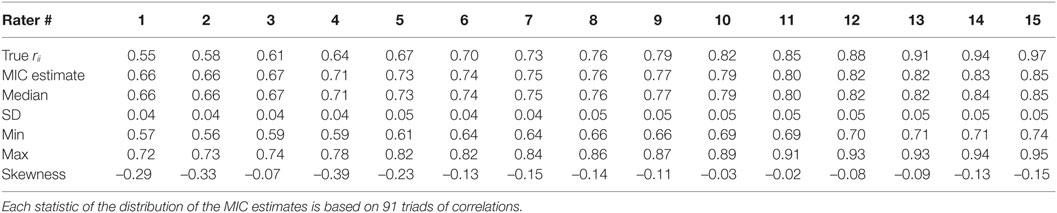
Table 3. True reliabilities and MIC reliability statistics of 15 raters based on 500 ratings per rater.
The correlation between the MIC estimates and the true reliabilities is also very high (r = 0.991), but the slope of the regression line is much shallower (slope = 0.473). As expected, there is overestimation of the low true reliabilities and underestimation of the high true reliabilities. The MIC estimates per rater are negatively skewed at all levels of true reliability and the SDs of the estimates per rater are twice as large as the SDs of the DAF estimates. The MIC and DAF estimates of reliabilities as a function of the true reliabilities are displayed in Figure 3.
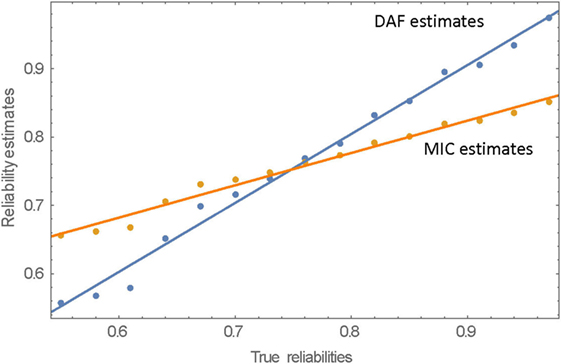
Figure 3. MIC and DAF estimates as a function of true reliability.
Three comments about the estimates:
1. The average MIC estimates per rater that are calculated on the basis of the 91 triads is mathematically identical with the MIC estimate were it calculated as a simple mean of the correlations of each rater with its 14 peers.
2. The DAF estimate of intra-rater reliability for rater i is not statistically independent of the estimate relating to rater j. For any triad of raters i, j, and k, the estimate of rii is based on rij, rik, and on rjk, and the same can be said for the estimates of rjj and of rkk; hence, all three estimates are derived from the same three values. A similar dependency is present in the MIC estimates. There is also a strong dependency between the estimates given by the two methods that relate to the same rater. This is clearly seen in Figure 3, where the signs of the deviations from the regression line for the two types of estimates have, in most cases, the same sign.
3. Each of the DAF estimates is based on a summation of terms, where each term is a product and a ratio involving three correlations (e.g., r11 = r12r13/r23). By contrast, the MIC estimate is based on summation of correlations. It is expected, therefore, that although the DAF estimates are more accurate, they involve larger SEs. This point is investigated in the next section.
In order to look at the expected accuracy of the two types of estimates and their sampling errors, the simulation that was described above was repeated 100 times with the same rater parameters. In each simulation, a different set of essay true scores and a different array of measurement errors for each essayXrater combination were generated by the procedure that was described above.
The averaged results of the 100 replications are presented in Table 4 and in Figure 4 together with their respective SDs, which are the estimates of the SEs of the estimates.
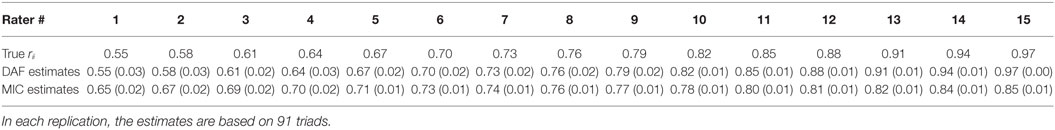
Table 4. Mean reliability estimates and their SEs over 100 replications (SEs in parentheses).
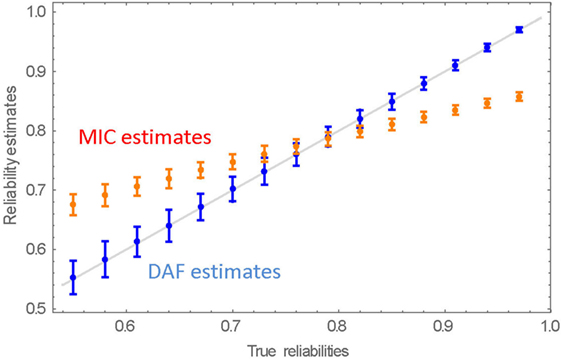
Figure 4. Mean reliability estimates and their SEs over 100 replications. The straight line is the identity (x = y) line.
Evidently, the average DAF estimates are very close to their true values. It is also evident that the reliability estimates of the more reliable raters are more reliable. The MIC estimates deviate from the true reliabilities. They overestimate the lower true intra-rater reliabilities and underestimate those at the high end of the range, as was already demonstrated. In the majority of cases, the SEs of the MIC estimates are, as expected, smaller than the SEs of the DAF estimates. (Note that although Error! Reference source not found. depicts symmetric SEs of the estimates, the actual distribution is negatively skewed).
The results show clearly that the DAF estimates of the reliabilities are very accurate, although their SEs tend to be slightly larger than those of the MIC estimates.
To check the consistency of the data, the recovered intra-rater reliabilities were used for dis-attenuating the observed inter-rater correlations. The model for generating the data assumed that the true intercorrelations between raters are perfect, i.e., rij = 1.0, for all raters i and j. The dis-attenuated inter-rater correlations are shown in Table 5. There are of course deviations from 1.0 (henceforth: “dis-attenuation errors”), and some of the dis-attenuated correlations are greater than 1.0, as can happen due to sampling error (Lord and Novick, 1968). The maximal absolute dis-attenuation error is 0.05, the mean error is 0.0002, and the SD of the dis-attenuation errors (RMSE) is 0.015. Since the SEs of the estimated intra-rater reliabilities are larger for low-reliability raters, as is evident in the data presented in Table 4, the dis-attenuation errors are, on average, larger for the low-reliability raters.
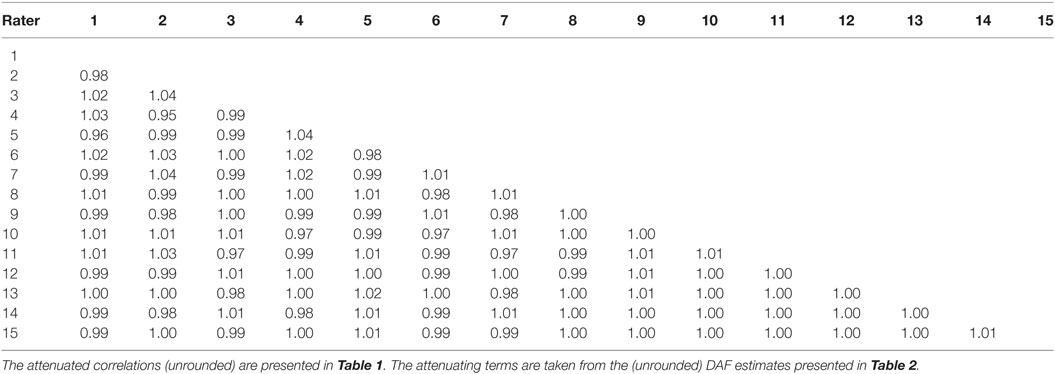
Table 5. Dis-attenuated inter-rater correlations.
We showed that the DAF estimation of intra-rater reliability is quite accurate. This result is not dependent on the particular scale and the intra-rater reliability of the rater, as long as the scales are linearly related. But, as has been noted above, this is based on the assumption that all the raters are indeed evaluating, or measuring, the same construct. If some of the raters are using a similar but not identical construct (a different rating rubric, or a different interpretation of the rubric), then the assumption of perfect correlation between the true scores is not valid anymore. This can happen if, for example, in assessing essays by the holistic method, some raters relate more to the grammatical aspects of the essays, while others put more emphasis on the quality of discourse. Testing programs try to minimize this variability between raters by training and monitoring the rating process (cf. standards 6.8 and 6.9, Standards for Educational and Psychological Testing, AERA, APS, and NCME, 2014), but—knowing what we know about the fallibility of human judgments—this kind of variability cannot be totally avoided. In such a case, if we assume, erroneously, that there is a perfect correlation between the true ratings when in actuality there is not, then some of the intra-rater reliabilities will be underestimated, and the reconstructed inter-rater correlations will be overestimated.
The method for estimating true reliabilities was applied to an empirical dataset (Cohen and Allalouf, 2016). All data used in this study were retrieved from the repository of the testing institution which provided permission to the researchers to use this data. The researchers did not use any identifiable information. An ethics approval was not required for this type of research as per institutional guidelines and national regulations. The data consisted of ratings of 250 essays conducted by 13 well-trained raters. The essays were written by university candidates as part of the Psychometric Entrance Test (PET) which is administered five times a year by the National Institute for Testing and Evaluation (NITE). All the essays were written in response to the same prompt, in a timed (30 min) section of the test, and were randomly selected from a larger pool of 4,236 essays. The raters were instructed to rate the essays on two scales of 1–6. The ratings given on the two scales by each rater to each essay were added up, thus creating ratings on a scale from 2 to 12. The mean essay rating of all 250 essays is 6.87, with a SD of 1.42.
The mean rating for each rater and the corresponding SD are presented in Table 6. Also listed for each rater is the MIC estimate—the mean inter-rater correlation with the other 12 raters. The mean of the mean ratings is 6.87, quite close to the middle of the rating scale (7), and the SD of the means is 0.55. The most severe rater is rater #6 and the most lenient is rater #12. The raters differ also in the spread of ratings. While rater #12 uses a wide range (his/her ratings have a SD of 2.4), rater # 4 has the narrowest spread of ratings (a SD of 1.29, which is almost half of the SD associated with rater # 12). [In many treatments of rating data, the authors assume that raters differ only on the severity/leniency dimension (e.g., Wright and Masters, 1982; Longford, 1994; Brennan, 2001). The present data challenge this assumption.]
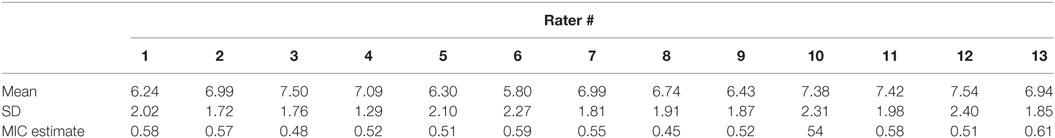
Table 6. Descriptive statistics of the ratings given by individual raters and the MIC estimates of reliabilities, based on ratings of 250 essays.
The inter-rater correlations of the empirical dataset are presented in Table 7. The correlations are quite modest, ranging from 0.33 to 0.72, with a mean of 0.54 and a SD of 0.08.
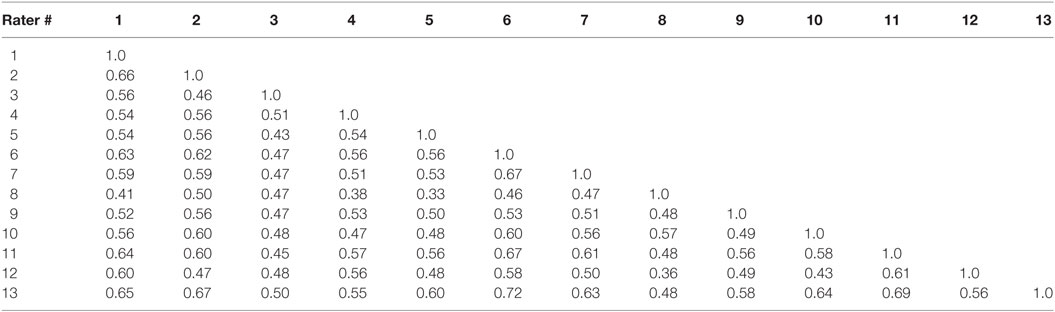
Table 7. Raters’ intercorrelations, based on ratings of 250 essays.
Is the correlation matrix unidimensional? Do the raters adopt a common concept of “what is a good paper”? Cluster analysis does not reveal any distinct clusters of raters. On the other hand, principal component analysis (PCA) reveals at least two PC’s before the knee-point in the scree plot, suggesting that the assumption of unidimensionality (true intercorrelation of 1.0 among all raters) cannot be held. Nevertheless, the DAF estimates of the reliabilities were estimated (by averaging the estimates for each rater as shown in Eq. 4), and are presented in Table 8 together with the MIC reliabilities (the mean intercorrelation of each rater with the other raters).
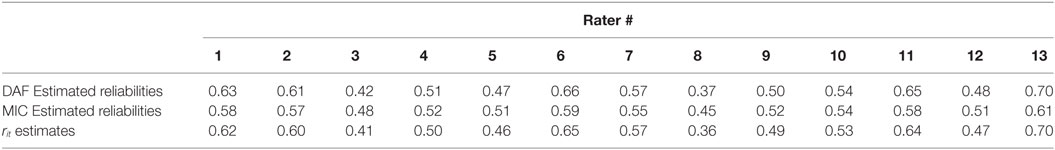
Table 8. Reliability estimates for 13 raters.
The fact that each essay was rated by 13 raters can be used to estimate the reliabilities in yet another way. We can get an estimate of the true score of each essay by averaging all the ratings given to that essay. This is not really a true score, because it involves only a finite number of raters, but it is a close enough estimate. The correlations of the actual ratings with this estimate of true scores are the basis of estimating the intra-rater reliabilities (though this is a slight underestimate due to the imperfect “true” score). A detailed description of this estimate is given in Appendix A. The intra-rater reliabilities that are based on this method are very close to the DAF-estimated reliabilities and, thus, give strong support to the DAF estimates. These estimates are shown in Table 8 and in Figure 5 as “rit estimates.”
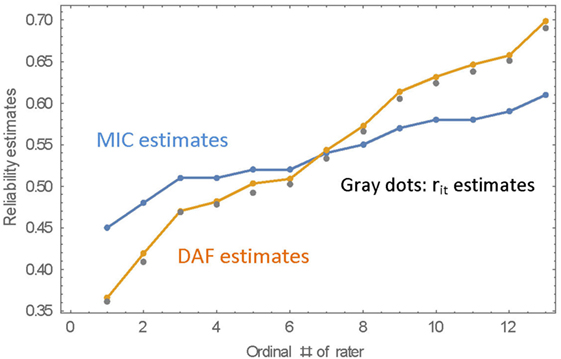
Figure 5. MIC, DAF, and rit reliability estimates for 13 raters. Note that the rater number is the ordinal number of the rater when sorting the raters by the magnitude of the reliability estimate.
The correlation between the DAF reliabilities and the MIC reliabilities is practically 1.0 (r = 0.998), and, as was demonstrated in the simulation studies, the DAF estimates of reliabilities are much more spread out—their range is from 0.37 to 0.70 compared with a range of 0.45–0.61 for the MIC estimates of reliability. The data of Table 8 are presented graphically in Figure 5, where the raters are ordered by magnitude of the MIC estimates. The estimation of intra-rater reliabilities can be further improved by estimating the reliabilities within each cluster of raters separately (where the clusters are found by Hierarchical Cluster Analysis), but this requires research which is beyond the scope of this report.
Hierarchical clustering analysis of the observed inter-rater correlation matrix does not reveal any significant clustering of the raters. When the (DAF) dis-attenuated correlations are analyzed one rater stands out—rater number 8—who apparently adopted a different scoring criteria or just did not do the task as required. Note that this rater would also be singled out by traditional means; he/she is the rater with lowest mean inter-rater correlation. In addition, the analysis reveals two distinct clusters, as can be seen in Figure 6. One cluster includes raters 1, 4, 5, and 12, and the other includes all the others except rater no. 8. However, there is still a large variation (large distances) within each cluster.
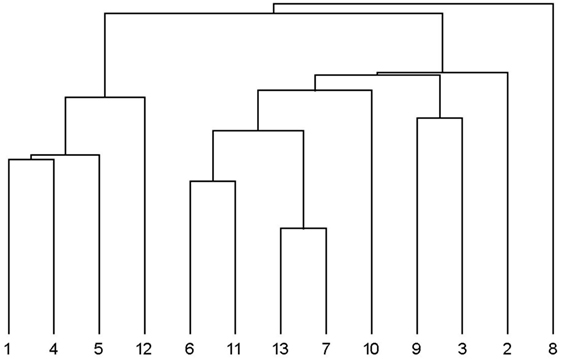
Figure 6. Dendrogram of the DAF dis-attenuated correlation matrix.
To sum up the analysis of the empirical data:
1. The DAF estimates have a greater spread than the MIC estimates, as was demonstrated in the simulations.
2. The DAF estimates are validated by using the correlation with an estimate of the vector of true scores.
3. Dis-attenuating the inter-rater correlations allows separation of the raters into clusters of raters, where the raters in each cluster are relatively homogenous in terms of the criteria that they adopt for marking the essays.
4. Since there is a high ordinal correlation between the MIC and DAF estimates, for the purpose of identifying low performing raters, the two kinds of estimates are interchangeable.
The suggested method for estimating intra-rater reliability in the framework of classical test theory can be of use whenever there is interest in the reliability of a specific rater and not in the reliability of the raters as a group. One application is in setting quality standards for the performance of raters. We have shown that there is perfect ordinal correlation between the DAF and the MIC estimates. So, for identifying the least consistent rater or raters it does not matter whether we use one estimate or the other. But if we want to set numerical criteria for rater performance, an accurate estimate of the intra-rater reliability, or measurement error, is required.
Accurate estimates of intra-rater reliability are also required in the context of calibrating raters. It is a known (and too often disregarded) fact that raters differ in the range of values that they use. While the leniency/severity of raters can be easily corrected by adjusting the means, when it comes to the variability in the spread of ratings, one has to decide what part of the intra-rater variability is due to the spread of the (assumed) true scores, and what can be accounted for by the error component. Since the variance of the ratings within a rater is a sum of the error variance and the variance of the true ratings, simply equating the rating variance across raters may preserve the error component and even magnify it when applied to raters whose ratings have small variance. Adjustment of the variance of the raters has to take into account the true score variance and not the combined error + true score variance. An accurate estimate of the intra-rater reliability can be utilized in order to find the variance of true ratings per rater.
Having a good estimate of the true variance opens the way to differential weighting of raters. Differential weighting may not be acceptable in operational programs, but at least it can be used for research purposes. This point requires further research, as do the other points made here.
In the simulations detailed above, and in the demonstration of applying the procedure to real data, we based the analysis on full matrices of raters X essays. When a full intercorrelation matrix is available, and the matrix is unidimensional, then factor analysis of the matrix yields the intra-rater reliabilities as the estimated communalities, but DAF estimation can be applied also to sparse matrices, where essays are allocated randomly to pairs of raters. The method of DAF estimation is applicable whenever there are triads of raters who share pairwise sets of essays.
However, as we have demonstrated, multidimensionality of the ratings may pose a problem for the DAF estimates. We, therefore, recommend, as an initial step in the analysis of full matrices, to perform dimensionality analysis of the data. This can be done either by cluster analysis of the matrix, or by factor-analytic methods. In the case that the matrix is found to be multidimensional, and the raters can be shown to belong to separate groups (clusters or factors), then the DAF estimates should be estimated separately for each group of raters. This issue should be further studied.2
Lastly, it should be noted that the SEs of DAF estimates are larger than those of the MIC estimates. This is because a MIC estimate involves the sum of correlations while the DAF estimate involves a product and a ratio of correlations. Therefore, the sample size in each situation has to be taken into account when deciding which method to use. This point also needs, of course, further study.
The study of intra-rater reliability usually requires the re-scoring of essays on two separate occasions by the same raters. This procedure involves extra costs and is seldom done in large operational testing programs. It is suggested that a novel way to estimate the intra-rater reliability be incorporated in studies of raters’ behavior. The validity of the method was demonstrated in this study via simulations and by investigation of an empirical dataset. The simulations proved that the method can reconstruct the reliabilities that were used to generate the simulation data quite accurately. Further validation of the method by studying an empirical dataset showed that it is applicable in operational testing programs.
In addition, a concise formula for predicting intra-rater reliabilities from data on inter-rater reliabilities was found by studying several data sets.
We have briefly pointed out certain areas in which the method can be of use, such as the calibration of raters and the differential weighting of raters. Some of the limitations of the method, namely, its dependence on the dimensionality of the data and on sample sizes, were noted. Further research is needed for establishing methods of application to multidimensional matrices of rater intercorrelations and for setting the boundaries on the errors of estimation.
As happens many a time, the solution to one problem—in this case the estimation of intra-rater reliability—leads to a set of new questions. Further research will probably highlight the ways and the contexts in which the suggested method is most useful and applicable.
The study is exempt from consideration of ethics committee because personal data were retrieved anonymously from an operational (registered) data base.
YC conceived, programmed, analyzed, and wrote the paper.
The author declares that the research was conducted in the absence of any commercial or financial relationships that could be construed as a potential conflict of interest.
This paper benefited from fruitful discussions with and comments from A. Allalouf, R. Fortus, N. Gafni, T. Kennet-Cohen, and three reviewers. I thank them all.
AERA, APS, and NCME. (2014). Standards for Educational and Psychological Testing. Washington, DC: AERA.
Blok, H. (1985). Estimating the reliability, validity, and invalidity of essay ratings. J. Educ. Meas. 22, 41–52. doi: 10.1111/j.1745-3984.1985.tb01048.x
Cohen, Y., and Allalouf, A. (2016). Scoring of Essays by Multiple Raters; Procedure and Descriptive Statistics. Technical Report TR-16-02. Jerusalem: NITE.
Haertel, E. H. (2006). “Reliability,” in Educational Measurement. National Council on Measurement in Education & American Council on Education, 4th Edn, ed. R. L. Brennan (Westport, CT: Praeger Publishers), 3.
Jonsson, A., and Svingby, G. (2007). The use of scoring rubrics: reliability, validity and educational consequences. Educ. Res. Rev. 2, 130–144. doi:10.1016/j.edurev.2007.05.002
Joreskog, K. G. (1971). Statistical analysis of sets of congeneric tests. Psychometrika 36, 109–133. doi:10.1007/BF02291393
Longford, N. T. (1994). Reliability of essay rating and score adjustment. J. Educ. Behav. Stat. 19, 171–200. doi:10.2307/1165293
Lord, F. M., and Novick, M. R. (1968). Statistical Theories of Mental Test Scores. London: Addison-Wesley.
Patz, R. J., Junker, B. W., Johnson, M. S., and Mariano, L. T. (2002). The hierarchical rater model for rated test items and its application to large scale educational assessment data. J. Educ. Behav. Stat. 27, 341–384. doi:10.3102/10769986027004341
Shohamy, E., Gordon, C. M., and Kraemer, R. (1992). The effect of raters’ background and training on the reliability of direct writing tests. Mod. Lang. J. 76, 27–33. doi:10.1111/j.1540-4781.1992.tb02574.x
Given data of ratings by multiple raters of multiple essays, the squared correlation of the ratings given by a rater with the true scores of the essays is an estimate of the intra-rater reliability (cf. Lord and Novick, 1968, Eq. 9.1.1).
In practical situations, we do not have information about the true scores, but a good estimate of the true score of an essay is the mean of the multiple ratings of the essay. The vector of these estimates is not perfectly reliable, but it approaches unity as the number of raters grows.
For the case of n raters with an average reliability of rii, the reliability of the true scores that are based on the average or sum of n ratings can be approximated by the generalized version of the Spearman–Brown formula with n and rii. Let us call it rtt.
Let rit be the correlation of the ratings given by rater i with the estimated true scores. When dis-attenuating this correlation by the reliability of rater i and the reliability of the estimated true scores, in the case of a unidimensional inter-rater correlation matrix, we should get a perfect correlation. Hence
It follows that
In the application of this formula as described in this paper, each of the 13 raters was examined separately. The approximation of true scores for the estimation of the intra-rater reliability was based on the ratings given by the other 12 raters. The values 0.54 and 12 were used for estimating rtt by the Spearman–Brown formula.
Keywords: essay rating, classical test theory, inter-rater reliability, intra-rater reliability, performance assessment
Citation: Cohen Y (2017) Estimating the Intra-Rater Reliability of Essay Raters. Front. Educ. 2:49. doi: 10.3389/feduc.2017.00049
Received: 17 May 2017; Accepted: 05 September 2017;
Published: 22 September 2017
Edited by:
Mustafa Asil, University of Otago, New ZealandReviewed by:
Salvador Chacón-Moscoso, University of Seville, SpainCopyright: © 2017 Cohen. This is an open-access article distributed under the terms of the Creative Commons Attribution License (CC BY). The use, distribution or reproduction in other forums is permitted, provided the original author(s) or licensor are credited and that the original publication in this journal is cited, in accordance with accepted academic practice. No use, distribution or reproduction is permitted which does not comply with these terms.
*Correspondence: Yoav Cohen, Y295b2F2QGdtYWlsLmNvbQ==
This paper benefited from fruitful discussions with and comments from A. Allalouf, R. Fortus, N. Gafni, T. Kennet-Cohen, and three anonymous reviewers. I thank them all.
Disclaimer: All claims expressed in this article are solely those of the authors and do not necessarily represent those of their affiliated organizations, or those of the publisher, the editors and the reviewers. Any product that may be evaluated in this article or claim that may be made by its manufacturer is not guaranteed or endorsed by the publisher.
Research integrity at Frontiers
Learn more about the work of our research integrity team to safeguard the quality of each article we publish.